chapter 8: fabrication of dye sensitized solar cell & its
TRANSCRIPT

Chapter 8
Fabrication of Dye
Sensitized Solar Cell &
Its Characterization
Chapter 8: Fabrication of Dye Sensitized Solar Cell & Its Characterization
161
8.1 Introduction
The dye sensitized solar cell (DSSC) is one of the promising organic solar
cells. It is composed of a dye modified wide bandgap semiconductor electrode,
counter electrode and redox electrolyte [1, 2].
The highest efficiency of DSSC has been found to be around 11%. The overall
power conversion efficiency of DSSC is affected by many factors including the
transmittance and the conductivity of the conducting substrate, properties of TiO2
film, type of dye or photosensitizer, the electrolyte composition, and the platinum
electrode [3-9].The platinum layer as a counter electrode and Ruthenium (Ru)
complex as a photosensitizer (dye) are the expensive parts of DSSC. In the present
work, an attempt has been made to replace these expensive parts with low cost and
easily available material. Carbon is coated on conducting plate to use as a counter
electrode instead of platinum and natural dye extracted from pomegranate juice was
used instead of the Ruthenium complex.
The most commonly used dye is a Ruthenium(Ru) complex. Rubipyridyl
complexes have been studied intensively as a photosensitizer for homogeneous
photocatalytic reactions and dye sensitization systems because of its long life times
and long term chemical stability of oxidized Ru (III) [10]. Different Ru complexes
having carboxylic groups as anchors to adsorb on to the semiconductor surface have
been studied [11, 12].The cis-bis(4,4’-dicarboxy-2,2’-bipyridine)dithiocyanato
ruthenium (II) (RuL2(NCS)2 complex), which is referred to as N3 dye or red dye can
absorb over a wide range of the visible regions from 400 to 650 nm. The
trithiocynato 4, 4’4”-tricarboxy-2,2’:6’,2”-terpyridine ruthenium (II) referred to as
Chapter 8: Fabrication of Dye Sensitized Solar Cell & Its Characterization
162
black dye (RuL’(NCS)3 complex), absorbs in the near IR region up to 900 nm.
There are three parameters which photosensitizer should possess [13].
(1) The sensitizer should have extremely high broad band absorption in UV,
Visible, and IR region.
(2) The transfer of electron between the photo-excited sensitizer andphotoanode
must be rapid and energetically favorable.
(3) The photosensitizer should have high photo stability. The material must be
capable of many oxidation-reduction cycles without decomposition.
As Ru metal is rare and expensive, the synthetic complexes of Ru metal based
are very expensive to use as a photosensitizer. Alternatively organic dyes can also be
utilized as a photosensitizer. Organic dyes have been explained in Chapter 2. A ZnO
electrode sensitized by organic dyes including rose Bengal, fluorescein, and
rhodamine B was studied by Gerischer and Tributsch [14, 15]. Organic dyes are
generally extracted from plants. The different colors of plants, flowers, fruits and
leafs are results of production, interaction and breakdown of three classes of
substances: porphyrins, carotenoids, and flavonoids. Organic dyes have several
advantages as photosensitizers:
(1) They have a variety of structures for molecular design,
(2) They are cheaper than metal complexes,
(3) They have large absorption coefficients.
(4) They are obtained from renewable sources.
(5) Practically no or mild reactions are involved in their preparation.
(6) Natural dyes cause no disposal problems, as they are biodegradable.
Chapter 8: Fabrication of Dye Sensitized Solar Cell & Its Characterization
163
In the present work, natural dye extracted from pomegranate juice has been used.
Pomegranate contains anthocyanins. Anthocyanins belong to flavonoid group and
are responsible for most red, blue, and purple colors in plants, flowers and leaves.
The binding of carbonyl and hydroxyl groups to the surface of porous TiO2 film is
the advantage of anthocyanin which causes electron transfer from the anthocyanin
molecule to conduction band of TiO2 [16].
8.2Fabrication of Dye Sensitized Solar cell
8.2.1 Preparation of the TiO2-ZrO2 Electrode
The film of electrode material i.e.TiO2-ZrO2 is usually prepared by one of the
two methods: (1) Doctor Blade Technique, (2) Screen Printing. In the present
work,the film has been prepared by doctor blade technique. The powder was grinded
in an agate mortar with dilute acetic acid for 1 hour. A non-ionic surfactant such as
Triton X -100 is added to prepare mono disperses paste. The obtained paste was
coated on ITO glass plate by glass rod, using adhesive tapes (3M) as spacers. The
films were dried in air at room temperature. Then the coated conducting glass plate
was sintered at 450 °C for 30 min. This film was used as working or photo electrode.
8.2.2 Dye Fixation onto the TiO2-ZrO2 Film
After preparation of TiO2-ZrO2 films, the dye is adsorbed onto the TiO2-ZrO2
surface. In the present work, anthocyanin dye present in pomegranate juice is used
as a sensitizer, as mentioned above. The films are immersed into the dye solution
(pomegranate juice) followed by storage at room temperature for 18 h in dark, so
that it is properly adsorbed on the film. This treatment produces intense coloration of

Chapter 8: Fabrication of Dye Sensitized Solar Cell & Its Characterization
164
the film. Before being used, the film is washed with isopropanol to remove excess
non adsorbed dyes inside the porous TiO2-ZrO2 film.
8.2.3 Redox Electrolyte Preparation
The electrolyte used in DSSC is Iodine solution, which contains I-/I3
- redox ions.
These ions mediate electrons between the photo electrode and the counter electrode.
Br-/Br2 and hydroquinone have been also used as redox electrolyte for DSSC but the
iodine redox electrolyte gives the best performance [17, 18].In the present work, KI
based electrolyte was used. 0.127 gm Iodine (I2) was dissolved in 10 ml of ethylene
glycol. 0.83 gm potassium iodide (KI) was mixed in this solution and stirred for few
minutes and stored in a dark.
8.2.4 Preparation of Counter Electrode
The reduction process between dye cations and I- ions produces tri-iodide I3
-.
Tri-iodide ion reduces to I- at the counter electrode and for this the counter electrode
must have high electro catalytic activity. The most commonly used catalytic material
is platinum [19]. Replacement of expensive platinum counter electrode is challenge
to ensure a low charge transfer resistance and high exchange current densities.
Carbon based materials are also applied as the material for counter electrode but the
efficiencies are found to be lower [20, 21]. In the present work graphite is used for
counter electrode. A thin layer of graphite is coated on conducting plate by pencil.
This plate works as a counter electrode.
Chapter 8: Fabrication of Dye Sensitized Solar Cell & Its Characterization
165
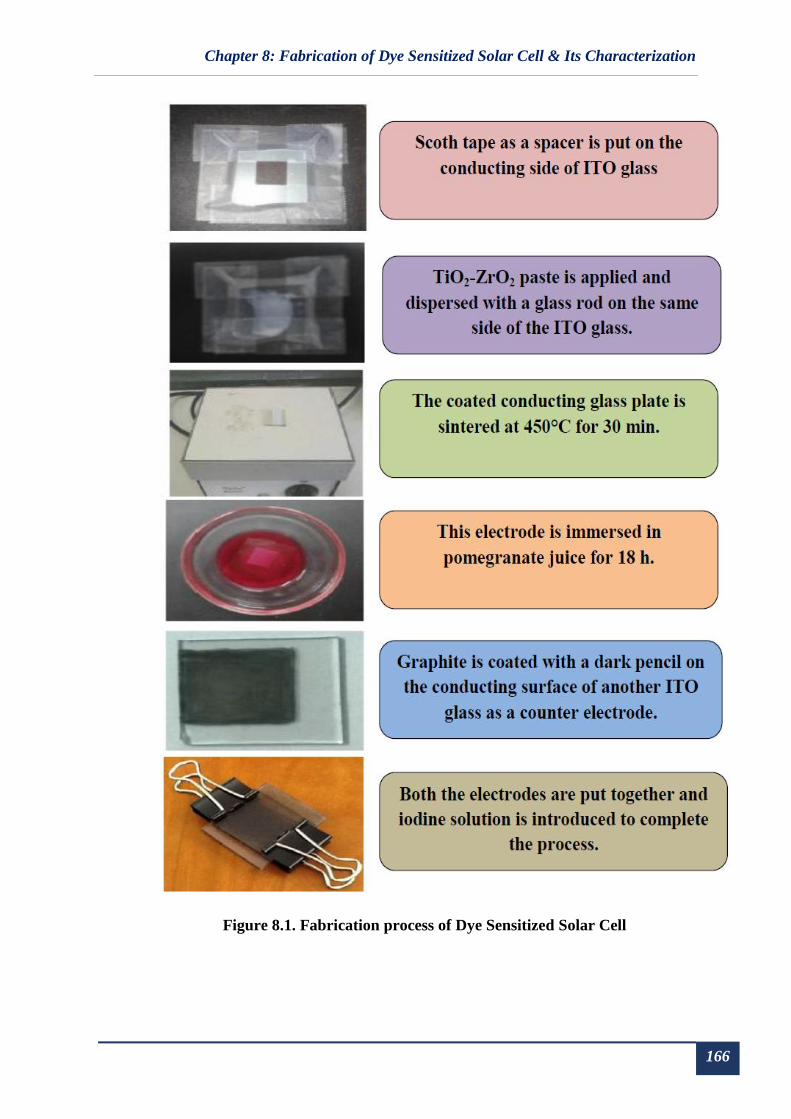
8.2.5 Assembling the Cell and Cell Performance
After preparing photo electrode and counter electrode, a sandwich type DSSC is
assembled. A film of polyethylene is placed at the sides on dye adsorbed TiO2-ZrO2
photo electrodes which work as a spacer and provide insulation between two
electrodes. After that two electrodes (photo electrode and counter electrode) are
fixed together by binder clips. The redox electrolyte comprising of iodide/tri-iodide
containing solution is introduced into the gap between the counter electrode and the
working or photo electrode by the capillary force. Figure 8.1 shows step by step
fabrication process of dye sensitized solar cell.
Chapter 8: Fabrication of Dye Sensitized Solar Cell & Its Characterization
166
Figure 8.1. Fabrication process of Dye Sensitized Solar Cell

Chapter 8: Fabrication of Dye Sensitized Solar Cell & Its Characterization
167
Figure 8.2. Circuit diagram for I-V characteristic measurements
Figure 8.3. Contact arrangements for Dye Sensitized Solar Cell

Chapter 8: Fabrication of Dye Sensitized Solar Cell & Its Characterization
168
Figure 8.4 Set up for the efficiency measurements of Dye Sensitized Solar Cell
A simple I-V measurement system was devised to measure open circuit voltage
and short circuit current of the fabricated DSSC’s. The I-V characteristics of the
cells were measured with a fixed load under illumination. For illumination, white
LED of 3 W was used. Figure 8.2 shows the circuit diagram for measuring I-V
characteristics. For measuring current and voltage, a Testronix make digital DC
micro voltmeter and micro ammeter was used, while a 100KΩ resistor was used as a
load. For these measurements, an assembly was prepared which can hold the
prepared solar cell with contact arrangements. To minimize series resistance the
copper contacts were coated with gold. The contact arrangements and setup for
efficiency measurements are shown in figure 8.3 and 8.4 respectively.

Chapter 8: Fabrication of Dye Sensitized Solar Cell & Its Characterization
169
8.3 Photovoltaic performance
8.3.1 Parameters to be measured
The performance of DSSC is evaluated by measuring the parameters such as
short circuit current (ISC) and open circuit voltage (VOC) under illumination.The IV
curve is used to find Imax and Vmax, the product of which gives maximum power i.e.
Pmax .The conversion efficiency η, of the solar cell can be obtained by calculatingthe
fill factor FF, the power density P, the photocurrent density at short circuit JSC and
the open circuit photo voltage VOC.
Short Circuit Current (ISC)
The short circuit current corresponds to short circuit condition and it is
calculated when the voltage is0.For an ideal cell, ISC is the maximum current or total
current produced in the solar cell by photon excitation.
ISC = I (at V = 0) [1]
Open Circuit Voltage (VOC)
Open circuit voltage occurs when there is no current passing through the cell.
VOC is also the maximum voltage difference across the cell.
VOC = V (at I = 0) [2]
Maximum Power (Pmax)
Maximum power produced by cell can be easily calculated from I-V curve.
The power density of the cell is given by the product of photocurrent density
at short circuit (J = Isc/Surface area of the cell) and voltage (V).
P = JV [3]

Chapter 8: Fabrication of Dye Sensitized Solar Cell & Its Characterization
170
Fill Factor
The fill factor is the ratio of the maximum obtainable power to theoretical
power. When the fill factor value is close to 1, it can be considered as an efficient
cell. It is given by the following relation.
𝑭𝑭 = 𝑱𝒎𝒂𝒙×𝑽𝒎𝒂𝒙
𝑱𝒔𝒄𝑽𝒐𝒄 [4]
Power Conversion Efficiency
The power conversion efficiency of dye sensitized solar cells was calculated
by the relation given below.
𝜼 =𝑱𝒔𝒄×𝑽𝒐𝒄×𝑭𝑭
𝑷𝒊𝒏 [5]
Where Pin = Input power (power of light source)
8.3.2 Resistance
One of the major factor which can affect the overall power conversion
efficiency of DSSC is the resistance of the solar cell. There can be two types of
resistance affecting the efficiency. The resistance can be determined from the I-V
characteristic of DSSC as shown in figure 8.5 [22].
1) Series resistance:
The series resistance results from the sheet resistance of TCO, the resistance
due toimproper ionic diffusion in electrolyte, resistance of contacts and the
resistance at the interface of counter electrode and electrolyte are the elements
responsible for series resistance of DSSC. Ideally series resistance would be
zero. Series resistance can be estimated by the slope near the point Voc on the
IV curve.

Chapter 8: Fabrication of Dye Sensitized Solar Cell & Its Characterization
171
2) Shunt Resistance:
Shunt resistance is caused by leakage current through the cell due to impurities
or defects in the manufacturing process. Ideally shunt resistance in infinite so
that no additional current path exists. The lower shunt also leads to a smaller
open circuit voltage. Shunt resistance can be calculated by the inverse of slope
near the point, short circuit current Isc on the IV curve.
Figure 8.5 Determination of series and shunt resistance from I-V
curve
Chapter 8: Fabrication of Dye Sensitized Solar Cell & Its Characterization
172
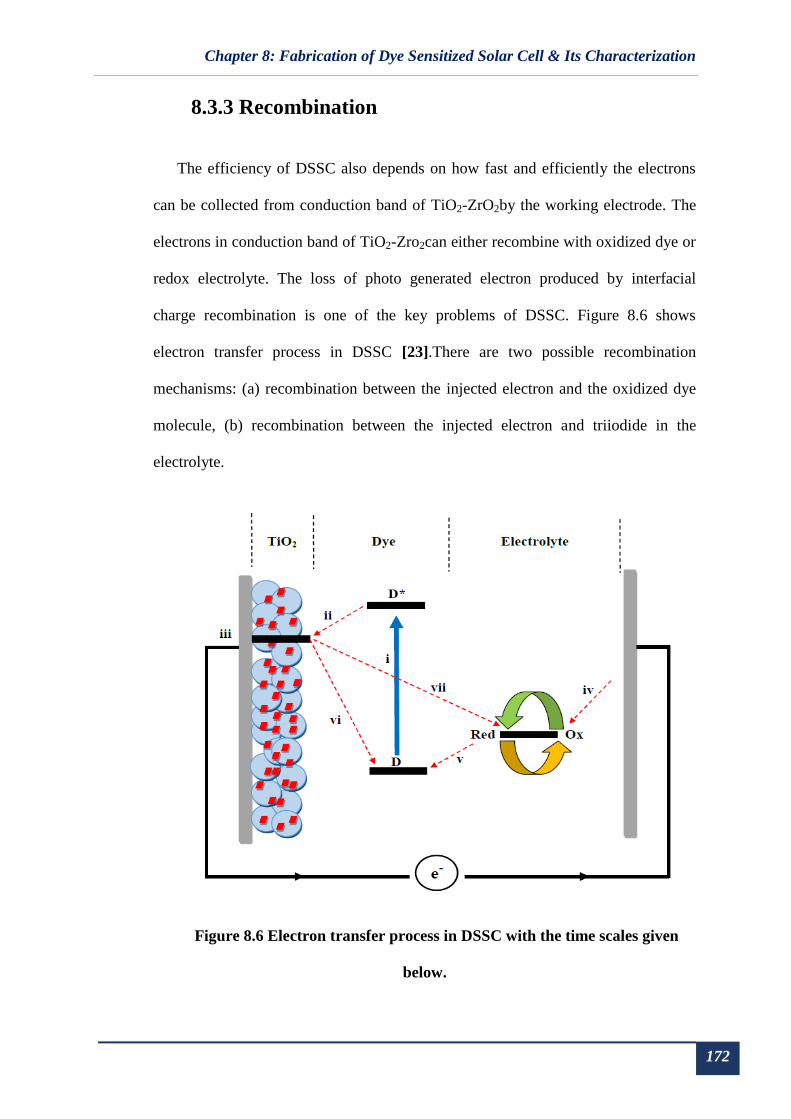
8.3.3 Recombination
The efficiency of DSSC also depends on how fast and efficiently the electrons
can be collected from conduction band of TiO2-ZrO2by the working electrode. The
electrons in conduction band of TiO2-Zro2can either recombine with oxidized dye or
redox electrolyte. The loss of photo generated electron produced by interfacial
charge recombination is one of the key problems of DSSC. Figure 8.6 shows
electron transfer process in DSSC [23].There are two possible recombination
mechanisms: (a) recombination between the injected electron and the oxidized dye
molecule, (b) recombination between the injected electron and triiodide in the
electrolyte.
Figure 8.6 Electron transfer process in DSSC with the time scales given
below.
Chapter 8: Fabrication of Dye Sensitized Solar Cell & Its Characterization
173
(i) Dye electronic excitation (femtoseconds).
(ii) Charge injection to semiconductor conduction band (150 picoseconds).
(iii) Diffusion of electron from conduction band ofTiO2to FTO (100 μs).
(iv) Reduction of electrolyte at counter electrode.
(v) Dye regeneration (transfer of electron form electrolyte to dye) (1 μs).
(vi) Charge recombination from conduction band of TiO2to dye (3 μs).
(vii) Charge recombination from conduction band of TiO2to electrolyte (1 ms).
Recombination is considered to be one of the major reasons for lowering of
efficiency. One of the major focuses of research in the field of DSSC today is to
address this problem.
Chapter 8: Fabrication of Dye Sensitized Solar Cell & Its Characterization
174
8.4 Performance of Dye Sensitized Solar Cell
fabricated using un-doped TiO2-ZrO2 composites
Dye sensitized solar cell using TiO2-ZrO2 mixed oxide were fabricated using
the method mentioned above. To check reproducibility of efficiency of solar cells
prepared using these mixed oxides, several cells for the same material were prepared
and performance of all of them were measured. The best performance has been
reported.
Apart from physiochemical and structural properties of material there are
several other factors which can affect the efficiency of dye sensitized solar cell, like
thickness of the film, porosity of the film, area of the film, particle size of material,
uniformity of the film and amount of surfactant used to prepare the cell. These
parameters are very difficult to control during fabrication process as the film is
prepared by doctor blade technique.
An attempt was made to maintain the uniformity of the paste by grinding it for
same time interval and with same amount of material as well as surfactant for each
cell. All other parameters like type of dye, dye adsorption time, amount of
electrolyte solution, etc. was fixed. In order to examine the performance, the current-
voltage i. e. I-V characteristics of DSSC have been measured.
Chapter 8: Fabrication of Dye Sensitized Solar Cell & Its Characterization
175
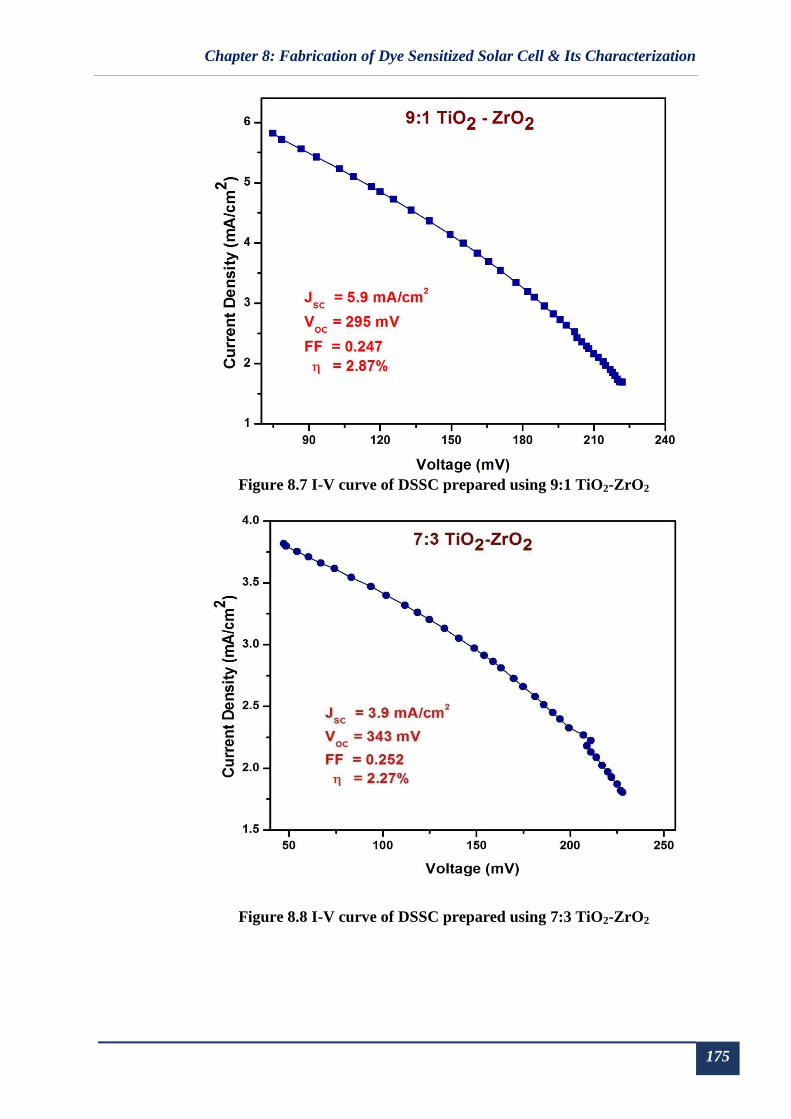
Figure 8.7 I-V curve of DSSC prepared using 9:1 TiO2-ZrO2
Figure 8.8 I-V curve of DSSC prepared using 7:3 TiO2-ZrO2
Chapter 8: Fabrication of Dye Sensitized Solar Cell & Its Characterization
176
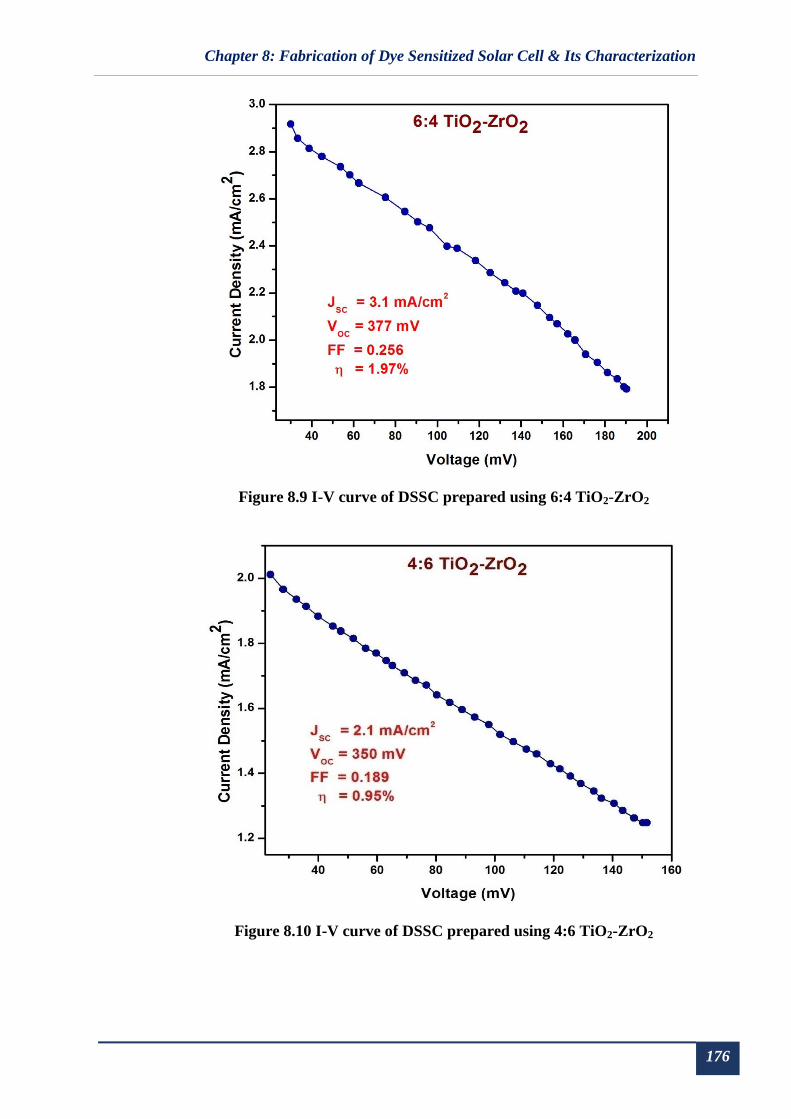
Figure 8.9 I-V curve of DSSC prepared using 6:4 TiO2-ZrO2
Figure 8.10 I-V curve of DSSC prepared using 4:6 TiO2-ZrO2
Chapter 8: Fabrication of Dye Sensitized Solar Cell & Its Characterization
177
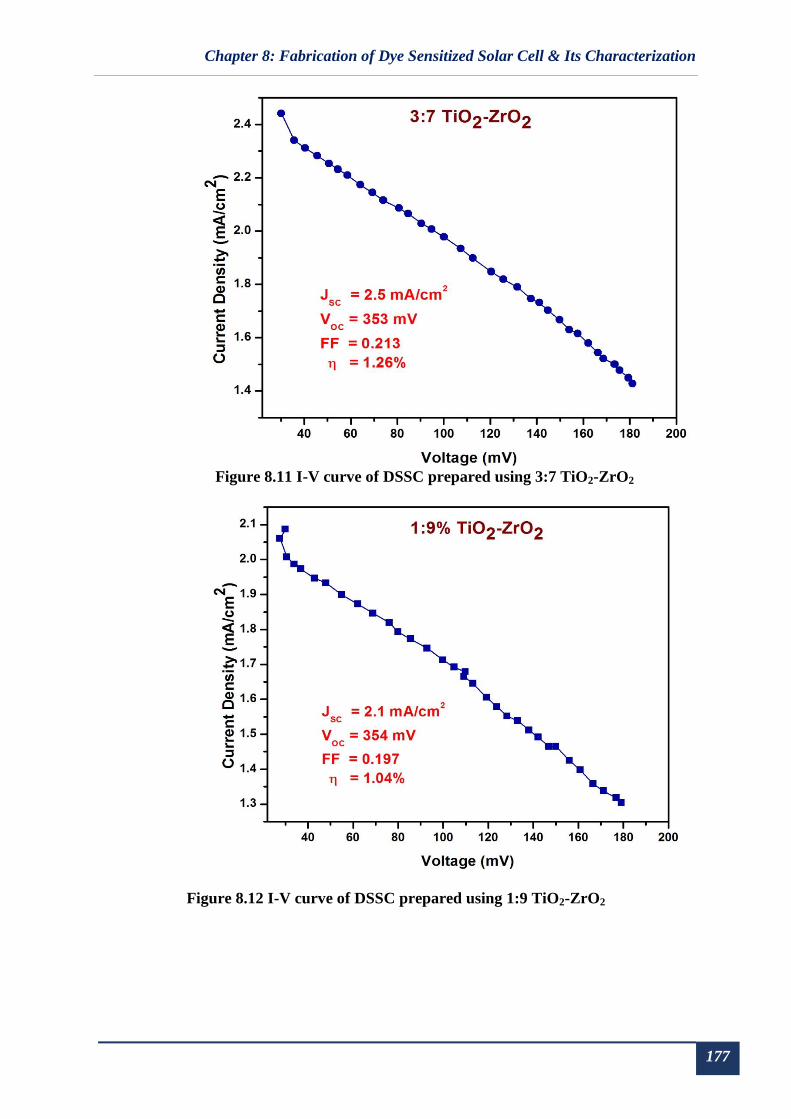
Figure 8.11 I-V curve of DSSC prepared using 3:7 TiO2-ZrO2
Figure 8.12 I-V curve of DSSC prepared using 1:9 TiO2-ZrO2
Chapter 8: Fabrication of Dye Sensitized Solar Cell & Its Characterization
178
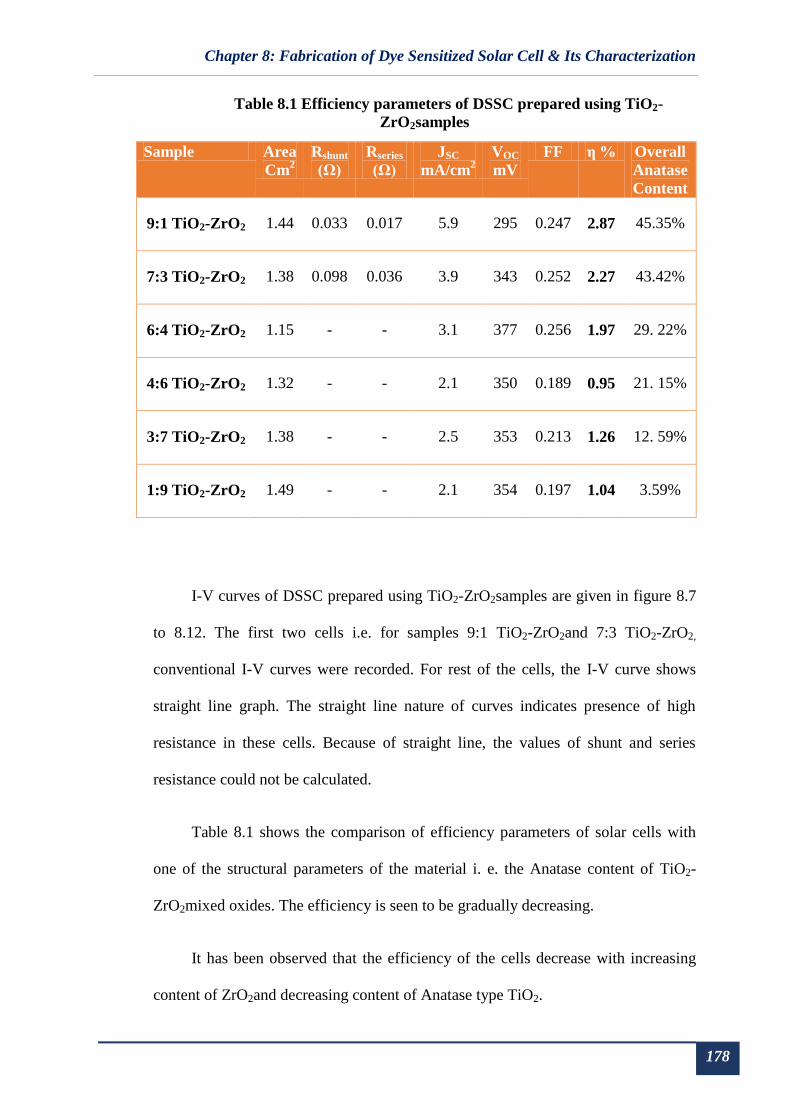
Table 8.1 Efficiency parameters of DSSC prepared using TiO2-
ZrO2samples
Sample Area
Cm2
Rshunt
(Ω)
Rseries
(Ω)
JSC
mA/cm2
VOC
mV
FF η % Overall
Anatase
Content
9:1 TiO2-ZrO2 1.44 0.033 0.017 5.9 295 0.247 2.87 45.35%
7:3 TiO2-ZrO2 1.38 0.098 0.036 3.9 343 0.252 2.27 43.42%
6:4 TiO2-ZrO2 1.15 - - 3.1 377 0.256 1.97 29. 22%
4:6 TiO2-ZrO2 1.32 - - 2.1 350 0.189 0.95 21. 15%
3:7 TiO2-ZrO2 1.38 - - 2.5 353 0.213 1.26 12. 59%
1:9 TiO2-ZrO2 1.49 - - 2.1 354 0.197 1.04 3.59%
I-V curves of DSSC prepared using TiO2-ZrO2samples are given in figure 8.7
to 8.12. The first two cells i.e. for samples 9:1 TiO2-ZrO2and 7:3 TiO2-ZrO2,
conventional I-V curves were recorded. For rest of the cells, the I-V curve shows
straight line graph. The straight line nature of curves indicates presence of high
resistance in these cells. Because of straight line, the values of shunt and series
resistance could not be calculated.
Table 8.1 shows the comparison of efficiency parameters of solar cells with
one of the structural parameters of the material i. e. the Anatase content of TiO2-
ZrO2mixed oxides. The efficiency is seen to be gradually decreasing.
It has been observed that the efficiency of the cells decrease with increasing
content of ZrO2and decreasing content of Anatase type TiO2.

Chapter 8: Fabrication of Dye Sensitized Solar Cell & Its Characterization
179
ZrO2 is high bandgap material and therefore, the electrical resistance of the
material will be on the higher side. The series resistance of solar cell increases with
higher content of ZrO2, which can be one of the reasons for decrease in efficiency.
Apart from electrical resistance of the material, there are several other
structural parameters which affect the efficiency of solar cell. One of them is the
amount of material in Anatase phase of TiO2.TiO2 exists in three different phases
Anatase, Rutile and Brookite. Among these phases, Anatase is the most favorable
phase for solar cell application. Thus for better performance of solar cell material
should have high content of Anatase phase.
The gradual decrease in efficiency of the cells can be also attributed to the
Anatase content, which offers higher electron transport than Rutile phase [24, 25].
As the Anatase content decreases in the successive samples, the efficiency
decreases.
Higher short circuit current density is observed in DSSC prepared using 9:1
TiO2-ZrO2 and 7:3 TiO2-ZrO2samples. This can be attributed to a larger amount of
dye adsorbed on the surface and better conductivity of the photo electrode i.e. the
mixed oxide sample. Usually, JSC is directly related to an amount of dye adsorbed on
the photo electrode surface.

Chapter 8: Fabrication of Dye Sensitized Solar Cell & Its Characterization
180
8.5 Performance of Dye Sensitized Solar Cells
fabricated using metal doped TiO2-ZrO2
DSSC’s prepared using un-doped TiO2-ZrO2in the ratio of 9:1 and 7:3 give
efficiency of more than 2%. To improve the efficiency of solar cell, the structural
and optical properties of the photo electrode material need to be modified. For better
efficiency, the material should have small particle size so that high amount of dye
can be adsorbed on the surface. Material should be porous so that dye can be stored
in the porosity of the material. Porosity also increases the surface area for
adsorption. To absorb in wider region of solar spectrum, the material should have
low bandgap with high absorption coefficient.
In the present work, TiO2-ZrO2mixed oxides have been doped with different
metal to alter its structural and optical properties. The incorporation of metal into
TiO2-ZrO2 affects the specific surface area, light scattering, electron transport rate,
and also the porosity. Three types of metal dopants were taken. These are transition
metals, alkaline earth metals and rare earth metals. The performance of dye
sensitized solar cells prepared with these metal doped TiO2-ZrO2arediscussed here.
The I-V curve for dye sensitized solar cells prepared using different metal doped
TiO2-ZrO2samples are shown in figure 8.13 to figure 8.26. The parameters are
summarized in table 8.2 in increasing order of efficiency.

Chapter 8: Fabrication of Dye Sensitized Solar Cell & Its Characterization
181
Figure 8.13: I-V curve of DSSC prepared using Magnesium doped TiO2-
ZrO2
Figure 8.14: I-V curve of DSSC prepared using Lanthanum doped TiO2-ZrO2

Chapter 8: Fabrication of Dye Sensitized Solar Cell & Its Characterization
182
Figure 8.15: I-V curve of DSSC prepared using Copper doped TiO2-ZrO2
Figure 8.16: I-V curve of DSSC prepared using Erbium doped TiO2-ZrO2

Chapter 8: Fabrication of Dye Sensitized Solar Cell & Its Characterization
183
Figure 8.17: I-V curve of DSSC prepared using Aluminium doped TiO2-
ZrO2
Figure 8.18: I-V curve of DSSC prepared using Iron doped TiO2-ZrO2
Chapter 8: Fabrication of Dye Sensitized Solar Cell & Its Characterization
184
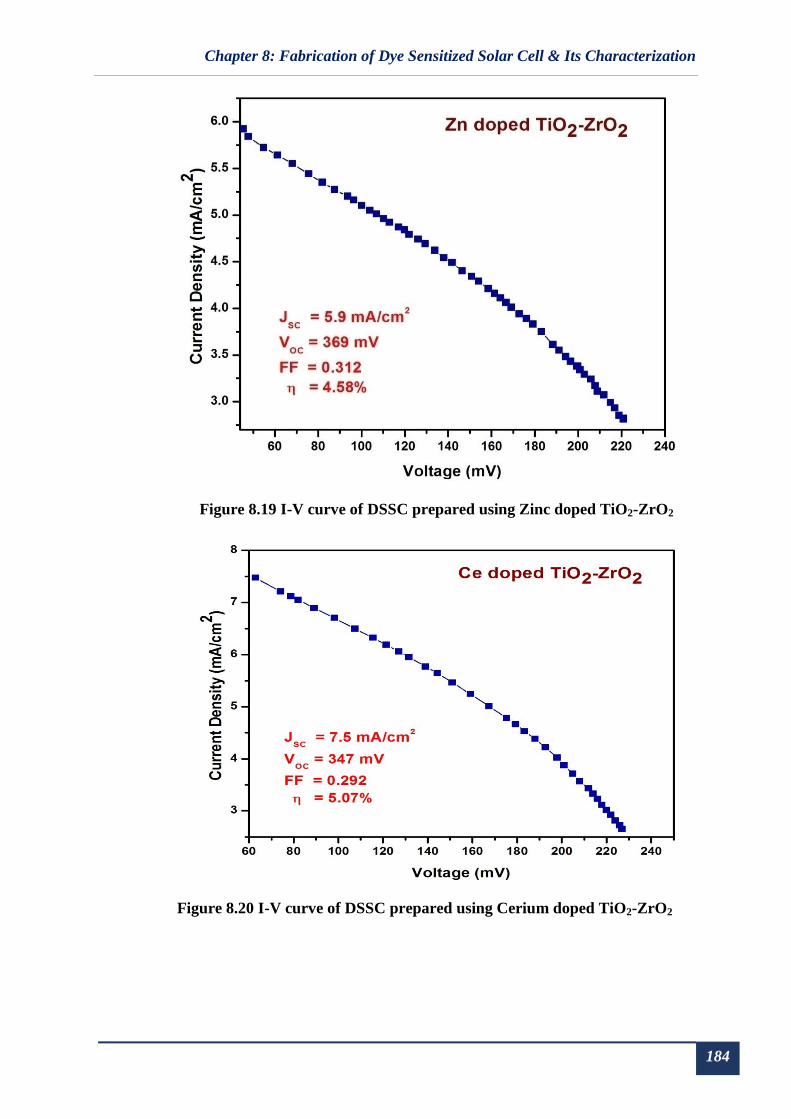
Figure 8.19 I-V curve of DSSC prepared using Zinc doped TiO2-ZrO2
Figure 8.20 I-V curve of DSSC prepared using Cerium doped TiO2-ZrO2
Chapter 8: Fabrication of Dye Sensitized Solar Cell & Its Characterization
185
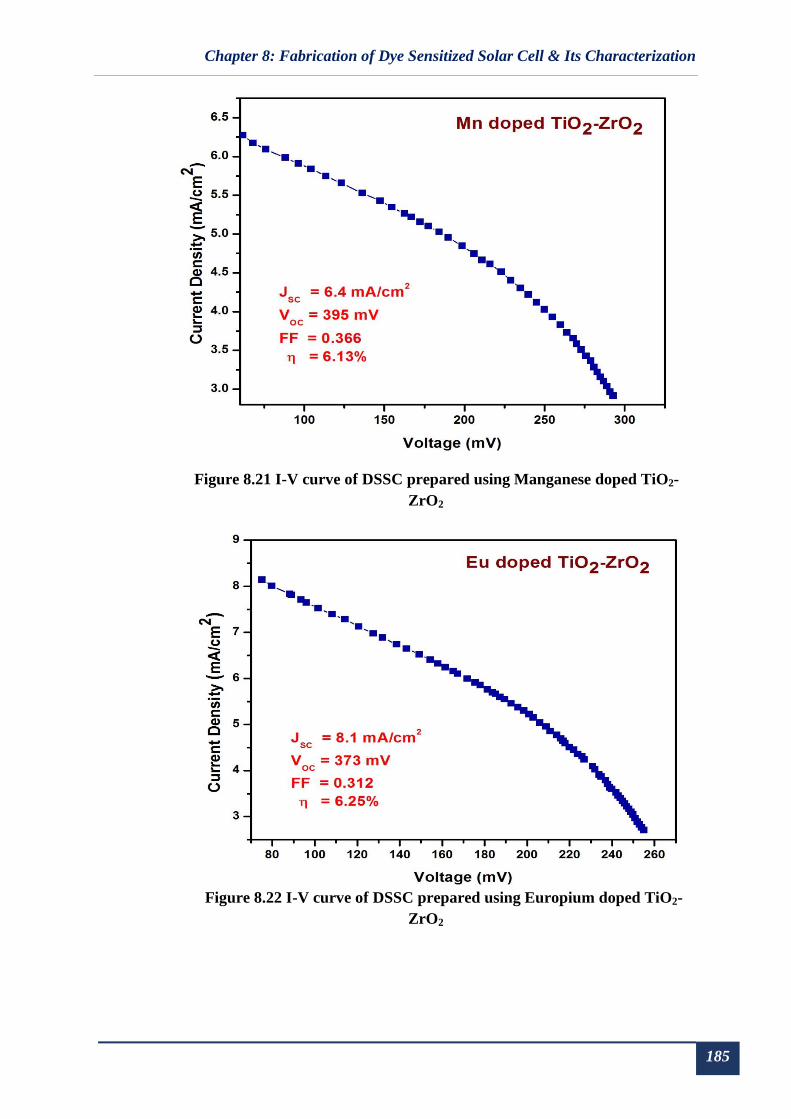
Figure 8.21 I-V curve of DSSC prepared using Manganese doped TiO2-
ZrO2
Figure 8.22 I-V curve of DSSC prepared using Europium doped TiO2-
ZrO2
Chapter 8: Fabrication of Dye Sensitized Solar Cell & Its Characterization
186
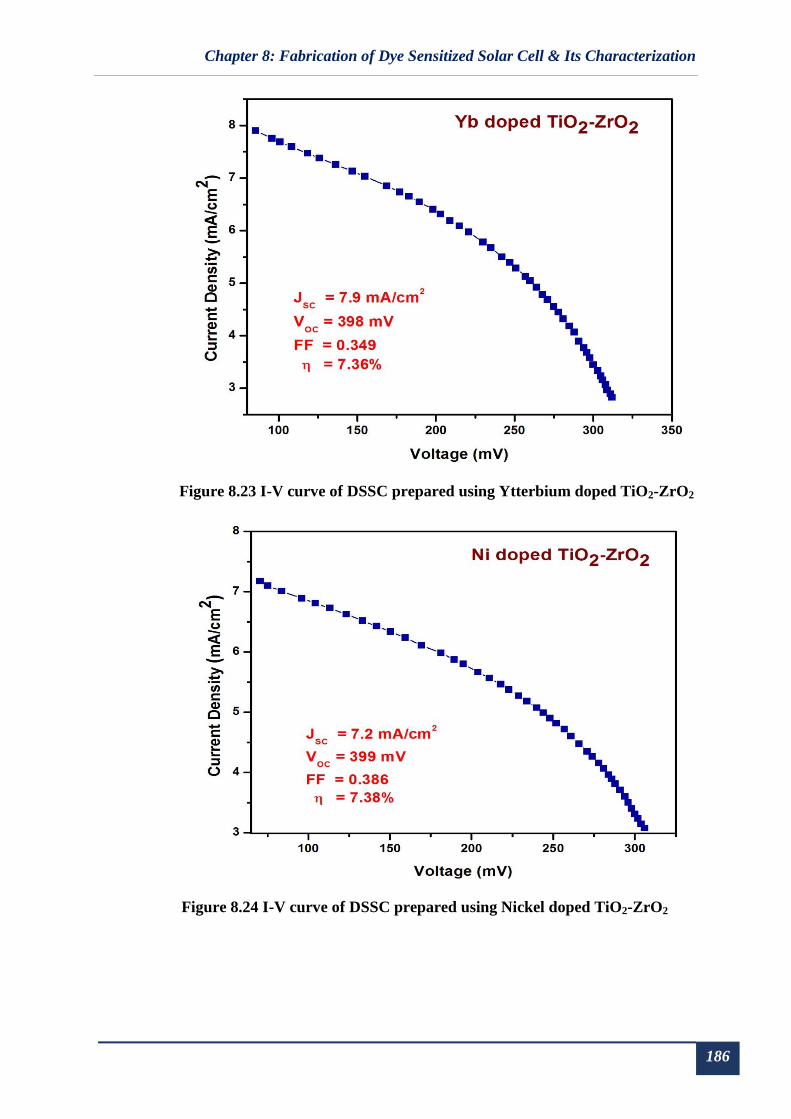
Figure 8.23 I-V curve of DSSC prepared using Ytterbium doped TiO2-ZrO2
Figure 8.24 I-V curve of DSSC prepared using Nickel doped TiO2-ZrO2

Chapter 8: Fabrication of Dye Sensitized Solar Cell & Its Characterization
187
Figure 8.25 I-V curve of DSSC prepared using Cadmium doped TiO2-ZrO2
Figure 8.26 I-V curve of DSSC prepared using Lead doped TiO2-ZrO2
Chapter 8: Fabrication of Dye Sensitized Solar Cell & Its Characterization
188
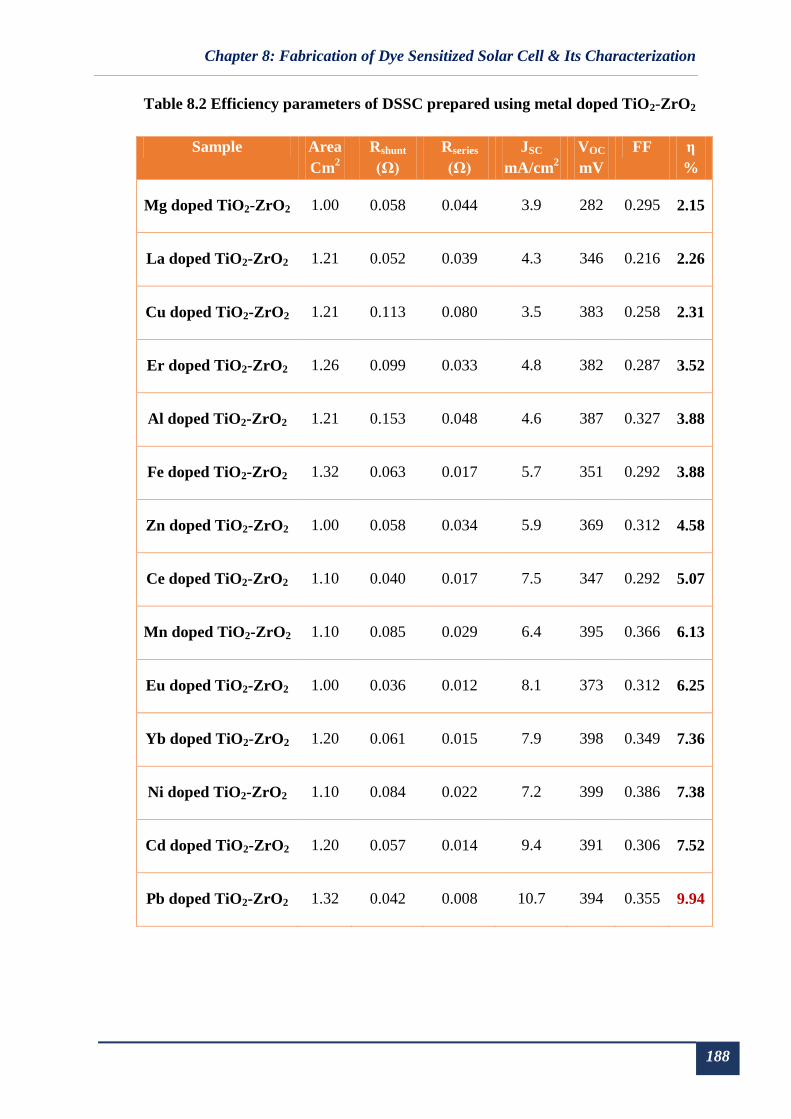
Table 8.2 Efficiency parameters of DSSC prepared using metal doped TiO2-ZrO2
Sample Area
Cm2
Rshunt
(Ω)
Rseries
(Ω)
JSC
mA/cm2
VOC
mV
FF η
%
Mg doped TiO2-ZrO2 1.00 0.058 0.044 3.9 282 0.295 2.15
La doped TiO2-ZrO2 1.21 0.052 0.039 4.3 346 0.216 2.26
Cu doped TiO2-ZrO2 1.21 0.113 0.080 3.5 383 0.258 2.31
Er doped TiO2-ZrO2 1.26 0.099 0.033 4.8 382 0.287 3.52
Al doped TiO2-ZrO2 1.21 0.153 0.048 4.6 387 0.327 3.88
Fe doped TiO2-ZrO2 1.32 0.063 0.017 5.7 351 0.292 3.88
Zn doped TiO2-ZrO2 1.00 0.058 0.034 5.9 369 0.312 4.58
Ce doped TiO2-ZrO2 1.10 0.040 0.017 7.5 347 0.292 5.07
Mn doped TiO2-ZrO2 1.10 0.085 0.029 6.4 395 0.366 6.13
Eu doped TiO2-ZrO2 1.00 0.036 0.012 8.1 373 0.312 6.25
Yb doped TiO2-ZrO2 1.20 0.061 0.015 7.9 398 0.349 7.36
Ni doped TiO2-ZrO2 1.10 0.084 0.022 7.2 399 0.386 7.38
Cd doped TiO2-ZrO2 1.20 0.057 0.014 9.4 391 0.306 7.52
Pb doped TiO2-ZrO2 1.32 0.042 0.008 10.7 394 0.355 9.94

Chapter 8: Fabrication of Dye Sensitized Solar Cell & Its Characterization
189
The results indicate that doping of metal into TiO2-ZrO2increases the efficiency
of DSSC compared to that of undoped TiO2-ZrO2. The I-V characteristics of DSSC
are prepared using metal doped TiO2-ZrO2are better than undoped TiO2-ZrO2in
terms of all the parameters. This can be attributed to the improved conductivity
ofTiO2-ZrO2due to metal doping, apart from other reasons.
It has been reported that the I-V curve deviate from its ideal behavior if the
resistance present in DSSC is very high. The main components of series resistance
include sheet resistance of the conducting plate, resistance of contacts and the
resistance of photo electrode material. The shunt resistance is mainly caused due to
leakage current through the cell caused by impurities or defects in the
manufacturing process. The value of series resistance is decreased in DSSC
prepared using metal doped TiO2-ZrO2. The lowest series resistance has been
observed for DSSC prepared using Pb doped TiO2-ZrO2, which has been found to
have the highest efficiency. Since the series resistance is lower, it indicates
improvement in the quality of the photo cathode material, which is obviously due to
doping.
There are several other structural and optical parameters which affect the
efficiency of DSSC. The crystallite size of metal doped TiO2-ZrO2 is smaller than
undoped TiO2-ZrO2samples.Hence the decrease in crystallite size of the material
also improves the performance. This can be attributed to increase in surface area on
account of lower crystallite size which results into higher amount of dye being
adsorbed on the film.
The Anatase content in almost all the metal doped samples is higher than 70%.
Samples doped with Lanthanum, Cadmium, Ytterbium and Lead have 100%
Chapter 8: Fabrication of Dye Sensitized Solar Cell & Its Characterization
190
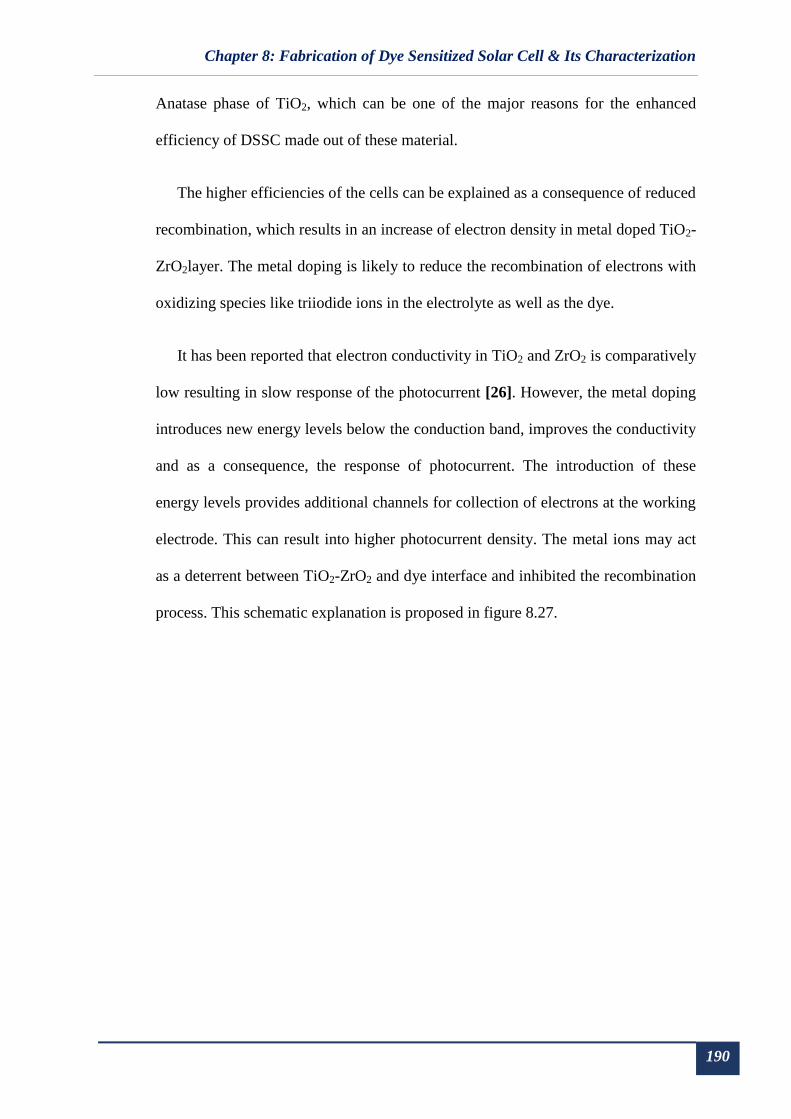
Anatase phase of TiO2, which can be one of the major reasons for the enhanced
efficiency of DSSC made out of these material.
The higher efficiencies of the cells can be explained as a consequence of reduced
recombination, which results in an increase of electron density in metal doped TiO2-
ZrO2layer. The metal doping is likely to reduce the recombination of electrons with
oxidizing species like triiodide ions in the electrolyte as well as the dye.
It has been reported that electron conductivity in TiO2 and ZrO2 is comparatively
low resulting in slow response of the photocurrent [26]. However, the metal doping
introduces new energy levels below the conduction band, improves the conductivity
and as a consequence, the response of photocurrent. The introduction of these
energy levels provides additional channels for collection of electrons at the working
electrode. This can result into higher photocurrent density. The metal ions may act
as a deterrent between TiO2-ZrO2 and dye interface and inhibited the recombination
process. This schematic explanation is proposed in figure 8.27.

Chapter 8: Fabrication of Dye Sensitized Solar Cell & Its Characterization
191
Figure 8.27 Charge transportation process in metal doped TiO2-
ZrO2nanocomposite
DSSC prepared using Pb doped TiO2-ZrO2 exhibits highest short current density
(JSC =10.7 mA/cm2) and finally the highest power conversion efficiency (η =
9.94%). These results are encouraging as the highest reported efficiency of DSSC is
around 11%.

Chapter 8: Fabrication of Dye Sensitized Solar Cell & Its Characterization
192
8.6 Performance of Dye Sensitized Solar Cell
fabricated using co-doped TiO2-ZrO2
The efficiency of DSSC improves by metal doping in TiO2-ZrO2mixed oxides.
An attempt was made to study the performance of these oxides by co-doping of the
already studied single doped metal ions. The pairing was done by a combination of
transition/alkaline earth and rare earth metal ions. The alkaline/transition metal ions
taken were Copper, Aluminium, Zinc and Manganese in that order, as DSSC’s
prepared by the single doped samples of these same metal ions give efficiencies in
the same order in increasing progression. The two rare earth co-dopants taken are
Cerium and Europium, which are easily available.
These metals were doped together in TiO2-ZrO2 and DSSC’s were prepared by
applying them as the photo electrode material. Its power conversion efficiency was
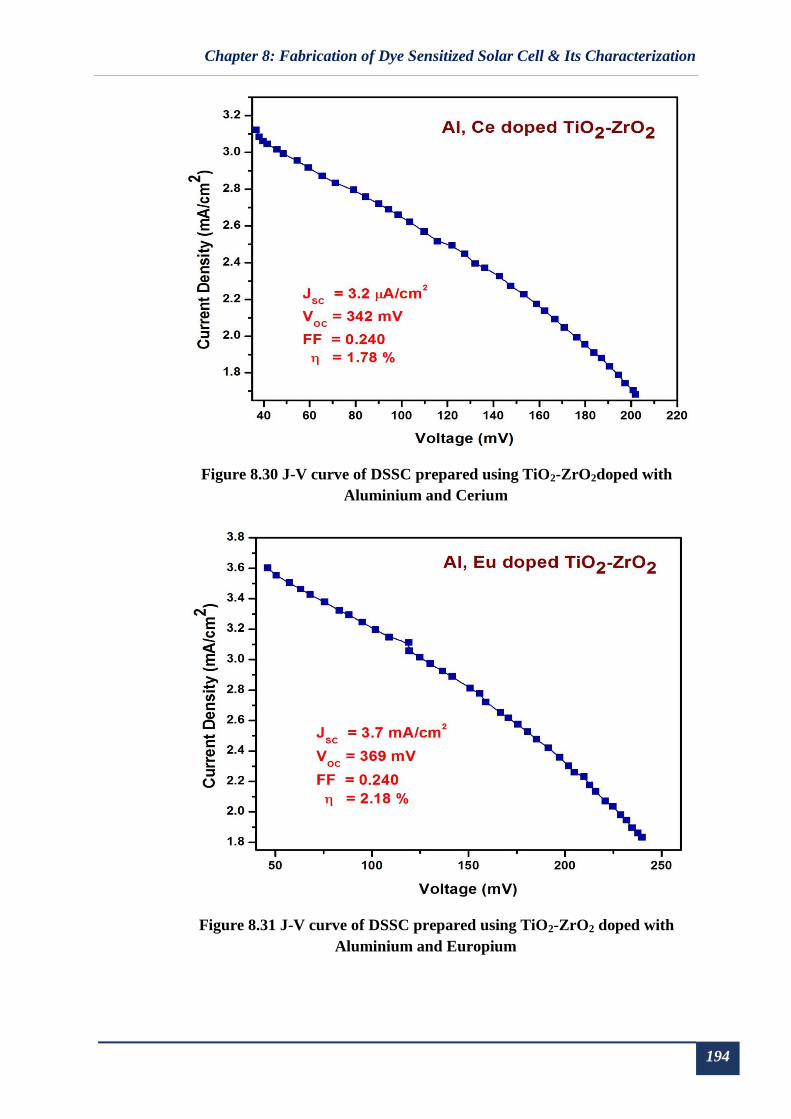
studied. The J-V characteristics of DSSCs prepared using co-doped TiO2-ZrO2 are
shown in figures 8.28 to 8.35. The calculated efficiency parameters of these cells
are summarized in Table 8.3.

Chapter 8: Fabrication of Dye Sensitized Solar Cell & Its Characterization
193
Figure 8. 28 J-V curve of DSSC prepared using TiO2-ZrO2 doped with
Copper and Cerium
Figure 8.29 J-V curve of DSSC prepared using TiO2-ZrO2 doped with
Copper and Europium
Chapter 8: Fabrication of Dye Sensitized Solar Cell & Its Characterization
194
Figure 8.30 J-V curve of DSSC prepared using TiO2-ZrO2doped with
Aluminium and Cerium
Figure 8.31 J-V curve of DSSC prepared using TiO2-ZrO2 doped with
Aluminium and Europium
Chapter 8: Fabrication of Dye Sensitized Solar Cell & Its Characterization
195
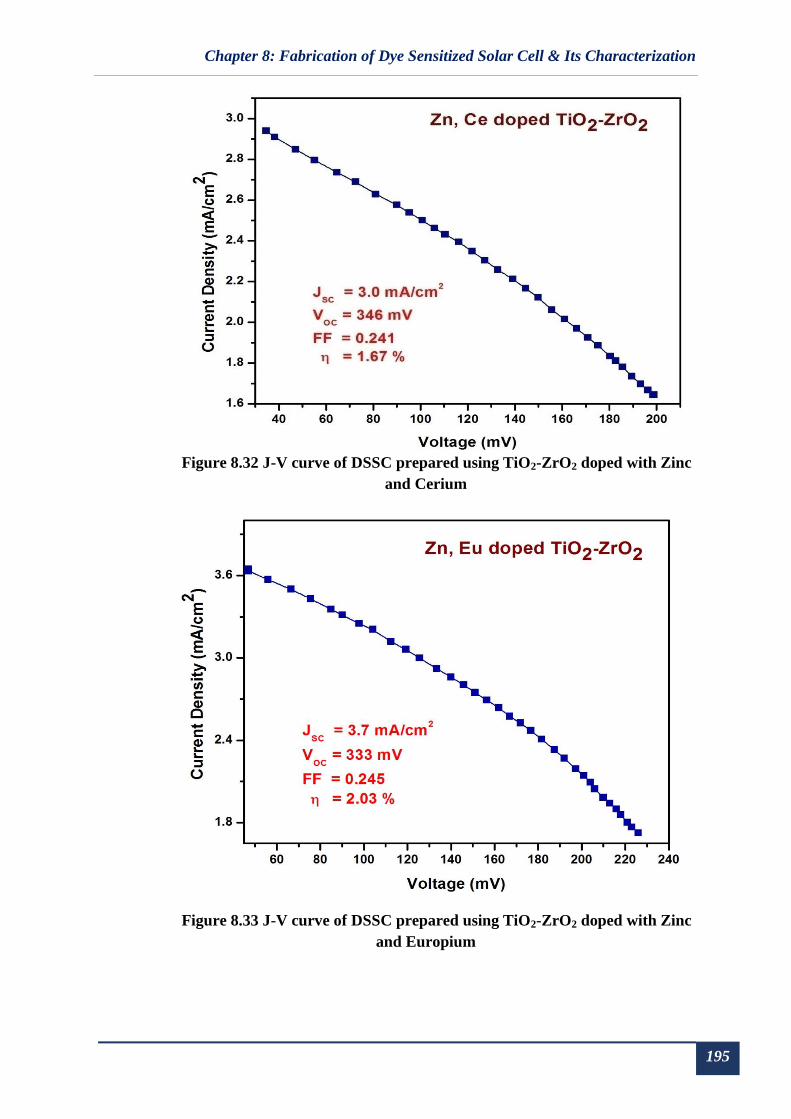
Figure 8.32 J-V curve of DSSC prepared using TiO2-ZrO2 doped with Zinc
and Cerium
Figure 8.33 J-V curve of DSSC prepared using TiO2-ZrO2 doped with Zinc
and Europium
Chapter 8: Fabrication of Dye Sensitized Solar Cell & Its Characterization
196
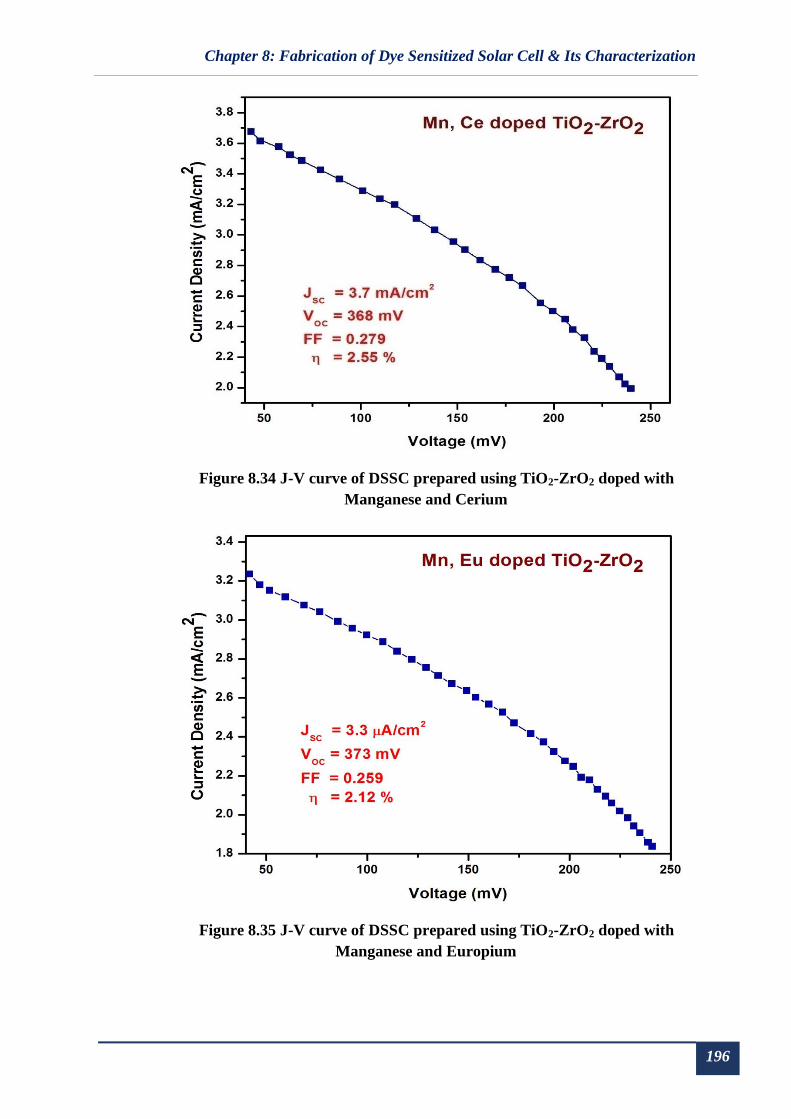
Figure 8.34 J-V curve of DSSC prepared using TiO2-ZrO2 doped with
Manganese and Cerium
Figure 8.35 J-V curve of DSSC prepared using TiO2-ZrO2 doped with
Manganese and Europium

Chapter 8: Fabrication of Dye Sensitized Solar Cell & Its Characterization
197
Table 8.3 Efficiency parameters of DSSC prepared using metal doped TiO2-
ZrO2nanocomposites
Sample Area
Cm2
Rshunt
(Ω)
Rseries
(Ω)
JSC
mA/cm2
VOC
mV
FF η %
Cu, Ce doped TZ 1.32 - - 1.7 224 0.133 0.33
Cu, Eu doped TZ 1.15 - - 2.1 247 0.131 0.45
Al, Ce doped TZ 1.32 0.077 0.055 3.2 342 0.240 1.78
Al, Eu doped TZ 1.43 0.087 0.051 3.7 369 0.240 2.18
Zn, Ce doped TZ 1.32 0.108 0.076 3.0 346 0.241 1.67
Zn, Eu doped TZ 1.44 0.097 0.041 3.7 333 0.245 2.03
Mn, Ce doped TZ 1.32 0.110 0.056 3.7 368 0.279 2.55
Mn, Eu doped TZ 1.44 0.107 0.059 3.3 373 0.259 2.12
Comparing the efficiencies with those of the single doped material of the same
ions, the efficiencies of DSSC’s made out of co-doped samples fall much short,
which puts a question mark on the effectiveness of the co-doped material. The
reason for this may be the further introduction of additional energy levels due to the
co-dopant, where electrons get trapped. These energy states provide additional path
for recombination of electrons back to the valence band of the photocathode
material. Hence, more electrons get recombined rather than getting collected at the
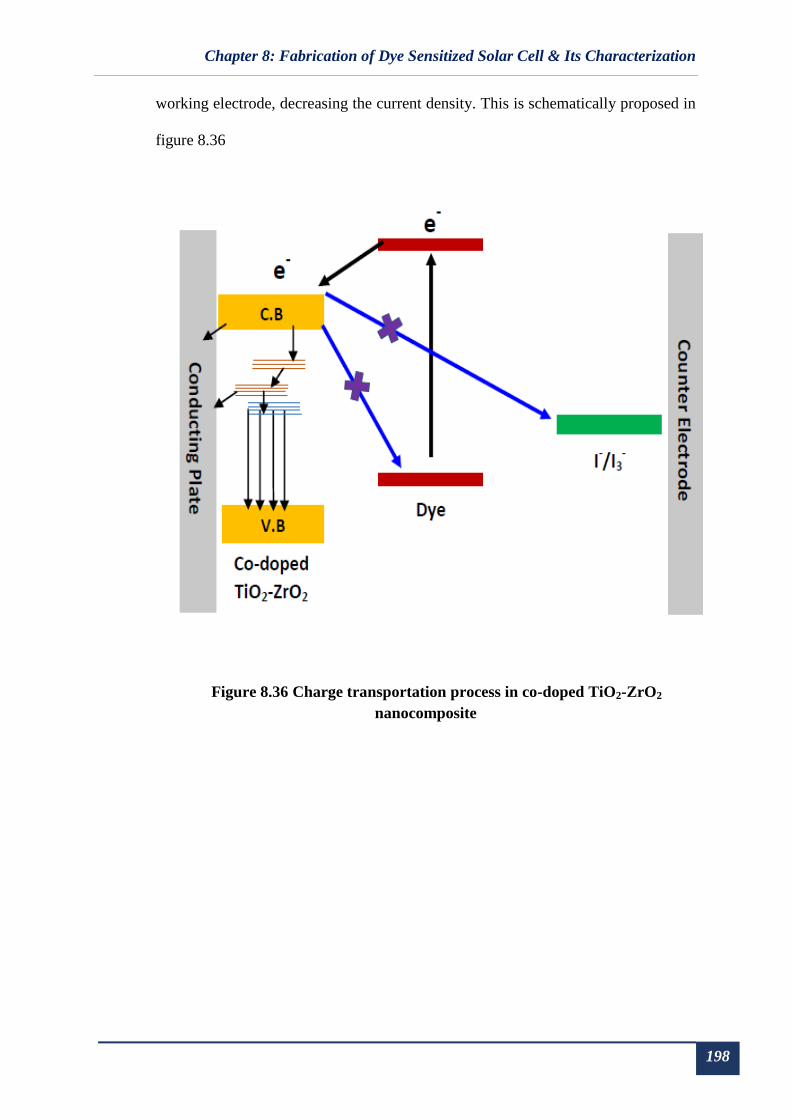
Chapter 8: Fabrication of Dye Sensitized Solar Cell & Its Characterization
198
working electrode, decreasing the current density. This is schematically proposed in
figure 8.36
Figure 8.36 Charge transportation process in co-doped TiO2-ZrO2
nanocomposite
Chapter 8: Fabrication of Dye Sensitized Solar Cell & Its Characterization
199
8.7 Conclusion
Dye Sensitized Solar Cells were fabricated using simple technique and
inexpensive components. The cells prepared using un-doped TiO2-ZrO2mixed
oxides give a highest efficiency of 5.97%. Further increment in efficiency has been
observed for DSSC prepared using metal doped TiO2-ZrO2samples. The
improvement in structural properties of TiO2-ZrO2due to doping may be responsible
for this enhancement in efficiency. The presence of metal ions may have inhibited
the recombination process. The highest efficiency of 9.94% has been recorded for
the DSSC prepared using Lead doped TiO2-ZrO2.Two metals were doped together
in TiO2-ZrO2in an attempt to study the effect of co-doping on the efficiency. The
efficiency of DSSC prepared using co-doped samples were found to be much lower
than the efficiency of single metal doped samples. A highest efficiency of only
2.55% has been observed for the sample co- doped with Manganese and Cerium.
This is in spite of the fact that the Anatase content of these samples is quite high.
Hence, the lower efficiencies may be attributed to the generation of new trap states
below the conduction band of TiO2-ZrO2.The electrons are trapped in these energy
levels rather than reaching the conducting plate. The trap states also provide
alternate path for recombination of the electrons in the valence band.

Chapter 8: Fabrication of Dye Sensitized Solar Cell & Its Characterization
200
References
[1] B. O’Regan, M.Gratzel, Nature 1991, 353, 737.
[2] M. Gratzel, Nature 2001, 414, 338.
[3] N. J. Podraza, C. Chen, D. Sainju, O. Ezekoye, M. W. Horn, C. R. Wronski, R.
W.Collins, R. W. Mater. Res. Soc. Symp. Proc. 2005, 865, 273.
[4] W. J. Lee, E. Ramasamy, D. Y. Lee, B. K. Min, J. S. Song, Proc. SPIE-Int.
Soc. Opt. Eng. 2006, 413.
[5] Y. Saito, S. Kambe, T. Kitamura, Y. Wada, S. Yanagida, Sol.Energy Mater.
Sol.Cells2004, 83, 1.
[6] Z. S. Wang, H. Kawauchi, T. Kashima, H. Arakawa, Coord. Chem. ReV.2004,
248, 1381.
[7] M. K. Nazeeruddin, P. Pechy, T. Renouard, S. M. Zakeeruddin, R. Humphry-
Baker, P. Comte, P. Liska, L. Cevey, E. Costa, V. Shklover, L. Spiccia, G. B.
Deacon, C. A. Bignozzi, M. Graetzel, J. Am. Chem. Soc. 2001, 123, 1613.
[8] K. Hara, T. Nishikawa, M. Kurashige, H. Kawauchi, T. Kashima, K. Sayama, K.
Aika, H. Arakawa, Sol. Energy Mater. Sol. Cells 2005, 85, 21.
[9] X. Fang, T. Ma, G. Guan, M. Akiyama, T. Kida, E. Abe, J.Electroanal. Chem.
2004, 570, 257.
[10] N.G. Park, G. Schlichthorl, J. van de Lagemaat, H.M. Cheong, A. Mascarenhas,
A.J. Frank, J. Phys. Chem. B. 1999, 103, 3308–3314.
[11] S. Anderson, Nature 1979, 280, 571–573.
[12] M. Dare Edwards ,Faraday Discuss. Chem. Soc. 1980, 70, 285–298.
[13] S. Michal , C. Julius , ActaElectrotechnica et Informatica 2010, 10, 78–81
[14] H. Gerischer , H. Tributsch , B. Bunsen. Phys. Chem. 1968, 72, 437–445.
[15] H. Tributsch , H. Gerischer , B. Bunsen. Phys. Chem. 1969, 73, 251–260.
Chapter 8: Fabrication of Dye Sensitized Solar Cell & Its Characterization
201
[16] A.S. Polo, M.K. Itokazu, N.Y. Murakami Iha, Coord. Chem. Rev. 2004, 248,
1343-1361.
[17] K. Hara , Sol. Energy Mater. Sol. Cells 2001, 70, 151–161.
[18] N. Vlachopoulos, P. Liska, J. Augustynski, M. Gratzel, J. Am. Chem. Soc.
1988, 110, 1216–1220.
[19] N. Papagergiou, W.F. Maier, M. Grätzel, J. Electrochem. Soc. 1997, 144, 876.
[20] K. Imoto, K. Takahashi, T. Yamaguchi, T. Komura, J. Nakamura, K. Murata,
Sol.Energy Mater. Sol. Cells 2003, 79, 459.
[21] K. Suzuki, M. Yamaguchi, M. Kumagai, S. Yanagida, Chem. Lett. 2003, 32,
28.
[22]Keithley Application Note Series, Making I-V and C-V Measurements on
Solar/Photovoltaic Cells Using the Model 4200-SCS Semiconductor
Characterization System, 2876
[23] Umass Boston, ChemAdvanced Inorganic Chemistry Laboratory, 371
[24] N.G. Park, J. van de Lagemaat, A.J. Frank, J. Phys. Chem. B. 2000,104, 8989–
8994.
[25] Bing Tan and YiyingWu,J. Phys. Chem. B 2006, 110, 15932-15938
[26] Kohjiro Hara and Hironori Arakawa, Handbook of Photovoltaic Science and
Engineering. Edited by A. Luque and S. Hegedus, 2003 John Wiley & Sons, Ltd.