chapter 8 computer-based sim ulationjohnson/book/parts/chap8.pdf · chapter 8 computer-based sim...
TRANSCRIPT
Chapter 8
Computer-Based Simulation
The previous chapter identi�ed the main activities that must be conducted during the secondaryinvestigation of any incident report. These, typically, focus on gathering evidence to both informand validate initial hypotheses about the causes of an adverse occurrence. This chapter, in contrast,looks at one aspect of this validation process. It seems clear that any causal hypothesis must beconsistent with what we know about the course of any incident. Support for such assertions isoften provided by simulation and reconstruction techniques. The Rand report into the NationalTransportation Safety Board's (NTSB) investigation techniques emphasised this in their overview:
\When a complex system fails, the number of potential scenarios rises proportionately.NTSB investigators must carefully unravel the performance of many highly integratedsystems, a very time-consuming task requiring a diverse set of skills. Often, this requiresextensive and costly salvage and reconstruction of the aircraft. Complexity a�ects morethan just sta� workload. The growing complexity of aircraft crashes also has a profounde�ect on how investigations must be structured to reveal hidden failure modes." [482]
This quotation reveals the dual nature of reconstruction in many modern incident investigations.Firstly, reconstruction involves the rebuilding of components and sub-components to identify causalinformation from the physical damage that often occurs during major incidents. Secondly, there isthe more abstract notion of event simulation in which investigators piece together the more complexcauses of an incident drawing upon the physical evidence and also from the other forms of evidencethat are gathered during a secondary investigation. This might suggest a �rm distinction betweenphysical reconstructions and virtual simulations. The terms `simulation' and `reconstruction' are,however, often used inter-changeably. As we shall see, this ambiguity can partly be justi�ed by theway in which limited physical reconstructions are being used to provide the data that drives moregeneral computer-based simulations.
8.1 Why Bother with Reconstruction?
The term `reconstruction' has traditionally been used to describe the way in which physical evidenceis re-assembled to provide clues about the sequence of events leading to failure. For example, theUS Army's accident and incident investigation guidelines constraint the following recommendationsfor the analysis of rotor or propeller failures. As can be seen there is a requirement to reconstructthe entire assembly if at all possible:
1. Collect and inventory; reconstruct the whole assembly if possible.
2. Examine damage / scarring to determine if systems were turning at impact and if power wasapplied at impact.
3. Examine all linkage from cockpit controls to systems for continuity/disconnect, all bearingassemblies and / or blade grips for failure prior to impact.
213
214 CHAPTER 8. COMPUTER-BASED SIMULATION
4. Check for serial numbers of blades / propellers against historical records. [807]
A number of published guidelines provide detailed information about the ways in which such physicalreconstruction should be conducted [751]. Much of this information varies from domain to domain.For instance, the construction and operational stresses of aircraft components are quite di�erent fromthose relating to automotive components. Klepacki, Morin and Schae�er's guidelines for evaluatingpost-incident ight control trim system con�gurations are highly domain speci�c [448]. There are,however, some similarities between the techniques that are used to support incident reconstructionin several di�erent industries. For instance, the techniques for establishing the velocity and angle ofimpact damage show strong similarities across several di�erent domains [870].
The opening paragraphs identi�ed two forms of reconstruction. The �rst focussed on the physicalrebuilding of damaged components to gain further information about the failures that contributedto an incident or forces that arose in its aftermath. The second aspect of reconstruction deals withthe way in which information is used to describe the course of events over time. This centres on theprocess of assembling fragmentary evidence to produce a coherent account of an adverse occurrence.For example, the US Air Force requires that investigators reconstruct the sequence of events thatleads to an incident [795]. They must map route segments. They should provide a vertical view ofmaneuvers. The account may include artists conceptions or models to explain the course of events.The intention is to \explain what the plan was, what should have happened if things had gone right,who was in charge, what were the rules of engagement and were they followed, where things wentwrong, what should the aircrew have done, and what were the aircraft parameters at ejection oraircraft impact" [795]. As can be seen, generic requirements are speci�ed together with more domainspeci�c guidelines that relate narrowly to aviation accidents.
The wealth of guidance on the physical reconstruction of safety-critical systems is not matchedby similar sources of advice on the reconstruction of events leading to incidents and accidents. Asa result, the remainder of this chapter focuses on techniques that can be used to build coherentmodels that explain how di�erent events contribute to an adverse occurrence. It is important notto underestimate the importance of these reconstructions. They are intended to produce a coherentaccount of the course of an incident from many disparate pieces of evidence. In other words, theyare intended to explain what happened while causal techniques present why it happened.
There are many di�erent ways in which to build these event reconstructions. In some domains, itis also possible to stage physical reconstructions. These re-enactments are often used by the Policeto trigger witness recollections and elicit further information about an incident. However, there areobvious limitations with this approach. For example, such reconstructions can expose individualsto further danger. There are ethical considerations involved in re-enacting a failure in a workingfoundry or chemical plant. There is also the danger, described in Chapter 4.3 that such `realistic'reconstructions may trigger further psychological problems for those involved in an incident. It mayeven trigger false memory syndrome in some cases. Fortunately, a range of alternative techniquescan also support the reconstruction of safety-critical incidents. For example, computer-based simu-lations enable investigators to step-through the events leading to an incident using three dimensionalanimations. The second half of this chapter identi�es a number of these interactive tools. There are,however, a number of limitations with computer-based simulations. For example, highly interactivemodels provide a good impression of the events leading to component failure. Unfortunately, theycannot easily be used to recreate the events leading to managerial or regulatory failure. I have yetto see virtual reality simulations recreate a board meeting or a management conference in whichsafety investments were turned down!
Fortunately, a range of graphical and textual notations can be used to avoid such limitations.They can be used to sketch the events leading to an incident at a far greater level of abstractionand can, therefore, also capture events leading to managerial and regulatory failure. Many of thesenotations provide inference techniques that can be used by investigators to clearly distinguish whatcan, and what cannot, be concluded from the evidence that is assembled. These reasoning techniquescan also be used to identify inconsistencies and omissions in incident reconstructions. The followingchapter focuses on these formal and semi formal notations for event reconstruction. The secondhalf of this chapter reviews computer-based modelling techniques. It is important to emphasise,however, that these modelling notations and the computer-based simulations mentioned above are
8.1. WHY BOTHER WITH RECONSTRUCTION? 215
not primarily intended as tools to support the causal analysis of adverse occurrences. They areintended to reconstruct the course of events that contribute to an incident. In contrast, Chapter 9.3presents techniques that help to distinguish root causes and contributory factors from the contextualinformation that can be represented in a formal model or an interactive simulation.
Some formal and semi-formal modelling techniques are supported by computer-based tools. Itis possible to derive interactive computer-based simulations from abstract notations. As a result,the previous distinctions between computer-based simulation and abstract modelling can becomeblurred. However, these distinctions are retained because they are useful in distinguishing betweendi�erent sets of concerns that a�ect what can be complementary approaches. For instance, formalmathematically-based notations can be diÆcult to interpret by non-mathematicians. In contrast,interactive simulations can often lead to unwarranted interpretations if analysts are seduced byparticular animation techniques. For now it is suÆcient to emphasise that natural language providesthe most accessible and widespread medium for building reconstructions. The following quotationillustrates how most organisations summarise the events leading to an incident These accountsare used to provide investigators and managers with a common ppoint of reference during anyinvestigation. They are gradually re�ned as additional evidence is obtained until they are eventuallyintegrated into a �nal report:
\About 10 p.m., unknown to the controller, the pipeline ruptured at a location nearGramercy, Louisiana. At 10:01:53 p.m., the supervisory control and data acquisition(SCADA2) system reported high-pump-case pressure at Garyville. The SCADA systemactivated an audible alarm and also displayed a message on a display screen. Almostimmediately, the SCADA system sounded and displayed alarms reporting that certainpumping units at the Garyville station had automatically shut down because of lowsuction pressure (low liquid pressure on the inlet side of the pump). At 10:02:30 p.m.,the SCADA system reported a line balance alarm." [595]
This quotation shows the way in which natural language can represent the events that occurredimmediately before the rupture. The model of this incident is constructed around a number of keyincidents, such as the �rst SCADA2 system report, for which the timing is known. It is importantto note that these proximal events cannot be viewed as catalytic because no argument is providedto demonstrate that they directly caused the incident. Of course, it is also possible to use naturallanguage to describe the more distal, latent causes of this failure. This again illustrates how thereconstruction of an incident is guided by implicit causal hypotheses. In this case, evidence aboutprevious excavations near the Marathon pipeline suggests that damage might have been causedduring these earlier operations:
\The investigation determined that in 1995, LaRoche Industries, Inc., arranged forexcavation of and repairs to various portions of its 8-inch pipeline, which was locatedabout 30 feet from the Marathon pipeline. These excavations took place in Septem-ber and October 1995 in the vicinity of the Marathon pipeline rupture... Accordingto oÆcials from LaRoche's contractor, the equipment operators were told by LaRochesuperintendents that no pipelines were located in the area of the Marathon pipeline."[595]
The previous quotations illustrate how prose descriptions can be used to draw upon various sourcesof evidence in order to reconstruct the events that led to an adverse occurrence. These natural lan-guage accounts must consider the many di�erent factors that contribute to the increasingly complexincidents that have been described in previous chapters. The following paragraphs brie y summarisethe types of information that must be captured. These can be loosely categorised as belonging tothree distinct stages in an `incident sequence'.
Initial Conditions
The initial conditions describe the normal operating state of the system and its environment beforean incident occurs. The following quotation illustrates how NTSB investigators describe the initialstate of the system as part of a passage that sets the scene for the failures that follow:

216 CHAPTER 8. COMPUTER-BASED SIMULATION
\On May 23, 1996, a pipeline controller was on duty in Marathon Pipe Line Com-pany's pipeline operations center in Findlay, Ohio, operating and monitoring a 68-mile-long segment of Marathon pipeline located in Louisiana. This pipeline is used to trans-port hazardous liquids between a re�nery at Garyville, Louisiana, and a station atZachary, Louisiana. Pumps at the Garyville re�nery pressurise the pipeline and gen-erate the power to transport the liquids to the Zachary station. About 9:53 p.m. centraldaylight time on May 23, the pipeline controller had just completed operations to trans-port a batch of unleaded gasoline through the pipeline. He then remotely executedcommands to introduce into the pipeline (behind the gasoline) a batch of 125,000 barrelsof low-sulfur diesel fuel." [595]
This excerpt establishes the general topology of the pipe network. It also introduces the controllers'tasks immediately before the incident took place. As can be seen, the initial conditions in a recon-struction describe the situation as it existed before any adverse incidents occurred. This introductorysection closes at the moment when the remote command was executed. At this point the pipelineruptures and the reconstruction continues with the �rst of the quotations cited in the previoussection.
It is important to emphasise that the initial conditions that are described by a reconstructionneed not be normative. They may not satisfy relevant safety regulations or recommended operatingpractices. In particular, the initial description of the system might indicate that there were frequentsafety violations during normal operation. For example, the NTSB overview of another pipe rupturedescribes how the company \had procedures in place at the time of the accident that were applicableto general construction activities in proximity to its pipelines, but it did not have procedures speci�cto directional drilling operations' [599]. These operating practices did not have adverse consequencesuntil the company attempted to install a distribution main parallel to a gas transmission pipe. Theproximity of the installation damaged the transmission pipe and this led to a rupture that the NTSBestimates cost in excess of $2 million.
Catalytic Failures
Reconstructions must also describe the events that helped to move the system from its initial condi-tion towards an eventual incident. These events include the catalytic failures that are often centralto any subsequent investigation. In many instances these are clear cut. For example, some pipelineruptures can be directly related to speci�c (catastrophic) events:
\About 4:50 a.m. on October 23, 1996, in Tiger Pass, Louisiana, the crew of adredge dropped a stern spud into the bottom of the channel in preparation for dredgingoperations. The spud struck and ruptured a 12-inch-diameter submerged natural gassteel pipeline owned by Tennessee Gas Pipeline Company. The pressurised natural gasreleased from the pipeline enveloped the stern of the dredge and an accompanying tug,then ignited, destroying the dredge and the tug." [594]
It is important again to reinforce the point that such events do not provide any direct explanationof the root causes of an incident. Such underlying causes are often embedded within the initialconditions that were mentioned in the previous paragraph. These conditions combine to create asituation in which catalytic events have the potential to trigger an incident or accident. For example,the dredging operation had to rely upon the gas company's practices and procedures for locating,marking, and maintaining markers for gas pipelines through navigable waterways. The potential fora catalytic event was also created by the lack of Federal requirements for placing and maintainingpermanent markers where gas pipelines cross navigable waterways.
It should also be emphasised that there are other incidents in which it is far harder to identifythe catalytic events that actually trigger a failure. For instance, in the incident in which directionaldrilling was cited as the root cause of the pipeline fracture, it is unclear as to which aspect of theoperation actually caused the failure. The rupture occurred as the distribution pipeline was beingreturned to full service and not as an immediate consequence of a catastrophic operation as was thecase in the dredging incident. Some evidence pointed to the fact that a reaming tool left gouge marks

8.1. WHY BOTHER WITH RECONSTRUCTION? 217
in the vicinity of the rupture but it is diÆcult to be certain of the precise operation that resultedin the eventual failure. In such circumstances, there must be some ambiguity or uncertainty in aneventual reconstruction of the catalytic events that contributed to an incident.
Liveness Conditions
There are, typically, several moments when operators or automated systems might have intervened inorder to prevent an incident. `Liveness' conditions, therefore, not only describe the catalytic eventsintroduced in the previous paragraph. They also reconstruct the manner in which these safeguardsfailed. In other words, liveness conditions also describe the events that enabled an incident toprogress towards its �nal consequences. For instance, the NTSB account of the gasoline releasedescribes how operators failed to detect and respond to the initial alarms from the SCADA system.Had they responded to these warnings sooner then the full consequences of the incident might havebeen considerably reduced:
\The pipeline controller continued to receive alarms. Initially, he acknowledged eachone individually, but believing that each subsequent alarm was related to operationsat the re�nery, he elected to simultaneously acknowledge all the alarms and the alarmtext messages without attending to the nature of each alarm... The controller said hecalled Garyville and discussed the situation with the station operator there. The stationoperator con�rmed the automatic pump shutdowns. The station operator determinedthat the Garyville re�nery was, indeed, loading product to a barge. Even though re�nerypersonnel reported that the volume of product being delivered was insuÆcient to havecaused the SCADA system to alarm, the pipeline controller and the station operatorconcluded that the loading of the barge had precipitated the alarms and the pumpshutdowns." [595]
To summarise, reconstructions must represent the initial conditions or context for an incident. Theymust also describe the way in which catalytic failures initiate the events leading to failure and howliveness conditions create the necessary conditions for an incident to develop. The following sectiondescribes the �nal component of any reconstruction; the events that take place in the aftermath ofan adverse occurrence.
Consequences
The reconstruction of an incident cannot simply stop at the point with catalytic events. It is atruism that more lives are lost through failures in the `golden hour' after an accident has occurredthan are killed by the catalytic events themselves. Chapter 6.4 has emphasised the importance ofincident reporting as a means of assessing an organisations ability to respond to or mitigate theadverse consequences of any failure. In consequences, reconstructions must go beyond the catalyticevents that are often the focus of attention in the aftermath of any incident. This point can bereinforced by the consequences of two further pipeline failures. On October 30th 1998, excavationwork damaged a 24-inch diameter gas main in Chicago. This released natural gas that ignitedabout forty minutes after the initial rupture. The immediate consequences of the failure includedsubstantial damage to a high-rise block of appartments. However, the prompt response to �re andpolice personnel completely evacuated the building so that no-one was injured. In contrast, a similarincident two months later left four dead, one person seriously injured and ten people, including two�re�ghters and a police oÆcer, with minor injuries:
\An engine company with a lieutenant and three �re�ghters arrived within minutesof �re department noti�cation. Fire�ghters attempted to take gas concentration read-ings with a gas monitor, but the monitor had not been calibrated in fresh air and gaveinvalid or unreliable readings. Fire�ghters continued to attempt readings with the im-properly calibrated instrument, all the while working in an environment in which theydescribed the gas smell as pretty bad. At no point did �re�ghters check buildings nearthe leak site to determine if natural gas was accumulating or to help assess the need for
218 CHAPTER 8. COMPUTER-BASED SIMULATION
a possible evacuation, even though the gas line was continuing to release gas that couldmigrate through the ground and into nearby buildings, where it could present a dangerof explosion. Two of the �re�ghters near the leak site returned to their truck as soonas two gas company employees arrived. It should have been obvious to the �re�ghtersthat a threat continued to exist and that the situation could worsen. The Safety Boardtherefore concludes that �re�ghters of the St. Cloud Fire Department responded quicklyto the scene of the leak; however, once on the scene, the �re�ghters actions did not fullyaddress the risk to people and property posed by the leak or reduce the consequences ofa possible �re or explosion." [604]
Many investigation authorities have placed increasing emphasis on response time targets for emer-gency services. This incident again illustrates that a prompt response must be backed up by e�ectiveactions if we are to mitigate the e�ects of such incidents. It is, therefore, necessary for reconstructionsto explicitly represent the actions that are taken in the aftermath of a catalytic failure.
Previous paragraphs have explained how it is important to reconstruct the initial conditionsthat create the context for any incident. It has also been argued that investigators must produce acoherent account of the catalytic failures that trigger those events that lead to an adverse occurrence.Liveness conditions must also be reconstructed. These represent the way in which defences mustbe breached and warnings ignored in order for a catalytic event to escalate into a major failure.Finally, it has been argued that reconstructions must also consider the consequences of any incident.These are partly shaped by the nature of the failure but also by the interventions that help tomitigate those consequences. However, there are relatively few bene�ts to be obtained from simplydeveloping accounts that describe how all of these events occurred during the course of an incident.The following paragraphs, therefore, identify ways in which reconstructions can be used to informthe investigation of an adverse occurrence and, ultimately, to reduce the likelihood of any recurrence.
8.1.1 Coordination
Chapter 6.4 has described how incident investigations draw upon the the work of many di�erentexperts. Forensic scientists, metallurgists, meteorologists, software and systems engineers as well ashuman factors experts all contribute to these enquiries. It can be diÆcult to coordinate the activitiesof these di�erent group. There is a risk that necessary tasks may be omitted or needlessly duplicated.It is, therefore, important that investigators have some means of monitoring and coordinating the�nite resources that they can deploy to support their enquiries into an incident. Reconstructionsprovide a useful tool to support these managerial tasks. They provide a model of the events leadingto an incident. Individuals with di�erent domain expertise contribute to di�erent aspects of thesereconstruction. For example, metallurgists can describe the conditions that might have contributedto catalytic metal fatigue. Human factors experts can identify salient events in a crews' responseto an incident. These di�erent contributions must be pieced together to form a coherent view of acomplex incident.
There are a number of ways in which experts contribute to the overall process of incident inves-tigation through their participation in any reconstruction. These can be summarised as follows:
� broadening the causal �eld. One of the key roles for any expert is to help broaden the causal�eld of any analysis. Chapter 6.4 explained how this �eld represents a subjective frame ofreference that individuals or organisations use when trying to explain what has happened in aparticular situation. If an event does not have an impact upon the causal �eld then it may notbe identi�ed as playing a signi�cant role in the course of an incident. Prior expertise plays asigni�cant role in knowing where to �nd the evidence that indicates certain events have takenplace. Without this expertise, evidence might not be found and a reconstruction might notinclude necessary information about an incident. .
� determining the salience of events. In contrast to the experts' role in broadening a causal �eld,they may also identify certain events as not playing a signi�cant role in a particular incident.These events might then be omitted from any subsequent reconstruction. There is, of course,

8.1. WHY BOTHER WITH RECONSTRUCTION? 219
a potential danger in this if those events later emerge as having a more important role incourse of events. It is, therefore, important to document the reasons for such omissions. Itis also important to stress that reconstructions support but do not replace causal analysis.For example, it is often impossible for any single expert to diagnose the root cause of anincident without referring to the work of their colleagues. In consequence, investigators usereconstructions to provide an overview of the evidence that is collected about the diverse eventsthat lead to an incident. This overview of events must then be interpreted and analysed todistinguish between contextual factors, contributory factors and root causes. Techniques thatsupport this causal analysis will be described in the next chapter. In contrast, this chapterfocuses on techniques that can be used to reconstruct the ` ow' of events leading to an incidentand the consequences that stem from such failures.
� determining knock-on e�ects of events. By participating in any reconstruction, experts are alsoforced to consider the ways in which events in other areas of a system can a�ect their area ofexpertise. For instance, a human factors expert must consider the impact of prevailing weatherconditions if a meteorological experts have indicated that this may be a factor. Conversely,building a reconstruction can also help investigators to identify the knock-on consequences thatparticular events will have throughout a system. This is a by-product to the tasks involvedin developing a narrative account that links together the evidence that is available in theaftermath of an incident.
� eliminating particular events. The development of a reconstruction can force analysts to de-termine whether or not particular events actually did contribute to an incident. For example,the Minnesota pipeline investigation initially questioned whether the location of the line hadbeen incorrectly marked out. Evidence had to be provided to determine whether this was apotential problem before any detailed reconstruction could be built. If it had been incorrectlymarked out then additional resources would have been deployed to examining the events thatcontributed to this failure. However, the NTSB investigation determined that \the markedlocation of the ruptured gas line was accurate and therefore not a factor in this incident" [604].As a result, the prose description of the incident does not focus in great detail on the initialsurveying of the line.
� forcing the resolution of inconsistency. As investigators contribute to the development of areconstruction, it is likely that a number of inconsistencies and omissions will be identi�edin the overall timing of events. As we shall see, other anomalies can arise. For example,eye-witness testimonies often place the same individual at two di�erent locations at the samemoment in time. Such inconsistencies can be resolved by �nding evidence to discount onestatement. Alternatively, two or more alternative reconstructions can be developed to exploreseveral di�erent incident scenarios. However, contradictory witness statements are not theonly source of inconsistency in incident reconstructions. Other problems relate to the groupprocesses that a�ect incident investigation teams. As mentioned, these enquiries often involveheterogeneous teams of domain experts. The members of these groups often have di�erentbackgrounds and training. Partly as a result of this, the conclusions of one analyst aboutthe probable ordering of events need not accord with those of another. For example, the FireService and Ambulance accounts of the Clapham rail crash di�er in several important respects[502]. If these problems are not resolved during the reconstruction phase then there is a dangerthat any causal analysis will be jeopardised because of contradictions in the evidence that itrelies on. There is also the danger that the eventual incident report will contain inconsistentinformation about the sequencing of events leading to and stemming from catalytic failures.
A number of important consequences stem from this use of reconstructions as a means of coordinatingthe various activities that contribute to an incident investigation. In particular, natural languagedescriptions, interactive computer simulations or other diagrammatic techniques must be capableof capturing the key events identi�ed by di�erent domain experts. It is also important that thosedomain experts can read and understand the resulting reconstructions if they are to validate themodels that are produced. This is a non-trivial requirement. The complexity of many incidents

220 CHAPTER 8. COMPUTER-BASED SIMULATION
makes it diÆcult to trace the ways in which system `failure' and operator `error' interact over time.For example, many incident reports now run to several hundred pages of prose narrative.
8.1.2 Generalisation
Incident investigations are intended to determine what caused a failure and to identify means ofpreventing any recurrence. As we have seen, reconstructions play an important role in validatingthe evidence that, in turn, supports subsequent causal analyses. They also play an important rolein identifying ways in which an incident can recur. The process of identifying those events thatcontributed to a particular incident helps to inform subsequent investigations to determine whetherthose events might recur in isolation or in combination with other failures. In other words, in orderto identify the general causes of future incidents it is important to understand the causes of theparticular incident under investigation [678]. Those causes can only be accurately established byensuring the validity of any reconstruction.
An important application of reconstruction techniques is in the development of training sce-narios. These, typically, start with the events that lead to previous failures. For example, thefollowing citation comes from an NTSB incident report that explicitly considered the ways in whichreconstructions of previous incidents were used by some utility companies to drive simulation-basedtraining:
\The UGI's emergency plan requires each employee who is responsible for respondingto emergencies to participate in annual simulation board exercises. Each exercise isprepared by the UGI's distribution engineering personnel and includes scenarios abouta system shutdown or loss of a major gas supply line, a shutdown or loss of a districtregulator station, or a major line break within the distribution network. The scenariomay be based on previous incidents or on incidents described in Safety Board reports.Each exercise must include a step-by-step analysis of the procedures for investigating,pinpointing, and repairing leaks and of the procedures for taking emergency actions andprotecting people and property." [589]
These simulations can be used to determine how well teams can cope with the situations thatpreviously confronted their colleagues. However, crews seldom intervene in exactly the same manneras their colleagues. As a result, their actions help to shape new scenarios that di�er from the eventsthat occurred in the original incident. Simulation based training, therefore, enables crews to exploremore general forms of failure that are based on the particulars of a singular incident. This closerelationship between training and reconstruction is emphasised in the Rand report into the NTSB:
\The NTSB should review its internal technical capabilities to support future accidentinvestigations, including the potential for crash reconstruction and the requirements forsystem testing in support of complex accident investigations. The safety boards long-term requirements for facilities should include consideration of their use for sta� training,recognizing that facilities can serve a dual function." [482]
It is to be hoped that future incidents will not occur in exactly the same way as previous incidents.If they do then this clearly indicates the failure of a reporting system to address the underlyingcauses of any failure. However, it is not clear how the particular details of an adverse occurrencecan be used to anticipate other, more general forms of future failure. The following list identi�esa number of ways in which reconstructions can be manipulated to support this form of analysis.The intention is to manipulate the reconstruction in order to either identify training scenarios or toensure that any recommendations address a wide range of potential future failures:
� transposition of events. The most obvious way of generating alternative incident scenarios fromany narrative of a particular incident is to alter the sequence of particular failures. For example,in the Garyville incident mentioned in previous sections, a reconstruction might simulate therupture before, during or after the completion of the controller's transportation command onthe batch of unleaded diesel. It is important to stress that the undirected transposition of
8.1. WHY BOTHER WITH RECONSTRUCTION? 221
events will not always lead to failure scenarios. It can also lead to scenarios that might seemextremely implausible. For instance, it seems unlikely that the supervisory control and dataacquisition (SCADA) system might generate the high-pump pressure alarm before the pipefailure event. The irony is that many engineers and designers have failed to adequately accountfor those scenarios that were dismissed as implausible before they occurred [65].
� omission of adverse events. A further means of generating alternative scenarios is to omitsome of the failures that arose during a previous failure. This can simplify the demands thata training scenario may place upon system operators. Additional complexity can be graduallyintroduced as teams become more skilled in responding to an adverse situation. This exploitsthe `training wheel' approach in which supports are gradually removed from operators as theircon�dence grows [155]. A particular bene�t of this approach is that it can be used to prioritizethe allocation of resources to improve system defences. For example, the NTSB report intoMinnesota explosion hypothesised that \had the gas line in this accident been equipped with anexcess ow valve, the valve may have closed after the pipeline ruptured and the explosion maynot have occurred" [604]. This assertion can be tested both using laboratory simulations of thegas ow within the system. Operator performance can also be assessed by reconstructing thecourse of an incident as though this defence had existed. If the crew can consistently respondto correct and mitigate these alternative scenarios then the proposed defences can be shownto o�er some protection. If crews cannot mitigate a failure with these defences then they areunlikely to provide suÆcient protection.
� exacerbation of adverse events. Reconstructions not only provide scenarios that can be usedto assess the e�ectiveness of potential defences, they can also be used to assess the conse-quences that may ensure if existing defences are compromised. As we have seen, one of thekey di�erences between incidents and accidents is that particular safety features intervene tomitigate the consequences of failure. We have already argued that an important componentof any incident investigation is to determine the `worst plausible outcome' . These scenariosare again critical both in guiding training and in assessing the potential e�ectiveness of anyremedial actions. For example, the following citation illustrates how NTSB investigators oftenconsider the circumstances that might have exacerbated any failure:
\In this accident, the speed and extent of the gas release and �re placed allcrew-members aboard the dredging vessels in grave danger. Fortunately, despitethe early hour, most crewmembers were awake, alert, and able to respond quicklyto the emergency. Given the rapid ignition of the natural gas and the extent ofthe damage to the vessels, had this accident occurred while most of the crew wassleeping, numerous serious injuries or fatalities may have occurred. The Safety Boardconcludes that in even a slightly more serious accident, Beans emergency procedures,because they did not require that a precise count be kept of the number of personnelon board the companys vessels at all times, would have been inadequate to accountfor and facilitate the rescue of missing crewmembers, increasing their risk of seriousinjury or death." [594]
Compound simulation techniques provide another means of preparing for plausible worst casescenarios. This approach combines elements of one incident with events that occurred duringanother previous failure. The result is to create hybrid incidents that blend multiple problemsidenti�ed during previous incidents. This approach is motivated by Reason's plea not toconsider failures in isolation [702].
There are a number of further problems that a�ect the generalised use of simulations to investigatepotential failures. In particular, it is diÆcult to accurately reproduce operator behaviours under`experimental' conditions. However, such caveats have to be balanced against the bene�ts thatreconstructions provide in generating the `what if' hypotheses that direct future development.

222 CHAPTER 8. COMPUTER-BASED SIMULATION
8.1.3 Resolving Ambiguity
A key bene�t of reconstruction is that it helps investigators to identify omissions and inconsistenciesin the evidence that they gather about an incident or accident. This can be illustrated by the NTSBreport into the St. Cloud pipeline failure:
\At about 10:50 a.m. on December 11, 1998, while attempting to install a utility polesupport anchor in a city sidewalk in St. Cloud, Minnesota, a communications networkinstallation crew struck and ruptured an underground, 1-inch-diameter, high-pressureplastic gas service pipeline, thereby precipitating a natural gas leak. About 39 minuteslater, while utility workers and emergency response personnel were taking preliminaryprecautions and assessing the situation, an explosion occurred. " [604]
This high-level summary is typical of the sparse information that may be available in the immediateaftermath of an incident. Lack of evidence can prevent investigators from building more detailedreconstructions of the events that contributed to a failure. However, it is possible to use such prosedescriptions to help target those events that deserve closer scrutiny. One technique is to scruti-nize these narratives in order to identify any ambiguities that require further clari�cation. Theseambiguities partly stem from the exible ways in which investigators can use natural language tosupport a number of di�erent interpretations based on the same sentence. For example, the previousquotation includes the observations that the pipe was ruptured by the crew `while attempting toinstall a utility pole support anchor in a city sidewalk...'. This abstract description could refer to anynumber of more detailed procedures that the crew could have been performing in order to achievetheir goal of installing the utility pole. They might have been drilling, using a sledgehammer tobreak the sidewalk, using an auger to secure the anchor etc. If the exact operation that was beingperformed at the moment of the rupture was critical for a more detailed understanding of the courseof events, as is likely to be the case, then investigators must gather more detailed evidence aboutthe crews' actions. The following list, therefore, identi�es a number of di�erent forms of ambiguitythat can occur in natural language reconstructions, or accounts, of safety-critical incidents:
� ambiguity of time. The previous account referred to real-time, `10:50am' and `About 39minutes later...'. It also used less precise relative timings that are implicit in phrases such as`while attempting', `thereby precipitated'. An important strength of such descriptions duringthe initial stages of investigation is that it is possible to construct models that describe severaldi�erent real-time orderings for the events that are identi�ed. For example, the phrase `About39 minutes later...' describes possible reconstructions in which the explosion occurred at 38,39 or 40 minutes after the initial rupture. The scope of the interval is only bounded by thereaders' interpretation of `about 39 minutes'. These slightly vague timings can be made moreconcrete as further evidence is obtained. However, there are also examples where exact timingscannot ever be con�rmed. For example, the time-line of events are often incomplete [589]:Alternatively, if the timing information is not considered signi�cant to the overall analysis
Time Event6:48 p.m. The EPAI foreman called the home of the EPAI Vice
President.6:?? p.m. The foreman instructed his crew to trace the gas line
back toward Utica Street to shut o� the gas valve.6:50 p.m. The EPAI foreman called the UGI emergency tele-
phone number, advising that they de�nitely hit thegas line and broke it.
Table 8.1: Excerpt from the Incomplete Time-line of a Gas Explosion
investigators may deliberately choose not to expend �nite resources in resolving such ambiguity.All of this contrasts sharply with many of the computer based simulations that we shall explore
8.1. WHY BOTHER WITH RECONSTRUCTION? 223
in subsequent sections, these typically require that investigators commit themselves to preciseintervals in which events can occur.
� ambiguity of place. The previous account only provides a high level view of the events thatcontributed to the incident. As we have seen, the US Air Force requires that investigatorsprovide maps of the relative movements of aircraft during an incident. The use of terms suchas `in a city sidewalk in St. Cloud' provide an insuÆcient level of detail for most investigations.Clearly, any secondary investigation would be expected to produce a more detailed survey ofthe incident. This illustrates the important observation that any reconstruction will, typically,have to exploit a variety of media if it is provide a complete overview of the many di�erentsorts of information that must support any subsequent causal analysis. Increasingly this mayinclude video footage as well as graphical sketched and textual accounts.
� ambiguity of action. The previous summary uses natural language to provide a high-level viewof the events leading to the incident. As mentioned, this use of prose provides considerablebene�ts in terms of exibility and comprehension. It supports multiple interpretations whennecessary evidence is not available. Additional details can be introduced as they are gathered.These comments not only apply to the representation of time and place, it also refers to theaccount of the crews' actions. Phrases such as `while utility workers and emergency responsepersonnel were taking preliminary precautions' provide few insights into their actions. Again,evidence must be gathered to determine whether or not their precautions had a signi�cantimpact upon subsequent events. There are further bene�ts of ambiguity in the representationof actions. For example, it is possible to indicate that a crew member performed certain taskswithout describing the components, or sub-tasks, that this might have involved. This providessigni�cant bene�ts if, for instance, these components can be understood from the context ofthe actions. Problems will, of course, arise when other members of the investigation team donot have the necessary domain knowledge to interpret what this task might have involved.It may also cause problems if, in fact, necessary sub-tasks were either omitted, duplicated orinterrupted. Such complexities are masked by this ambiguous action description.
� ambiguity of motivation. The previous account provides little information about the potentialfactors that motivated the crew's decision to anchor the utility pole in that particular location.As with the other forms of ambiguity; there are multiple reasons why natural language descrip-tions avoid spelling out such factors. In the aftermath of an incident, it can be very diÆcultto gather objective evidence to support explicit interpretations of individual performance. Itis also the case that many investigators lack the human factors training to be con�dent inproposing more explicit models of the cognitive and perceptual factors that in uence operatorbehaviour. Most reconstructions entirely avoid representing or reasoning about the internalcognitive factors that motivate particular actions. Both natural language descriptions andcomputer-based simulation techniques, typically, therefore, focus on observable actions only.
� ambiguity of cause. The previous description is ambiguous about what exactly caused theincident. It might have been caused by the gas service provider failing to document the positionof its pipeline. It might also have been caused by mistakes in siting the anchor for the utilitypole. Although these both contributed to this singular incident, it is unclear whether either isnecessary and suÆcient in the general case. Partly as a result of this causal ambiguity, manyinvestigation agencies deliberately separate the process of �nding out what happened fromexplaining why it occurred [423]. We have, however, argued that these activities are stronglylinked. Reconstructions help to validate and guide causal hypotheses. Later sections will arguethat it is, therefore, extremely important that tools and techniques be provided to link thesetwo complementary activities. In particular, it is important that causal ambiguities should notbe left in a �nal report so that the reader is left in considerable doubt about the root causesof an incident.
The previous paragraphs have tried to emphasise that there are often good reasons for ambiguity inthe initial reconstruction of an incident. For example, temporal ambiguity can occur because there
224 CHAPTER 8. COMPUTER-BASED SIMULATION
may not be suÆcient evidence to determine the exact moment at which an event occurred. Evenin the later stages of reconstruction, ambiguity still plays an important role in the communicationof information about complex failures. For example, ambiguity of action can help to abstract awayfrom the exact sub-tasks that an operator or system performed if those sub-tasks can be assumedfrom the surrounding context of the description and those sub-tasks did not play a signi�cant rolein the course of an incident. The following paragraphs summarise several of these reasons whyambiguities may remain in reconstructions of the events leading to failure.
As mentioned, there may not be the evidence available to provide de�nitive information aboutthe speci�c course of events leading to an incident. The following synopsis illustrates how in somesituations it is only possible to gather super�cial facts about the course of an incident. This inci-dent involved a relatively small business jet. Without an advanced ight data recorder or detailedinformation about the pilot's actions it is diÆcult to reconstruct the detailed events that led tothis incident. The aircraft was destroyed and the instrument rated private pilot was fatally injured.Visual meteorological conditions prevailed at the time of the accident. Winds were 170 degrees at16 knots gusting to 22 knots. No ight plan was on �le
\The vertical and horizontal stabilizers had some skin wrinkling, but little evidenceof ground impact. Both propellers displayed forward bending, chordwise dirt streaks andhad dug into the ground, burying the spinners. No engine anomalies were found. Nocontrol anomalies were found. Fuel was present at the scene, and all tanks were ruptured.Fuel was found in the lines to both engines." [588]
This incident provides an extreme example of the uncertainty and ambiguity that can arise wheninvestigators cannot access some of the sources of evidence mentioned in previous chapters. However,it is also important to stress that similar problems may also arise from the failure of data recorders.This topic was addressed in Chapter 6.4. Ambiguity is also likely to a�ect the initial stages ofreconstruction before all of the available sources of evidence can be retrieved and analysed .
Ambiguity also occurs if there is genuine uncertainty about the events leading to an incident.For example, the following NTSB incident report describes how it may sometimes not be possibleto resolve contradictions in witness statements:
\During the takeo� roll directional control was lost and the aircraft rolled o� the leftside of the runway. Heavy braking was applied in order to stop short of a fence andthe aircraft nosed over inverted. Both occupants were rated pilots. Their statementswere contradictory. It was not determined which pilot was manipulating the controls orserving as pilot in charge at the time of the accident." [586]
In other circumstances, it is often possible to build a number of alternative reconstructions thatre ect di�erent hypotheses about the events leading to an incident. The apparent contradictions inthe evidence can be addressed by constructing several models; each of which assumes that one par-ticular version of events is the correct one. It is then possible to inspect the resulting reconstructionsto determine which version of events is the most likely given the balance of evidence. For example,another NTSB incident report describes how a pilot lost control of their aircraft during an acrobaticmaneuver [587]. Some witnesses stated that incident occurred when the aircraft was performing anoutside loop. Others stated that the failure occurred during an inside loop. Two reconstructionscan be developed to re ect each of these possible hypotheses about the sequence of events beforethis incident.
Ambiguity also arises when investigators cannot be con�dent in the evidence that they haveobtained about the course of an incident. In extreme cases, this can arise when there are only thirdparty statements about what might have happened. For instance, the following incident report reliesupon a witness observation of an aircraft that has still not been located:
\The pilot signed the pilot authorisation form to rent the airplane on December 25,1994, about 13:25. Before departure both wing fuel tanks were �lled at the request of themissing pilot. The time of departure has not been determined and there was no evidenceof contact with any FAA ATC facility. A witness reported seeing a low wing airplane

8.1. WHY BOTHER WITH RECONSTRUCTION? 225
about 18:00 local 300-500 feet above ground level ying Westbound. He reported thatthe engine was sputtering when the airplane ew over his house. The missing airplanedid not return to the departure airport..." [590]
In this case the narrative description that `models' the course of events leading to the failure doesnot explicitly state that the aircraft observed by the witness was the missing Piper. This ambiguityis intentional; it may or may not have been this aircraft. It re ects the lack of certainty about thecourse of an incident whose causes could not be determined.
Ambiguity can be used to hide the underlying complexity of particular aspects of an incident.This is important if reconstructions are to provide investigators with an overview of an incident. Ifall of the details of a metallurgical or meteorological analysis were included then there is a dangerthat individuals might become `bogged down' in less salient information. As a result, summariesare supported by further references to other documents that can be accessed to obtain additionaldetail if required. Chapter 13.5 will describe some of the problems that this style of reconstructioncan cause for the readers of an incident report. For now it is suÆcient to observe that ambiguityoften occurs because of the abstraction or �ltering process that is used to construct an overview ofcomplex failures. As we shall see, however, it is critical that this process does not have the side-e�ectof hiding critical information about the course of events that contribute to a failure.
This section has presented a number of reasons why ambiguity can arise in the reconstructionof safety-critical incidents. In other words, we have shown that there are coherent reasons whyinvestigators may simultaneously provide di�erent accounts of the events that contribute to a singlefailure. However, this ambiguity also creates a number of potential problems. Firstly, there is adanger that any ambiguity in the initial stages of an investigation will not be adequately resolvedby the time that a �nal report is issued. The previous paragraph described an incident in whichit was not possible to identify the events that contributed to a aircraft going missing. In suchcircumstances, ambiguity cannot be adequately resolved and this is explicitly stated in the NTSBreport. However, other incident reports are signi�cantly weakened by ambiguities that seem to havebeen overlooked or ignored by the investigators. For instance, Johnson describes how one maritimeincident report fails to describe what crew members were doing in the critical moments before acollision occurred [415]. In consequence many who read the report were left unconvinced about theinvestigators condemnations of the crews' actions during that interval.
There is also a danger that ambiguity can lead to misunderstanding. The use of ambiguity andabstraction supports several di�erent interpretations of the meaning of a sentence. However, as aresult there is a danger that investigators will read more into an account than was intended by theauthor. Conversely, they may fail to identify the intended meaning of a high-level reconstruction. Itcan be diÆcult to determine whether multiple interpretations re ect genuine uncertainty on the partof the writer or whether ambiguity is the result of necessary abstraction from underlying complexity.For example, some of the incident narratives cited in previous paragraphs do not provide informationabout meteorological conditions. Others omit information about the role of Air TraÆc personnel. Inthe initial stages of an investigation, it can be diÆcult for the reader to know how to interpret theseomissions. It might be assumed that there were no air traÆc events contributed to the incidentunless they are speci�cally mentioned. This interpretation need not be correct, for instance, ifair traÆc logs were still being assembled. Such problems can be minimised by introducing rulesthat force investigators to explicitly state when certain events did NOT contribute to an incident.For instance, NTSB incident synopses often exploit this approach. However, many regulators haveintroduced taxonomies that the categorise many di�erent events that might lead to an adverseoccurrence [718]. It is clearly impracticable to explicitly state when each of these events does notcontribute to an incident.
A �nal problem is that ambiguity can arise from the medium in which a reconstruction is pre-sented. As we have noted, natural language o�ers a exible and expressive medium of commu-nication. However, this power is achieved precisely because it permits ambiguity. Multiple inter-pretations are simultaneously supported by the use of imprecise language. Ideally this imprecisioncan be resolved in the �nal report on an incident by the introduction of additional evidence as itbecomes available. However, as we have noted, there are many instances in which imprecision andambiguity have persisted into the �nal versions of an incident report. There are further related
226 CHAPTER 8. COMPUTER-BASED SIMULATION
problems. In particular, there are some properties that are inherently diÆcult to represent withinnatural language. For instance, it can be diÆcult to describe the way in which concurrent events cansimultaneously occur across many of the di�erent distributed systems that are involved in complexincidents. If these events are groups according to the systems that generated them then readers geta good idea of what happened to that particular system over time.
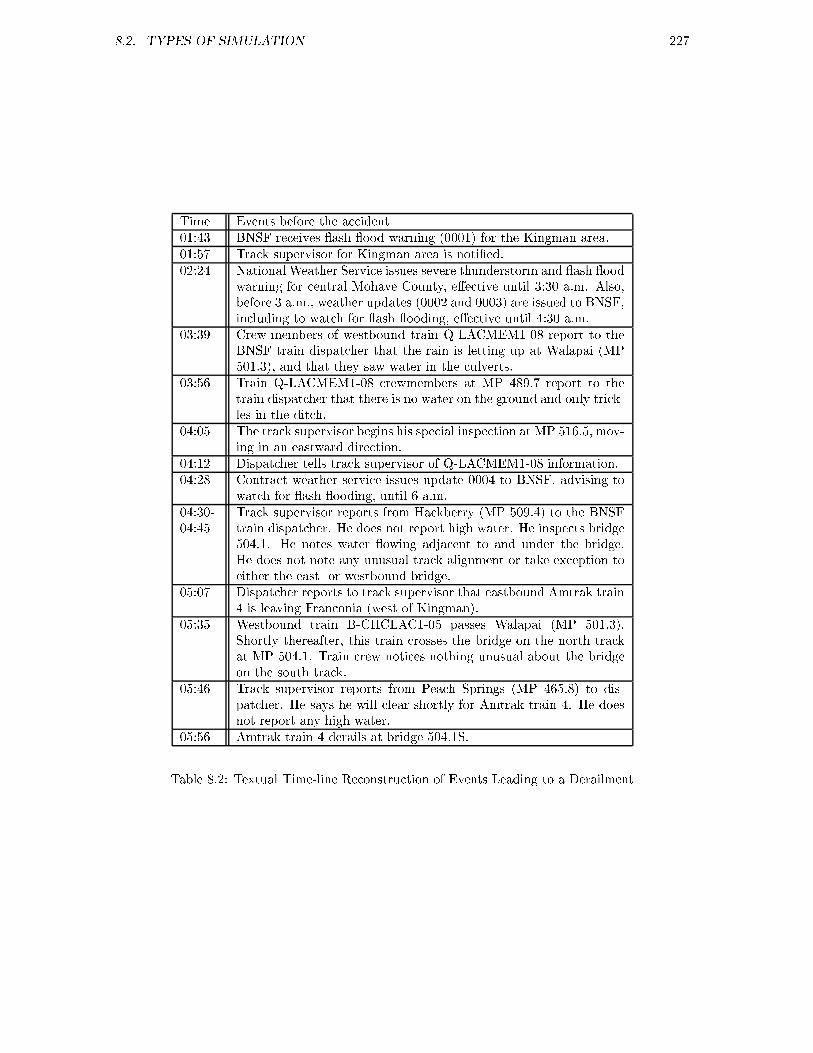
However, it can be diÆcult to gain an overview of what else was occurring throughout theapplication at any particular interval. Conversely, if a purely temporal sequence is exploited thenit may be easier to see what events were happing at each moment in time. However, readers willhave to piece together the individual events that occurred within a particular subsystem. A numberof techniques can be used to address these limitations. For example, many incident reports containtext-based time-lines. These are constructed using a tabular form that lists the most salient eventsthat contribute to a particular failure. These are recorded in the order in which they are presumedto have occurred during an incident. The investigator then notes down the time at which each eventoccurred as an entry in the table. Table 8.1.3 illustrates this approach. It provides an overview ofthe ways in which various events contributed to a derailment [605].
A limitation with this approach is that particular events can become lost amongst the manydi�erent items that are recorded in this tabular overview. As a result, some investigators also producemore detailed tabular time-lines that focus on the events that occurred in a particular subsystem orthat in uenced particular aspects of an incident. For example, Table 8.1.3 focuses on meteorologicalconditions during the grounding of a tug [603]: The time-line shown in Table 8.1.3 illustrates asimilar approach [601]. In this incident, a table is used to chart the timing of an emergency responseto a highway incident. There can, however, be considerable overheads involved in ensuring thatthese multiple time-lines provide a consistent account. It can also be diÆcult to ensure that anychanges in the ordering of a particular time-line, such as those shown in tables 8.1.3 and 8.1.3, arere ected by consistent updates to an overall time-line, such as that shown in Table 8.1.3. Theseproblems are compounded by the diÆculty of gaining an accurate overview from many pages of prosedescriptions. It can often be diÆcult to visualise the ow of events that contribute to particularadverse occurrences. What we need, therefore, are tools and techniques that can be used to explicitlycapture properties of an incident, such as the temporal ordering of events, that are diÆcult toreconstruct using prose narratives. It should also be possible to use these descriptive techniques toidentify any potential inconsistencies or ambiguities that might exist in the reconstruction. If thesestem from a lack of evidence then either further investigations must be initiated or the �nal reportmust acknowledge the ambiguity. If inconsistencies are the result of clerical errors in drafting thereport then they should be recti�ed. The following section introduces a range of techniques thathave been proposed to satisfy these requirements for the reconstruction of incidents and accidents.
8.2 Types of Simulation
The previous pages have argued reconstruction techniques help to piece together the evidence thatis derived from primary and secondary investigations. This, in turn, helps to determine whethernecessary evidence is missing or whether there are any contradictions within the evidence that hasalready been gathered. Reconstruction techniques can also be used in a more subjunctive fashion.By this we mean that analysts can generalise beyond what is known about a particular incident toassess what might have happened under a number of alternative versions of events. As mentionedpreviously, we distinguish between two di�erent forms of reconstruction. This chapter focuses on theuse of computer-based simulations. These are an increasingly popular means of visualising the eventsthat lead to safety-critical incidents. For instance, sketching tools can be used to derive simple story-boards. Alternatively, digital animation systems support more complex, interactive presentations ofadverse occurrences. CAD-CAM tools can also be used to build detailed models of the behaviourof physical systems. Virtual reality systems can be used to drive immersive, interactive simulationswith varying degrees of `realism'. A distinguishing feature of all of these approaches is that they relyon computer-based tools to help analysts visualise the course of an incident. In contrast, Chapter 8.3looks alternative approaches that do not rely so much on the use of computer-based simulations. A
8.2. TYPES OF SIMULATION 227
Time Events before the accident01:43 BNSF receives ash ood warning (0001) for the Kingman area.01:57 Track supervisor for Kingman area is noti�ed.02:24 National Weather Service issues severe thunderstorm and ash ood
warning for central Mohave County, e�ective until 3:30 a.m. Also,before 3 a.m., weather updates (0002 and 0003) are issued to BNSF,including to watch for ash ooding, e�ective until 4:30 a.m.
03:39 Crew-members of westbound train Q-LACMEM1-08 report to theBNSF train dispatcher that the rain is letting up at Walapai (MP501.3), and that they saw water in the culverts.
03:56 Train Q-LACMEM1-08 crewmembers at MP 489.7 report to thetrain dispatcher that there is no water on the ground and only trick-les in the ditch.
04:05 The track supervisor begins his special inspection at MP 516.5, mov-ing in an eastward direction.
04:12 Dispatcher tells track supervisor of Q-LACMEM1-08 information.04:28 Contract weather service issues update 0004 to BNSF, advising to
watch for ash ooding, until 6 a.m.04:30-04:45
Track supervisor reports from Hackberry (MP 509.4) to the BNSFtrain dispatcher. He does not report high water. He inspects bridge504.1. He notes water owing adjacent to and under the bridge.He does not note any unusual track alignment or take exception toeither the east- or westbound bridge.
05:07 Dispatcher reports to track supervisor that eastbound Amtrak train4 is leaving Franconia (west of Kingman).
05:35 Westbound train B-CHCLAC1-05 passes Walapai (MP 501.3).Shortly thereafter, this train crosses the bridge on the north trackat MP 504.1. Train crew notices nothing unusual about the bridgeon the south track.
05:46 Track supervisor reports from Peach Springs (MP 465.8) to dis-patcher. He says he will clear shortly for Amtrak train 4. He doesnot report any high water.
05:56 Amtrak train 4 derails at bridge 504.1S.
Table 8.2: Textual Time-line Reconstruction of Events Leading to a Derailment

228 CHAPTER 8. COMPUTER-BASED SIMULATION
1:57 p.m.: winds S-SE/ 25 knots, seas 6 to 8 feetabout 3 p.m.: winds 26 to 36 knots, seas 10 to 12 feet4:30 p.m.: seas 25 to 30 feet5 p.m.: winds S-SE /40 to 50 knots, seas 20 to 30 feet
Table 8.3: Textual Time-line of Meteorological Events in a Grounding
Time Time frominitialnoti�cation
Action
05:53 00:00 Initial 911 call received by WCSD dispatch05:54 00:01 EMS dispatched05:56 00:03 Two Slinger Police Department units arrived on
scene06:02 00:09 SFD command vehicle arrived on scene06:07 00:14 First EMS unit arrived06:19 00:26 Flight for Life dispatched from Milwaukee06:38 00:45 Flight for Life arrived on scene06:52 00:59 Ambulance delivered �rst van victim to area hospital08:01 02:08 Flight for Life helicopter delivered second van victim
to trauma center12:28 06:35 Northbound lanes of US 41 reopened14:03 08:10 Southbound lanes of US 41 reopened; area cleared
Table 8.4: Textual Time-line of Emergency Response to Road Accident
range of formal and semi-formal notations are used to model the events leading to a gas pipelineexplosion. A number of further features distinguish these graphical and textual notations fromthe approaches in this chapter. In particular, the following computer-based simulations typicallylack any formal underpinning. They are the product of iterative development and the subjectiveintrospection of analysts. As we shall see, this provides great exibility in the range of modelsthat can be constructed. However, it also creates a number of practical problems. For example, inmany virtual reality simulations it is entirely possible to break the rules of time and space. Thesame individual can be represented in two di�erent places at the same time during an incident.In contrast, formal and semi-formal models are often supported by precise rules about what can,and what cannot, be represented. They provide mechanisms that help to identify omissions andinconsistencies, such as that mentioned above.
Some formal and semi-formal modelling techniques are supported by computer-based tools.Computer-based simulations can be directly derived from some abstract notations [720]. The distinc-tions between computer-based simulations and abstract models are, therefore, often blurred. Thesedistinctions are retained, however, because they help to identify two di�erent sets of concerns aboutthe reconstruction of safety-critical incidents. For instance, formal mathematically-based notationscan be diÆcult to interpret by non-mathematicians. In contrast, interactive simulations can oftenlead to unwarranted interpretations if analysts are seduced by particular animation techniques.
8.2.1 Declarative Simulations
One class of computer-based reconstructions can be described as `declarative simulations'. Declara-tive models describe aspects of a system that do not change during the course of an incident. At �rstsight, this de�nition seems to go the general idea that a reconstruction should provide an overviewof the events leading to an incident. As we shall see, however, these declarative simulations can beused to illustrate the state of a system before and after an event. For instance, they can be used to

8.2. TYPES OF SIMULATION 229
illustrate the impact of a component failure upon the integrity of a hardware assembly. Sequencesof these more static simulations can, therefore, be used to build up an impression of change overtime. It is also possible to integrate declarative simulations with other forms of reconstruction tocombine a static model of the system with more dynamic views of an incident.
Maps and Plans
Maps and plans provide important information about the environment in which many incidentstake place. They can be annotated to denote the position of key objects and individuals before anincident occurs. Further annotations can be used to indicate the changing position of those objectsat various moments during an incident. As with many of the techniques described in this chapter,it is perfectly possible to exploit this approach manually. We have, however, chosen to focus oncomputer-based techniques because they represent a signi�cant area of innovation and developmentin incident reporting.
Figure 8.1: Imagemap Overview of the Herald of Free Enterprise
Figure 8.1 illustrates a plan based approach to incident and accident reconstruction. It presentsan imagemap of the Herald of Free Enterprise . Thanks are due to The Motor Ship and V. Berris(FSIAD) provided the sectional diagram of the Spirit of Free Enterprise. The interactive recon-struction was developed in collaboration with Anthony McGill [531]. The cross-sectional diagramprovides an overview of the layout of the ship that would not have been possible from an externalphotograph. The labels are used to indicate areas of the ship that played a particularly signi�cantrole in the course of the accident. The image is presented in a web browser so that it is available toother investigators over an intranet. This technology provides additional advantages. For instance,users can select areas of the image to request more detailed information about particular areas ofthe ship.
Figure 8.2 shows how users can select particular areas of the vessel shown in Figure 8.1 to requestmore detailed information about the incident. This information can take a number of di�erent forms.

230 CHAPTER 8. COMPUTER-BASED SIMULATION
Figure 8.2: Imagemap Detail of the Herald of Free Enterprise
For instance, if the user selects the bow doors they are presented with a range of engineering andconstruction information:
\Situated at the bow of the G Deck, the bow doors were double weathertight doorsof welded steel construction with a clear opening of 6.0m x 4.9m."
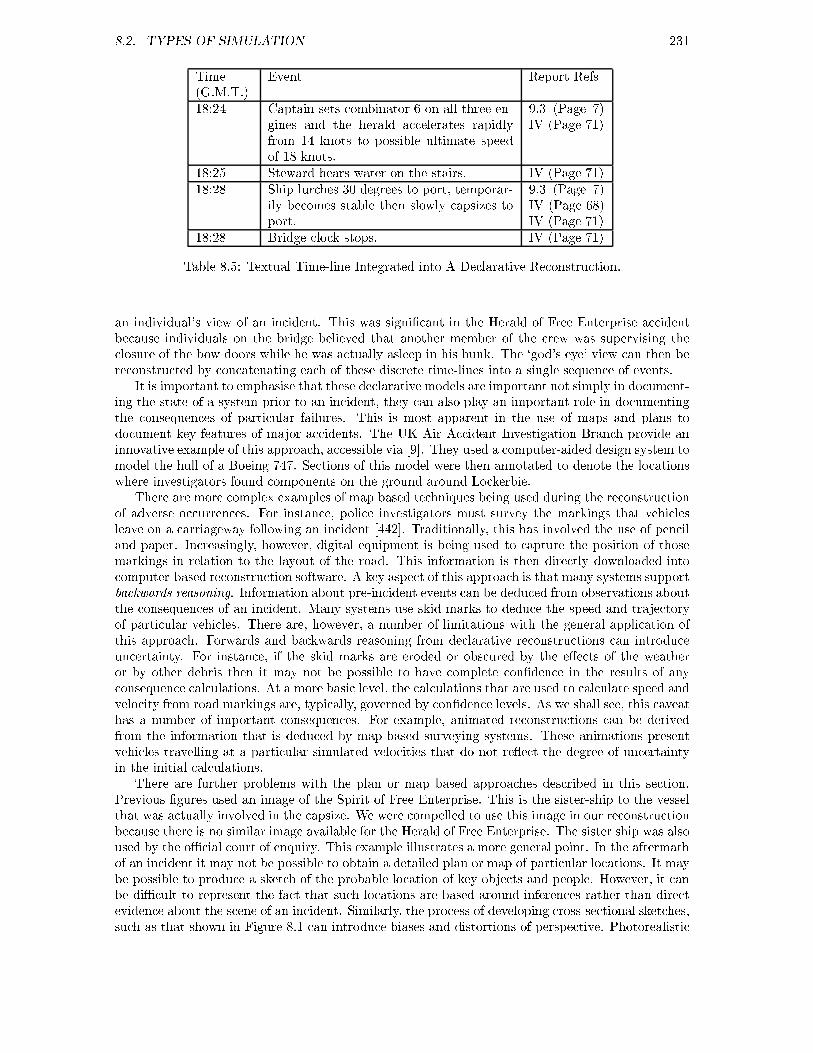
These static descriptions can also be augmented with information about the dynamic events thattook place in a particular area of the ship. For example, if the user selects the bridge rather thanthe bow doors then the screen would be updated to show the textual time-line in Table 8.2.1. Thisillustrates the manner in which declarative plans, or maps, can be augmented with information aboutkey events during the course of an incident. A time-line can be used to indicate when people andequipment move from one location to another. As can be seen from Table 8.2.1, events can also beannotated to indicate the evidence that supported each observation. This reconstruction was builtpost hoc and so the citations refer to paragraphs in the Sheen report [737]. However, investigatorscan exploit the same approach to keep track of the evidence provided by primary sources.
An important strength of the approach illustrated in Figures 8.1 and 8.2 is they avoid the`god's eye' view that is provided by some computer-based reconstructions. Figure 8.2 only recordsinformation that was available to the crew on the bridge. It does not provide information thatmight have been available to crew on the car deck or in the passenger areas. In contrast, many othersimulation techniques provide an overview of all of the evidence that is obtained during primary andsecondary investigations. Such reconstructions provide a false impression because they integrateinformation that could not have been available to any single eye-witness. By using plans and mapsto navigate into location-dependent time-lines, it is possible to gain a more accurate impression of
8.2. TYPES OF SIMULATION 231
Time(G.M.T.)
Event Report Refs
18:24 Captain sets combinator 6 on all three en-gines and the herald accelerates rapidlyfrom 14 knots to possible ultimate speedof 18 knots.
9.3 (Page 7)IV (Page 71)
18:25 Steward hears water on the stairs. IV (Page 71)18:28 Ship lurches 30 degrees to port, temporar-
ily becomes stable then slowly capsizes toport.
9.3 (Page 7)IV (Page 68)IV (Page 71)
18:28 Bridge clock stops. IV (Page 71)
Table 8.5: Textual Time-line Integrated into A Declarative Reconstruction.
an individual's view of an incident. This was signi�cant in the Herald of Free Enterprise accidentbecause individuals on the bridge believed that another member of the crew was supervising theclosure of the bow doors while he was actually asleep in his bunk. The `god's eye' view can then bereconstructed by concatenating each of these discrete time-lines into a single sequence of events.
It is important to emphasise that these declarative models are important not simply in document-ing the state of a system prior to an incident, they can also play an important role in documentingthe consequences of particular failures. This is most apparent in the use of maps and plans todocument key features of major accidents. The UK Air Accident Investigation Branch provide aninnovative example of this approach, accessible via [9]. They used a computer-aided design system tomodel the hull of a Boeing 747. Sections of this model were then annotated to denote the locationswhere investigators found components on the ground around Lockerbie.
There are more complex examples of map based techniques being used during the reconstructionof adverse occurrences. For instance, police investigators must survey the markings that vehiclesleave on a carriageway following an incident [442]. Traditionally, this has involved the use of penciland paper. Increasingly, however, digital equipment is being used to capture the position of thosemarkings in relation to the layout of the road. This information is then directly downloaded intocomputer-based reconstruction software. A key aspect of this approach is that many systems supportbackwards reasoning. Information about pre-incident events can be deduced from observations aboutthe consequences of an incident. Many systems use skid marks to deduce the speed and trajectoryof particular vehicles. There are, however, a number of limitations with the general application ofthis approach. Forwards and backwards reasoning from declarative reconstructions can introduceuncertainty. For instance, if the skid marks are eroded or obscured by the e�ects of the weatheror by other debris then it may not be possible to have complete con�dence in the results of anyconsequence calculations. At a more basic level, the calculations that are used to calculate speed andvelocity from road markings are, typically, governed by con�dence levels. As we shall see, this caveathas a number of important consequences. For example, animated reconstructions can be derivedfrom the information that is deduced by map-based surveying systems. These animations presentvehicles travelling at a particular simulated velocities that do not re ect the degree of uncertaintyin the initial calculations.
There are further problems with the plan or map based approaches described in this section.Previous �gures used an image of the Spirit of Free Enterprise. This is the sister-ship to the vesselthat was actually involved in the capsize. We were compelled to use this image in our reconstructionbecause there is no similar image available for the Herald of Free Enterprise. The sister ship was alsoused by the oÆcial court of enquiry. This example illustrates a more general point. In the aftermathof an incident it may not be possible to obtain a detailed plan or map of particular locations. It maybe possible to produce a sketch of the probable location of key objects and people. However, it canbe diÆcult to represent the fact that such locations are based around inferences rather than directevidence about the scene of an incident. Similarly, the process of developing cross-sectional sketches,such as that shown in Figure 8.1 can introduce biases and distortions of perspective. Photorealistic
232 CHAPTER 8. COMPUTER-BASED SIMULATION
simulations reduce some of these problems.
Photorealistic Models
s mentioned, plans and maps have long been used to help analysts reconstruct the location in whichan incident occurred. Artists sketches can, however, provide a poor impression of the environment,objects and individuals who contribute to safety problems. As a result, photographs are often usedto supplement maps and plans. There images provide a more direct impression of the location inwhich an incident occurred. They can be used to provide detailed information about the physicalstate of process components, whether they are new or worn, whether they are correctly installed ormisaligned, whether they were damaged by an incident or whether they remain intact. Photographicimages can also provide an impression of particular environmental factors, such as the line of sightbetween an operators and a warning signal. Such information can be diÆcult to convey using plansand maps. It is important to emphasise that such techniques are not immune from some of thebiases that sketched images. Di�erent camera angles, exposures and processing techniques can givefalse impressions about what could or could not be observed during the course of an incident.
As with plan-based simulations, there has been a recent revolution in the use of photographicalimages to support incident reconstruction. A range of computer-based techniques are creating bothopportunities and challenges for investigators. One of the biggest bene�ts of recent developmentsis that investigators can take images in the �eld using digital cameras. These can then be sentfrom a laptop PC using a modem and wireless telephony to colleagues in other regions country andthroughout the globe. in some recent cases this has been done interactively with the �eld investigatorbeing guided remotely to take live images of the incident site. The resulting photographs can thenbe archived on servers that can then be accessed by other investigators when they are needed. Theseimages can also be used in subsequent litigation and in any subsequent reports.
As mentioned, these bene�ts also bring a certain number of concerns. It is possible to falsifyconventional photographic images but digital editing techniques make this far easier. A vast rangeof `post-production' e�ects can be achieved with relatively little training. In consequence, manycountries have strict rules about the ways in which digital resources can be used both during anincident investigation and during any subsequent litigation. For example, investigators can be re-quired to testify that digital resources have been protected from unauthorised `tampering'. Digitalwatermark techniques provide one means of achieving this protection. These watermarks are imple-mented using an identi�cation code that is permanently embedded into electronic data. The codecarries information about copyright protection and data authentication. If the resource is edited inany way then the watermark will be destroyed. Evidence of `tampering' is then apparent if userscannot extract the original watermark from the electronic resource. The interested reader is directedto Hartung and Kutter's overview of multimedia protection techniques for more information aboutthis and similar approaches [312]. In contrast, the remainder of this section focuses on the use ofphotorealistic pseudo-3D techniques for incident reconstruction.
One of the problems with static images is that it can be diÆcult to gain an impression of threedimensional space. This is a limitation of both conventional and digital images. Analysts cannot usethese images to `walk around' the scene of an incident. Instead, they are restricted to the perspectiveschosen by the person taking the photograph. This becomes an issue because it can be diÆcult forinvestigators to predict all of the possible perspectives that might be relevant in the aftermath ofan incident. Even if they expend vast amounts of time and �lm, it can still be diÆcult for otherinvestigators to piece together the layout of an environment from dozens of static images and plans.Software engineers have responded to similar concerns within other application areas by developingphotorealistic tools for desktop virtual reality (desktopVR). These tools avoid the use of cumbersomehelmets and gloves that have been recruited by immersive virtual reality systems. Instead, theyattempt to provide an impression of movement in 3D space using conventional input and outputdevices; keyboards, mice and standard computer displays. Although we focus on this non-immersiveapproach to virtual reality, many of the comments also apply to incident reconstruction systemsthat expect their users to wear helmets, gloves and other more complex apparatus. In contrast,QuicktimeVR constructs an interactive simulation from a number digital images and presents them
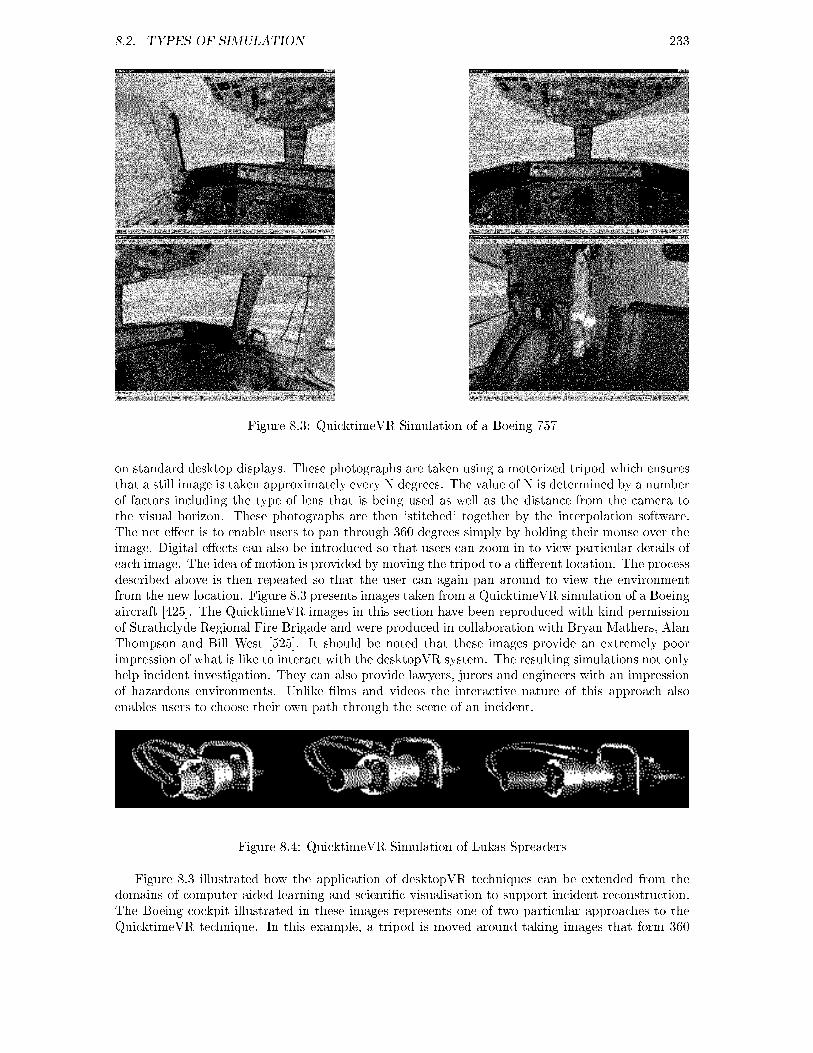
8.2. TYPES OF SIMULATION 233
Figure 8.3: QuicktimeVR Simulation of a Boeing 757
on standard desktop displays. These photographs are taken using a motorized tripod which ensuresthat a still image is taken approximately every N degrees. The value of N is determined by a numberof factors including the type of lens that is being used as well as the distance from the camera tothe visual horizon. These photographs are then `stitched' together by the interpolation software.The net e�ect is to enable users to pan through 360 degrees simply by holding their mouse over theimage. Digital e�ects can also be introduced so that users can zoom in to view particular details ofeach image. The idea of motion is provided by moving the tripod to a di�erent location. The processdescribed above is then repeated so that the user can again pan around to view the environmentfrom the new location. Figure 8.3 presents images taken from a QuicktimeVR simulation of a Boeingaircraft [425]. The QuicktimeVR images in this section have been reproduced with kind permissionof Strathclyde Regional Fire Brigade and were produced in collaboration with Bryan Mathers, AlanThompson and Bill West [525]. It should be noted that these images provide an extremely poorimpression of what is like to interact with the desktopVR system. The resulting simulations not onlyhelp incident investigation. They can also provide lawyers, jurors and engineers with an impressionof hazardous environments. Unlike �lms and videos the interactive nature of this approach alsoenables users to choose their own path through the scene of an incident.
Figure 8.4: QuicktimeVR Simulation of Lukas Spreaders
Figure 8.3 illustrated how the application of desktopVR techniques can be extended from thedomains of computer aided learning and scienti�c visualisation to support incident reconstruction.The Boeing cockpit illustrated in these images represents one of two particular approaches to theQuicktimeVR technique. In this example, a tripod is moved around taking images that form 360
234 CHAPTER 8. COMPUTER-BASED SIMULATION
degree sweeps on the scene of an incident. The same approach can, however, also be used withslight variations to provide interactive simulations of process components. This is illustrated byFigure 8.4. Digital editing techniques have been used to joint together a number of still images froma QuicktimeVR reconstruction. The intention has been to provide an impression of the way in whicha user can manipulate the software to rotate the object through 360 degrees. The Figure shows howthis approach has been applied to the Lukas spreaders that Fire Crews use to extract passengersfrom road traÆc accidents. The process used to create these simulations is slightly di�erent thanthat used to produce the system in Figure 8.3. Rather than rotating a camera to photograph theenvironment, in this approach the camera is typically held in a constant position while the objectis rotated. By raising or lowering the position of the camera, it is possible for the user to rotate theobject around both the x and the y-axes. They can zoom in to view both the top and the bottomof the object.
These photorealistic simulation techniques are declarative because they provide a pseudo-3Dimpression of the state of the environment or of critical objects at a particular instant in time.However, it is possible to construct multiple simulations to show the state of an object or environmentboth before and after key events. We have used this most frequently to show the e�ects of damageor wear on process components. It is also important to emphasise that these resources can easilybe integrated into other electronic resources. They can be `marked-up' in the same way that weannotated the sketches of the Herald of Free Enterprise. This enables users to electronically accesslinked pages of textual information by selecting areas of the images. Investigators can use thisapproach to access to the text-based time-lines illustrated in the previous section. This providesan alternative means of introducing dynamic information about critical events into what wouldotherwise be a static and declarative approach. There are further bene�ts. For instance, we haveused heavy-duty turntables to represent artifacts that are too heavy to be lifted. This enables usersto inspect objects such as aircraft engines. They can literally turn these component `upside down'to select the best angle from which to view any potential damage. Similarly, we are exploring theuse of miniaturised cameras to create pseudo-3D models of devices that cannot normally be directlyaccessed.
At the time of writing this book, these techniques have not been widely exploited to supportincident reconstruction. It seems likely that this will change. We are using techniques that are beingdeveloped for mass-market computer aided learning systems rather than complex bespoke techniquesfor incident reconstruction. As a result, these simulations can be developed using relatively lowcost technology. QuicktimeVR simulations can be produced at a fraction of the cost of a traditionalsketched plan. The examples illustrated in this section were produced by two undergraduate studentsworking in collaboration with members of Strathclyde Fire Brigade. Members of this service havesince gone on to develop their own applications of this technology. It is also important to notethat the costs of producing these simulations can be defrayed by their multiple applications. All ofthe systems illustrated in this section have been integrated into the Fire Service's computer-basedtraining schemes.
8.2.2 Animated Simulations
The previous section has presented a range of techniques that support the reconstruction of safety-critical incidents. Maps and plans provide represent the layout of an environment and can be usedto locate objects within it. Photorealistic techniques augment these sketches and provide a richersource of information about the scene of an incident. For instance, they can provide evidenceabout the location of objects that might otherwise have been overlooked when a map is beingsketched. However, both of these approaches provide a declarative snapshot of the context in whichan incident occurred. They rely upon secondary techniques, such as textual time-lines, to representmore dynamic information. In contrast, the simulation techniques in this section are speci�callyintended to help analysts reconstruct the changing events that contribute to safety-critical incidents.
8.2. TYPES OF SIMULATION 235
Physical Simulations
Previous sections have mentioned that many incident investigations rely upon full scale reconstruc-tions of adverse occurrences. The scale and sophistication of such reconstructions varies from im-promptu demonstrations by investigators in the �eld to full-scale simulations using highly expensivefacilities, such as the US Department of Labour's Mine Simulation Laboratory. This facility providestraining for safety inspectors and incident investigators using a 48,000 square foot above-ground sim-ulated simulated coal mine. Similarly, NASA's Langley and Ames research centres operate a numberof aircraft simulators that attempt to provide a pilot with enough sensory information to convincethe pilot that an actual aircraft is being own. Sensory cues include realistic out-the-window scenegeneration with 360 degree �eld of view. The more advanced facilities also provide motion feedbackwith accelerations applied to the cockpit to simulate momentum shifts in an aircraft. They alsoemploy special seats and suits that are intended to mimic gravitational pull. Other forms of tactileinformation is simulated by positive force feedback in the pilot's stick and pedals. Acoustic systemssimulate natural sounds, such as the wind, and arti�cal sounds including realistic engine pro�les,
Physical reconstructions often involve a high-degree of risk. Reconstructing failures that almostled to a disaster can lead to disaster. Physical reconstructions also, typically, associated with highcosts. The NTSB's Wake Vortex ight tests provide an extreme example of this. These wereconducted at the FAA's Technical Center in Atlantic City, New Jersey in September, 1995. Thesevortices can be thought of as a form of turbulence. They can be created whenever an aircraft passesthrough a section of airspace:
\Wake vortex: A counterrotating airmass trailing from an airplanes wing tips. Thestrength of the vortex is governed by the weight, speed, and shape of the wing of thegenerating aircraft; the greatest strength occurs when the wings of the generating aircraftare producing the most lift, that is, when the aircraft is heavy, in a clean con�guration,and at a slow airspeed. (Also known as wake turbulence.)" [611]
Air traÆc controllers must, therefore, follow wake vortex regulations that specify minimum separa-tions between particular types of aircraft. These regulations are intended to prevent the followingplane from ying through a vortex created by its predecessor [369]. The NTSB's physical recon-structions used a Boeing 727 to generate a vortex. A Boeing 737 was then deliberately own into the727's vortex. These were identi�ed using wing-mounted smoke generators on the lead aircraft. Theresults of the reconstruction were monitored by on-board sensors and from a T-33 chase plane. Therisks of such simulations are obvious; especially considering that they were triggered by hypothesesabout the causes of a number of previous incidents [611].
The NTSB's wake vortex studies typify the way in which physical simulations are used to obtainmany di�erent forms of data. Information was obtained from videotapes, an enhanced ight datarecorder, from Boeings portable airborne digital data system, for a 2-hour cockpit voice recorder onthe 737 and from test pilot statements. These data revealed that the 727 wake vortices remainedintact as much as 6 to 8 miles behind the wake-generating airplane, and wake strength values rangedfrom 800 to 1,500 feet per second. The video tapes revealed numerous examples of wake vorticesbreaking apart; linking up; and moving up, down and sideways. This study is also remarkable for theway in which the NTSB exploited the video recordings. These were used not simply to support theinvestigators' analytical work. They were also used to provide the public with important insightsinto the conclusions of the �nal report. This seems to be an increasing trend as incident andaccident investigators become increasingly aware of the need to communicate their �ndings beyondthe regulators of their industry [750].
The principle aim of recording this information is to prove or disprove hypotheses about thecauses of an incident. The NTSB study was conducted because wake vortices had been implicatedin a number of previous incidents. This reiterates the close links between reconstruction and causalanalysis. Physical reconstructions help to prove or disprove causal hypotheses. Unfortunately,however, the results from these studies can be highly ambiguous. The failure to recreate an incidentmay be due to characteristics of the simulation environment rather than weaknesses in the underlyinghypotheses. There may also be problems in instrumenting a physical reconstruction to determine
236 CHAPTER 8. COMPUTER-BASED SIMULATION
whether or not an incident has actually be recreated. Typically, the components and systems thatwere involved in an incident are heavily instrumented to provide as mush feedback about the potentialcauses of a failure as possible. This is critical because of the risk and expense mentioned above.Lechowicz and Hunt provide an example of this instrumentation when they introduce a systemto provides in-motion weighing, load distribution analysis plus defect detection and classi�cationat wheel, bogie, wagon and train levels [483]. In order to calibrate the measurements from theirsystem they had to run a range of satisfactory and specially assembled bogies over the track. Theseassemblies provided a mixture of good wheels, defective wheels and vehicle loads and were run atspeeds from 30 up to 130km/h. Such calibration tests must be conducted before an incident caneven be simulated. If they are not then there is a danger that incorrect conclusions will be drawnfrom the results that are provided by the instrumentation.
Physical simulations supplement any information that can be derived from data recorders thatwere running at the time of an incident. This live `incident' data also helps to validate the informationthat is obtained from physical simulations. If the information derived from a physical simulation isnot consistent with that gathered at the time of the incident then a number of potential problemsmight be diagnosed. For instance, the physical simulation may not have recreated the conditionsthat held at the time of the incident. Alternatively, the recording devices that were operating at thetime of the incident may have been incorrectly calibrated. The recording devices that were runningduring the incident may not have been correctly calibrated. However, such inconsistencies are notwithout value. They can often be used to identify alternative conditions that might lead to similarconsequences during an incident.
The data that is derived from physical simulations and from incident data recorders can provideparameters for computer-generated models. This has signi�cant advantages. For example, the costsassociated with crashing rail trucks at di�erent speeds, typically, prevents a wide range of physicalsimulations. However, these studies can be used as data points for computer-based simulations thatcan be run and re-run without signi�cant additional costs. Later sections will identify the strengthsand weaknesses of these techniques. In contrast, the following section focuses on the animatedpresentations that are frequently derived from these computer-based models. In many cases thesemodels are used without the support of physical reconstructions. The high costs, the inherent risksand the problems of instrumenting a reconstruction often persuade investigators to rely upon solelycomputer-generated simulations.
Computer-Based Animations
We have shown how desktopVR software can `stitch' together photographic images in order toprovide interactive tours of particular environments or rotational images of process components.This is not the only way in which desktopVR technology might support incident reconstruction. Inparticular, model-based approaches can be used to reconstruct environments that cannot be directlyphotographed. This is often the case when an incident has resulted in signi�cant damage to aworkplace or if that environment has become hazardous in the aftermath of an incident. Model-based approach construct complex process components from a number of geometric primitives, suchas spheres and cubes. Application software then renders the image of these composite objects ontothe user's screen. The image is updated as the investigator moves around in the virtual environment.In particular, the rendering software must cope with changes in perspective and the occlusion thatoccurs when one object obscures the image of another.
Figure 8.5 illustrates how this model-based approach can be used to support incident reconstruc-tion. It shows how geometric primitives can be combined to reconstruct complex structures includingvehicles and people as well as buildings. This Virtual Reality Markup Language (VRML) simulationwas developed in collaboration with Marcus Kramer [461]. This application enable analysts to placeconstruction equipment within a number of di�erent layouts that were proposed for a building site.The equipment could be moved around within these layouts to show users the potential hazards thatwere posed, for example by overhead cables.
Many model-based reconstructions, such as the one shown above, are developed using declarativeenvironments. They enable users to reconstruct the topography of environment. Libraries can also
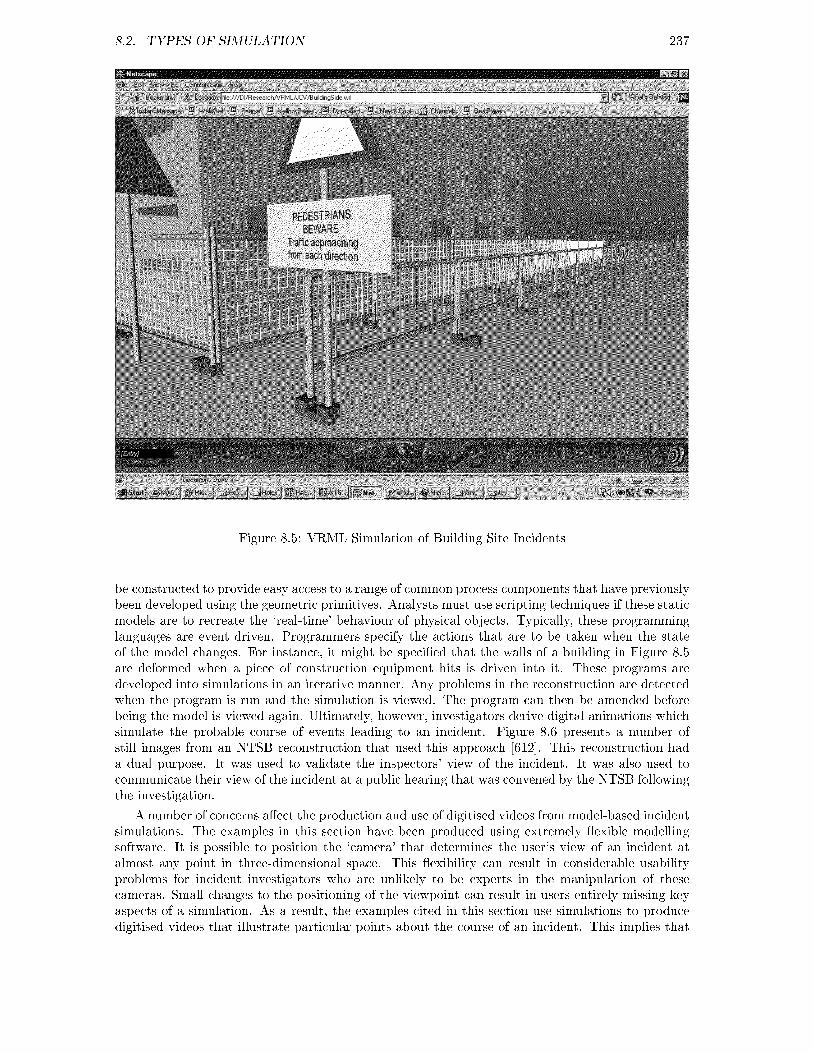
8.2. TYPES OF SIMULATION 237
Figure 8.5: VRML Simulation of Building Site Incidents
be constructed to provide easy access to a range of common process components that have previouslybeen developed using the geometric primitives. Analysts must use scripting techniques if these staticmodels are to recreate the `real-time' behaviour of physical objects. Typically, these programminglanguages are event driven. Programmers specify the actions that are to be taken when the stateof the model changes. For instance, it might be speci�ed that the walls of a building in Figure 8.5are deformed when a piece of construction equipment hits is driven into it. These programs aredeveloped into simulations in an iterative manner. Any problems in the reconstruction are detectedwhen the program is run and the simulation is viewed. The program can then be amended beforebeing the model is viewed again. Ultimately, however, investigators derive digital animations whichsimulate the probable course of events leading to an incident. Figure 8.6 presents a number ofstill images from an NTSB reconstruction that used this approach [612]. This reconstruction hada dual purpose. It was used to validate the inspectors' view of the incident. It was also used tocommunicate their view of the incident at a public hearing that was convened by the NTSB followingthe investigation.
A number of concerns a�ect the production and use of digitised videos from model-based incidentsimulations. The examples in this section have been produced using extremely exible modellingsoftware. It is possible to position the `camera' that determines the user's view of an incident atalmost any point in three-dimensional space. This exibility can result in considerable usabilityproblems for incident investigators who are unlikely to be experts in the manipulation of thesecameras. Small changes to the positioning of the viewpoint can result in users entirely missing keyaspects of a simulation. As a result, the examples cited in this section use simulations to producedigitised videos that illustrate particular points about the course of an incident. This implies that
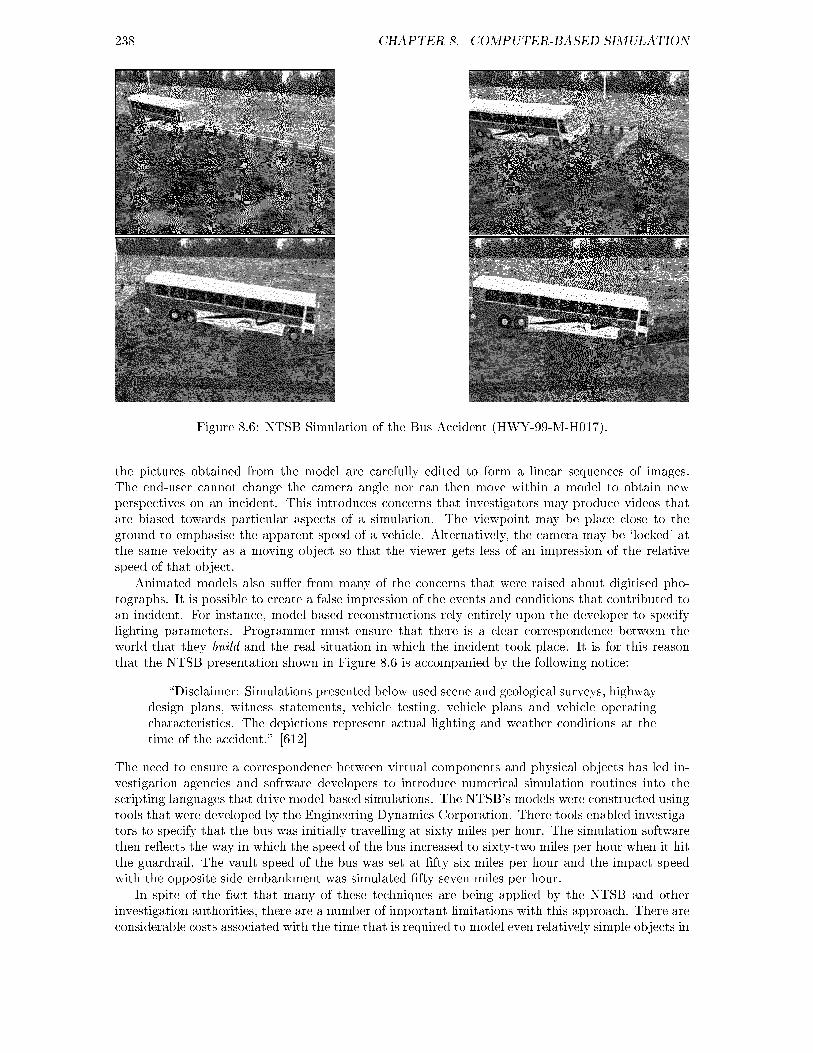
238 CHAPTER 8. COMPUTER-BASED SIMULATION
Figure 8.6: NTSB Simulation of the Bus Accident (HWY-99-M-H017).
the pictures obtained from the model are carefully edited to form a linear sequences of images.The end-user cannot change the camera angle nor can then move within a model to obtain newperspectives on an incident. This introduces concerns that investigators may produce videos thatare biased towards particular aspects of a simulation. The viewpoint may be place close to theground to emphasise the apparent speed of a vehicle. Alternatively, the camera may be `locked' atthe same velocity as a moving object so that the viewer gets less of an impression of the relativespeed of that object.
Animated models also su�er from many of the concerns that were raised about digitised pho-tographs. It is possible to create a false impression of the events and conditions that contributed toan incident. For instance, model-based reconstructions rely entirely upon the developer to specifylighting parameters. Programmer must ensure that there is a clear correspondence between theworld that they build and the real situation in which the incident took place. It is for this reasonthat the NTSB presentation shown in Figure 8.6 is accompanied by the following notice:
\Disclaimer: Simulations presented below used scene and geological surveys, highwaydesign plans, witness statements, vehicle testing, vehicle plans and vehicle operatingcharacteristics. The depictions represent actual lighting and weather conditions at thetime of the accident." [612]
The need to ensure a correspondence between virtual components and physical objects has led in-vestigation agencies and software developers to introduce numerical simulation routines into thescripting languages that drive model-based simulations. The NTSB's models were constructed usingtools that were developed by the Engineering Dynamics Corporation. There tools enabled investiga-tors to specify that the bus was initially travelling at sixty miles per hour. The simulation softwarethen re ects the way in which the speed of the bus increased to sixty-two miles per hour when it hitthe guardrail. The vault speed of the bus was set at �fty six miles per hour and the impact speedwith the opposite side embankment was simulated �fty seven miles per hour.
In spite of the fact that many of these techniques are being applied by the NTSB and otherinvestigation authorities, there are a number of important limitations with this approach. There areconsiderable costs associated with the time that is required to model even relatively simple objects in

8.2. TYPES OF SIMULATION 239
model based virtual environments. These costs can be reduced by maintaining libraries of commoncomponents. The elements in such libraries may not re ect the subtle di�erences that exist, forinstance between particular models or types of equipment. These costs can dissuade analysts fromreconstructing distal causes of adverse occurrences. DesktopVR reconstructions are often biasedtowards the simulation of those proximal events that have the greatest impact upon their viewer.It can also be extremely diÆcult to build interactive model-based simulations for certain classesof events. For instance, it is rare to see such simulations that show how managerial or regulatorydecisions have in uenced the course of an incident. Further problems relate to the use of model-based simulations to represent the outcome of an incident. The NTSB investigators had several goodreasons when they decided not to model the impact damage and motion to �nal rest in Figure 8.6.Firstly, there are computational and technical diÆculties in calculating the many di�erent forces thatact on complex objects during safety-critical incidents. As a result, simulations must approximatethe mechanical and kinematic forces that operate on physical components. This is suÆcient for mostpurposes but can lead to `unrealistic' e�ects during impact sequences. More importantly, there arealso strong ethical concerns that make the simulation of such consequences unacceptible to thosewho are involved in an incident.
Abstract Visualisations of Critical Events
Figure 8.7 presents a less familiar application of desktopVR for incident simulation. The interactivereconstruction was developed in collaboration with Anthony McGill [531]. Instead of modelling theobjects that are involved in an incident, this approach provides a more abstract overview of theevents leading to an adverse occurrence. The image shows three time-lines that recede into thez-plane. Each time-line describes events that are related to a particular aspect of the incident. Inthis case, systems engineering failures are distinguished from the actions of the chief oÆcer and theassistant bosun. As can be seen, geometric primitives are used to model ags. These are labelledwith information about events that a�ected the course of the incident. Each ag is placed at apoint on the time-line. Users can exploit the application software to `walk' forward along eitherof the lines. By looking horizontally across the x-plane it is possible to review those events thatconcurrently a�ect the other entities that are represented by the parallel time-lines. By lookingforwards into the z-plane, the user reviews those events that happen in the immediate future fromtheir position on the line. By turning 180 degrees in the same plane, they can review those eventsthat happened immediately before their current position in time.
As can be seen from Figure 8.7, this technology can be integrated within conventional webbrowsers. As a result, hypertext links can be associated with the individual objects in the model.Users can select any of the ags to view a page of information about the evidence that relates to thatevent. This is essentially the same mechanism that was described for the QuicktimeVR visualisationsintroduced in previous sections. A number of re�nements have been proposed for the basic approachdescribed above. For example, we have set some of the ags at a 45 degree angle to the view shownin Figure 8.7. This has been used to provide viewers with a means of identifying when there iscon icting evidence about a particular event. Similarly, some ags are not planted into a time-line.Instead, they `hover' above the rest of the ags. This has been used to denote events for which thereis not accurate timing information.
The approach shown in Figure 8.8 has a number of important bene�ts. The three-dimensionalstructures used in the model are extremely simple. Analysts, therefore, avoid the overheads associ-ated with the three-dimensional modelling of complex real-world objects illustrated by Figure 8.5.It is a trivial exercise to add new ags. Investigators simply duplicate the existing components andupdate its label. There are, however, a number of practical limitations. For instance, it can be anon-trivial exercise to use two-dimensional input devices, such as the conventional keyboard andmouse, to navigate three-dimensional space. These diÆculties can be eased by the provision of anumber of simple interface design techniques. For example, pre-de�ned viewpoints can be built intothe system so that users can move from one point to another by selecting from a menu of options.This avoids the need for investigators to continually check whether any mouse movements will al-ter their position or orientation in the X,Y or Z planes. In Figure 8.7 this is achieved by a menu
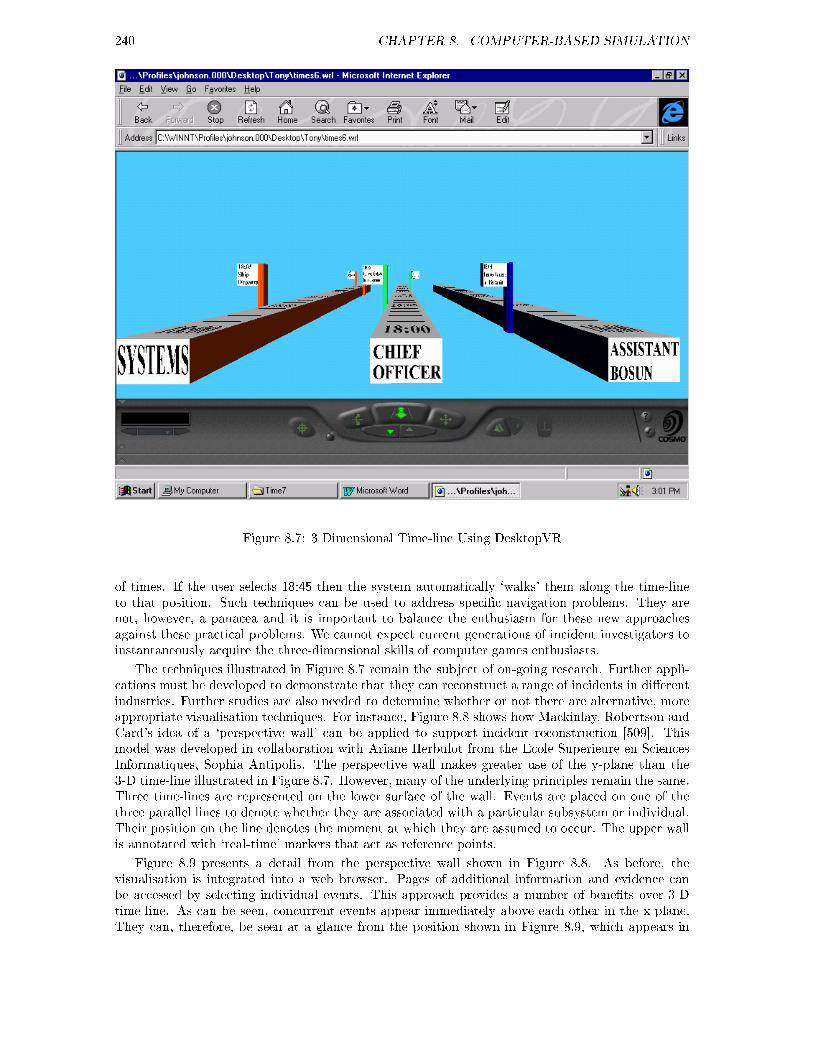
240 CHAPTER 8. COMPUTER-BASED SIMULATION
Figure 8.7: 3 Dimensional Time-line Using DesktopVR
of times. If the user selects 18:45 then the system automatically `walks' them along the time-lineto that position. Such techniques can be used to address speci�c navigation problems. They arenot, however, a panacea and it is important to balance the enthusiasm for these new approachesagainst these practical problems. We cannot expect current generations of incident investigators toinstantaneously acquire the three-dimensional skills of computer games enthusiasts.
The techniques illustrated in Figure 8.7 remain the subject of on-going research. Further appli-cations must be developed to demonstrate that they can reconstruct a range of incidents in di�erentindustries. Further studies are also needed to determine whether or not there are alternative, moreappropriate visualisation techniques. For instance, Figure 8.8 shows how Mackinlay, Robertson andCard's idea of a `perspective wall' can be applied to support incident reconstruction [509]. Thismodel was developed in collaboration with Ariane Herbulot from the Ecole Superieure en SciencesInformatiques, Sophia Antipolis. The perspective wall makes greater use of the y-plane than the3-D time-line illustrated in Figure 8.7. However, many of the underlying principles remain the same.Three time-lines are represented on the lower surface of the wall. Events are placed on one of thethree parallel lines to denote whether they are associated with a particular subsystem or individual.Their position on the line denotes the moment at which they are assumed to occur. The upper wallis annotated with `real-time' markers that act as reference points.
Figure 8.9 presents a detail from the perspective wall shown in Figure 8.8. As before, thevisualisation is integrated into a web browser. Pages of additional information and evidence canbe accessed by selecting individual events. This approach provides a number of bene�ts over 3-Dtime-line. As can be seen, concurrent events appear immediately above each other in the x-plane.They can, therefore, be seen at a glance from the position shown in Figure 8.9, which appears in
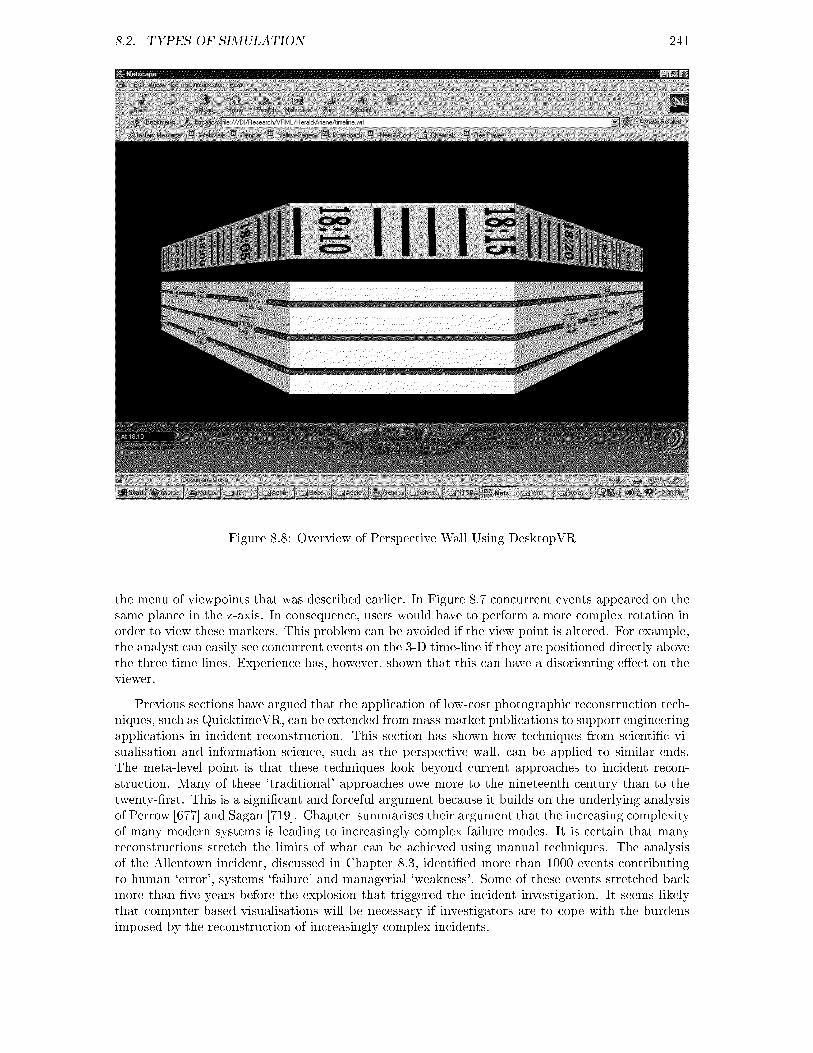
8.2. TYPES OF SIMULATION 241
Figure 8.8: Overview of Perspective Wall Using DesktopVR
the menu of viewpoints that was described earlier. In Figure 8.7 concurrent events appeared on thesame plance in the z-axis. In consequence, users would have to perform a more complex rotation inorder to view these markers. This problem can be avoided if the view point is altered. For example,the analyst can easily see concurrent events on the 3-D time-line if they are positioned directly abovethe three time-lines. Experience has, however, shown that this can have a disorienting e�ect on theviewer.
Previous sections have argued that the application of low-cost photographic reconstruction tech-niques, such as QuicktimeVR, can be extended frommass-market publications to support engineeringapplications in incident reconstruction. This section has shown how techniques from scienti�c vi-sualisation and information science, such as the perspective wall, can be applied to similar ends.The meta-level point is that these techniques look beyond current approaches to incident recon-struction. Many of these `traditional' approaches owe more to the nineteenth century than to thetwenty-�rst. This is a signi�cant and forceful argument because it builds on the underlying analysisof Perrow [677] and Sagan [719]. Chapter summarises their argument that the increasing complexityof many modern systems is leading to increasingly complex failure modes. It is certain that manyreconstructions stretch the limits of what can be achieved using manual techniques. The analysisof the Allentown incident, discussed in Chapter 8.3, identi�ed more than 1000 events contributingto human `error', systems `failure' and managerial `weakness'. Some of these events stretched backmore than �ve years before the explosion that triggered the incident investigation. It seems likelythat computer-based visualisations will be necessary if investigators are to cope with the burdensimposed by the reconstruction of increasingly complex incidents.
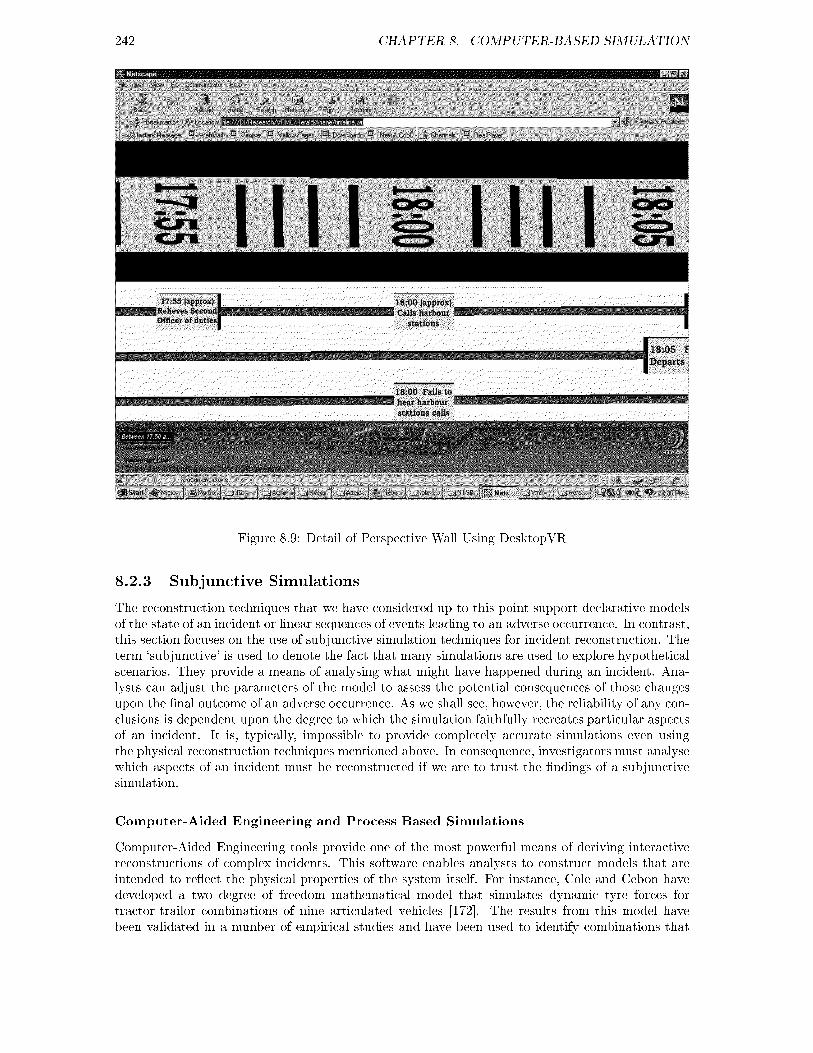
242 CHAPTER 8. COMPUTER-BASED SIMULATION
Figure 8.9: Detail of Perspective Wall Using DesktopVR
8.2.3 Subjunctive Simulations
The reconstruction techniques that we have considered up to this point support declarative modelsof the state of an incident or linear sequences of events leading to an adverse occurrence. In contrast,this section focuses on the use of subjunctive simulation techniques for incident reconstruction. Theterm `subjunctive' is used to denote the fact that many simulations are used to explore hypotheticalscenarios. They provide a means of analysing what might have happened during an incident. Ana-lysts can adjust the parameters of the model to assess the potential consequences of those changesupon the �nal outcome of an adverse occurrence. As we shall see, however, the reliability of any con-clusions is dependent upon the degree to which the simulation faithfully recreates particular aspectsof an incident. It is, typically, impossible to provide completely accurate simulations even usingthe physical reconstruction techniques mentioned above. In consequence, investigators must analysewhich aspects of an incident must be reconstructed if we are to trust the �ndings of a subjunctivesimulation.
Computer-Aided Engineering and Process Based Simulations
Computer-Aided Engineering tools provide one of the most powerful means of deriving interactivereconstructions of complex incidents. This software enables analysts to construct models that areintended to re ect the physical properties of the system itself. For instance, Cole and Cebon havedeveloped a two degree of freedom mathematical model that simulates dynamic tyre forces fortractor-trailor combinations of nine articulated vehicles [172]. The results from this model havebeen validated in a number of empirical studies and have been used to identify combinations that

8.2. TYPES OF SIMULATION 243
yield particularly `strong dynamic interaction' ! Others models predict the behaviour of gases withindi�erent environments. Numerical techniques derived from computational uid dynamics have beenapplied to explain particular combustion processes [551]. An important bene�t of this approach isthat models, which are used in the design of an application, can also be used to analyse potentialincidents. For example, models that explain the properties of �re resistant surfaces, for instance infurnaces, can also be used to explain why other surface fail in similar situations [770]. The dualpredictive and analytic nature of such engineering models o�er huge bene�ts, not least in the coststhat would otherwise be associated with model development for incident reconstruction.
A recurring theme in this book is that there will be more than one set of events that can leadto the same adverse outcome in complex, technological systems. For this it follows that subjunctivesimulations have an important role to play in searching for these alternative paths. Chapter 8.3 willbrie y introduce techniques from abstract model checking that have been deliberately developed withthis in mind. For now, however, it is suÆcient to stress that subjunctive simulations can also buildupon, and contribute to, training activities. For example, NASA have developed a simple interactivemodel of the DF88 directon �nder that is used to locate aircraft Emergency Locator Transmitters[567]. Users can interact with this model to explore and practice di�erent location scenarios. Thesame underlying software can also be used to during lab-based studies that are intended to explorethe use of such applications in the aftermath of `real' incidents. This illustrates the important pointthat subjunctive reconstructions, in common with the other reconstruction tools in this chapter,should also be capable of modelling the events that occur after an incident has taken place. As weshall see, more lives may be threatened by an inadequate response to an incident than are lost inthe immediate aftermath of an adverse event.
A number of limitations a�ect the use of engineering models to explore alternative scenariosfor safety-critical incidents. Many engineering models gain their predictive power by focusing onspeci�c aspects of more complex interactions. Many of the factors that must be considered duringthe investigation of `real world' incidents must, therefore, be excluded. For example, computation uid dynamics can be used to model the combustion of particular materials. These models cannot,however, be applied to predict the impact that the progress of a �re will have upon key electricalsubsystems during an incident. Fortunately, a number of companies have developed integratedtoolsets that can be used to address such concerns. These tools enable designers to intergratemodels from di�erent engineering disciplines. The output of a con agration model might, therefore,be used to drive predictions about the integrity of electrical subsystems. Figure 8.10 illustrates theinterface to Boeing's Easy5 tool. This software can be used to simulate systems containing hydraulic,pneumatic, mechanical, thermal electrical and digital sub-systems. Simulations can be constructed ina number of ways. For instance, functional blocks can be used together with pre-de�ned componentsthat model physical elements, such as pumps, gears, engines, etc.
Other limitations stem from the implicit assumptions that must be made in orer for these modelsto be tractable. This is illustrated by the caveats that precede a set of results from simulator studiesinto aircraft icing incidents:
\It is important to take in consideration the following assumptions and limitationsof this analysis:
1. The ight conditions just prior to the upset was considered a steady state condition,meaning that all angular rates were considered small and the dynamic aerodynamicderivatives could be considered negligible.
2. The Power E�ects (Specially the propeller slipstream e�ect) in the EMB-120 is verystrong and for this preliminary analysis was not fully considered when calculatingsome aerodynamic coeÆcients.
3. The ice e�ects on the aerodynamic coeÆcients were taken from wind tunnel testresults and only some Reynolds Number corrections were applied.
4. The ight simulation (6 DOF) is valid only up to the pusher �ring angle of attack(approx. 12.5 deg). Above this angle the aerodynamic data and the e�ects of anyasymmetric ow separation are not valid or not considered.
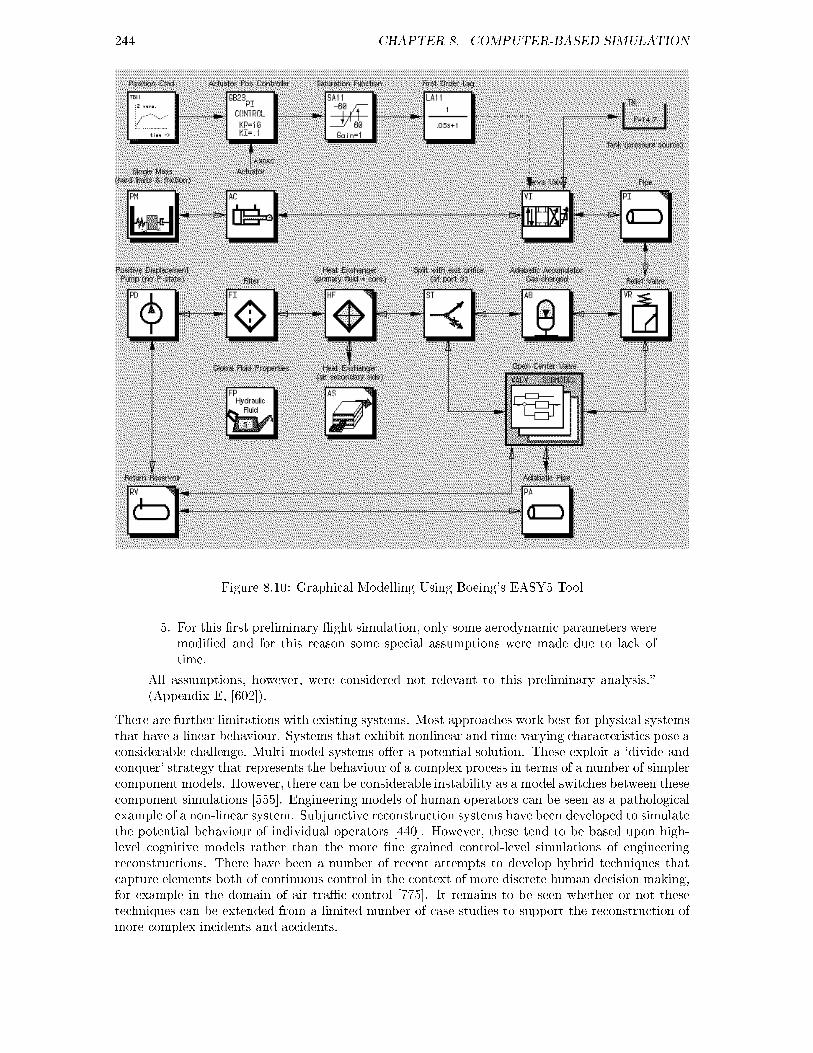
244 CHAPTER 8. COMPUTER-BASED SIMULATION
Figure 8.10: Graphical Modelling Using Boeing's EASY5 Tool
5. For this �rst preliminary ight simulation, only some aerodynamic parameters weremodi�ed and for this reason some special assumptions were made due to lack oftime.
All assumptions, however, were considered not relevant to this preliminary analysis."(Appendix E, [602]).
There are further limitations with existing systems. Most approaches work best for physical systemsthat have a linear behaviour. Systems that exhibit nonlinear and time-varying characteristics pose aconsiderable challenge. Multi-model systems o�er a potential solution. These exploit a `divide andconquer' strategy that represents the behaviour of a complex process in terms of a number of simplercomponent models. However, there can be considerable instability as a model switches between thesecomponent simulations [555]. Engineering models of human operators can be seen as a pathologicalexample of a non-linear system. Subjunctive reconstruction systems have been developed to simulatethe potential behaviour of individual operators [440]. However, these tend to be based upon high-level cognitive models rather than the more �ne grained control-level simulations of engineeringreconstructions. There have been a number of recent attempts to develop hybrid techniques thatcapture elements both of continuous control in the context of more discrete human decision making,for example in the domain of air traÆc control [775]. It remains to be seen whether or not thesetechniques can be extended from a limited number of case studies to support the reconstruction ofmore complex incidents and accidents.
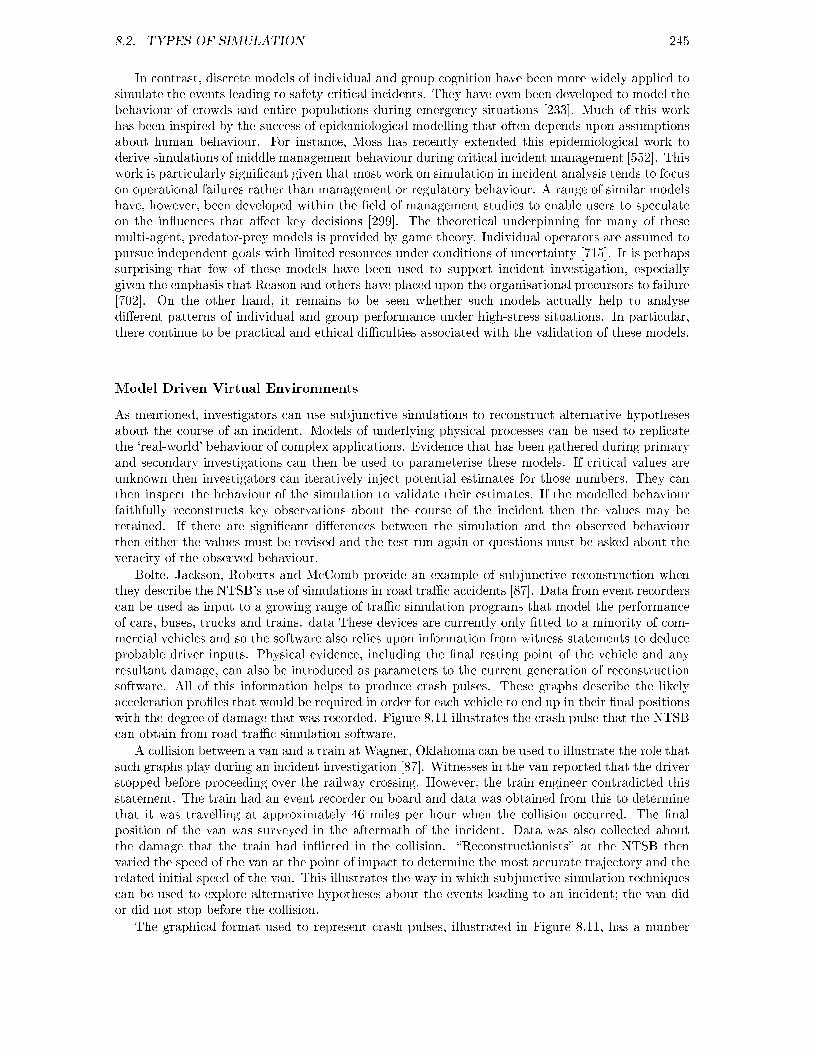
8.2. TYPES OF SIMULATION 245
In contrast, discrete models of individual and group cognition have been more widely applied tosimulate the events leading to safety-critical incidents. They have even been developed to model thebehaviour of crowds and entire populations during emergency situations [233]. Much of this workhas been inspired by the success of epidemiological modelling that often depends upon assumptionsabout human behaviour. For instance, Moss has recently extended this epidemiological work toderive simulations of middle management behaviour during critical incident management [552]. Thiswork is particularly signi�cant given that most work on simulation in incident analysis tends to focuson operational failures rather than management or regulatory behaviour. A range of similar modelshave, however, been developed within the �eld of management studies to enable users to speculateon the in uences that a�ect key decisions [299]. The theoretical underpinning for many of thesemulti-agent, predator-prey models is provided by game theory. Individual operators are assumed topursue independent goals with limited resources under conditions of uncertainty [715]. It is perhapssurprising that few of these models have been used to support incident investigation, especiallygiven the emphasis that Reason and others have placed upon the organisational precursors to failure[702]. On the other hand, it remains to be seen whether such models actually help to analysedi�erent patterns of individual and group performance under high-stress situations. In particular,there continue to be practical and ethical diÆculties associated with the validation of these models.
Model Driven Virtual Environments
As mentioned, investigators can use subjunctive simulations to reconstruct alternative hypothesesabout the course of an incident. Models of underlying physical processes can be used to replicatethe `real-world' behaviour of complex applications. Evidence that has been gathered during primaryand secondary investigations can then be used to parameterise these models. If critical values areunknown then investigators can iteratively inject potential estimates for those numbers. They canthen inspect the behaviour of the simulation to validate their estimates. If the modelled behaviourfaithfully reconstructs key observations about the course of the incident then the values may beretained. If there are signi�cant di�erences between the simulation and the observed behaviourthen either the values must be revised and the test run again or questions must be asked about theveracity of the observed behaviour.
Bolte, Jackson, Roberts and McComb provide an example of subjunctive reconstruction whenthey describe the NTSB's use of simulations in road traÆc accidents [87]. Data from event recorderscan be used as input to a growing range of traÆc simulation programs that model the performanceof cars, buses, trucks and trains. data These devices are currently only �tted to a minority of com-mercial vehicles and so the software also relies upon information from witness statements to deduceprobable driver inputs. Physical evidence, including the �nal resting point of the vehicle and anyresultant damage, can also be introduced as parameters to the current generation of reconstructionsoftware. All of this information helps to produce crash pulses. These graphs describe the likelyacceleration pro�les that would be required in order for each vehicle to end up in their �nal positionswith the degree of damage that was recorded. Figure 8.11 illustrates the crash pulse that the NTSBcan obtain from road-traÆc simulation software.
A collision between a van and a train at Wagner, Oklahoma can be used to illustrate the role thatsuch graphs play during an incident investigation [87]. Witnesses in the van reported that the driverstopped before proceeding over the railway crossing. However, the train engineer contradicted thisstatement. The train had an event recorder on board and data was obtained from this to determinethat it was travelling at approximately 46 miles per hour when the collision occurred. The �nalposition of the van was surveyed in the aftermath of the incident. Data was also collected aboutthe damage that the train had in icted in the collision. \Reconstructionists" at the NTSB thenvaried the speed of the van at the point of impact to determine the most accurate trajectory and therelated initial speed of the van. This illustrates the way in which subjunctive simulation techniquescan be used to explore alternative hypotheses about the events leading to an incident; the van didor did not stop before the collision.
The graphical format used to represent crash pulses, illustrated in Figure 8.11, has a number
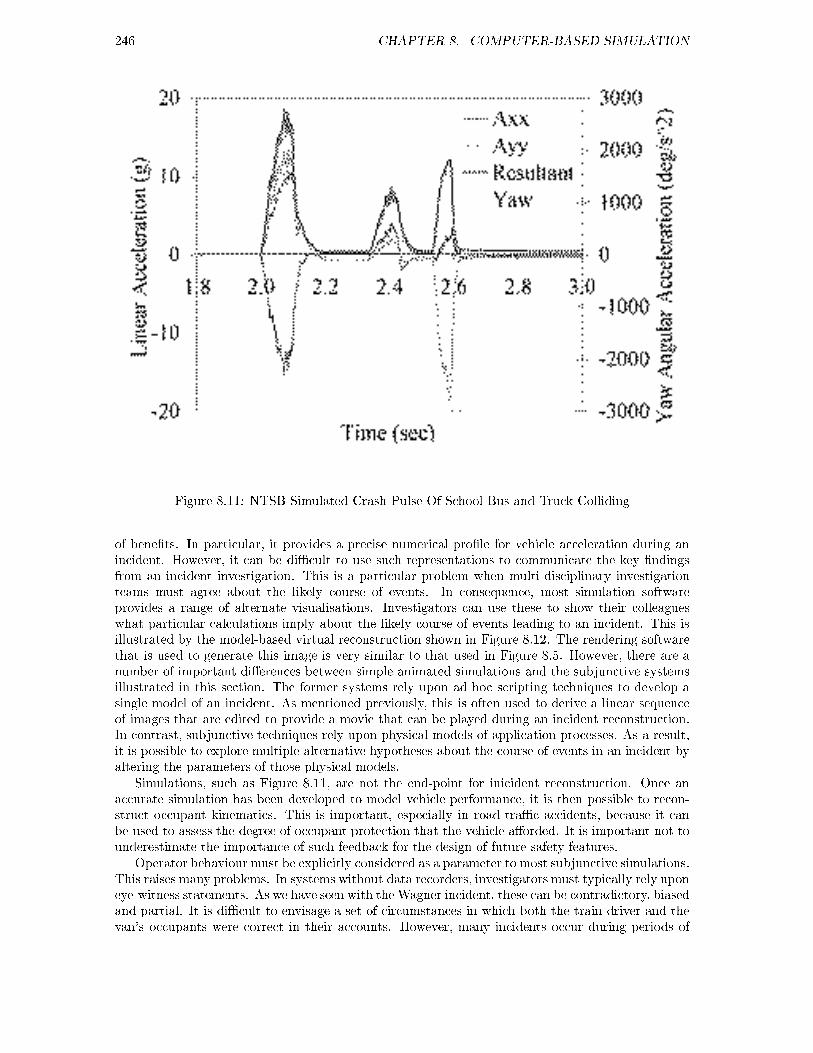
246 CHAPTER 8. COMPUTER-BASED SIMULATION
Figure 8.11: NTSB Simulated Crash Pulse Of School Bus and Truck Colliding
of bene�ts. In particular, it provides a precise numerical pro�le for vehicle acceleration during anincident. However, it can be diÆcult to use such representations to communicate the key �ndingsfrom an incident investigation. This is a particular problem when multi-disciplinary investigationteams must agree about the likely course of events. In consequence, most simulation softwareprovides a range of alternate visualisations. Investigators can use these to show their colleagueswhat particular calculations imply about the likely course of events leading to an incident. This isillustrated by the model-based virtual reconstruction shown in Figure 8.12. The rendering softwarethat is used to generate this image is very similar to that used in Figure 8.5. However, there are anumber of important di�erences between simple animated simulations and the subjunctive systemsillustrated in this section. The former systems rely upon ad hoc scripting techniques to develop asingle model of an incident. As mentioned previously, this is often used to derive a linear sequenceof images that are edited to provide a movie that can be played during an incident reconstruction.In contrast, subjunctive techniques rely upon physical models of application processes. As a result,it is possible to explore multiple alternative hypotheses about the course of events in an incident byaltering the parameters of those physical models.
Simulations, such as Figure 8.11, are not the end-point for inicident reconstruction. Once anaccurate simulation has been developed to model vehicle performance, it is then possible to recon-struct occupant kinematics. This is important, especially in road traÆc accidents, because it canbe used to assess the degree of occupant protection that the vehicle a�orded. It is important not tounderestimate the importance of such feedback for the design of future safety features.
Operator behaviour must be explicitly considered as a parameter to most subjunctive simulations.This raises many problems. In systems without data recorders, investigators must typically rely uponeye-witness statements. As we have seen with the Wagner incident, these can be contradictory, biasedand partial. It is diÆcult to envisage a set of circumstances in which both the train driver and thevan's occupants were correct in their accounts. However, many incidents occur during periods of
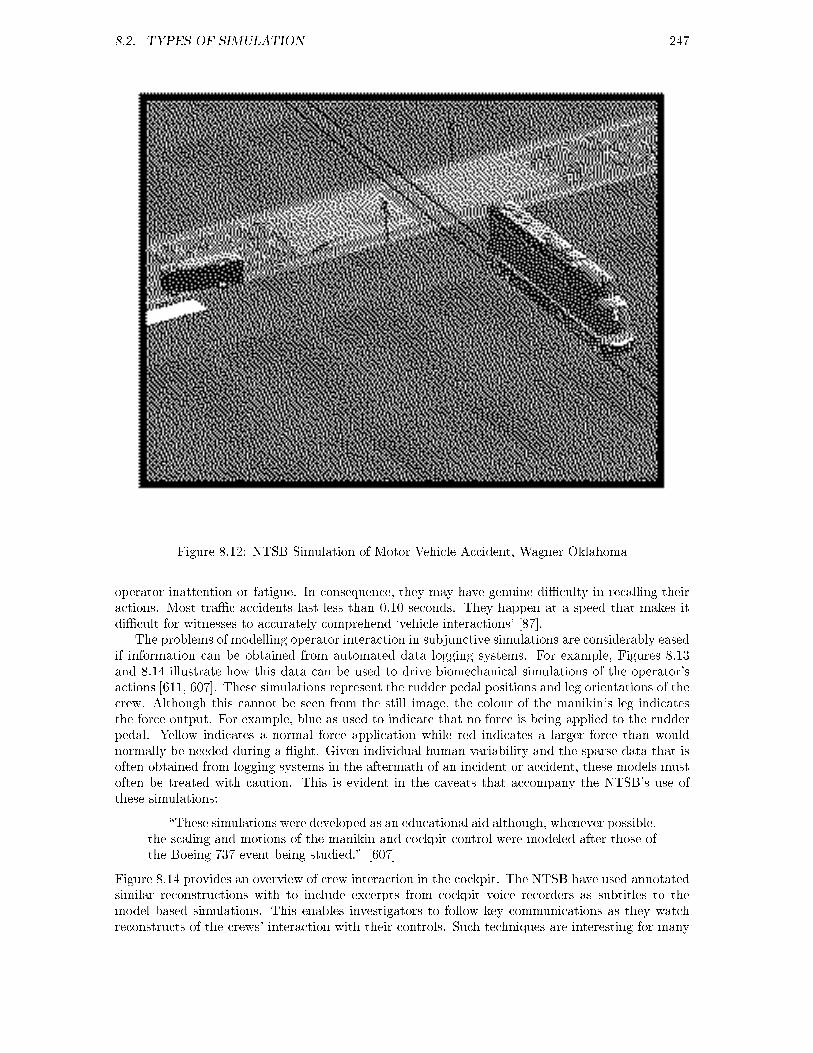
8.2. TYPES OF SIMULATION 247
Figure 8.12: NTSB Simulation of Motor Vehicle Accident, Wagner Oklahoma
operator inattention or fatigue. In consequence, they may have genuine diÆculty in recalling theiractions. Most traÆc accidents last less than 0.10 seconds. They happen at a speed that makes itdiÆcult for witnesses to accurately comprehend `vehicle interactions' [87].
The problems of modelling operator interaction in subjunctive simulations are considerably easedif information can be obtained from automated data logging systems. For example, Figures 8.13and 8.14 illustrate how this data can be used to drive biomechanical simulations of the operator'sactions [611, 607]. These simulations represent the rudder pedal positions and leg orientations of thecrew. Although this cannot be seen from the still image, the colour of the manikin's leg indicatesthe force output. For example, blue as used to indicate that no force is being applied to the rudderpedal. Yellow indicates a normal force application while red indicates a larger force than wouldnormally be needed during a ight. Given individual human variability and the sparse data that isoften obtained from logging systems in the aftermath of an incident or accident, these models mustoften be treated with caution. This is evident in the caveats that accompany the NTSB's use ofthese simulations:
\These simulations were developed as an educational aid although, whenever possible,the scaling and motions of the manikin and cockpit control were modeled after those ofthe Boeing 737 event being studied." [607]
Figure 8.14 provides an overview of crew interaction in the cockpit. The NTSB have used annotatedsimilar reconstructions with to include excerpts from cockpit voice recorders as subtitles to themodel based simulations. This enables investigators to follow key communications as they watchreconstructs of the crews' interaction with their controls. Such techniques are interesting for many
248 CHAPTER 8. COMPUTER-BASED SIMULATION
Figure 8.13: Biomechanical Models in NTSB Incident Simulations (1)
reasons. In particular, the public release of these simulations has not created the same controversyas fears about the public release of footage from cockpit video recorders [607]. The US Air Forcerecognises the distinctions between these di�erent media:
Animations made from recorder data are not privileged as long as they do not contain(the investigation board's) analysis or input. If the actual audio voices of the mishapcrew are incorporated into the animation, simulation or re-enactment videotape, thetape is not releasable due to the privacy interests of the crewmembers or their survivingfamilies." [795]
There are numerous limitations with the subjunctive techniques that are described in this section.In particular, it can be diÆcult to gain the data that is necessary to derive the models of applicationcomponents. This means that the resulting visualisations, such as that shown in Figure 8.12, mayultimately rest on little more than guess work. For instance, road traÆc simulations typicallyrequire information about both drivers' behaviour. This includes steering angles, brake and throttlesettings, gear selection, use of engine braking. Some models also expect information about the useof lights, of direction indicators cruise control settings and even wipers or warning horn. In addition,the models require information about the pre-impact speed, engine revs. per minute, accelerationhistory, braking eÆciency activation of anti-lock braking mechanisms etc. If these parameters arenot provided then systems either fail to produce a simulation or they exploit default assumptionsthat may not re ect the conditions that held during a particular incident. Such problems emphasisethe point that many subjunctive simulations reconstruct a probable or possible course of events.They do not provide a de�nitive and unambiguous account of most safety-critical incidents.

8.2. TYPES OF SIMULATION 249
Figure 8.14: Biomechanical Models in NTSB Incident Simulations (2)
Probabilistic Simulations
The use of subjunctive simulation techniques is hampered by the problems of data acquisition.Incident recorders are often unavailable. Even if this source of data is available, they often onlyprovide a small subset of the parameters that are required by many reconstructions. The situation isnot as problematic as it might �rst appear. In particular, performance metrics can often be recruitedto support data recorders and eye-witness information. Even when these metrics are not available,standard reliability techniques can be used to estimate the potential failure rates for particular piecesof equipment. For example, Table 8.6 presents availability data for the Display Channel Complexcomputers that formed an important component of the US Air TraÆc Management infrastructure.This is calculated as follows:
Availability =Mean Time Between Failure
Mean Time Between Failure + Mean Time to Repair
Although Table 8.6 focuses on availability, the same techniques can be used to model more generalprocess behaviour including network loading and resource scheduling. The key point is that theresulting stochastic models mirror the probabilistic behaviour of system components. They can,therefore, be used to determine the behaviour of any simulation in situations where data recorderswere unavailable or where their readings provide suspect results.
Monte Carlo techniques provide one relatively simple means of using availability data, such asthat shown in Table 8.6 to support subjunctive simulations. This proceeds by generating a randomnumber in the interval between 0 and 1. If the number is less than the availability rate for thatcomponent then that component is assumed to be available in the next interval. However, if thenumber is greater than the availability rate then the component is assumed to fail. For instance, theavailability of the Display Channel Complex at the Washington centre in the �rst quarter of 1994 was0.9086. If the random number generator produced 0.5 then the simulated Display Channel Complex
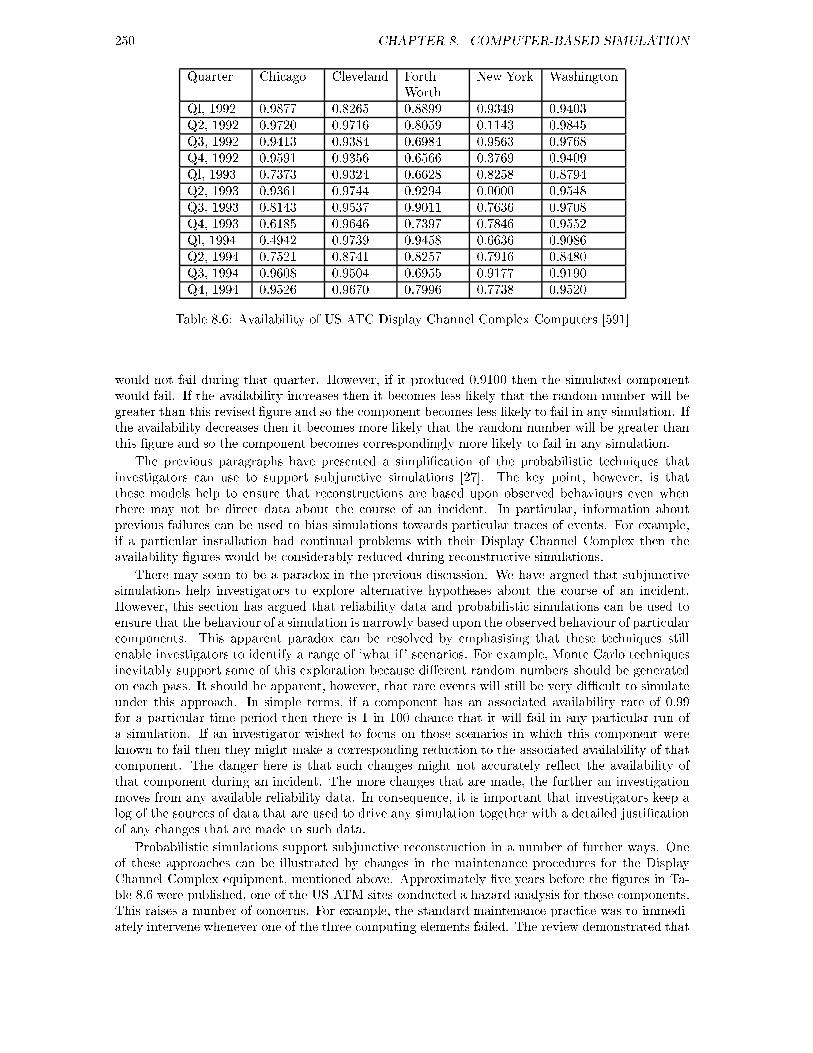
250 CHAPTER 8. COMPUTER-BASED SIMULATION
Quarter Chicago Cleveland ForthWorth
New York Washington
Ql, 1992 0.9877 0.8265 0.8899 0.9349 0.9403Q2, 1992 0.9720 0.9716 0.8059 0.1143 0.9845Q3, 1992 0.9413 0.9384 0.6984 0.9563 0.9768Q4, 1992 0.9591 0.9356 0.6566 0.3769 0.9409Ql, 1993 0.7373 0.9324 0.6628 0.8258 0.8794Q2, 1993 0.9361 0.9744 0.9294 0.0000 0.9548Q3, 1993 0.8143 0.9537 0.9011 0.7636 0.9708Q4, 1993 0.6185 0.9646 0.7397 0.7846 0.9552Ql, 1994 0.4942 0.9739 0.9458 0.6636 0.9086Q2, 1994 0.7521 0.8741 0.8257 0.7916 0.8480Q3, 1994 0.9608 0.9504 0.6955 0.9177 0.9190Q4, 1994 0.9526 0.9670 0.7996 0.7738 0.9520
Table 8.6: Availability of US ATC Display Channel Complex Computers [591]
would not fail during that quarter. However, if it produced 0.9100 then the simulated componentwould fail. If the availability increases then it becomes less likely that the random number will begreater than this revised �gure and so the component becomes less likely to fail in any simulation. Ifthe availability decreases then it becomes more likely that the random number will be greater thanthis �gure and so the component becomes correspondingly more likely to fail in any simulation.
The previous paragraphs have presented a simpli�cation of the probabilistic techniques thatinvestigators can use to support subjunctive simulations [27]. The key point, however, is thatthese models help to ensure that reconstructions are based upon observed behaviours even whenthere may not be direct data about the course of an incident. In particular, information aboutprevious failures can be used to bias simulations towards particular traces of events. For example,if a particular installation had continual problems with their Display Channel Complex then theavailability �gures would be considerably reduced during reconstructive simulations.
There may seem to be a paradox in the previous discussion. We have argued that subjunctivesimulations help investigators to explore alternative hypotheses about the course of an incident.However, this section has argued that reliability data and probabilistic simulations can be used toensure that the behaviour of a simulation is narrowly based upon the observed behaviour of particularcomponents. This apparent paradox can be resolved by emphasising that these techniques stillenable investigators to identify a range of `what if' scenarios. For example, Monte Carlo techniquesinevitably support some of this exploration because di�erent random numbers should be generatedon each pass. It should be apparent, however, that rare events will still be very diÆcult to simulateunder this approach. In simple terms, if a component has an associated availability rate of 0.99for a particular time period then there is 1 in 100 chance that it will fail in any particular run ofa simulation. If an investigator wished to focus on those scenarios in which this component wereknown to fail then they might make a corresponding reduction to the associated availability of thatcomponent. The danger here is that such changes might not accurately re ect the availability ofthat component during an incident. The more changes that are made, the further an investigationmoves from any available reliability data. In consequence, it is important that investigators keep alog of the sources of data that are used to drive any simulation together with a detailed justi�cationof any changes that are made to such data.
Probabilistic simulations support subjunctive reconstruction in a number of further ways. Oneof these approaches can be illustrated by changes in the maintenance procedures for the DisplayChannel Complex equipment, mentioned above. Approximately �ve years before the �gures in Ta-ble 8.6 were published, one of the US ATM sites conducted a hazard analysis for these components.This raises a number of concerns. For example, the standard maintenance practice was to immedi-ately intervene whenever one of the three computing elements failed. The review demonstrated that
8.2. TYPES OF SIMULATION 251
this might disable the two remaining computing elements and thereby jeopardise service provision.In consequence, a revised plan required that the engineers wait for a low traÆc period to beginrepairs. In consequence, there was a deliberate decision to continue operating with less-than-fullredundancy. Local technicians and managers believed that this is `less risky' than beginning imme-diate repairs. Table 8.6 presents availability data for a fully redundant Display Channel Complex.During subjunctive simulation, it would be relatively straightforward for investigators to replacethis with information with availability data from sites that operated the revised maintenance policy.Such techniques illustrate one of the ways in which simulations can be used to generalise beyond thespeci�c circumstances of a particular incident to examine other failure scenarios.
These applications of probabilistic simulations must be considered against a number of limita-tions. Chapter 2.3 has already described the practical and theoretical problems that are associatedwith the stochastic modelling of software failures. These concerns form part of a wider scepticismabout the probabilistic modelling of safety-critical incidents. For instance, Chapter 1.3 has describedWright's recent work in the railway industry [875]. She has shown that previous information abouta large number of relatively low criticality failures often provides few hints about the likely state ofa system during higher criticality incidents. These caveats have recently persuaded a group of re-searchers under John Fox at the Imperial Cancer Research Fund to look at possibilistic simulations.The intention is not simply to explore what is likely but rather to determine what is feasible givena particular model of the system. The obvious drawback to this approach is that many possiblescenarios may lead to a particular incident. Possibilistic simulations, therefore, depend upon argu-ments about the plausibility of a particular scenario given what is known about a set of events. Theemphasis is, therefore, placed upon a more general argument of plausibility rather than a search toquantify reliability estimates. These ideas need to be more fully developed. In particular, more workneeds to determine the appropriate form for convincing and plausible arguments about the veracityof a simulation. As we have seen, many reconstruction techniques o�er ample opportunities forbiasing simulations towards particular viewpoints about the causes of complex failures. There are,however, strong links between this approach and, for instance, the increasing use of model checkingin safety and reliability analysis. This approach models an application in terms of a number ofpossible state transitions. These transitions describe how the state of a system can change overtime. Analysts can then specify properties or theorems that they would like to hold over the system.Automated model checking tools will then explore the possible states of the system to determinewhether or not the property actually does hold for this model of the system [193].
A number of further issues complicate the application of subjunctive simulation techniques forincident reconstruction. Arguably the most important of these surrounds the modelling of team-based interaction during adverse occurrences. Previous paragraphs have explained how cockpitvoice recorders and ight data recorders can be used to integrate human factors observations intophysical models of safety-critical incidents. However, we have not explained how reconstructionsmight be developed when such data is unavailable. Probabilistic techniques, such as Monte Carlosimulations, can be used to address this limitation. System operators can be asked to interact witha simulation as it reproduces a probable failure scenario. Operator behaviour can be monitoredover successive runs to identify a range of possible responses. This is, however, a partial solution.Operators often alter their behaviour if they know that they are being monitored in the aftermathof an incident. Such problems are exacerbated if operators must interact with computer-basedsimulations rather than with their `real world' counterparts. Moving a desktopVR model of atrain around a simulated track is hardly comparable to the physical and mental processes involvedin driving a real locomotive. Similarly, it can be extremely diÆcult to reconstruct the workingpressures and team-based interactions that characterise most working environments.
Single and Multi-User Simulations
It can be diÆcult for individuals to recall their actions immediately before an incident. Even if theycan remember, personal, organisational and social pressures can prevent operators from renderingaccurate accounts of their behaviour. In consequence, it is important that investigators have somemeans of reconstructing alternative hypotheses about the role of human intervention in an incident.
252 CHAPTER 8. COMPUTER-BASED SIMULATION
There are two main approaches to this form of simulation. The �rst is to study human interactionwith computer based reconstructions, in the manner described above. The second is to derivecomputer-based simulations that attempt to model human intervention with complex systems.
The following list summarises some of the problems that arise when studying operator inter-action with simulated systems. These problems stem partly from the diÆculty of staging suchreconstructions and partly from interpreting the observations that can be derived from them:
� problems in obtaining access to appropriate sta�. In the aftermath of an incident, it can often bediÆcult for investigators to obtain the cooperation of operators who are willing to participatein simulation studies. Such volunteers must possess the necessary skills and experience to takepart in the studies. They must agree to have their performance monitored and recorded whilethey interact with a simulation, even over prolonged periods of time. They must be preparedto `suspend disbelief' when mock-ups replace application processes. Even if such individualscan be found, it is often important to secure the support of trades unions and other formsof worker representation before many workers will participate in such studies. This usuallyinvolves assurances about the ultimate use of any data that is to be derived from the studies;
� diÆculty of simulating individual factors. The list of requirements in the previous paragraphcan have a paradoxical e�ect on participant selection for simulator studies. They imply thatpotential `subjects' must have an active interest and involvement in safety issues. Individualswho are prepared to have their interaction monitored over prolonged periods of time may notprovide results that can be generalised across the rest of the workforce. Even if such biasescan be counteracted, it seems unlikely that investigators will be able to address the diverserange of behaviours that characterise individual responses to the stress and uncertainty ofmany incidents. In other words, simulator studies may only provide a partial glimpse of theoperator behaviours that might have occurred during a particular failure;
� diÆculties in repeat simulations. Operator interaction can be observed during several trialswith the same scenario. This helps to reduce any nervousness during an initial observation.It can also help to reduce any e�ects that stem from di�erences between a simulation andthe `real world' system. However, operators may gradually transfer knowledge gained fromprevious trials to guide their interaction with subsequent simulations. This not only appliesto repeated trials with the same scenario, knowledge can also be transferred between di�erentsimulations. It can, therefore, be argued that operator interaction can provide less and lessrealistic results as the number of trials increases. Eventually there is a danger that boredomand fatigue may provoke behaviours that would not be apparent in other circumstances;
� diÆculty of simulating contextual events. Chapter 2.3 brie y introduced the range of per-formance shaping factors that can a�ect operator behaviour. These can include heat, noise,light-levels, individual fatigue, alcohol and drugs etc. In anonymous reporting systems it isoften impossible to determine whether ot not these played a signi�cant role if they are notexplicitly mentioned in an incident report. Even if investigators can interview operators, theymay not be aware of the extent to which these factors have in uenced their actions. Assumingthat investigators have identi�ed the importance of heat, noise etc, they then face the taskof accurately recreating these in uences in a manner that is ethically acceptible. This is lesseasy than it might at �rst appear. In some studies, operators exhibit a relatively small num-ber of errors under ideal conditions. In consequence, investigators have started to bombardthem with noises, ashing lights and other forms of distraction so that the simulations becomeparodies of the environments that they represent;
� diÆculty of provoking rare behaviours. Many of the operator behaviours that exacerbate orcause incidents are extremely rare. In most cases, systems are designed to mitigate the con-sequences of such actions. Individuals may also be preselected and trained to reduce thelikelihood of such intervention. In the aftermath of many incidents, operators can also besensitised by rumours of their colleagues' intervention. This may make individuals even lesslikely to repreat those previous failures. All of these factors may force investigators to run
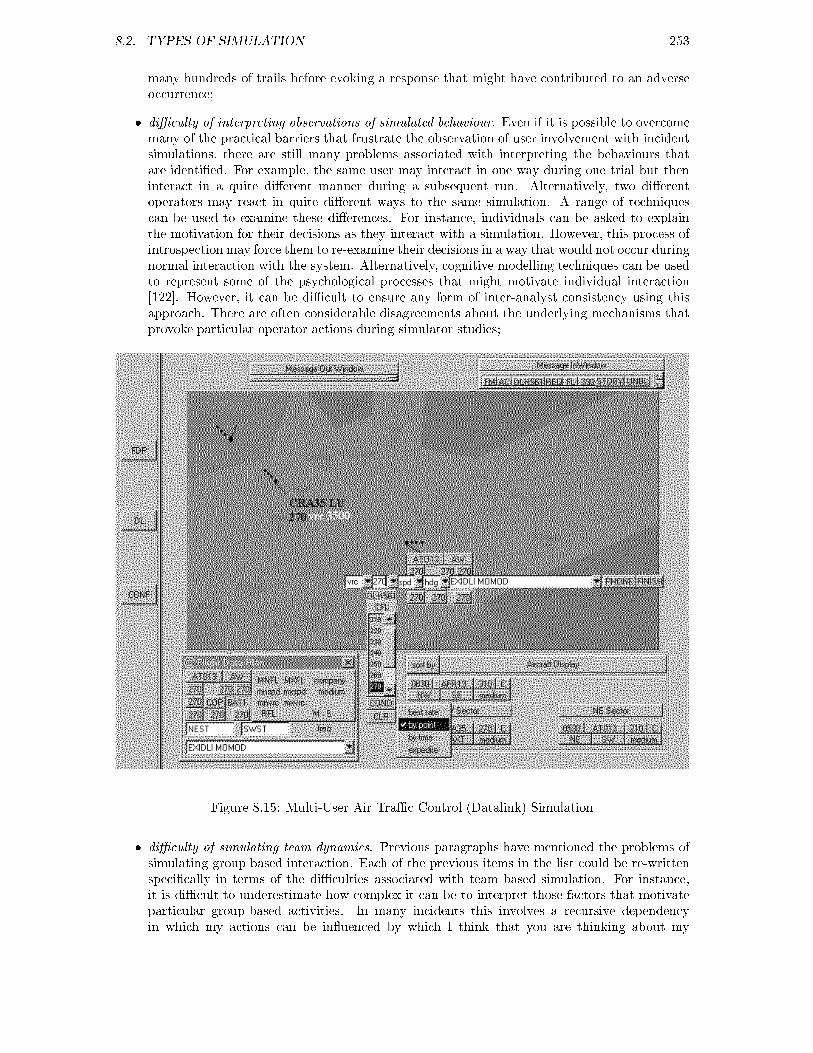
8.2. TYPES OF SIMULATION 253
many hundreds of trails before evoking a response that might have contributed to an adverseoccurrence;
� diÆculty of interpreting observations of simulated behaviour. Even if it is possible to overcomemany of the practical barriers that frustrate the observation of user involvement with incidentsimulations, there are still many problems associated with interpreting the behaviours thatare identi�ed. For example, the same user may interact in one way during one trial but theninteract in a quite di�erent manner during a subsequent run. Alternatively, two di�erentoperators may react in quite di�erent ways to the same simulation. A range of techniquescan be used to examine these di�erences. For instance, individuals can be asked to explainthe motivation for their decisions as they interact with a simulation. However, this process ofintrospection may force them to re-examine their decisions in a way that would not occur duringnormal interaction with the system. Alternatively, cognitive modelling techniques can be usedto represent some of the psychological processes that might motivate individual interaction[122]. However, it can be diÆcult to ensure any form of inter-analyst consistency using thisapproach. There are often considerable disagreements about the underlying mechanisms thatprovoke particular operator actions during simulator studies;
Figure 8.15: Multi-User Air TraÆc Control (Datalink) Simulation
� diÆculty of simulating team dynamics. Previous paragraphs have mentioned the problems ofsimulating group based interaction. Each of the previous items in the list could be re-writtenspeci�cally in terms of the diÆculties associated with team based simulation. For instance,it is diÆcult to underestimate how complex it can be to interpret those factors that motivateparticular group-based activities. In many incidents this involves a recursive dependencyin which my actions can be in uenced by which I think that you are thinking about my

254 CHAPTER 8. COMPUTER-BASED SIMULATION
current intentions [407]. As mentioned in Chapter 2.3 team-based interaction can be dominatedby particular individuals. This may or may not re ect what actually happened during aparticular incident. It can often be diÆcult to recreate the balance of skills and personalitiesthat contributed to an incident. Similarly, the problems of securing operator participation areexacerbated by the pragmatic diÆculties of ensuring that di�erent operators are all available atthe same time. There can also be signi�cant costs associated with the development of multi-usersimulations. Figure 8.15 illustrates an interface that has been produced using one of a numberof environments that are intended to reduce these costs [720, 721]. This multi-user interfacebuilder has the added bene�t that it can be used in conjunction with the model checking toolsthat were mentioned in the previous section. This example shows an en-route controller's viewof a datalink air traÆc control system. They can communicate with other controllers and withindividuals playing the roles of the aircrews in their sector. The expense involved in running asimulation session with quali�ed operators should be obvious. The complexity in implementingsuch a system and then linking it to accurate traÆc models should also be apparent.
Given all of these problems, a growing number of researchers have turned to alternative means ofsimulating operator interaction with safety-critical systems [728]. Rather than creating environmentsthat are intended to enable human operators to replicate the events leading to failure, this approachextends the scope of computer-based simulations. In particular, research teams have developed anumber of computer-based simulations that are intended to recreate individual behaviour. Someof these models have also been `hooked up' to other simulations of system behaviour in order toobserve potential interaction. Again these techniques are still in their infancy. For instance, NASAAmes research centre recently reported on the APEX project that was speci�cally intended tomake Human-Machine system simulation a practical engineering technique' [704]. This project hasidenti�ed an architecture for future systems. The interpretation of auditory and visual input helpsto determine the contents of the operator's working memory. This, in turn, in uences the processby which an individual selects their actions for intervention. These actions are executed throughcomponents that model gaze and attention as well as vocal commands and the operator's gestures. Atpresent, this work focuses on modelling the behaviour of individual operators. It has the importantadvantage of explicitly representing theories about the factors that motivate operator behaviour.Although in the future it might be possible to compose several of these models to simulate groupinteraction, it remains unclear how this might be achieved in practice. I am also unaware of anyattempts to apply this approach during an incident investigation.
8.2.4 Hybrid Simulations
This second half of this chapter has identi�ed a number of di�erent simulation techniques that in-vestigators can use to reconstruct the events leading to safety-critical incidents. In identifying thesedi�erent approaches it has, however, been necessary to introduce what are often arbitrary distinc-tions. For example, subjunctive simulations can be used during the initial stages of an investigation.Once analysts have reconstructed a likely course of events, this may then be used to produce ani-mated simulations. These prevent viewers from exploring the alternative options that are availableto incident investigators. In contrast to subjunctive techniques, users are simply presented with alinear sequence of images that illustrate a particular perspective on an incident. There are furthercomplexities. For instance, declarative reconstructions can be used to model the physical environ-ment in which an incident occurs. However, they provide little information about the way in whichparticular events contribute to an adverse occurrence. They must be used in conjunction either withtext-based time-lines or with abstract simulations of critical events. It can, therefore, be argued thatmost reconstruction tools exploit hybrid combinations of the techniques that we have reviewed.
Figure 8.16 provides an example of a hybrid approach to incident reconstruction. This designwas developed by Gilles Le Galo as part of a proposed simulation tool for incident investigationthroughout European air traÆc control [423]. As can be seen, the top portion of the display usesdata logs to provide real-time reconstructions of the controllers primary information displays. Belowthis there is an area that reproduces the ight strips that were being used by the controller whilethey were interacting with this information. This is an interesting use of hybrid reconstruction
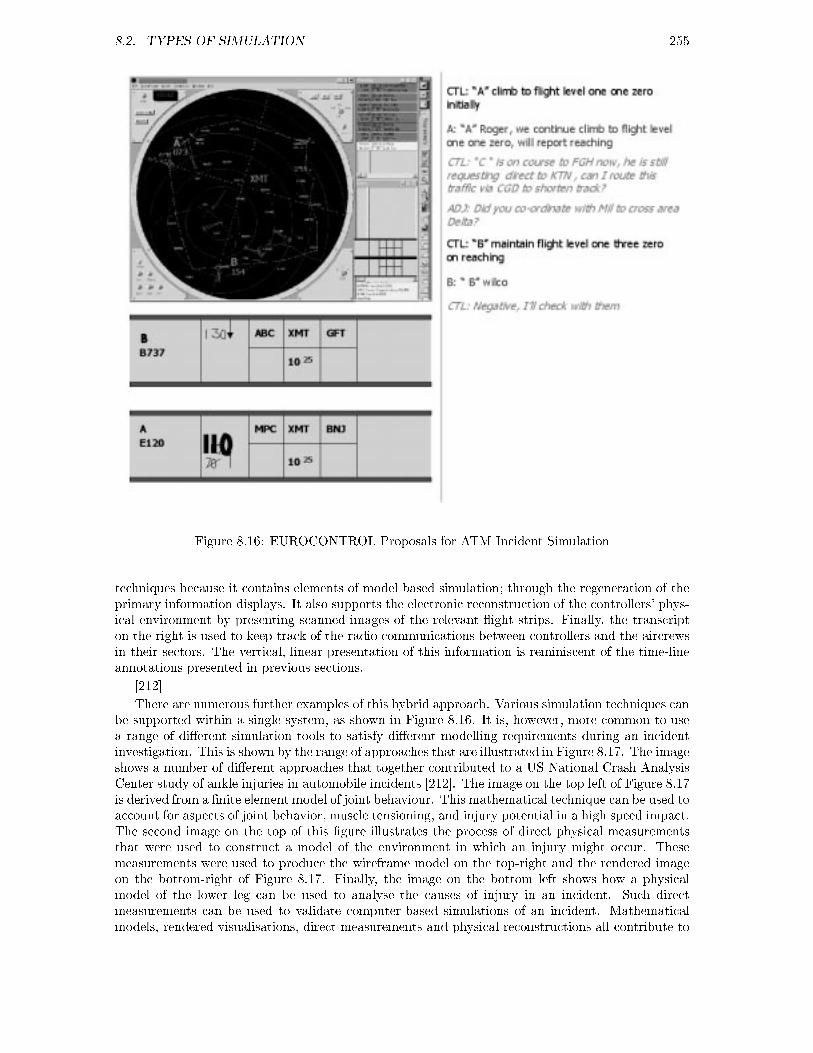
8.2. TYPES OF SIMULATION 255
Figure 8.16: EUROCONTROL Proposals for ATM Incident Simulation
techniques because it contains elements of model based simulation; through the regeneration of theprimary information displays. It also supports the electronic reconstruction of the controllers' phys-ical environment by presenting scanned images of the relevant ight strips. Finally, the transcripton the right is used to keep track of the radio communications between controllers and the aircrewsin their sectors. The vertical, linear presentation of this information is reminiscent of the time-lineannotations presented in previous sections.
[212]
There are numerous further examples of this hybrid approach. Various simulation techniques canbe supported within a single system, as shown in Figure 8.16. It is, however, more common to usea range of di�erent simulation tools to satisfy di�erent modelling requirements during an incidentinvestigation. This is shown by the range of approaches that are illustrated in Figure 8.17. The imageshows a number of di�erent approaches that together contributed to a US National Crash AnalysisCenter study of ankle injuries in automobile incidents [212]. The image on the top left of Figure 8.17is derived from a �nite element model of joint behaviour. This mathematical technique can be used toaccount for aspects of joint behavior, muscle tensioning, and injury potential in a high speed impact.The second image on the top of this �gure illustrates the process of direct physical measurementsthat were used to construct a model of the environment in which an injury might occur. Thesemeasurements were used to produce the wireframe model on the top-right and the rendered imageon the bottom-right of Figure 8.17. Finally, the image on the bottom left shows how a physicalmodel of the lower leg can be used to analyse the causes of injury in an incident. Such directmeasurements can be used to validate computer-based simulations of an incident. Mathematicalmodels, rendered visualisations, direct measurements and physical reconstructions all contribute to
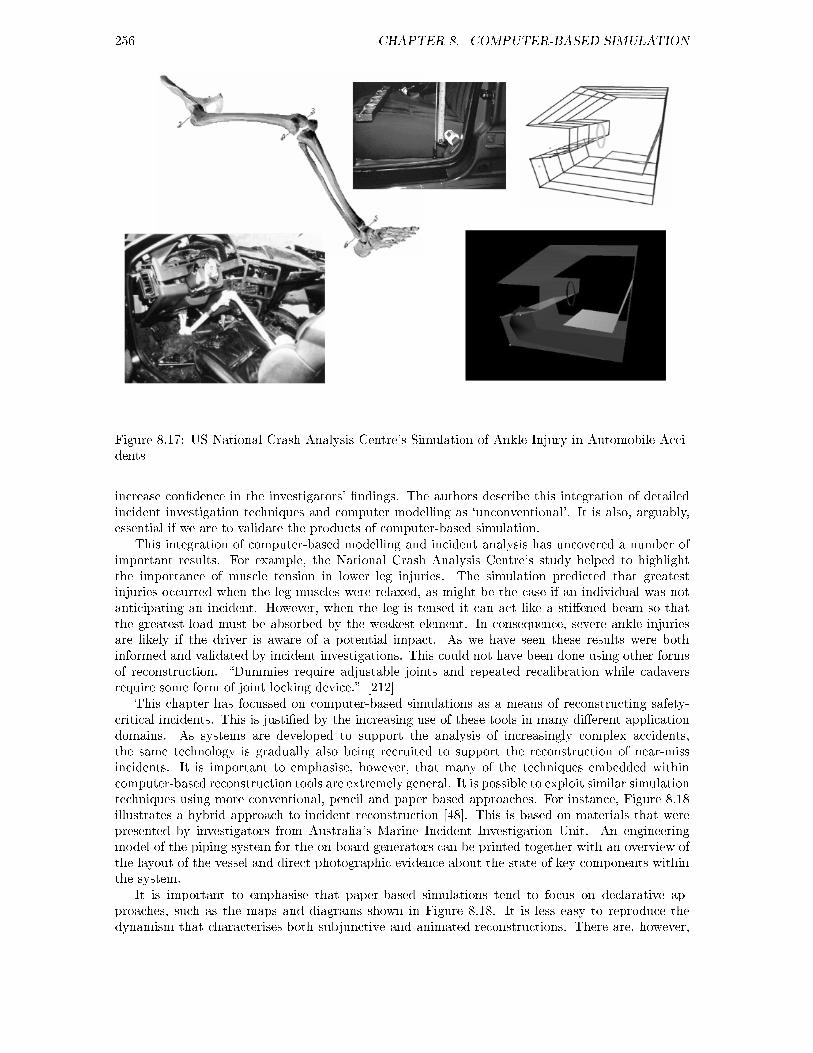
256 CHAPTER 8. COMPUTER-BASED SIMULATION
Figure 8.17: US National Crash Analysis Centre's Simulation of Ankle Injury in Automobile Acci-dents
increase con�dence in the investigators' �ndings. The authors describe this integration of detailedincident investigation techniques and computer modelling as `unconventional'. It is also, arguably,essential if we are to validate the products of computer-based simulation.
This integration of computer-based modelling and incident analysis has uncovered a number ofimportant results. For example, the National Crash Analysis Centre's study helped to highlightthe importance of muscle tension in lower leg injuries. The simulation predicted that greatestinjuries occurred when the leg muscles were relaxed, as might be the case if an individual was notanticipating an incident. However, when the leg is tensed it can act like a sti�ened beam so thatthe greatest load must be absorbed by the weakest element. In consequence, severe ankle injuriesare likely if the driver is aware of a potential impact. As we have seen these results were bothinformed and validated by incident investigations. This could not have been done using other formsof reconstruction. \Dummies require adjustable joints and repeated recalibration while cadaversrequire some form of joint locking device." [212]
This chapter has focussed on computer-based simulations as a means of reconstructing safety-critical incidents. This is justi�ed by the increasing use of these tools in many di�erent applicationdomains. As systems are developed to support the analysis of increasingly complex accidents,the same technology is gradually also being recruited to support the reconstruction of near-missincidents. It is important to emphasise, however, that many of the techniques embedded withincomputer-based reconstruction tools are extremely general. It is possible to exploit similar simulationtechniques using more conventional, pencil and paper based approaches. For instance, Figure 8.18illustrates a hybrid approach to incident reconstruction [48]. This is based on materials that werepresented by investigators from Australia's Marine Incident Investigation Unit. An engineeringmodel of the piping system for the on-board generators can be printed together with an overview ofthe layout of the vessel and direct photographic evidence about the state of key components withinthe system.
It is important to emphasise that paper-based simulations tend to focus on declarative ap-proaches, such as the maps and diagrams shown in Figure 8.18. It is less easy to reproduce thedynamism that characterises both subjunctive and animated reconstructions. There are, however,

8.3. SUMMARY 257
Figure 8.18: Integration of MIIU Plans, Models, Maps and Photographs
some notable exceptions to this general remark. For instance, Figure 8.19 illustrates how the NTSBhave used images from desktopVR simulations to illustrate paper-based documents [598]. This imagealso demonstrates that many previous distinctions between paper-based and electronic reconstruc-tions are becoming extremely blurred. Figure 8.19 shows the electronic version of a paper basedincident report. It can be downloaded from the NTSB's web site (www.ntsb.gov). This electronicversion of a paper based report was, in turn, generated using an electronic simulation. This transla-tion between electronic and paper-based media is currently not well handled by many investigationagencies. It produces numerous ironies and inconsistencies. Readers who access the NTSB's websitecan only view the static image that is presented in the paper-based report. This misses an im-portant opportunity to exploit the presentation techniques that are supported by computer-based,simulations.
8.3 Summary
This chapter has introduced the distinction between reconstruction and causal analysis. The formeris intended to identify what happened during an incident by simulating the ow of events that ledto a near-miss. The latter is intended to explain why those events occurred in the �rst place. Theprevious sections, and the next chapter, focus on reconstruction. The intention is to provide a broadoverview of the tools and techniques that can be used to piece together evidence for an investigationto develop a coherent account of the course of an incident. This chapter has focuses on computer-based simulations. This is justi�ed by the increasing use of these systems to support incident andaccident investigations in many di�erent application domains. In contrast, the next chapter looksmore narrowly at the use of textual and graphical notations to model the events leading to failure.These techniques do not require computer support.
It may seem paradoxical to discuss computer-based simulations before paper-based techniques.
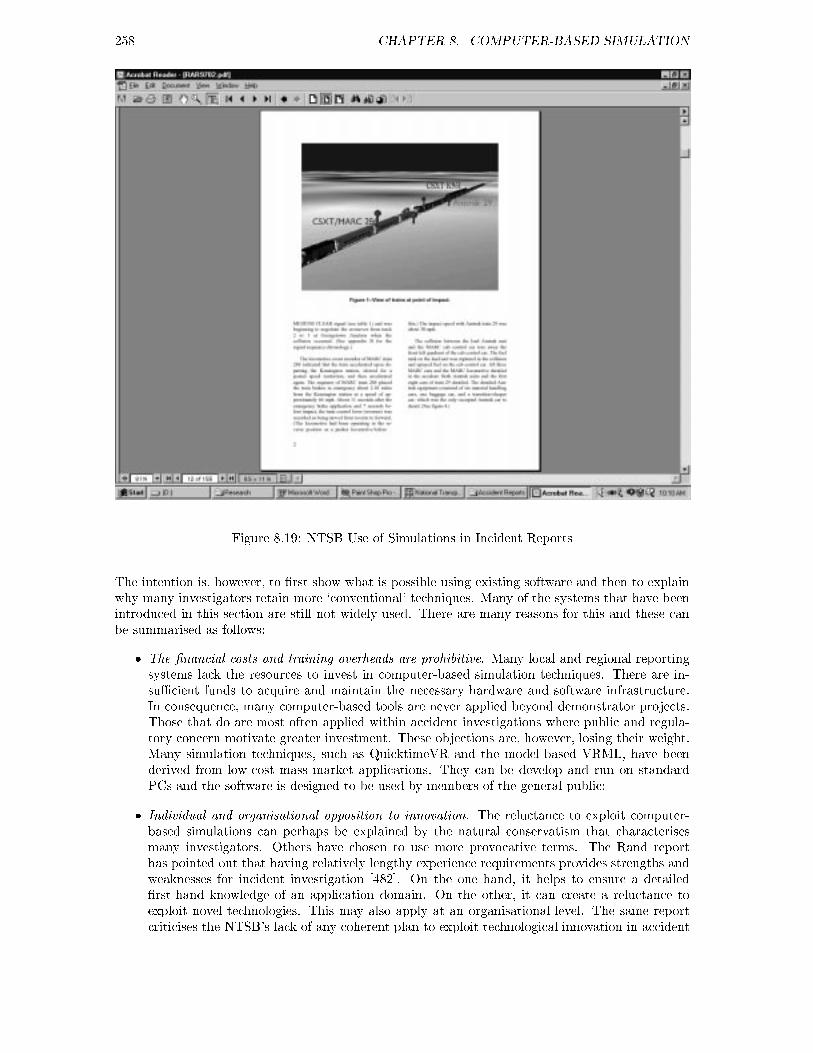
258 CHAPTER 8. COMPUTER-BASED SIMULATION
Figure 8.19: NTSB Use of Simulations in Incident Reports
The intention is, however, to �rst show what is possible using existing software and then to explainwhy many investigators retain more `conventional' techniques. Many of the systems that have beenintroduced in this section are still not widely used. There are many reasons for this and these canbe summarised as follows:
� The �nancial costs and training overheads are prohibitive. Many local and regional reportingsystems lack the resources to invest in computer-based simulation techniques. There are in-suÆcient funds to acquire and maintain the necessary hardware and software infrastructure.In consequence, many computer-based tools are never applied beyond demonstrator projects.Those that do are most often applied within accident investigations where public and regula-tory concern motivate greater investment. These objections are, however, losing their weight.Many simulation techniques, such as QuicktimeVR and the model-based VRML, have beenderived from low-cost mass market applications. They can be develop and run on standardPCs and the software is designed to be used by members of the general public;
� Individual and organisational opposition to innovation. The reluctance to exploit computer-based simulations can perhaps be explained by the natural conservatism that characterisesmany investigators. Others have chosen to use more provocative terms. The Rand reporthas pointed out that having relatively lengthy experience requirements provides strengths andweaknesses for incident investigation [482]. On the one hand, it helps to ensure a detailed�rst-hand knowledge of an application domain. On the other, it can create a reluctance toexploit novel technologies. This may also apply at an organisational level. The same reportcriticises the NTSB's lack of any coherent plan to exploit technological innovation in accident
8.3. SUMMARY 259
and incident investigations. Such comments provoke strong reactions. The Rand report'scomments are undoubtedly true for many investigator bodies. It seems paradoxical, however,that some of these criticisms should be applied to an organisation that has also shown a strongdesire to innovate. Many of the simulations in this chapter have been inspired by the NTSB'swork in this area;
� Simulations forcer investigators to consider a small subset of incident scenarios. There are arange of more theoretical objections to the introduction of computer-based simulations. Forinstance, the visual impact of many computer-based simulations can have an unwarrantede�ect upon some investigators. This is particularly important given the diÆculty of validatingthe backwards reasoning that drives many simulations. Investigators are often required toestimate the forces or other properties necessary to incur the consequences that are observedin the aftermath of an incident. Unfortunately, the same observed set of outcomes can bederived from many di�erent precursors. This creates particular concerns if simulation toolsfocus investigators' upon a small number of these potential scenarios.
� Simulations can encourage encysting and may limit the scope of an investigation. By `encyst-ing' we mean that investigators may spend so much of their available resources on developingan elegant simulation that they neglect other aspects of their analysis. This e�ect is com-pounded by the fact that some aspects of an incident can be extremely diÆcult to reconstructusing current tools. For example, it can be hard to reconstruct some meteorological conditionsusing many existing systems. Similarly, it is hard to envisage ways in which current tools canbe used to animate the events leading to managerial and regulatory failures;
� Reconstructions can raise as many questions as they answer. Ultimately, simulation toolsare only useful if they support the wider objectives of the people and organisations who usethem. There is, arguably, a perception that investigators are adequately supported by thepencil and paper-based techniques that are discussed in the next chapter. If Perrow [677] andSagan [719] are correct then this situation will change as incidents and accidents re ect theincreasing complexity of modern technology. It does not, however, follow that computer-basedsimulations provide an appropriate alternative to these conventional techniques. For instance,current text-based time-lines enable investigators to work at a level of abstraction that isappropriate to the stage of their investigation. Crude sketches, which are produced during aninitial enquiry, can be developed and extended as more information becomes available. This`principle' of proportionate e�ort is often violated by many simulation tools. Investigatorsare often forced to accept a range of default parameters because they have no available dataabout particular aspects of an incident. Some automobile simulators require information aboutwhether lights and wipers were working at the point of impact;
� Regulatory guidelines can restrict the use of simulation tools. Previous paragraphs have re-ferred to the `god's eye' view that is provided by some computer-based systems. These toolsenable investigators to integrate data from diverse sources, many of which could not have beenaccessed by operators during an incident. The resulting animations can have an insidious ef-fect. With the bene�t of hindsight and with access to these additional data sources they canused to suggest that operators should have been better prepared for an incident. Reasonableconcerns over this mis-use of technology have persuaded some regulators to restrict the useof computer-based simulations [423]. Typically, these only apply to the public disseminationof any resulting animations or models rather than to their use in the reconstruction of anincident.
These objections must be balanced against the bene�ts of computer-based simulations. These canbe summarised as follows:
� Simulations enable investigators to reconstruct the environment in which an incident occurs.As we have seen, a range of model-based and photorealistic techniques can be used to re-construct the layout of a working environment. Investigators can then use interpolation and

260 CHAPTER 8. COMPUTER-BASED SIMULATION
rendering software to move within those environments. This approach can be used to recordthe aftermath of an incident, for instance using QuicktimeVR techniques. It can also be usedto recreate what the operators might have seen from a number of di�erent locations. The sameapproaches can also be used to reconstruct particular items that were involved in an incident.A common strength of all these visualisation techniques is that enable users to survey sitesthat may be too hazardous or expensive for them to visit on subsequent occasions.
� Simulations enable investigators to replay events in real and virtual time. The opening sectionsof this chapter stressed the role of reconstructions in establishing agreement over the courseof an incident. Computer-based animations o�er considerable exibility in the way that in-vestigators can play and replay particular events. Software support can be used to alter thereal-time of key failures. The sequence in which they occur can also be reviewed and amended.Although there may be initial costs in terms of the time taken to learn how to exploit thisauthoring software, these are more that o�-set by the exibility of the resulting simulations. Inparticular, computer-based simulation tools can signi�cantly redice the complexity associatedwith the maintenance of paper-based documents capture many hundreds of events;
� Simulations enable investigators to integrate multiple data sources. Primary and secondaryinvestigations are intended to secure incident data from many diverse sources. Computer-basedsimulations provide means of integrating this information into hybrid reconstructions. Thereare many existing problems. For instance, it can be diÆcult to integrate continuous and discretedata. It can also be diÆcult to determine the best means of exploiting probabilistic information.Current research continues to explore means of representing operator intervention. In spite ofthese caveats, computer-based simulations arguably provide the greatest hope of unifying theincreasing mass of information that can be obtained in the aftermath of many safety-criticalincidents;
� Simulations enable investigators to explore `subjunctive' behaviours. There is an increasingrecognition that advanced mathematical techniques can be used to model e�ects that arediÆcult or impossible to assess using other approaches. For instance, the e�ects of muscletension during traÆc accidents can be tested using dummies or cadavers. In the former case,there are considerable recalibration problems associated with the linkages between simulatedmuscle groups. In the latter case, additional support structures must be used to maintainposture prior to the simulated incident. Alternatively, computer-based models can be derivedto provide a low-cost means of simulating the consequences of crashes again and again andagain. The results of these studies can be validated using more conventional techniques.However, the costs of crashing full-scale replicas would prohibit the range and scope of teststhat can easily be conducted using software environments. An important bene�t of theseapproaches is that support subjunctive simulation. In other words, the low-costs associatedwith running a trial can encourage investigators to consider a wide range of `what if' scenarios.This, in turn, encourages the generalisation that was emphasised in the opening sections ofthis chapter. It is possible to llok beyond the speci�c events of a near-miss incident to examinepotential ways in which such failures might have had more serious consequences.
The use of computer-based reconstruction in incident and accident investigation has had a number ofnotable successes [9, 212]. It is important to emphasise, however, that many questions remain to beanswered about the pragmatic application of these techniques. The development of reconstructiontools to support incident reconstruction lags behind other applications of this technology. The USAviation Safety Research Act of 1988 provides an insight into the reasons for this lack of investment.This act charged the FAA to undertake \...a research program to develop dynamic simulation modelsof the air traÆc control (ATC) system which will provide analytical technology for predicting airportand ATC safety and capacity problems, and for evaluating planned research projects". The USNational Simulation Capability Program was established in response to this congressional mandate.Its goals and objectives re ect the intentions of the Act. Simulations are intended to support trainingand assist in the development of new systems. The Act arguably neglects the role that simulationscan play in understanding the causes of past failures.