chapter-7shodhganga.inflibnet.ac.in/bitstream/10603/7353/15/15_chapter 7.pdf · chapter-7 284 punit...
TRANSCRIPT

CHAPTER-7 284
Punit H Suthar/Ph.D (Physics)/Sardar Patel University/May-2012
CHAPTER-7
Total Energy and Equation of state for
Solids solutions
“Total energy of some FCC metals” 22nd Gujarat Science Congress (GSC) organized by Bhavnagar University,
Bhavnagar.
7.1 Introduction 285
7.2 Theory and Method of computation 287
7.3 Results and Discussions
7.3.1 Total energy
7.3.2 Pressure and Volume relation
7.3.3 Energy and Volume relation
291
291
298
305
References 312
CHAPTER-7 285
Punit H Suthar/Ph.D (Physics)/Sardar Patel University/May-2012
7.1 Introduction
It is known that the electronic properties of some metals and alkaline earth
metals, some transition metals and their alloys can be understood using the
pseudopotential theory. The total energy of pure metals in the framework of the
second order perturbation theory has been a subjected of many pseudopotential
studies [7.1-715]. However the underlying assumption in the calculation of the total
energy of alloys is the same as that for pure metals. Such studies on the binary alloys
are very limited [7.16-7.24].
The equation of state (EOS) is the relationship between pressure, volume and
temperature, i.e. the (P, V, T) relation. They are of immense importance to
theoreticians as well as experimentalists. In theoretical physics, they provide a test to
the theoretical models of cohesion and predict the onset of phase transition (insulator
to metal, valence transition, solid to liquid, stable crystal structure, etc.). They are also
used for pressure calibration in high-pressure experiments and are needed to relate the
measured pressure variation of some physical quantity (e.g. elastic constants,
transport properties, specific heat, etc.) to the calculated volume variation. It has been
discovered that d-electrons (Cr, Ni, Cu) play a crucial role in determining the stable
structure of not only the transition metals but also of the alkaline- earth and group II-
B metals. For the transition metals from left to right across the periodic table, the
trend seems to be bcc and fcc sequence of structures [7.15] equation of state, total
crystal energies, in the case of alkaline earth metals, the trend explained by the
presence of d-electrons and f-electrons includes the fcc and bcc sequence observed
with increasing atomic numbers [7.25, 7.26] that can be studied using energy–volume
relation and equation of state. In astrophysics the, EOS is used to unravel the
mysteries of evolution of stellar bodies like white dwarfs, neutron stars and black
holes while in geophysics it helps to understand the structure of the Earth. The range
of the pressure interior of the Earth is 350 GPa. Various experimental techniques were
used to study the EOS under high pressure. The data by Bridgman [7.27] using the
piston cylinder method were the first to be reported and the pressure range was about
5–10 GPa (static). In a similar way Vaidya and Kennedy [7.28] made careful
measurement up to about 4.5 GPa. Drickmer [7.29] extended the pressure range up to

CHAPTER-7 286
Punit H Suthar/Ph.D (Physics)/Sardar Patel University/May-2012
20–30 GPa using a supported anvil device. In the early seventies, the range of static
pressure EOS has been extended to over 100 GPa using diamond anvil devices [7.30-
7.31]. The development of dynamic shock wave techniques using chemical explosives
increased the pressure range to 50 GPa [7.32, 7.33]. Since then a number of
techniques (e.g. lasers [7.34], electron guns [7.35], and underground nuclear
explosions [7.36]) have been developed for generating controlled dynamic high
pressures, whose limit is 10 GPa. While studying EOS theoretically, the major
difficulty arises from the question how to incorporate correctly the structurally
complicated inter-particle interactions of the many-body problem. Previously, many
authors [7.19, 7.20, 7.37–7.45] have studied the EOS using different techniques such
as the tight-binding total-energy classical cell model [7.41], the generalized
pseudopotential theory [7.42], Debye-Gr¨uneisen theory [7.43], recent classical mean-
field model [7.44], linearised augmented plane-wave method with both the local
density and generalized gradient approximation [7.45] and model pseudopotential
methods [7.37–7.40]. In the present work, we have studied the EOS for all alkaline
earth metals, some transition metals and their binary alloys using two different
pseudopotentials. The EOS of Cu has been studied up to a pressure of 1000 GPa, for
Ni the pressure range is up to 55 GPa. We have also calculated the total energy,
pressure - volume relation and energy- volume elements. We calculate some atomic
properties of Ba, Cr (BCC), Al, Ca, Ni, Cu, Sr (FCC) metals, and NiAl, Ni3Al and
Al 2Sr binary system using the pseudopotential theory and second order perturbation
theory. We have selected this particular metals and alloys, just because of their
extraordinary properties and many applications in the industry. It is known that the
intermetallic compounds like NiAl [7.46], Ni3Al [7.46] and Al2Sr[7.47] demonstrates
a number of attractive properties that motivate its extensive use in industry [7.1]. The
alloys of Al with transition metals show advantageous properties such as high
strength, lightness, corrosion resistance, recyclability and formability. Hence
aluminum-transition metal alloys are being employed in ever-increasing number of
applications as in ballast, step soldering, radiation shielding, alloy casting, in
construction of modern aircrafts and rockets, to coat telescope mirrors, packaging,
architecture and electrical transmission applications [7.1, 7.48].
The atomic properties like total crystal energy, pressure, energy – volume
relations and pressure – volume relations are computed for Al, Ca, Ni, Cu, Sr (FCC),
CHAPTER-7 287
Punit H Suthar/Ph.D (Physics)/Sardar Patel University/May-2012
Ba, Cr (BCC) and their binary (NiAl, Ni3Al, Al 2Sr) solid solutions using the
reciprocal sum analysis method. The well tested model potentials [7.49, 7.50] along
with six different forms of local field correction functions (LFCF) namely Hartree
[7.3], Taylor [7.51], Ichimaru-Utsumi [7.52], Farid et al. [7.53], Sarkar and Sen [7.54]
and Hubbard Sham [7.55, 7.56] local field correction functions to compute the
screened form factors, which are then used to calculate the equation of state for many
solid solutions of interest.
7.2 Theory and Method of computation
It is difficult to compute static and dynamic properties of crystals such as total
energy, pressure, bulk modulus and lattice vibrations using information obtained from
the band structure calculation. Second-order perturbation theory based on the
pseudopotential formalism is used to study the properties of crystals.
The total energy of a crystal may be regarded as the sum of two contributions,
one of which depends only on the volume of the crystal, and the other, formally, only
on the crystal structure. The former includes terms which are independent of the
atomic distribution, namely, the kinetic energy of free electrons, the exchange and
correlation energies. The structure dependent energy is the sum of electrostatic energy
and the band energy. The total crystal energy per atom of pure metal has been
computed by many workers using pseudopotential calculations upto the third order in
the perturbation approach [7.57].
The first work on the band energy of alloy was done by Hayes and co-
workers [7.58] using a non-local potentials. Gurskii and Krasko [7.59] have reported
the total binding energy for all the five alkali metals using a model potential which is
continous in r-space. Soma [7.5, 7.19, 7.20] was successful in computing total energy
and bulk modulus of some co-valent compounds on the basis of extended perturbation
theory. They have used historical model potentials and local Heine-Abarenkov model
potential [7.60 ] with an additional parameter to ensure minimum energy condition.

CHAPTER-7 288
Punit H Suthar/Ph.D (Physics)/Sardar Patel University/May-2012
Hafner [7.18] derived an orthogonalized plane wave based on the first
principles pseudopotential method and applied it to investigate the random binary
alloys and ordered intermetallic compounds between alkali metals. This treatment is
the virtual cryatal approximation in which the disordered alloy is replaced by a
monoatomic periodic lattice and the alloy potential is considered as a linear
combination of the average lattice potential and the difference potential. Tanigawa
and Doyama [7.61] have used a different approach for the study of the total crystal
energy of alloys. This approach is known as the pseudo alloy atom (PAA) model in
which a hypothetical monoatomic crystal is supposed to be composed of pseudo alloy
atoms. In this model the hypothetical crystal made up of pseudo alloy atoms is
supposed to have same properties as the actual disordered alloy crystal and the
pseudopotential formalism is then applied to calculate various properties of an alloy.
To compute the total crystal energy of the alloy in the present study, we have
used the pseudo alloy atom model proposed by Tanigwana and Doyama[7.61].
In the pseudo alloy atom model the alloy can be considered as composed of a
system of N periodically arranged positive ions immersed in an electron gas. The
alloy of the type A1-xBx is made up of two components A and B in which x is the
arbitrary concentration of element B. The mean valence Z alloy for such a solid
solution can be obtained from the relation,
Zalloy = (1-x) ZA+ x ZB (7.1)
Where ZA and ZB are the valence of the two components which make up the alloy.
The total crystal energy per pseudo-atom, E(x), of the binary alloy can be obtained in
the framework of the usual second order perturbation as [7.5, 7.19-7.24]
E (x) = Ei (x) + Ees (x) + E1 (x) + E2 (x) (7.2)
In equation (7.2) , Ei is the electrostatic energy of point ions immersed in the uniform
gas of valence electrons, called the Madelung energy , which is given by

CHAPTER-7 289
Punit H Suthar/Ph.D (Physics)/Sardar Patel University/May-2012
a
alloyi R
ZxE
2
)(α
−= (7.3)
Here α is the Madelung’s constant and R a = rs Z1/3
alloy, Here rs is the radius of the
sphere containing one electron.
In Equation (7.2) ,Ees is the sum of the kinetic, exchange and correlation energies of
the valence electron and is given by
( )
+−−= s
ssalloyes r
rrZxE ln031.0115.0
916.021.2)(
2 (7.4)
E1 is the First order perturbation energy of the valence electron due to the
pseudopotential and is given by,
+
Ω=
→)(
4lim)(
20
22
01 qWZ
q
eZxE Balloy
alloy
alloy
q
π (7.5)
and
∑≠
=0
2 )()(q
qFxE (7.6)
is the band structure energy. Here F(q) is the normalized energy wave number
characteristics and is given by
[ ][ ][ ] )(1 1)(1
1)()(
16)(
22
0
qfq
qqV
qqF
effeffH
effHeff
Beff
eff −−+−
×Ω
−=ε
επ
(7.7)
The values of atomic volume and potential parameter rc for the alloy can be found
from the relation
BA xxalloy
Ω+Ω−=Ω )1(0 (7.8)

CHAPTER-7 290
Punit H Suthar/Ph.D (Physics)/Sardar Patel University/May-2012
cBcAc rrxralloy
+−= )1( (7.9)
Where AΩ and BΩ are the atomic volumes of the two pure components. rcA and rcB
are the parameters of the potential for the two components found by satisfying the
zero pressure condition.
The pressure P is obtained from the first derivative of the total crystal
energy per atom E with respect to the atomic volume 0Ω given by,
0Ω−=
d
dEP T
T (7.10)
Ω+
Ω+
Ω+
Ω−=∴
0
2
0
1
00 d
dE
d
dE
d
dE
d
dEP esi
tot (7.11)
We can write the above equation as
210 PPPPP i +++= (7.12)
By setting the derivative
00
=−=Ω
Pd
dE (7.13)
The total crystal energy at zero pressure of alkaline earth metals, transition metals and
their alloys are found using Equation (7.2) to Equation (7.6).

CHAPTER-7 291
Punit H Suthar/Ph.D (Physics)/Sardar Patel University/May-2012
7.3 Results and Discussions
Table-7.1: Input parameter and constant for the Solid solutions in present
computation
7.3.1 Total energy
The total crystal energy at zero pressure condition of some pure BCC (Ba, Cr)
and FCC (Al, Ca, Ni, Cu, Sr) and combination of their alloys in three different
compositions NiAl, Ni3Al and Al2Sr has been computed using two different model
potentials along with six different local field correction functions. The individual
terms contributing to the total crystal energy at zero pressure per atom are tabulated in
the tables from Table 7.2 to Table 7.11.
Metals Z Ω0 (a.u)3
Model rc (a.u)
H T IU F S HS
M-1 0.63030 0.59402 0.61312 0.61097 0.62588 0.61941 Al 3 111.3
M-2 0.69029 0.68983 0.67596 0.67591 0.67320 0.69055
M-1 1.04585 0.99951 0.99725 0.99086 1.02337 1.03063 Ca 2 293.492
M-2 0.97901 0.97373 0.99819 0.99817 0.99814 0.97797
M-1 0.58066 0.58093 0.57968 0.57823 0.57979 0.58527 Cr 1 81.012
M-2 0.57517 0.57708 0.57629 0.57643 0.57574 0.57580
M-1 0.55312 0.54732 0.55116 0.55258 0.55173 0.54845 Ni 1 73.793
M-2 0.54844 0.55078 0.54923 0.54931 0.54383 0.54922
M-1 0.58056 0.57464 0.57965 0.57833 0.57979 0.57947 Cu 1 79.715
M-2 0.57096 0.57312 0.57230 0.57240 0.57152 0.57169
M-1 1.17551 1.12414 1.11768 1.10981 1.15133 1.15869 Sr 2 380.442
M-2 1.12965 1.02616 1.09885 1.09879 1.10001 1.06776
M-1 1.23585 1.17661 1.13559 1.11856 1.19240 1.21751 Ba 2 428.515
M-2 1.11173 1.10309 1.12303 1.12284 1.12600 1.10938
M-1 0.58527 0.56063 0.57229 0.56956 0.58198 0.57845 NiAl 2 92.547
M-2 0.24820 0.62765 0.62230 0.62232 0.61911 0.62616
M-1 0.56551 0.54926 0.55788 0.55211 0.56281 0.56128 Ni3Al 1.5 83.17
M-2 0.58915 0.59695 0.58967 0.58731 0.58698 0.59053
M-1 0.77148 0.72482 0.74041 0.73716 0.75815 0.75576 Al 2Sr 2.8 165.13
M-2 0.80073 0.79757 0.79470 0.79472 0.79265 0.80013

CHAPTER-7 292
Punit H Suthar/Ph.D (Physics)/Sardar Patel University/May-2012
Table-7.2: Various contributions to the Total Crystal Energy (Ryd/atom) at zero
pressure for Aluminum (Al)
Variation contribution of energy (Ryd)
LFCF Model
(M) Ei E0 E1 E2 T.E.
%
error
Exp.
[7.27]
Others [7.62] [7.63], [7.64], [7.65]
M-1 -5.4040 -0.0567 0.9977 -0.2438 -4.7068 11.9 H
M-2 -5.4040 -0.0567 1.4525 -0.4370 -4.4453 6.81
M-1 -5.4040 -0.0567 0.8816 -0.3647 -4.9393 16.1 T
M-2 -5.4040 -0.0567 1.4506 -0.4606 -4.4707 7.34
M-1 -5.4040 -0.0567 0.9441 -0.2553 -4.7720 13.1 IU
M-2 -5.4040 -0.0567 1.3928 -0.0127 -4.0810 1.50
M-1 -5.4040 -0.0567 0.9374 -0.2593 -4.7826 13.3 F
M-2 -5.4040 -0.0567 1.3927 -0.0128 -4.0808 1.50
M-1 -5.4040 -0.0567 0.9837 -0.2046 -4.6816 11.5 S
M-2 -5.4040 -0.0567 1.3815 -0.0124 -4.0917 1.23
M-1 -5.4040 -0.0567 0.9636 -0.2817 -4.7789 13.3 HS
M-2 -5.4040 -0.0567 1.4537 -0.4422 -4.4493 6.89
-4.1423
-4.343,
-4.392,
-4.279,
-4.192,
-4.327
Table-7.3: Various contributions to the Total Crystal Energy (Ryd/atom) at zero
pressure for Calcium (Ca)
Variation contribution of energy (Ryd) LFCF
Model
(M) Ei E0 E1 E2
T.E. %
error Exp.
Others [7.66] [7.67]
M-1 -1.7384 -0.3035 0.4629 -0.0381 -1.6172 -- H
M-2 -1.7384 -0.3035 0.4924 -0.1352 -1.6848 --
M-1 -1.7384 -0.3035 0.4228 -0.0573 -1.6765 -- T
M-2 -1.7384 -0.3035 0.4872 -0.1426 -1.6975 --
M-1 -1.7384 -0.3035 0.4209 -0.0404 -1.6615 -- IU
M-2 -1.7384 -0.3035 0.5119 -0.0000 -1.5302 --
M-1 -1.7384 -0.3035 0.4159 -0.0426 -1.6690 -- F
M-2 -1.7384 -0.3035 0.5119 -0.0000 1.5301 --
M-1 -1.7384 -0.3035 0.4433 -0.2813 -1.6268 -- S
M-2 -1.7384 -0.3035 0.5119 -0.0000 -1.5301 --
M-1 -1.7384 -0.3035 0.4416 -0.0440 -1.6364 -- HS
M-2 -1.7384 -0.3035 0.4914 -0.9779 -1.6871 --
-- -1.3917
-1.3366

CHAPTER-7 293
Punit H Suthar/Ph.D (Physics)/Sardar Patel University/May-2012
Table-7.4: Various contributions to the Total Crystal Energy (Ryd/atom) at zero
pressure for Chromium (Cr)
Variation contribution of energy(Ryd) LFCF
Model
(M) Ei E0 E1 E2 T.E.
%
error
Exp.
[7.67]
Others [7.15] [7.68]
M-1 -0.6675 -0.1189 -0.2672 -0.0401 -1.3908 11.8 H
M-2 -0.6675 -0.1189 0.3533 -0.0475 -1.3120 6.57
M-1 -0.6675 -0.1189 0.2559 -0.0532 -1.4184 13.5 T
M-2 -0.6675 -0.1189 0.3572 -0.4980 -1.3105 8.48
M-1 -0.6675 -0.1189 0.2509 -0.0494 -1.4163 13.4 IU
M-2 -0.6675 -0.1189 0.3522 -0.0041 -1.2697 4.40
M-1 -0.6675 -0.1189 0.2478 -0.0511 -1.4213 13.7 F
M-2 -0.6675 -0.1189 0.3526 -0.0410 -1.2696 4.40
M-1 -0.6675 -0.1189 0.2549 -0.0436 -1.4065 12.8 S
M-2 -0.6675 -0.1189 0.3498 -0.0040 -1.2720 3.63
M-1 -0.6675 -0.1189 0.2633 -0.0437 -1.3983 12.3 HS
M-2 -0.6675 -0.1189 0.3547 -0.7932 -1.3111 6.51
-1.2257 -1.309,
-1.018
Table-7.5: Various contributions to the Total Crystal Energy (Ryd/atom) at zero
pressure for Nickel (Ni)
Variation contribution of energy (Ryd) LFCF
Model
(M) Ei E0 E1 E2 T.E.
%
error
Exp.
[7.67]
Others [7.15] [7.68] [7.69]
M-1 -1.5493 -0.0972 0.2621 -0.0450 -1.4295 4.77 H
M-2 -1.5493 -0.0972 0.3558 -0.0477 -1.3383 1.71
M-1 -1.5493 -0.0972 0.2472 -0.5988 -1.4592 6.71 T
M-2 -1.5493 -0.0972 0.3608 -0.5039 -1.3360 1.88
M-1 -1.5493 -0.0972 0.2562 -0.0466 -1.4368 5.26 IU
M-2 -1.5493 -0.0972 0.3557 -0.0068 -1.2976 4.90
M-1 -1.5493 -0.0972 0.2538 -0.0478 -1.4405 5.50 F
M-2 -1.5493 -0.0972 0.3558 -0.0060 -1.2976 4.90
M-1 -1.5493 -0.0972 0.2607 -0.0402 -1.4261 5.25 S
M-2 -1.5493 -0.0972 0.3521 -0.0066 -1.3010 4.62
M-1 -1.5493 -0.0972 0.2583 -0.0492 -1.4374 5.30 HS
M-2 -1.5493 -0.0972 0.3577 -0.0483 -1.3371 1.80
-1.3612
-1.373,
-1.214,
-1.074

CHAPTER-7 294
Punit H Suthar/Ph.D (Physics)/Sardar Patel University/May-2012
Table-7.6: Various contributions to the Total Crystal Energy (Ryd/atom) at zero
pressure for Copper (Cu)
Variation contribution of energy(Ryd) LFCF
Model
(M) Ei E0 E1 E2 T.E.
%
error
Exp.
[7.67]
Others [7.15] [7.68] [7.69]
M-1 -1.5099 -0.1128 0.2665 -0.0416 -1.3979 4.31 H
M-2 -1.5099 -0.1128 0.3548 -0.0508 -1.3161 1.63
M-1 -1.5099 -0.1128 0.2513 -0.0556 -1.4271 6.27 T
M-2 -1.5099 -0.1128 0.3593 -0.0508 -1.2733 5.04
M-1 -1.5099 -0.1128 0.2597 -0.0432 -1.4063 4.88 IU
M-2 -1.5099 -0.1128 0.3552 -0.0566 -1.2733 5.04
M-1 -1.5099 -0.1128 0.2573 -0.0444 -1.4063 4.88 F
M-2 -1.5099 -0.1128 0.3552 -0.0057 -1.2732 5.03
M-1 -1.5099 -0.1128 0.2644 -0.3726 -1.3956 4.15 S
M-2 -1.5099 -0.1128 0.3517 -0.0054 -1.2765 4.78
M-1 -1.5099 -0.1128 0.2657 -0.0455 -1.4058 4.85 HS
M-2 -1.5099 -0.1128 0.3565 -0.0487 -1.3150 1.70
-1.3376
-1.386,
-1.225,
-1.102
Table-7.7: Various contributions to the Total Crystal Energy (Ryd/atom) at zero
pressure for Strontium (Sr)
Variation contribution of energy(Ryd) LFCF
Model
(M) Ei E0 E1 E2
T.E.
(Ryd)
%
error Exp.
Others [7.64] [7.65]
M-1 -1.5949 -0.3174 0.4512 -0.0338 -1.4944 -- H
M-2 -1.5949 -0.3174 0.4167 -0.0883 -1.6012 --
M-1 -1.5949 -0.3174 0.4126 -0.0498 -1.5489 -- T
M-2 -1.5949 -0.3174 0.4173 -0.0678 -1.5834 --
M-1 -1.5949 -0.3174 0.4079 -0.0330 -1.5369 -- IU
M-2 -1.5949 -0.3174 0.4786 -0.0000 -1.4333 --
M-1 -1.5949 -0.3174 0.4022 -0.0352 -1.5448 -- F
M-2 -1.5949 -0.3174 0.4785 -0.0001 -1.4333 --
M-1 -1.5949 -0.3174 0.4328 -0.0214 -1.5003 -- S
M-2 -1.5949 -0.3174 0.4796 -0.0012 -1.4322 --
M-1 -1.5949 -0.3174 0.4389 -0.0385 -1.5119 -- HS
M-2 -1.5949 -0.3174 0.45190 -0.1368 -1.5967 --
-- -1.1621
-1.2770

CHAPTER-7 295
Punit H Suthar/Ph.D (Physics)/Sardar Patel University/May-2012
Table-7.8: Various contributions to the Total Crystal Energy (Ryd/atom) at zero
pressure for Barium (Ba).
Variation contribution of energy LFCF
Model
(M) Ei E0 E1 E2 T.E.
%
error Exp.
Others [7.64] [7.65]
M-1 -1.5325 -0.3214 0.4427 -0.0322 -1.4434 -- H
M-2 -1.5325 -0.3214 0.4349 -0.1342 -1.5531 --
M-1 -1.5325 -0.3214 0.4014 -0.0483 -1.5008 -- T
M-2 -1.5325 -0.3214 0.4282 -0.1413 -1.5671 --
M-1 -1.5325 -0.3214 0.3738 -0.0419 -1.5220 -- IU
M-2 -1.5325 -0.3214 0.4438 -0.0005 -1.4107 --
M-1 -1.5325 -0.3214 0.3627 -0.0476 -1.5388 -- F
M-2 -1.5325 -0.3214 0.4436 -0.0006 -1.4108 --
M-1 -1.5325 -0.3214 0.4122 -0.0244 -1.4642 -- S
M-2 -1.5325 -0.3214 0.4461 -0.0006 -1.4084 --
M-1 -1.5325 -0.3214 0.4297 -0.0365 -1.4607 -- HS
M-2 -1.5325 -0.3214 0.4331 -0.1349 -1.5558 --
-- -0.9717
-1.2181
Table-7.9: Various contributions to the Total Crystal Energy (Ryd/atom) at zero
pressure for NiAl.
Variation contribution of energy(Ryd)
LFCF Model
(M) Ei E0 E1 E2
T.E.
(Ryd)
%
error Exp. Others
M-1 -2.5541 -0.1118 0.4598 -0.0898 -2.2959 -- H
M-2 -2.5541 -0.1118 0.6361 -0.1187 -2.1485 --
M-1 -2.5541 -0.1118 0.4219 -0.1278 -2.3719 -- T
M-2 -2.5541 -0.1118 0.6419 -0.1254 -2.1495 --
M-1 -2.5541 -0.1118 0.4396 -0.0981 -2.3244 -- IU
M-2 -2.5541 -0.1118 0.6310 -0.0080 -2.0430 --
M-1 -2.5541 -0.1118 0.4355 -0.1004 -2.3309 -- F
M-2 -2.5541 -0.1118 0.6310 -0.0081 -2.0430 --
M-1 -2.5541 -0.1118 0.4546 -0.0796 -2.2909 -- S
M-2 -2.5541 -0.1118 0.6245 -0.0078 -2.0492 --
M-1 -2.5541 -0.1118 0.4491 -0.1010 -2.3178 -- HS
M-2 -2.5541 -0.1118 0.6388 -0.1202 -2.1474 --
-- --

CHAPTER-7 296
Punit H Suthar/Ph.D (Physics)/Sardar Patel University/May-2012
Table-7.10: Various contributions to the Total Crystal Energy (Ryd/atom) at zero
pressure for Ni3Al.
Variation contribution of energy(Ryd) LFCF
Model
(M) Ei E0 E1 E2
T.E.
(Ryd)
%
error Exp. Others
M-1 -1.4887 -1.2089 0.2687 -0.0398 -1.3808 -- H
M-2 -1.4887 -1.2089 0.3539 -0.0484 -1.3040 --
M-1 -1.4887 -1.2089 0.2534 -0.0420 -1.4096 -- T
M-2 -1.4887 -1.2089 0.3582 -0.0510 -1.3024 --
M-1 -1.4887 -1.2089 0.2615 -0.0415 -1.3933 -- IU
M-2 -1.4887 -1.2089 0.3546 -0.0050 -1.2602 --
M-1 -1.4887 -1.2089 0.2590 -0.0462 -1.3933 -- F
M-2 -1.4887 -1.2089 0.3546 -0.0051 -1.2689 --
M-1 -1.4887 -1.2089 0.2661 -0.0356 -1.3791 -- S
M-2 -1.4887 -1.2089 0.3514 -0.0491 -1.2631 --
M-1 -1.4887 -1.2089 0.2647 -0.0437 -1.3887 -- HS
M-2 -1.4887 -1.2089 0.3556 -0.0490 -1.3030 --
-- --
Table-7.11: Various contributions to the Total Crystal Energy (Ryd/atom) at zero
pressure for Al2Sr.
Variation contribution of energy(Ryd)
LFCF Model
(M) Ei E0 E1 E2
T.E.
(Ryd)
%
error Exp. Others
M-1 -4.1274 -0.2464 0.8776 -0.1518 -3.6479 -- H
M-2 -4.1274 -0.2464 1.1473 -0.3684 -3.5946 --
M-1 -4.1274 -0.2464 0.7746 -0.2380 -3.8371 -- T
M-2 -4.1274 -0.2464 1.1385 -0.3879 -3.6231 --
M-1 -4.1274 -0.2464 0.8083 -0.1677 -3.7331 -- IU
M-2 -4.1274 -0.2464 1.1304 -0.0033 -3.2467 --
M-1 -4.1274 -0.2464 0.8013 -0.1715 -3.7440 -- F
M-2 -4.1274 -0.2464 1.1305 -0.0033 -3.2466 --
M-1 -4.1274 -0.2464 0.8475 -0.1290 -3.6552 -- S
M-2 -4.1274 -0.2464 1.1245 -0.0032 -3.2525 --
M-1 -4.1274 -0.2464 0.8422 -0.1804 -3.7120 -- HS
M-2 -4.1274 -0.2464 1.1458 -0.3723 -3.6003 --
-- --

CHAPTER-7 297
Punit H Suthar/Ph.D (Physics)/Sardar Patel University/May-2012
Following points are inferred from the careful analysis of these results:
From Table 7.2 we can see that the total crystal energy for the pure Aluminum
matches well with the experimental values [7.62]. The total crystal energy as
calculated using Model-2 along with S function shows 1.23 % deviation from
experimental data. For both the model potentials the percentile deviation is
shown in the Table 7.2. It can be seen that the best results are obtained by
Model-2 in combination with the S local field correction functions [7.39, 7.63,
7.64].
From Table 7.4 it is observed that the total crystal energy for the Chromium
achieves a good agreement with the experimental values [7.67] and other
available results [7.15, 7.68]. In case of Model-1 along with H screening
function shows the minimum percentage deviation comes out than the other
screening functions, while for Model-2 and S functions shows 3.63 %
deviation with experimental data and matches well with the experimental
results among the other screening functions. From percentage deviations it is
found out the present results computed using the Model-1 and Model-2 along
with six different local field correction functions show the good agreement
with available experimental and other data [7.15, 7.67, 7.68].
From Table 7.5 and 7.6 we can see that the total crystal energy for the pure
Nickel and Copper matches well with the experimental values [7.67]
respectively. The total crystal energy as calculated using Model-2 along with
H function shows 1.71 % for Ni and 1.63% for Cu deviation from
experimental data and it is observed that minimum deviation than the other
screening functions. From Table 7.4 and 7.5 it observed that the present
results computed using the Model-1 and Model-2 show the better agreement
with the other available results, for both the model potentials the percentile
deviation is shown in Table 7.4 and 7.5 for Ni and Cu metal respectively. It
can be seen that the best results are obtained by Model-2 along with H local
field correction function.
Total crystal energy for Ca, Sr and Ba are shown in Table 7.3, 7.7 and 7.8
respectively. From table 7.3, 7.7 and 7.8 it is observed that the maximum total
crystal energy is obtained due to Model-1 potential along with the H screening
functions. In case of Model-2 we can see that the computed values of total

CHAPTER-7 298
Punit H Suthar/Ph.D (Physics)/Sardar Patel University/May-2012
crystal energy due to IU, F and S screening functions and due to H & HS are
nearly same. It is also observed that the present values are in good agreement
with other values [7.65, 7.66]. Due to lack of other information we do not put
any concert remark for the total energy of Ca, Sr and Ba, but in the absence of
other data these results will provide a good set of data for future comparison.
For the binary alloys NiAl [7.47], Ni3Al [7.47] and Al2Sr [7.48] show the FCC
phase. Here we have first time reported the total crystal energy for the three
different binary alloys. Table 7.9, 7.10 and 7.11 show the various contribution
of total crystal energy at zero pressure for NiAl, Ni3Al and Al2Sr respectively.
From Table 7.8, 7.9 and 7.10 it is observed that the maximum total crystal
energy obtained due to T functions for Model-1 and Model-2 potential
respectively while minimum total crystal energy obtained due to S and IU for
Model-1 and Model-2 potential respectively.
Out comes of the present results obtained due to Model-2 with IU, F and S
screening functions almost same values for all three binary alloys.
Over all it is observed that the total crystal energy computed using the Model-
2 potential is achieves good agreement with experimental and other results.
7.3.2 Pressure and Volume relation
The behavior of various materials under compression finds application in the
field of materials science and engineering technology. Hence the study of the
Pressure-Volume relations is important in condensed matter physics. The equation of
state for many crystals under pressure has been measured using various experimental
techniques. The data found by Bridgman (1948) [7.27] using the piston- cylinder
method were the first to be reported. However, the pressure scale at that time was
invariably old-fashioned so a correction for Bridgman’s compression data was
estimated. Up to the present time, data on the pressure-volume relations with other
experimental techniques such as shockwave and ultrasonic measurements have been
reported. A remarkably precise measurement of lattice compression using a high
pressure x-ray diffraction method has also been made by Senoo et al.[7.70] and
Grover et al.[7.63].

CHAPTER-7 299
Punit H Suthar/Ph.D (Physics)/Sardar Patel University/May-2012
Some theoretical calculations of the equations of state under pressure have
been reported for alkali metals using the pseudopotential formalism and the
perturbational theory. Also the pseudopotential formalism is applied to the
anharmonicity of lattice dynamics, the alloy system and the problem of complicated
lattice defects [7.39]. Sarkar and Sen [7.70] studied the equation of state using the
pseudopotential theory for Al. The equation of state for Al was calculated by Friedli
and Ashcroft [7.71] using the second order theory for the effective electron-ion
interaction.
In the present study we have calculated the pressure-volume relations for the
some alkaline earth metals (Al, Ca, Sr, and Ba) and some transition metals (Cr, Ni,
Cu) and solid solutions NiAl, Ni3Al [7.47], Al2Sr [7.48]. These solid binary alloys
have contain properties like light weight, high strength and hardness, low mass etc
and these alloys are particularly attractive for transport application such as
automobiles and weight reduction for industrial application. Al and Sr have been
found to be the two alkaline earth elements which affect high temperature
performance positively. Parallel to the experimental investigations, there is a great
need for an efficient route of alloy development with reduced cost and time. The
emerging concept of system materials design provides such opportunities.
Figure 7.1: P-V relation for Al using Model-1 & Model-2 potential along with Exp.
data[7.14] and Hugoniot data[7.13]

CHAPTER-7 300
Punit H Suthar/Ph.D (Physics)/Sardar Patel University/May-2012
Figure 7.2: P-V relation for Ca using Model-1 & Model-2 potential along with
Exp.[7.72]
Figure 7.3: P-V relation for Cr using Model-1 & Model-2 potential
Figure 7.4: P-V relation for Ni using Model-1 & Model-2 potential along with
other[7.15] and available Exp. data[7.44]

CHAPTER-7 301
Punit H Suthar/Ph.D (Physics)/Sardar Patel University/May-2012
Figure 7.5: P-V for Cu using Model-1 & Model-2 potential along with available other
data[7.15], Exp.data [7.44] and A. D. Chijioke et al. [7.13]
Figure 7.6: P-V relation for Sr using Model-1 & Model-2 potential along with
Exp.[7.72, 7.73], available other [7.74]and Vyas et al. data[7.75]
Figure 7.7: P-V relation for Ba using Model-1 & Model-2 potential along with
Exp. data [7.72]

CHAPTER-7 302
Punit H Suthar/Ph.D (Physics)/Sardar Patel University/May-2012
Figure 7.8: P-V relation for NiAl using Model-1 & Model-2 potential
Figure 7.9: P-V relation for Ni3Al using Model-1 & Model-2 potential
Figure 7.10: P-V relation for Al2Sr using Model-1 & Model-2 potential

CHAPTER-7 303
Punit H Suthar/Ph.D (Physics)/Sardar Patel University/May-2012
Figure 7.11: P-V relation for Al-Ni using Model-1 & Model-2 potential along with S
functions.
Figure 7.12: P-V relation for Al-Sr using Model-1 & Model-2 potential along with S
functions.
The pressure-volume (p-v) relation for pure Al has been shown in Figure 7.1.
It has been observed that the P-V relation calculated with T function shows
minimum deviation compared to other six local field correction functions for
Model-1 and it is observed that good agreement with the experimental results
[7.14] and Hungoniot data [7.13]. P-V relation computed using Model-2
potential gives the higher values than the experimental results [7.14] and IU
and F functions shows the maximum deviation compared to the other four
local field correction. Thus, Model-1 along with six local field correction
functions, the T function gives better results for P-V relation for pure Al.

CHAPTER-7 304
Punit H Suthar/Ph.D (Physics)/Sardar Patel University/May-2012
Figure 7.3 shows the P-V relation for Cr. Out comes of the present results of
Model-2 show higher numerical values compared to those computed due to
Model-1 along with all the six screening functions. P-V relation computed
using IU and F screening functions overlapping each other in both the model
potential.
From Figure 7.4 and 7.5 it is apparent that the P-V relation for Ni and Cu
along with the available experimental and other data [7.15, 7.44]. Out comes
of the present results for EOS are not found in good agreement with the
experimental and other data [7.15] because they might have taken the valency
higher than that employed in the present approach. It is observed in the region
(0.85 to 1.0) present results computed using Model-2 are found good
agreement with the other and experimental results [7.15, 7.44].
The computed P-V relation for Ca along H and S screening functions lye
along with experimental data [7.70] and hence this screening functions show
good agreement with experimental data than the other screening function
computed due to Model-1 potential. It is also observed that the present results
computed using Model-2 along with different screening functions is higher
than the available experimental data.
Figure 7.6, Shows the P-V relation for Sr compared along with experimental
data due to Budy and Strong [7.72, 7.73], other data reported by Vyas et
al.[7.74, 7.75]. It is observed that present results computed using the Model-1
and Model-2 along with Hartree (H) screening functions shows the better
agreement with the available of experimental data and obtained due to Vyas et
al.[7.75] results. To include the effect of temperature, Vyas et al. [7.75] have
reported on empirical EOS with the adjustable parameter and deduce EOS at
room temperature. Inflections in their EOS at pressures 24 and 63.5 Kbar
indicating structural phase transition cannot be reproduce by the present
scheme. On other hand, results on high-pressure [7.75] EOS predict SPT at
about 35Kbar a first-order transition from one crystal structure (fcc-cF4) into
another (bcc-cI2) [7.75] is observed.
Figure 7.7 shows the p-v relation for the Ba metal compared with available
experimental data [7.72]. At a first sight it is observed that the present results
computed using Model-1 potential are in excellent agreement with the
experimental results than the calculated using Model-2 potential. It is also

CHAPTER-7 305
Punit H Suthar/Ph.D (Physics)/Sardar Patel University/May-2012
observed that the outcome of present results calculated using Model-1 using
with T- function shows good agreement with experimental data computed
other screening functions. It is also observed that to IU and F screening
functions show that maximum deviation and H screening function shows that
minimum deviation with respect to the experimental results calculated as by
Model-2 potential.
Our present approach for some alkaline earth metals and some transitions
metals are found to be good agreement with available experimental and other
results. From this motivation we have extended our calculation part for the
binary system. As a case study for the first time we have calculated P-V
relation for NiAl, Ni3Al and Al2Sr binary system as shown in Figure 7.8, 7.9
and 7.10 respectively. In all the three binary systems, it has been observed that
the S function and IU as well as F functions show the maximum influence
with respect to H screening function for Model-1 and Model-2 respectively. P-
V relation computed using Model-2 potential is on the higher side than the
Model-1 in general.
From the Figure 7.11 and 7.12 it is seen that the equation of state for Al-Ni
and Al-Sr alloys lies in between the pure components.
7.3.3 Energy-volume relations
Energy-Volume Relations always serve as a database in the construction of
empherical schemes. Both self consistent and non-self consistent Harris Foulkes
calculation can be done and connection are made between them and simpler tight
binding and classical model of interatomic forces. Energy –Volume Relations help us
to find equilibrium lattice parameter and also to calculate elastic properties like bulk
modulus etc.
In the present study we have calculated the energy -volume relations for the
solid binary NiAl, Ni3Al and Al2Sr system with different concentrations of the
individual components.

CHAPTER-7 306
Punit H Suthar/Ph.D (Physics)/Sardar Patel University/May-2012
Figure 7.13: Energy and Volume relation for Al using Model-1 & Model-2 potential
Figure 7.14: Energy and Volume relation for Ca using Model-1 & Model-2 potential
Figure 7.15: Energy and Volume relation for Cr using Model-1 & Model-2 potential
CHAPTER-7 307
Punit H Suthar/Ph.D (Physics)/Sardar Patel University/May-2012
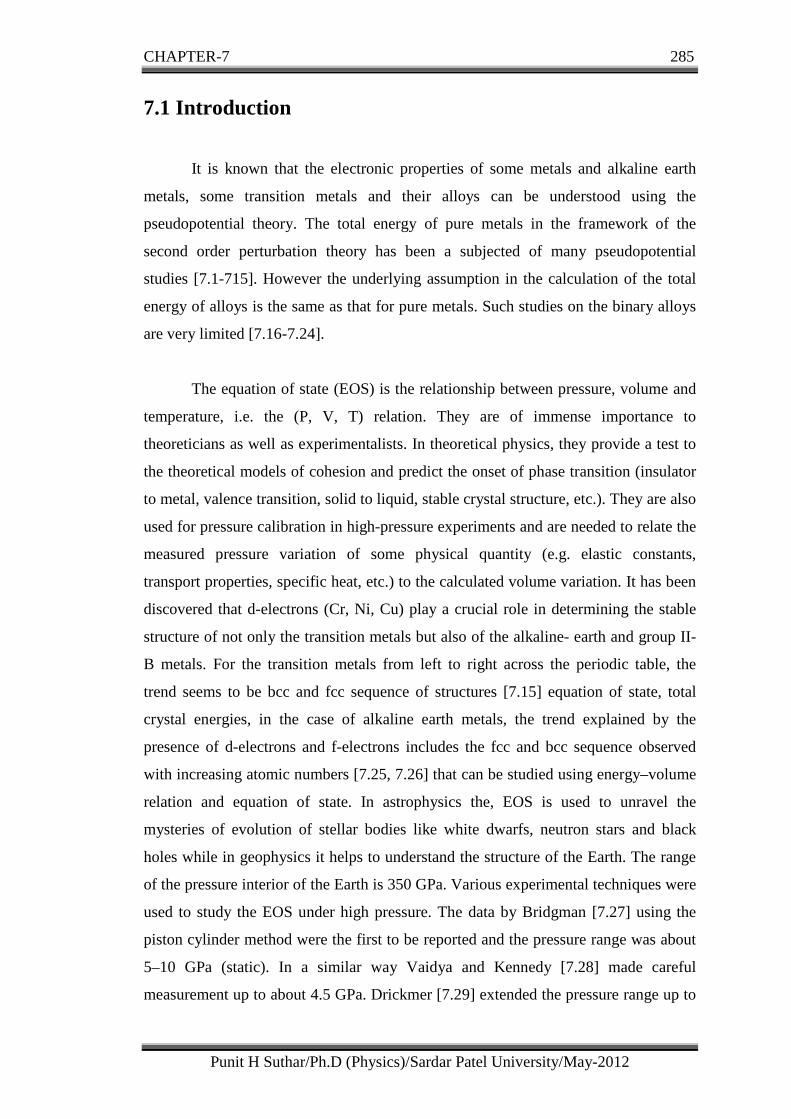
Figure 7.16: Energy and Volume relation for Ni using Model-1 & Model-2 potential
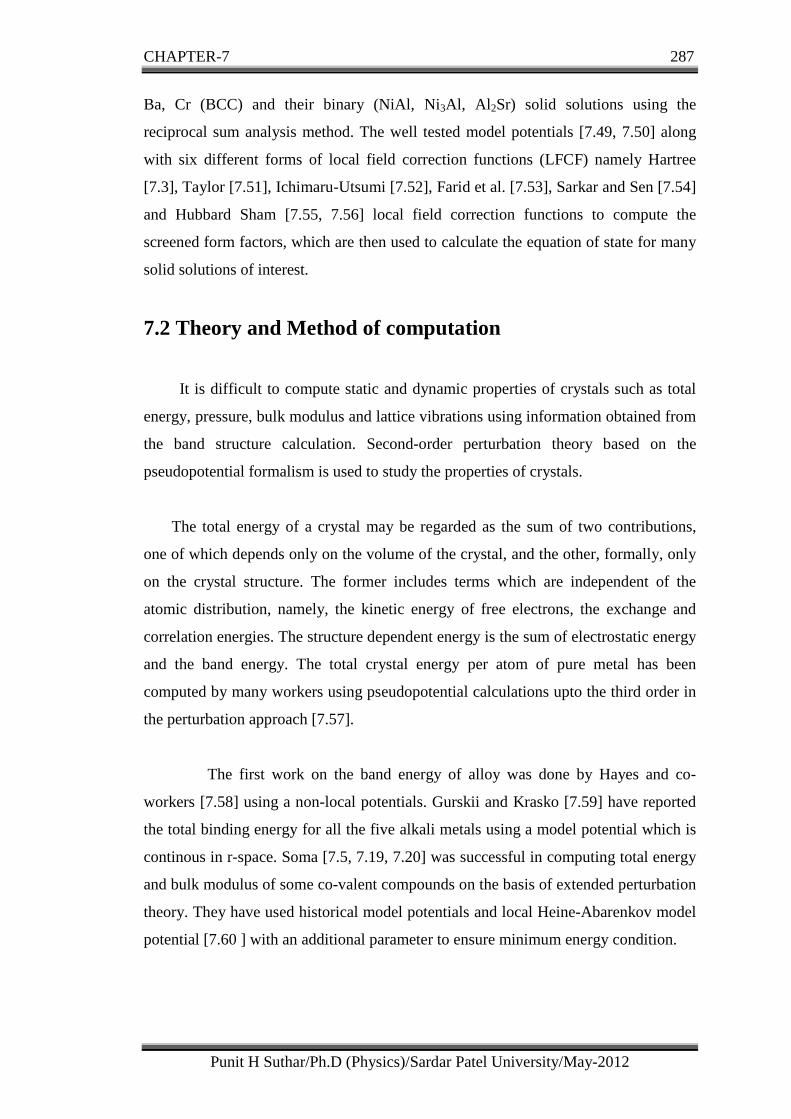
Figure 7.17: Energy and Volume relation for Cu using Model-1 & Model-2 potential
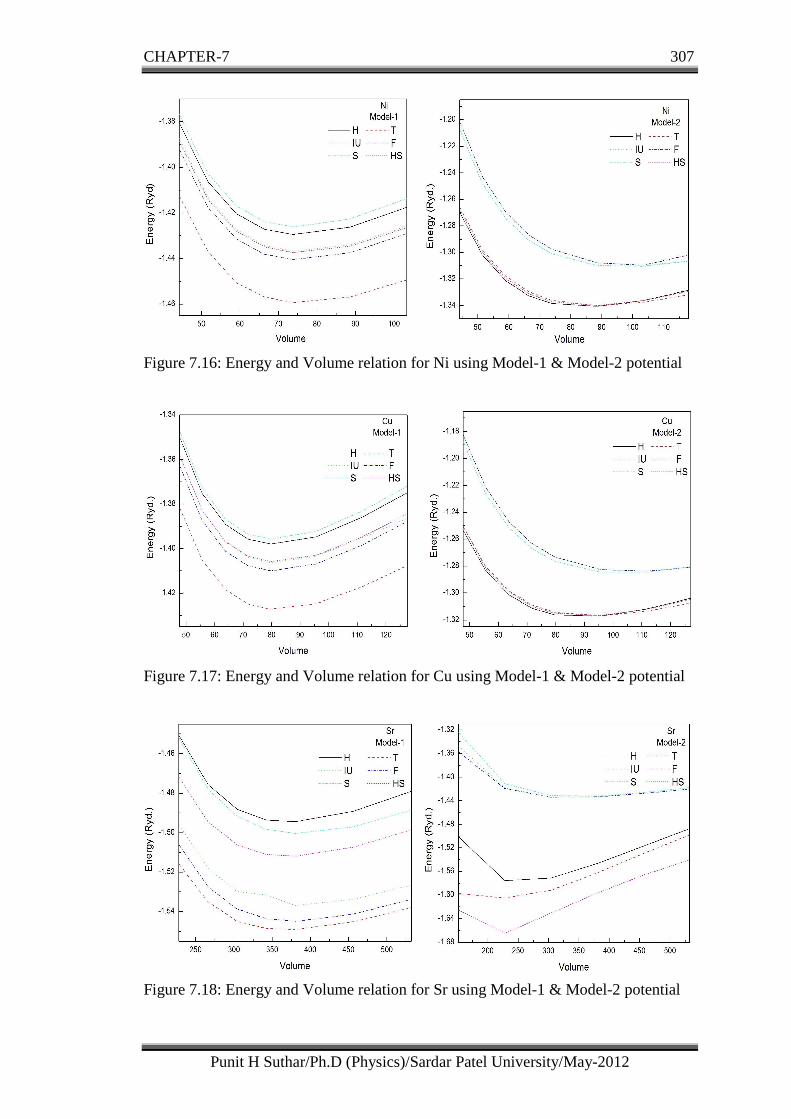
Figure 7.18: Energy and Volume relation for Sr using Model-1 & Model-2 potential

CHAPTER-7 308
Punit H Suthar/Ph.D (Physics)/Sardar Patel University/May-2012
Figure 7.19: Energy and Volume relation for Ba using Model-1 & Model-2 potential
Figure 7.20: Energy and Volume relation for NiAl using Model-1 & Model-2
potential
Figure 7.21: Energy and Volume relation for Ni3Al using Model-1 & Model-2
potential

CHAPTER-7 309
Punit H Suthar/Ph.D (Physics)/Sardar Patel University/May-2012
Figure 7.22: Energy and Volume relation for Al2Sr using Model-1 & Model-2
potential
For the Energy-Volume relation the following point is inferred form the above
figures:
Here we have compared the energy-volume relations of each metals and alloys
with six local field correction functions (LFCF).
From the figures 7.13 to 7.22 for Model-1 potential we can infer that all the
local field correction functions show the similar trend with Farid et al. and
Ichimaru et al. functions show the very much similar result than the other
functions.
In all pure FCC metals (Al, Ca, Ni, Cu and Sr) computed using Model-1, T
screening function shows the maximum and S screening function shows the
minimum influence with respect to H function than the other five local field
correction functions. F screening function shows the maximum influence with
respect to the H functions than the other five screening functions for BCC (Cr,
Ba) metals.
Model-1 and Model-2 both give the same trend in energy with change in
volume, but in general the numerical values of energy for a partial on value of
volume using Model-1 are on the higher side.
Figure 7.20 shows the energy-volume relation for the NiAl binary system. For
the energy-volume relation the computed percentile influence with respect to
H function are 3.66%-3.31%, 1.04%-1.28%, 1.64%-1.56%,0.28%-0.18% and

CHAPTER-7 310
Punit H Suthar/Ph.D (Physics)/Sardar Patel University/May-2012
1.02-.95% for T, IU, F, S and HS screening functions respectively using
Model-1 and for Model-2 the percentile influence with respect to H function
are 0.23%-0.04%, 8.43%-4.91%, 8.44%-4.91%, 8.07%-4.63% and 0.034%-
0.05% for T, IU, F, S and HS screening functions respectively.
Figure 7.21 shows the energy –volume relation for Ni3Al binary system. For
the energy-volume relation the computed maximum and minimum percentile
change with respect to H function are found to be 2.12%-2.15%, and 0.15%-
0.72% for T, and S screening functions respectively using Model-1 and for
Model-2 potential the computed maximum and minimum percentile influence
with respect to H function are found to be 5.81%-3.37% and 0.15%-0.077%
for F and HS screening functions respectively.
Figure 7.22 shows the energy-volume relation for Al2Sr binary system. For the
energy-volume relation the maximum and minimum percentile change with
respect to H function is found to be 3.47%-5.18% for T and 1.90%-1.88% for
HS screening functions using Model-1 potential. For Model-2 potential
maximum and minimum percentile change with respect to H screening
function is found to be 21.48%-9.69% for F and 1.01%-0.58% for HS
screening function respectively.
Following points are inferred from the careful conclusions of these results for total
energy, p-v relation and E-V relations:
Lastly we conclude that the total energy computed using Model-2 potential
along with Sarkar et al. screening function is found to be a better agreement
with experimental data and other available theoretical data.
Total energy for the transition metals (Cr, Ni and Cu) computed using the
Model-2 along with H and HS screening functions are found to agree well
with the experimental data and other available results.
Model-1 potential along with the T function is found to generate overall higher
total energy than other screening functions.
Pressure –volume relation found for the alkaline earth metal using Model-1
potential show good agreement with experimental data and other available
data.

CHAPTER-7 311
Punit H Suthar/Ph.D (Physics)/Sardar Patel University/May-2012
Pure FCC metals (Al, Ca, Ni, Cu and Sr) using Model-1 potential the T
screening function shows the maximum influence with respect to H function
than the other five local field correction functions. For BCC (Cr, Ba) metals
using Model-1 potential the F function shows the maximum influence with
respect to the H functions than the other five screening functions.
Overall equation of state (EOS) for all alkaline earth metals we achieve the
good agreement with respect to the experimental data and other data.

CHAPTER-7 312
Punit H Suthar/Ph.D (Physics)/Sardar Patel University/May-2012
References:
7.1 J.H. Westbrook and R.L. Fleischer, Intermetallic Compounds: Structural Applications,
Wiley, New York, 4 ( 2000).
7.2 D. C. Wallace, Thermodynamics of crystals,
Jhon Wiely and sons Inc., NewYork (1972).
7.3 W.A. Harrison, Elementary Electronic Structure, World Scientific, Singapore (1998). 7.4 J. Hafner, J. Phys. B 24, 41 (1976). 7.5 T. Soma, Physica B 97, 76, (1971). 7.6 K. N. Khanna and S. K. Sharma, Phys. Stat. Sol. (b) 58, 809 (1978). 7.7 K. S. Sharma and C. M. Kachhava,
Solid. Stat. Commun. 30, 749 (1979). 7.8 F. Jonu and P. M. Marcus,
J. Phys. Cond. Matter. 18, 4623 (2006). 7.9 M. J. Mehl and D. A. Papacontantopoulos,
Phys. Rev. B. 54, 4519 (1996). 7.10 Y. Chen, K. M. Ho, and B. N. Harmon,
Phys. Rev. B 37, 283 (1988). 7.11 Yasemin OZTEKOIN CIFTCI, Kemal COLAKOGLU
Turk. J. Phys. 25 , 363 (2001). 7.12 R.A. Deegan,
Phys. Rev. 186, 15 (1969). 7.13 Akobuije D. Chijioke, W. J. Nellis, and Isaac F. Silvera,
J. Appl. Phys. 98, 073526 (2005). 7.14 X D Dai,Y Kong, J H Li and B X Liu,
J. Phys. Condens. Matter 18, 4527 (2006) 7.15 J. K. Bariya, P. N. Gajjar, and A. R. Jani,
FIZIKA B 12, 23 (2003).

CHAPTER-7 313
Punit H Suthar/Ph.D (Physics)/Sardar Patel University/May-2012
7.16 B. M. Tewari and K. N. Khanna, Physica B 123, 201 (1984).
7.17 H. Khan and K. S. Sharma,
Ind. J. Pure & App. Phys 31, 13 (1991). 7.18 J. Hafner, Phys. Rev. B 15, 617 (1971). 7.19 T. Soma, H. Matasuto and Y. Kohbu, Phys. Stat. Sol. (b) 107, 761 (1981). 7.20 T. Soma, H. Matasuto andM. Funaki, Phys. Stat. Sol. (b) 108, 221 (1981). 7.21 P. N. Gajjar, B. Y. Thakore and A. R. Jani,
The Physics of disordered Material, NISCOM New Delhi India, 135 (1997).
7.22 P. N. Gajjar, B. Y. Thakore and A. R. Jani,
Acta. Phys. Polo. A 99, 565 (2001). 7.23 P. N. Gajjar, B. Y. Thakore and A. R. Jani,
Rom. J. Phys. 45, 715 (2000). 7.24 A. R. Jivani, P. N. Gajjar and A. R. Jani,
Semi. Phys. Quantum Electronics and Optoelectronics 5, 243 (2002). 7.25 J. A. Moriarty,
Phys. Rev. B 8, 1338 (1973). 7.26 H. L. Skriver,
Phys. Rev. Lett. 49, 1768 (1982). 7.27 P. W. Bridgman,
Proc. Am. Acad. Arts. Sci. 77,189 (1949). 7.28 S. N. Vaidya and G. C. Kennedy,
J. Phys. Chem. Solids 31, 2329 (1970). 7.29 H. G. Drickmer,
Rev. Sci. Instr. 42, 1667 (1971). 7.30 B. K. Godwal, S. K. Sikka and R. Chindambaram,
Phys. Rev. Lett 47, 1144 (1981), Phys. Reports, 102, 1377 (1983).
7.31 S. K. Sikka,
Phys. Lett. A 135 , 129 (1989).

CHAPTER-7 314
Punit H Suthar/Ph.D (Physics)/Sardar Patel University/May-2012
7.32 M. H. Rice, R. G. McQueen and J. H Walsh, Solid State Physics 6, 1 (1958).
7.33 I. V. Al’tshuler, Sov. Phys. Uspekhi 8, 8 (1989).
7.34 R. J. Trainor, J. W. Shaner, J. M. Auerbach and N. C. Holmes,
Phys. Rev. Lett. 42, 1154 (1979). 7.35 R. C. Weingart,
Lawrence, Livermore Laboratory Report UCRL- 52752 (1979). 7.36 C. E. Ragan, M. G. Silbert and B. C. Dive,
J. Appl. Phys 48, 2860 (1977). 7.37 D. A. Young and M. Ross,
Phys. Rev. B 29, 628 (1984). 7.38 T. Soma,
J. Phys. F. Metal Phys. 10, 1401 (1980). 7.39 T. Soma, H. Satoh and H. Matsuo,
Solid State Commun. 40, 933 (1982). 7.40 V. N. Antonov, V. Yu. Molman, V. V. Nemoshkalenko and A. V. Zhalko-
Titarenko, Phys. B. 79, 233 (1990).
7.41 Wasserman, L. Stixrude and R. E. Cohen,
Phys. Rev. B 53, 8296 (1996). 7.42 J. A. Moriarty,
Phys. Rev. B 49, 12431 (1994). 7.43 V. L. Moruzzi, J. F. Janak and K. Schwarz,
Phys. Rev. B 37, 790 (1988). 7.44 Yi, Wang, D. Chen and Xi. Zang,
Phys. Rev. Lett. 84, 3220 (2000). 7.45 G. Steinle-Neumann, L. Stixurde and R. E. Conhen,
Phys. Rev. B 60, 791 (1999). 7.46 H. Y. Geng, M. H. F. Sluiter and N. X. Chen,
Phys. Rev. B 72, 014204 (2005). 7.47 Y. Wang, Z. K. Liu, L. Q. Chen, Acta, Material, 52, 2665 (2004).

CHAPTER-7 315
Punit H Suthar/Ph.D (Physics)/Sardar Patel University/May-2012
7.48 C. B. Alcock and V. P. IItkin, Bulletin of alloys phase diagram, 10, (1989).
7.49 B.Y.Thakore, P.H.Suthar, S.G.Khambolja, P.N.Gajjar and A.R.Jani,
AIP Conf. Proc. 1313, 106 (2010). 7.50 B. Y. Thakore, P. H. Suthar, S. G. Khambholja and A. R. Jani, AIP, Conf. Proc. 1249, 170 (2010). 7.51 R. Taylor,
J. Phys .F 8, 1699 (1981). 7.52 S. Ichimaru and K. Utsumi ,
Phys. Rev. B 24, 3220 (1981).
7.53 B. Farid, V. Heine, G E Engel and I J Robertson, Phys. Rev. B 48, 11602 (1993).
7.54 A Sarkar, D S Sen and H D Roy,
Mod. Phys. lett.12, 639 (1998). 7.55 J. Hubbard, Proc. Roy. Soc. London A 243, 336 (1957). 7.56 L. J. Sham, Proc. Roy. Soc. London A 283, 33 (1965).
7.57 P. N. Gajjar, B. Y. Thakore and A. R. Jani, Total Crystal Energy of some Simple Metals (1997). 7.58 T. M. Hayes, H. Brookes and A. Stock, Phys. Rev. 175, 699 (1968). 7.59 G. L. Krasko and Z. A. Gurskii, Sov. Phys. Solid State 13, 2062 (1972). 7.60 V. Heine and I. Abarankov, Phil. Mag. 9, 451 (1964). 7.61 S. Tanigawa and M. Doyama,
Solid State Commun. 11, 787 (1972), J. Phys. L 95, (1972), J. F 3, 977 (1973), Phys. Status Solidi B 56, 665 (1973) .
7.62 R. Grover, R. N. Keder, F. J. Rogers and G. C. Kennedy, J. Phys. Chem. Solids 30, 2091 (1969). 7.63 G. S. Sohoni and D. G. Kanhere
Phys. Rev. B. 28, 3582 (1983).

CHAPTER-7 316
Punit H Suthar/Ph.D (Physics)/Sardar Patel University/May-2012
7.64 E. Wimmer, J. Phys. F: Met. Phys. 14, 681 (1984).
7.65 H.-J. Tao and W.-M. Chen, J. of Phase Equilibria and Diffusion, 32, No. 5 (2011). 7.66 C. Kittel, Introduction to Solid State Physics, John Wiley and Son, New York (1971). 7.67 U. Walzer,
Phys. Stat. Soli. (b) 125, 55 (1984). 7.68 N. Sing and B. S. Yadav,
PRAMANA, 42, 387 (1994). 7.69 M. Senoo, H. Mii, I. Fujishiro and T. Fujikawa, Proc. 4th Inter. Conf. on High Pressure, Kyotob (1974), Rev. Phys. Chem. Japan, Special issue, 240 (1975), Japan. J. Appl. Phys. 15, 871 (1976). 7.70 S. K. Sarkar and D. Sen, J. Phys. Stat. F 11, 377 (1981). 7.71 C. Friedli and N. W. Aschorft, Phys. Rev. B 12, 5552 (1975). 7.72 M. Winzenick and W. B. Holzapfel,
Phys. Rev. B 53, 2151 (1996). 7.73 F. P. Budy and H. M. Strong,
Solid State Physics (Eds. Seitz F and Turnbull D, Academic press, New York) 13, 81 (1962).
7.74 M S Anderson, C A Swenson and D T Peterson,
Phys. Rev. B 41, 3329 (1990). 7.75 P. R. Vyas, V. B. Gohel, N. K. Bhatt and A. R. Jani
Ind. J. Pure & Appl. Phys 45, 93 (2007).