chapter 7. monitoring of the effects of the thorntonbank
TRANSCRIPT

Chapter 7. Monitoring of the effects of the Thorntonbank and Bligh Bank windmill parks on the epifauna and demersal fish fauna of soft-bottom sediments:
Thorntonbank: status during construction (T1) Bligh Bank: reference condition (T0)
Sofie Vandendriessche, Kris Hostens & Jan Wittoeck
Institute for Agricultural and Fisheries Research (ILVO-Fisheries), Bio-Environmental Research Group
Photo ILVO

S. Vandendriessche, K. Hostens & J. Wittoeck 94
Table of contents
7.1. Introduction................................................................................................................................... 97 7.2. Aims.............................................................................................................................................. 97 7.3. Sampling strategy and methods .................................................................................................... 98
7.3.1. T1 - Thorntonbank/Goote Bank area ................................................................................. 98 7.3.2. T0 - Bligh Bank/Hinderbanken area.................................................................................. 99
7.4. Results......................................................................................................................................... 101 7.4.1. Demersal fish: density..................................................................................................... 101 7.4.2. Bligh Bank (Belwind concession): condition in 2008 .................................................... 104 7.4.3. Demersal fish: diversity .................................................................................................. 106 7.4.4. Demersal fish: community analysis ................................................................................ 111 7.4.5. Demersal fish: length-frequency..................................................................................... 114 7.4.6. Epibenthos: density ......................................................................................................... 126 7.4.7. Epibenthos: biomass ....................................................................................................... 129 7.4.8. Epibenthos: diversity....................................................................................................... 133 7.4.9. Epibenthos: community analysis .................................................................................... 137 7.4.10. Epibenthos: length-frecuency ......................................................................................... 140 7.4.11. The state of the demersal fish fauna: a summary ............................................................ 144 7.4.12. The state of the epibenthos fauna: a summary ................................................................ 145
7.5. Discussion ................................................................................................................................... 146 7.5.1. Representativity of the reference zones .......................................................................... 146 7.5.2. Impact of the construction of six turbines on the Thorntonbank .................................... 146 7.5.3. Suggestions concerning sampling strategy ..................................................................... 147 7.5.4. Suggestions for future monitoring and analyses ............................................................. 148
7.6. Conclusion .................................................................................................................................. 149 7.7. References................................................................................................................................... 149
Abstract
The consortia C-Power NV and Belwind NV obtained an environmental permit to build and exploit a wind farm in the Belgian part of the North Sea. The wind turbines for C-Power will be/are placed on the Thorntonbank (60 wind turbines, 300 MW). The ones for Belwind will be placed on the Bligh Bank (110 wind turbines, 330 MW). A research design has been drafted to monitor the environmental effects of the construction and exploitation of these wind farms in time. Stations on the Goote Bank, Bligh Bank, Hinderbanken and Thorntonbank were selected as reference sites (no impact site). To scientifically evaluate the ecological effects of a human disturbance on the environment, a BACI (Before After Control Impact) strategy is used, based on repeated samplings (spring and autumn, before and after impact) in impact areas (concession zones) and reference areas. The baseline study (Year-0) of the Thorntonbank has been completed in 2005 (De Maersschalck et al., 2006). In 2008, six wind turbines have been placed on the Thorntonbank. This monitoring project aims at evaluating the Year-0 situation of the Bligh Bank and the Year-1 situation of the Thorntonbank concerning the benthic invertebrates and demersal fish during the construction phase of the wind farms. For both the Thorntonbank and the Bligh Bank monitoring areas, variations in biotic characteristics (density, diversity, biomass, length-frequency) concerning demersal fish were linked to seasonal, interannual and spatial variation (sandbank tops versus gullies). Densities were higher (>200%) in autumn than in spring and overall densities were substantially lower in 2008 compared to 2005 (reduction of 65%). In the Thorntonbank monitoring area, differences between tops and gullies were most outspoken in spring, with higher densities (on average 22%) in the gullies. Perciforms and flatfish were important species groups throughout the years, supplemented by locally and seasonally high densities of clupeids (spring 2005) and gadoids (autumn 2008). In the Bligh Bank monitoring area, differences between tops and gullies were equally important, with higher densities on the tops in autumn (due to high abundance of lesser weever) and comparable densities in spring. The species composition was again mainly determined by perciforms and flatfish, with locally high densities of

Chapter 7. Soft substrate epifauna and demersal fish fauna 95
gadoids. The species number was higher on the Bligh Bank than on the Hinderbanken. For epibenthos, all analyses concerning community composition, density, biomass, diversity and length showed a difference between sandbank top samples and gully samples, with generally higher (up to six times) values in the gullies. This indicated that gullies are more diverse and richer than the sandbanks themselves. Gully samples, however, displayed more variation in their species compositions than sandbank tops. Nevertheless, seasonal, interannual and spatial variations were mainly due to changing in densities of a few common species such as brown shrimp, two species of brittle stars, hermit crab, flying crab, lesser bobtail and squid. For both ecosystem components, no changes were detected in the patterns in and around the concession zones, and, as such, they remain largely comparable with the reference areas. The selected reference areas (Thorntonbank, Goote Bank, Bligh Bank and Hinderbanken) are considered to be suitable; only limited differences were found concerning biotic variables between the concession zones and their respective reference zones. For future monitoring, adaptations to the sampling design will be implemented, since cables and other structures on the seafloor prevent the completion of the beam trawl tracks in the vicinity of the turbines. These adaptations will include a shortening of the tracks and an increase in track numbers in the vicinity of the turbines.
Samenvatting De consortia n.v. C-Power en n.v. Belwind verkregen een milieuvergunning voor de bouw en
exploitatie van een windmolenpark op het Belgisch deel van de Noordzee. De windturbines voor C-Power worden geplaatst op de Thorntonbank (60 molens, vermogen van 300 MW). De turbines voor Belwind zullen geplaatst worden op de Bligh Bank (110 molen, vermogen van 330 MW). Een monitoringsplan werd uitgetekend om de impact van de bouw en exploitatie van deze windmolens op het milieu na te gaan in de tijd. Er werden referentiegebieden aangeduid op de Goote Bank, Bligh Bank, Hinderbanken en Thorntonbank. Om op wetenschappelijke basis de ecologische gevolgen van een menselijke verstoring op het habitat na te gaan werd een BACI (Before After Control Impact) strategie gekozen. Deze is gebaseerd op herhaalde staalnames (lente en herfst, voor en na impact) in impactgebieden (concessiezones) en referentiegebieden. De baseline studie van de Thorntonbank werd uitgevoerd in 2005 (De Maersschalck et al. 2006); in 2008 werden de eerste 6 windmolens geïnstalleerd. Dit monitoringsproject werd uitgeschreven ter uitvoering van de baseline studie (jaar-0) van de Bligh Bank en de jaar-1 studie van de Thorntonbank om de situatie te evalueren tijdens de constructie- en exploitatiefase van de windmolenparken voor de epifauna en demersale vissen. Voor zowel de Thorntonbank als de Bligh Bank monitoringsgebieden waren de variaties in biotische variabelen (densititeit, diversiteit, biomassa, lengte frequentie) betreffende demersale vissen vooral toe te schrijven aan seizoenale, interannuele en ruimtelijke (geulen versus banken) verschillen. Visdensiteiten waren algemeen hoger (>200%) in de herfst dan in de lente, en waren substantieel lager in 2008 dan in 2005 (65% reductie). In het Thorntonbank monitoringsgebied waren de verschillen tussen geulen en banken het meest uitgesproken in de lente, waarbij hogere (gemiddeld 22%) densiteiten werden waargenomen in de geulen. De groepen van de baarsachtigen en de platvissen waren het jaar rond abundant aanwezig. Daarnaast werden lokaal hoge densiteiten waargenomen van haringachtigen (lente 2005) en kabeljauwachtigen (herfst 2008). In het Bligh Bank monitoringsgebied waren de verschillen tussen geulen en banken van even groot belang, en werden hogere densiteiten aangetroffen op de banken in de herfst (vooral door abundantie van kleine pieterman) en vergelijkbare densiteiten tussen geulen en banken in de lente. De soortensamenstelling werd opnieuw grotendeels bepaald door baarsachtigen en platvissen, aangevuld met lokaal hoge densiteiten van kabeljauwachtigen. Het aantal soorten was hoger op de Bligh Bank en aanpalende geulen dan op de top en in de geulen van de Oosthinder. Alle analyses betreffende de soortensamenstelling, densiteit, biomassa, diversiteit en lengte frequentie van het epibenthos toonden een duidelijk verschil aan tussen de zandbankstations en de geulstations, waarbij hogere (tot zes keer hoger) densiteiten werden genoteerd in de geulen. Dit toont aan dat aanpalende geulen diverser en rijker zijn de zandbanken zelf. Stalen uit geulen vertoonden echter wel een grotere onderlinge variatie dan zandbankstalen. De aangetoonde seizoenale, interannuele en ruimtelijke variatie was vooral het gevolg van wisselende proporties van een aantal algemene epibenthische soorten zoals de grijze

S. Vandendriessche, K. Hostens & J. Wittoeck 96
garnaal, twee soorten slangsterren, heremietkreeft, zwemkrab, sepiola en dwergpijlinktvis. Voor geen enkel van deze ecosysteemcomponenten werden veranderingen waargenomen in de patronen in en rond de concessiezones, waardoor deze nog steeds vergelijkbaar zijn met de referentiezones. Aangezien slechts kleine verschillen werden waargenomen betreffende de biotische variabelen tussen de concessiezones en hun respectievelijke referentiezones, blijken de geselecteerde referentiegebieden (Thorntonbank, Goote Bank, Bligh Bank and Hinderbanken) als dusdanig geschikt. De constructie van turbines in de concessiegebieden heeft echter wel een invloed op de uitvoering van boomkorslepen, aangezien de aanwezigheid van kabels en andere objecten op de zeebodem de voltooiing van een sleep verhindert. Bijgevolg zal de staalnamestrategie bij volgende campagnes moeten worden aangepast, voornamelijk door het verkorten van de slepen en een verhoging van het aantal slepen in de buurt van de turbines.

Chapter 7. Soft substrate epifauna and demersal fish fauna 97
7.1. Introduction
The assemblage of macro-epibenthic and macro-endobenthic organisms constitutes an important source of prey items for demersal fish species. Hence, any change within the benthic community resulting from the construction, exploitation and dismantlement of a windmill park may give rise to changes within the demersal fish community. In order to observe and understand changes in this community during the proceedings of several windmill projects from an ecological perspective (i.e. functional approach), it is imperative to gather data on both the demersal fish communities and on the availability and use of prey items.
The distribution of benthic macro-invertebrates strongly depends on seafloor conditions. Differences in sedimentology and seafloor morphology are major factors determining the presence and abundance of the encountered species. Consequently, the benthic macro-invertebrate community structure is expected to be influenced by geomorphological changes (e.g. construction of windmills, creation of a new habitat, change of the original habitat) in windmill concession zones.
Next to undergoing direct effects of the existence of windmill parks, benthic macro-invertebrate and demersal fish communities may also react to a reduction of beam trawling activities in the windmill concession zones. Additionally, an increase in fisheries pressure along the borders of a closed area (ref. plaice box in the Netherlands) is expected to impact the benthic ecosystem (= fringe-effect). Finally, the introduction of hard substrates in the windmill concession zones implies the introduction of an associated fauna, both macro-invertebrates and fish, which can play a structuring role (e.g. predation) within the benthic ecosystem of soft substrates.
Given the expected effects of windmill park construction and exploitation on benthic macro-invertebrates and demersal fish, and the ecological and socio-economical importance of these species groups, they merit ample attention in the ecological evaluation of windmill park projects.
At present, there is one windmill park under construction, more precisely the one of the company C-power on the Thorntonbank. Concerning this particular park, a detailed pilot study (T0) has already been carried out in 2005, during which the reference condition of the demersal fish fauna, and the macro-epibenthic and macro-endobenthic fauna of the present soft substrates on the Thorntonbank and the Goote Bank were described (De Maersschalck et al., 2006). In accordance with the general monitoring plan of MUMM, this study was followed by the assessment of the condition of the different ecosystem components during year 1 (construction; T1). A second concession has been granted to n.v. Belwind for the construction and exploitation of a windmill park on the Bligh Bank. A detailed description of the reference conditions (T0) in the Bligh Bank area was also included in the general monitoring plan of MUMM.
7.2. Aims
This report investigates the condition of demersal fish and macro-epibenthos in the concession zones and reference zones of the Thorntonbank windmill park at year 1 and of the Bligh Bank windmill park at year 0. These results form the basis of the impact assessment concerning the construction and exploitation of the windmill parks under investigation (including the effects of the closure of the concession zones for beam trawling and sand extraction);
The aims of the monitoring activities were: - Assessing the condition of the demersal fish fauna and the macro-epibenthic fauna of the
soft substrates in the concession zones and reference zones of the Thorntonbank windmill park during year 1 (2008). The results were compared with the reference conditions observed in 2005.
- Assessing the condition of the demersal fish fauna and the macro-epibenthic fauna of the soft substrates in the concession zones and reference zones of the Bligh Bank windmill park during year 0 (reference condition 2008). Furthermore, the suitability of potential reference zones was evaluated.

S. Vandendriessche, K. Hostens & J. Wittoeck 98
- The results of ecosystem components macro-epibenthos and demersal fish were compared and integrated with the results about ecosystem component macro-endobenthos
7.3. Sampling strategy and methods
In order to maximize the (statistical) sensitivity of the survey strategy and analyses to changes due to the ecological impact of the construction and exploitation of windmill parks, a considerable coverage is required. Consequently, a high sampling intensity (such as the one used in the Thorntonbank baseline study) was maintained for the evaluation of the Thorntonbank construction impact (T1), and was duplicated for the Bligh Bank baseline study (T0). Due to this high sampling intensity in and around the windmill park concession zones, the spatial variability in density, biomass and diversity is representatively mapped. Sampling was repeated in spring and autumn, since numerous national and international research projects indicate that sampling in these seasons is adequate for analyzing the presence and density of most species.
The used strategy and techniques correspond well with the ones used in other studies concerning the macro-epibenthos and demersal fish from Belgian maritime waters. This way, existing data can be optimally used in the ecological evaluation of the current status. Detailed information about the sampling campaigns can be found in the campaign reports and the interim project report (Hostens et al. 2008a,b,c; Vandendriessche et al. 2008).
7.3.1. T1 - Thorntonbank/Goote Bank area
For the monitoring of the macro-epibenthos and demersal fish, a similar level of detail was maintained as in the pilot study (T0). In the Goote Bank reference zone, however, only the fish track on the sandbank top (WG2) was repeated, since the composition of the resident fauna in the gullies differed too strongly from the composition observed in the Thorntonbank gullies (De Maersschalck et al., 2006). Furthermore, construction works at one of the six windmills in the western concession zone and the vulnerability of their wiring on the seafloor necessitated the repositioning of fish tracks WT4 and WT5 with 500m to the SE during the autumn campaign (Figure 1).
During the 2008 monitoring campaigns, one fish track was done in every concession area, 4 fish tracks each were done in the adjoining gullies and the reference areas (3 in the Thorntonbank reference area and 1 in the Goote Bank reference area) from which both demersal fish and macro-epibenthic assemblages were analysed (Table 1, Figure 1).
The preservation of the level of detail, bar the described adjustments, allows a straightforward assessment of the direct impact of the recent windmill construction works (habitat loss, changes in community structure, effects of reduced fisheries pressure, etc.) and a comparison with the reference condition of 2005 (T0). Table 1 The Thorntonbank sampling stations in the concession zones, in the adjoining gullies and the reference zones, per ecosystem component.
Concession zones Fringe effects Reference zones Epibenthos 2 4 4
Demersal fish 2 4 4

Chapter 7. Soft substrate epifauna and demersal fish fauna 99
Figure 1. Position of the fish tracks (epibenthos and demersal fish) in the Thorntonbank concession zones, in the adjoining gullies and in the reference zones of the Thorntonbank and the Goote Bank, with indication of the
sample codes.
7.3.2. T0 - Bligh Bank/Hinderbanken area
Given the size of the Bligh Bank concession zone (35.6 km²; 49.1 km² including the safety zone) and the variable bathymetry of the area, it was decided to do three fish tracks within the concession zone (according to bathymetry) and two fish tracks along its borders to monitor the fringe effects (Table 2, Figure 2). Two reference zones were selected, i.e. the Bligh Bank reference zone and the Hinderbanken (Oosthinder) reference zone, in which three fish tracks were done to evaluate their suitability as references areas for the Bligh Bank concession zone. From each fish track, the demersal fish fauna and the macro-epibenthic fauna were sorted and analysed. Table 2 The Bligh Bank sampling stations in the concession zone, along its borders and in the reference zones, per ecosystem component.
Concession zone Fringe effects Reference zones Epibenthos 3 2 6 Demersal fish 3 2 6

S. Vandendriessche, K. Hostens & J. Wittoeck 100
Figure 2. Position of the fish tracks (epibenthos and demersal fish) in the Bligh Bank concession zone, in the
adjoining gullies and in the reference zones of the Bligh Bank and the Oosthinder, with indication of the sample codes.
Demersal fish fauna and macro-epibenthos can be defined as the organisms that live on or in
close association with the seafloor, and that are caught representatively and efficiently with a beam trawl. Both ecosystem components were sampled onboard the research vessel Belgica with an 8-meter beam trawl with a fine-meshed shrimp net (stretched mesh width 22 mm in the codend) and a bolder-chain but no tickler chains (to minimize the environmental damage). The net was dragged during 30 minutes at an average speed of 4 knots over the bottom. As such, a mean distance of 3500m was covered. Data were recorded on time, start and stop coordinates, trajectory and sampling depth in order to enable a correct conversion towards sampled surface units. The fish tracks were positioned following depth contours that run parallel to the coastline, thereby minimizing the depth variation within a single track. After each fish track, a photograph was taken of the net content prior to the processing of the catch (see Annex 5).
Since the catch sizes from the 2008 campaigns were generally rather modest, the net contents were processed without the use of a rincing and sieving machine. All fish, except gobies, were identified, measured and/or counted or wet weighed on board. For a number of tows, the epibenthos (including gobies) was processed on board as well; for other tows, a subsample of 6 liters was frozen for further laboratory analyses. Rare or peculiar species/individuals were stored for further reference or investigation.
Continuous CTD recordings of a number of environmental variables on the sampling locations were used in the analysis of the spatial distribution of the encountered species. General weather conditions were recorded and were also provided by the concession holder.
The net contents were divided into ‘demersal fish’ and ‘epifauna’. These ecosystem components were dealt with separately concerning density, biomass (epibenthos only), diversity, length frequency distribution and community structure. The number of individuals per sample and per species was converted to number of individuals per 1000m² (abundance). Biomass was expressed as grams of wet weight (WW) per 1000m² and diversity was evaluated based on Hill’s diversity indices (Hill, 1973). The values of statistical variables were calculated with the programs Statistica 8 (Kruskall-Wallis ANOVA and Mann-Whitney U tests). The community structure of epifauna and demersal fish were

Chapter 7. Soft substrate epifauna and demersal fish fauna 101
analysed using the multivariate techniques non-metric multidimensional scaling (MDS), ANOSIM (analysis of similarities) and SIMPER (similarity percentages procedure) available in Primer v5 (Plymouth Routines in Multivariate Ecological Research; Clarke & Gorley, 2001). These analyses were based on 4th root transformed and reduced datasets1 of frequency of occurrence and density. For the most important species of demersal fish and epibenthos, the length frequency distributions were analysed and visualized. Maps were generated with ArcView 9.3.
All acquired data will be available within the BMDC database of MUMM at the following web site (http://www.mumm.ac.be/datacentre).
7.4. Results
7.4.1. Demersal fish: density
7.4.1.1. Thorntonbank (C-Power concession): condition in 2008
In 2008, the total densities of demersal fish were generally higher (> twice) in autumn compared to spring, with outlier values at the gullies of the Eastern Concession Zone (ECZ) in autumn (Table 3). While densities were comparable between the WCZ and its gulies, the values from the gullies at the ECZ were considerably higher than the values observed within the ECZ. In spring, the dominant species groups were perciforms (45%), pleuronectiforms (12%) and clupeiforms (32%) for the WCZ, and perciforms (73%) and pleuronectiforms (22%) for the ECZ (Table 4, Figure 3). In the gullies of both zones, perciforms and pleuronectiforms made up the bulk of the density, with a dominance of perciforms (72-85%) along the WCZ and of pleuronectiforms (65-69%) at the ECZ. In autumn, clupeids were absent and perciforms dominated both the concession zones as their neighboring gullies (64-74% in WCZ; 19-78% in ECZ). Pleuronectiforms were of less importance, and a high percentage of gadiforms (64%) was observed at the SE gully of the ECZ (Table 5, Figure 3). Table 3. Overview of the mean density of demersal fish fauna per taxonomic group for the examined years and seasons – monitoring stations Thorntonbank. Season density density per taxonomic group (#/1000m²)
year #/1000m² Clupeiformes Gadiformes Gobiidae other Perciformes Pleuronectiformes Scorpaeniformes
spring 2005 34 21,6 0,4 0,5 0,1 5,6 4,7 1,0 2008 12 0,6 0,3 0,3 <0,1 4,8 5,6 0,2 autumn 2005 30 <0,1 1,7 3,0 <0,1 18,8 6,2 0,2 2008 37 0,1 17,6 2,2 0,1 18,1 9,6 0,2
In the Thorntonbank reference zone (TRZ), densities were comparable between the top and the
gullies of the bank in both seasons. At the tops of both reference zones (Thorntonbank and Goote Bank) perciforms and pleuronectiforms were the dominant species groups, complemented in spring in with a high number of clupeiforms (18-22%). The gullies of the Thorntonbank reference zone were characterized by high numbers of perciforms (32-76%) and pleuronectiforms(12-64%).
No significant differences were found concerning density between the different zones in both seasons for 2008. Densities in the TRZ were quite similar to those observed in the WCZ, for both the tops and gullies. In both seasons, the differences between tops and gullies were more pronounced in the ECZ, with low densities on the top, especially in spring, and high densities in the gullies. Density values on top of the Goote Bank were the lowest observed (2 ind/1000m² in spring, 11 ind/1000m² in autumn).
In spring, the Thorntonbank stations were dominated in terms of density by dab Limanda limanda and solenette Buglossidium luteum for the pleuronectiforms and by two dragonet species
1 The datasets were reduced to all species observed in more than two fish tracks and occurring with a mean density of more than 0,01
individuals per 1000m².

S. Vandendriessche, K. Hostens & J. Wittoeck 102
Callionymus lyra and C. reticulatus, and the lesser weever Echiichtys vipera for the perciforms. At the Goote Bank, the same species were observed in high abundance, with the addition of the presence of sprat Sprattus sprattus for the clupeiforms. In autumn, the Goote Bank station was populated by mainly lesser weevers, dragonets and the sand goby Pomatoschistus minutus as representatives of the perciforms, and by dab as representative for the pleuronectiforms. At the Thorntonbank stations, poor cod Trisopterus minutus was very abundant (gadiforms), together with lesser weevers, dragonets, dab and solenette.
7.4.1.2. Thorntonbank (C-power concession): comparison 2005 - 2008
The general trends between and within the different zones of the Thorntonbank monitoring area (Thorntonbank references zone, eastern and western concession zone and Goote Bank reference zone) remain quite similar in both years:
- In the ECZ and the TRZ, the densities were lower on the top than in the neighboring gullies, while densities from top and gullies were comparable within the WCZ
- In the Goote Bank reference zone (GRZ), densities were higher on the top compared to the gullies. In 2008, only a top sample was taken, however with low values in both seasons.
When comparing the total fish densities between the years 2005 and 2008, it is quite obvious that spring densities were significantly lower in 2008: an average density of 34 ind/1000m² was recorded in 2005, while this number was reduced to 12 ind/1000m² in 2008. This is a reduction of 65% of the average density, when pooling all stations. Statistical verification showed this observation to be significant (Mann-Whitney U test, p=0.004) and most outspoken in the western concession zone, where densities were on average 80% lower in 2008. There were no significant differences between years for the autumn samples (overall p=0.8).
When analyzing the differences found between spring data of the two years on the level of species groups, it became obvious that the differences were largely due to a reduction of clupeiforms, being predominantly sprat (Sprattus sprattus) and herring (Clupea harengus). In the spring of 2005, these fish species were observed with an average density of 22 ind/1000m², while in the same period of 2008, an average density of only 1 ind/1000m² was registered. The reduction of the densities in herring and sprat was visible in all stations and zones, implying that this observation is due to interannual variation in the distribution and/or demography of these species.
The average densities of the other species groups (gobies, perciforms, pleuronectiforms and gadiforms) showed no marked differences between the years; only scorpaeniforms were more abundant in the spring of 2005 (1 ind/1000m², in comparison with 0.2 ind/1000m² in 2008). This difference was predominantly due to variations in the abundance of hooknose (Agonus cataphractus).
For both years and seasons, the following species returned as highly important in terms of density: dragonets, dab, solenette, lesser weever and sand goby. The horse mackerel (Trachurus trachurus) was a dominant species in autumn of 2005, but was also frequently found in autumn 2008, albeit in very modest abundance. Poor cod (Trisopterus minutus), on the other hand, showed a peak density in autumn 2008 (station WT7), but was also found spring and autumn of 2005 (especially at stations WG3 and WT7).

Chapter 7. Soft substrate epifauna and demersal fish fauna 103
Table 4 Overview of the mean density of demersal fish fauna per station and per taxonomic group – monitoring stations Thorntonbank, spring 2005 & 2008. Thornton 2005 spring
Area Zone Station spring density spring density per taxonomic group (#/1000m²) #/1000m² Clupeiformes Gadiformes Gobiidae other Perciformes Pleuronectiformes Scorpaeniformes
TRZ SE gully WT1 59 54,1 0,6 0,1 - 2,7 1,4 0,3 TRZ top WT2 15 9,9 0,1 0,1 - 4,0 1,1 0,1 Ref Th TRZ NW gully WT3 47 9,5 1,1 0,2 - 19,2 16,0 1,0 WCZ SE gully WT4 66 60,4 <0,1 1,1 - 3,0 1,8 0,1 WCZ top WT5 38 31,6 0,3 - - 4,8 1,1 0,2
West Conc
WCZ NW gully WT6 34 7,4 0,4 - - 14,2 10,3 1,6 ECZ SE gully WT7 39 15,5 0,6 1,8 0,2 3,5 11,4 5,7 ECZ top WT8 9 7,5 <0,1 - - 1,0 0,7 <0,1
East Conc
ECZ NW gully WT9 18 6,8 0,4 <0,1 - 4,2 5,5 1,3 GRZ SE gully WG1 10 5,4 0,4 0,1 - 0,6 2,7 0,9 GRZ top WG2 51 48,7 <0,1 0,1 <0,1 0,5 1,2 0,4 Ref Gb GRZ NW gully WG3 17 2,4 0,8 0,8 - 9,9 2,7 0,4
Thornton 2008 spring Area Zone Station spring density spring density per taxonomic group (#/1000m²)
#/1000m² Clupeiformes Gadiformes Gobiidae other Perciformes Pleuronectiformes Scorpaeniformes TRZ SE gully WT1 11 0,0 0,4 0,3 - 5,9 4,4 <0,1 TRZ top WT2 8 1,4 0,3 0,3 - 5,2 0,7 <0,1 Ref Th TRZ NW gully WT3 18 0,2 0,5 <0,1 - 5,7 11,5 <0,1 WCZ SE gully WT4 6 0,0 - <0,1 - 5,2 0,8 - WCZ top WT5 7 2,4 0,2 0,5 - 3,3 0,9 -
West Conc
WCZ NW gully WT6 10 - 0,1 <0,1 - 7,1 2,5 <0,1 ECZ SE gully WT7 32 <0,1 1,3 1,1 <0,1 6,5 22,1 1,0 ECZ top WT8 3 - <0,1 0,1 - 1,9 0,6 -
East Conc
ECZ NW gully WT9 19 - 0,1 - - 6,4 12,1 - Ref Gb GRZ top WG2 2 0,4 0,1 <0,1 <0,1 1,0 0,3 -
Table 5 Overview of the mean density of demersal fish fauna per station and per taxonomic group – monitoring stations Thorntonbank, autumn 2005 & 2008. Thornton 2005 autumn
Area Zone Station autumn density autumn density per taxonomic group (#/1000m²) #/1000m² Clupeiformes Gadiformes Gobiidae other Perciformes Pleuronectiformes Scorpaeniformes
TRZ SE gully WT1 29 - 2,1 1,4 - 18,8 6,7 <0,1 TRZ top WT2 19 - 0,1 2,1 - 11,8 4,6 0,1 Ref Th TRZ NW gully WT3 35 - 1,6 - - 21,8 11,9 0,2 WCZ SE gully WT4 20 <0,1 - 3,5 - 15,2 1,0 - WCZ top WT5 24 - 0,4 4,2 - 13,9 5,6 <0,1
West Conc
WCZ NW gully WT6 26 <0,1 0,7 2,3 - 18,3 4,9 0,2 ECZ SE gully WT7 37 - 5,1 4,1 - 9,9 17,4 0,8 ECZ top WT8 9 - 0,2 1,3 - 5,9 1,0 0,1
East Conc
ECZ NW gully WT9 35 - 1,3 7,4 - 17,2 8,5 0,8 GRZ SE gully WG1 19 - 3,6 3,2 - 8,8 3,5 0,1 GRZ top WG2 84 - 0,2 3,3 - 78,2 2,4 <0,1 Ref Gb GRZ NW gully WG3 16 - 3,7 0,5 - 5,7 6,5 <0,1
Thornton 2008 autumn Area Zone Station autumn density autumn density per taxonomic group (#/1000m²)
#/1000m² Clupeiformes Gadiformes Gobiidae other Perciformes Pleuronectiformes Scorpaeniformes TRZ SE gully WT1 22 - - 1,7 0,1 15,3 5,0 <0,1 TRZ top WT2 20 - - 2,3 - 15,4 2,5 - Ref Th TRZ NW gully WT3 31 - 0,1 2,7 - 22,0 6,6 0,1 WCZ SE gully WT4 15 <0,1 - 2,1 - 10,8 1,7 - WCZ top WT5 24 - - 3,6 - 15,5 5,0 -
West Conc
WCZ NW gully WT6 21 <0,1 <0,1 2,1 - 14,3 4,7 - ECZ SE gully WT7 109 - 69,5 1,7 <0,1 20,8 16,8 0,1 ECZ top WT8 18 - - 1,1 - 14,3 2,9 -
East Conc
ECZ NW gully WT9 98 - 0,6 3,1 - 45,3 48,8 0,7 Ref Gb GRZ top WG2 11 0,1 - 1,4 - 7,0 2,1 -

S. Vandendriessche, K. Hostens & J. Wittoeck 104
010203040506070
WT1 WT2 WT3 WT4 WT5 WT6 WT7 WT8 WT9 WG1 WG2 WG3 WT1 WT2 WT3 WT4 WT5 WT6 WT7 WT8 WT9 WG2
SE gully
top NW gully
SE gully
top NW gully
SE gully
top NW gully
SE gully
top NW gully
SE gully
top NW gully
SE gully
top NW gully
SE gully
top NW gully
top
Ref Th West Conc East Conc . Ref Gb Ref Th West Conc East Conc Ref Gb
2005 2008
#/10
00m²
Spring densities Thorntonbank
Clupeiformes Perciformes Pleuronectiformes other
0
20
40
60
80
100
120
WT1 WT2 WT3 WT4 WT5 WT6 WT7 WT8 WT9 WG1 WG2 WG3 WT1 WT2 WT3 WT4 WT5 WT6 WT7 WT8 WT9 WG2
SE gully
top NW gully
SE gully
top NW gully
SE gully
top NW gully
SE gully
top NW gully
SE gully
top NW gully
SE gully
top NW gully
SE gully
top NW gully
top
Ref Th West Conc East Conc Ref Gb Ref Th West Conc East Conc Ref Gb
2005 2008
#/10
00m²
Autumn densities Thorntonbank
Gobiidae Perciformes Pleuronectiformes Other
Figure 3. Column chart of densities of demersal fish per taxonomic group for all stations and zones - monitoring
stations Thorntonbank, spring (upper) and autumn (lower) 2005 & 2008.
7.4.2. Bligh Bank (Belwind concession): condition in 2008
In autumn, densities from the tops of the concession zone and the Bligh Bank reference zone (BRZ) were about double of the spring values (Table 6, Figure 4). Values from the neighboring areas were similar in both seasons. In the Hinderbanken reference zone (HRZ), values from all stations were about three times higher in autumn compared to spring.
In both seasons, perciforms were highly dominant at the top of the concession zone (>90% of the total density per station; mainly lesser weever). In the gullies from the concession zone and at the Bligh Bank borders (BBB), both perciforms and pleuronectiforms were observed most abundantly. Only in spring, at the SE part of the gully and the NW border of the concession zone, gadiforms showed high relative abundances (69% and 45%, respectively).
The patterns in density and taxonomic composition in both reference zones reflected those from the concession zone, with densities from the tops that were 1.3 to 2 times higher in autumn compared to spring, while densities from the gullies remained similar. The tops were dominated (>90%) by perciforms, while pleuronectiforms were of similar importance as perciforms in the gullies. In spring, the mean density was higher in the Bligh Bank reference zone compared to the Hinderbanken reference zone (x2), but in autumn the density values were quite similar. No significant differences were found concerning density between the different zones in both seasons for 2008.

Chapter 7. Soft substrate epifauna and demersal fish fauna 105
Table 6 Overview of the mean density of demersal fish fauna per station and per taxonomic group – monitoring stations Bligh Bank, spring and autumn 2008. Bligh 2008 spring Area Zone Station spring
density spring density per taxonomic group (#/1000m²)
#/1000m² Clupeiformes Gadiformes Gobiidae other Perciformes Pleuronectiformes Scorpaeniformes
SE gully WBB01 33 - 6,9 - - 11,0 14,6 0,2
Top WBB02 30 0,2 - 0,2 - 28,4 1,0 - Ref BB
NW gully WBB03 18 - 0,8 <0,1 <0,1 6,6 10,7 0,1
BBB ZO border WBB04 11 - 1,1 <0,1 - 6,0 3,5 -
SE gully WBB05 32 <0,1 22,2 - - 4,7 5,1 -
Top WBB06 20 0,2 0,3 <0,1 - 18,8 1,1 - Conc
NW gully WBB07 24 0,3 0,6 - - 16,9 5,8 -
BBB NW border WBB08 44 <0,1 19,7 - - 12,5 11,3 0,2
SE gully WOH01 13 - 1,1 - - 3,0 9,1 <0,1
top WOH02 15 - - 0,1 - 14,5 0,8 - Ref HB
NW gully WOH03 11 - 0,1 <0,1 - 9,0 2,2 <0,1
Bligh 2008 autumn Area Zone Station autumn
density autumn density per taxonomic group (#/1000m²)
#/1000m² Clupeiformes Gadiformes Gobiidae other Perciformes Pleuronectiformes Scorpaeniformes
SE gully WBB01 30 - 0,1 6,5 - 18,9 4,7 0,1
Top WBB02 71 - - 0,5 - 68,7 1,6 - Ref BB
NW gully WBB03 18 - 0,1 0,8 - 14,0 3,0 0,1
BBB ZO border WBB04 31 - 5,8 2,4 <0,1 14,9 7,6 0,1
SE gully WBB05 20 - 2,1 3,2 <0,1 9,8 5,0 0,2
Top WBB06 61 - - 1,5 - 57,4 2,3 0,1 Conc.
NW gully WBB07 35 - 0,1 2,6 <0,1 26,1 6,2 0,4
BBB NW border WBB08 29 - 1,4 0,8 - 18,5 8,2 0,1
SE gully WOH01 40 - 8,3 3,6 - 18,5 9,7 0,4
Top WOH02 51 - - 0,7 - 49,6 1,0 - Ref HB
NW gully WOH03 31 - 0,1 1,3 - 24,3 4,7 0,3
The most important species in spring for the Bligh Bank area were the lesser weever Echiichtys
vipera for the perciforms, whiting Merlangius merlangus for the gadiforms and dab (Limanda limanda), solenette (Buglossidium luteum) and plaice (Pleuronectes platessa) for the pleuronectiforms. Since gadiforms were far less abundant in the Hinderbanken reference zone, dab and the dragonet Callionymus lyra showed higher relative abundances than in the Bligh Bank area.

S. Vandendriessche, K. Hostens & J. Wittoeck 106
0
10
20
30
40
50
WBB01 WBB02 WBB03 WBB04 WBB05 WBB06 WBB07 WBB08 WOH01 WOH02 WOH03
SE gully top NW gully SE border
SE gully top NW border
NW rand SE gully top NW gully
Ref BB BBB Conc BBB Ref HB
#/10
00m²
Spring densities Blighbank
Gadiformes Perciformes Pleuronectiformes other
0
10
20
30
40
50
60
70
80
WBB01 WBB02 WBB03 WBB04 WBB05 WBB06 WBB07 WBB08 WOH01 WOH02 WOH03
SE gully top NW gully SE border
SE gully top NW border
NW rand SE gully top NW gully
Ref BB BBR Conc BBR Ref HB
#/10
00m²
Autumn densities Blighbank
Gadiformes Perciformes Pleuronectiformes other
Figure 4. Column chart of densities of demersal fish per taxonomic group for all stations and zones - monitoring
stations Bligh Bank, spring (upper) and autumn (lower) 2008.
7.4.3. Demersal fish: diversity
7.4.3.1. Thorntonbank (C-power concession): condition in 2008
In total, 37 fish species were identified (see Annex 6), of which 25 were encountered in spring and 30 in autumn. Twelve species were only found in autumn, while 8 other species were recorded only in spring. An average of 13 species per fish track was found in spring, and an average of 15 species in autumn (Table 9, Figure 5). A minimum value of 9 species was observed at the NW gully of the ECZ in spring; maximum values of 19 species were observed in spring at the SE gully of the ECZ and in autumn at the NW gully of the ECZ.
In spring, the species richness (N0) was quite similar between the concession zones and the reference zones. There were no straightforward trends in the differences between gullies and sandbank tops. In autumn, the average species number per fish track increased, but this increase was not consistent. Only in the TRZ and ECZ, the values from the tops of the sandbanks were lower than in the neighboring gullies.
In spring, only three species were found in all fish tracks: dab Limanda limanda, lesser weever Echiichthys vipera and the dragonet Callionymus reticulatus. Four species were found in 75-90% of the tracks, 11species in 10-75% of the tracks and 7 species in only one track. In autumn, eight species were observed in all fish tracks: the three species mentioned for the spring samples, plus plaice

Chapter 7. Soft substrate epifauna and demersal fish fauna 107
Pleuronectes platessa, scaldfish Arnoglossus laterna, solenette Buglossideum luteum, the sand goby Pomatoschistus minutus, and the dragonet species Callionymus lyra. Six species were found in 75-90% of the tracks, 8 species in 10-75% of the tracks, and 8 species in only one fish track.
The trends observed for the diversity numbers of Hill (N1, N2, Ninf) differed slightly from the ones observed for the species richness N0: depending on the sensitivity to rare species in the Hill series, the status of bank tops and gullies varied. In the ECZ, for example, the highest H0 was found in the SE gully in spring, whereas Ninf showed a higher value at the sandbank top. In autumn at the same location, the lowest N0 was found on the top, while Ninf showed the highest value in the NW gully. This indicates a high variation in evenness between the different fish tracks.
The average Hill numbers (pooled over all stations) were higher in autumn compared to spring. In spring, minimum values for the Hill numbers were found in the SE gully at the WCZ (N1=3.0; N2=1.9; Ninf = 1.4) and maximum values in de SE gully of the TRZ (N1=8.3; N2=6.1; Ninf = 3.6). In autumn, minimum and maximum values were found at different stations for the different Hill numbers:
- N1: min 3.7 at WT7; max 8.4 at WT1 and WT5 - N2: min 2.3 at WT4; max 7.0 at WT6 - Ninf: min 1.5 at WT4; max 4.6 at WT3
No significant differences were found concerning the four Hill numbers between the different zones (GRZ excluded since only one sample) in both seasons for 2008.
7.4.3.2. Thorntonbank (C-power concession): comparison 2005 - 2008
Although a similar number of species was observed in both years (40 species in 2005; 37 species in 2008), there were quite a lot of species that were only observed in one of the years: 7 species were only observed in 2005, 6 species were only observed in 2008 (Table 8, Figure 5). These species, however, were usually rare (e.g. twaite shad Allosa fallax, Ballan wrasse Labrus bergylta, pipefish Syngnathus acus and S. rostellatus). As for the more dominant species, clear differences were observed between years, with the variation in densities of clupeiforms as main feature (see density section). Generally, the data from 2005 showed a higher degree of dominance than the data from 2008, due to the high relative abundances of sprat (39%) in spring and of horse mackerel (27%) in autumn. When comparing the seasons, dominance was highest in spring of both years (average Ninf: 2.7 in spring of both years; 3.4 in autumn 2005 and 2.9 in autumn 2008).
The species number N0 in spring 2005 was 1.5 times higher in the gullies compared to the sandbank tops, while in spring 2008, tops and gullies showed similar values and the trend seen in 2005 was not recognizable. In autumn 2005, the tops from the TRZ and the WCZ showed higher or similar values compared to the gullies, while in 2008, the tops from the TRZ and the ECZ showed lower species numbers than the gullies.
In spring 2005, overall low values for the diversity numbers were found at the top of the WCZ and the SE gully of the TRZ; high values were found at the NW gully of the TRZ and the NW gully of the ECZ. In 2008, low and high values were found at other sites (low: NW gully of the ECZ and SE gully of the WCZ; high: SE gully of the TRZ and the top of the GRZ). In autumn of both years the position of the highest and lowest values for the diversity numbers was similarly inconsistent (see table).
When comparing the values of the diversity numbers between the years 2005 and 2008 (overview of averaged values in table), one can conclude that the values were generally higher in 2005, especially in autumn. Statistical analyses, however, found these differences to be insignificant for all Hill numbers, for both spring samples and autumn samples.

S. Vandendriessche, K. Hostens & J. Wittoeck 108
Table 7 Overview of the mean diversity numbers concerning demersal fish fauna for the examined years and seasons – monitoring stations Thorntonbank.
Year Spring Autumn
HillN0 HillN1 HillN2 HillNinf HillN0 HillN1 HillN2 HillNinf
2005 16,3 5,4 3,9 2,7 17 7,5 5,6 3,4
2008 13,2 5,6 4,1 2,7 15 6,5 4,8 2,9
Table 8 Overview of the diversity numbers concerning demersal fish fauna per station– monitoring stations Thorntonbank, 2005.
Area Zone Station Spring Autumn
HillN0 HillN1 HillN2 HillNinf HillN0 HillN1 HillN2 HillNinf
TRZ SE gully WT1 14 2,6 1,9 1,4 18 9,1 7,0 3,8
TRZ top WT2 14 5,5 4,1 3,0 20 7,5 4,5 2,3
Ref Th
TRZ NW gully WT3 19 7,9 6,3 4,4 16 6,6 5,5 3,9
WCZ SE gully WT4 13 2,9 2,3 1,8 13 5,0 3,6 2,5
WCZ top WT5 12 2,7 1,9 1,4 18 9,4 8,0 5,7
West Conc
WCZ NW gully WT6 16 7,0 5,1 2,9 18 7,0 4,9 3,1
ECZ SE gully WT7 18 7,0 5,2 3,4 17 7,0 4,7 2,7
ECZ top WT8 11 3,9 2,9 2,1 15 7,8 5,3 2,8
East Conc
ECZ NW gully WT9 18 8,6 7,0 5,0 17 8,5 7,0 4,7
GRZ SE gully WG1 19 6,7 4,0 2,3 19 11,7 9,5 4,9
GRZ top WG2 16 2,5 2,2 2,0 13 2,0 1,4 1,2 Ref Gb
GRZ NW gully WG3 25 7,0 3,5 2,0 18 8,2 5,5 3,2
Table 9 Overview of the diversity numbers concerning demersal fish fauna per station– monitoring stations Thorntonbank, 2008.
Area Zone Station Spring Autumn
HillN0 HillN1 HillN2 HillNinf HillN0 HillN1 HillN2 HillNinf
TRZ SE gully WT1 17 8,3 6,1 3,6 17 8,4 6,0 3,1
TRZ top WT2 16 6,2 4,4 2,9 13 5,6 3,3 1,9 Ref Th
TRZ NW gully WT3 13 5,9 4,3 2,5 18 8,5 7,2 4,6
WCZ SE gully WT4 10 3,0 1,9 1,4 13 4,0 2,3 1,5
WCZ top WT5 14 6,3 4,8 3,1 15 8,4 6,9 4,0 West Conc
WCZ NW gully WT6 13 4,8 3,7 2,8 15 8,3 7,0 4,5
ECZ SE gully WT7 19 5,6 3,9 2,7 17 3,7 2,5 1,7
ECZ top WT8 10 5,5 4,2 3,0 13 5,4 3,5 2,1 East Conc
ECZ NW gully WT9 9 3,2 2,3 1,6 19 6,3 4,8 3,2
Ref Gb GRZ top WG2 11 7,1 5,5 3,2 14 6,2 4,3 2,5

Chapter 7. Soft substrate epifauna and demersal fish fauna 109
0
5
10
15
20
25
Diversity numbers Thornton 2005
HillN0 HillN1 HillN2 HillNinf
0
5
10
15
20
25
WT1 WT2 WT3 WT4 WT5 WT6 WT7 WT8 WT9 WG1 WG2 WG3
SE gully top NW gully
SE gully top NW gully
SE gully top NW gully
SE gully top NW gully
Ref Th West Conc East Conc Ref Gb
0
5
10
15
20
25
Diversity numbers Thornton 2008
HillN0 HillN1 HillN2 HillNinf
spring
0
5
10
15
20
25
WT1 WT2 WT3 WT4 WT5 WT6 WT7 WT8 WT9 WG2
SE gully top NW gully
SE gully top NW gully
SE gully top NW gully
top
Ref Th West Conc East Conc Ref Gb
autumn
Figure 5. Column chart of diversity numbers concerning demersal fish for all stations and zones - monitoring
stations Thorntonbank, 2005 (upper) 2008 (lower).
spring
autumn

S. Vandendriessche, K. Hostens & J. Wittoeck 110
7.4.3.3. Bligh Bank (Belwind concession): condition in 2008
A total of 30 demersal fish species were recorded in the research area in autumn, all of which were caught in the Bligh Bank region, while only 24 species were encountered in the Hinderbanken region. In spring, a total of 27 species was recorded, of which 25 species were observed in the Bligh Bank region and 17 in the Hinderbanken region. Ten species were only found in autumn, while 6 other species were recorded only in spring. An average of 13 species per fish track was found in spring, and an average of 18 species in autumn. A minimum value of 8 species was observed at the top of the Hinderbanken reference zone in spring; maximum values of 22 species were observed in autumn at the SE gully and SE border of the concession zone.
In spring, the species richness (N0) was quite similar between the concession zone and the reference zones (Table 10, Figure 6). The values from the concession border however, were higher than the values from within the concession zone, especially in the NW (18 species). Additionally, the values from the tops of the sandbanks in the three investigated zones were lower than in the neighboring gullies. This trend was most outspoken in the HRZ (8 species on the sandbank, 13 species in both the gullies). In autumn, the same trends were observed concerning variations between and within the different zones, but the species richness was consistently higher than in spring for all stations.
In spring, only four species were found in all fish tracks: plaice, dab, lesser weever and the sandeel Hyperoplus lanceolatus. Five species were found in 75-90% of the tracks, 10 species in 10-75% of the tracks and 8 species in only one track. In autumn, eleven species were observed in all fish tracks: the four species mentioned for the spring samples, plus the sandeel Ammodytes tobianus, scaldfish Arnoglossus laterna, solenette, two goby species Pomatoschistus lozanoi and P. minutus, and the two dragonet species Callionymus lyra and C. reticulatus. Three species were found in 75-90% of the tracks, 13 species in 10-75% of the tracks, and 3 species in only one fish track.
The diversity numbers of Hill (N1, N2, Ninf) reflect the same trends as observed for the species richness N0: the values from the tops of the sandbanks in the three investigated zones were lower than in the neighboring gullies and borders. These differences diminish as the sensitivity to rare species decreases in the Hill series from N0 to Ninf. Between seasons, the diversity values of the sandbank tops remained similar, whereas the values from the gullies and the concession border consistently increased. In spring, minimum values for the Hill numbers were found at the top of the BRZ and maximum values in de SE gully of this zone. In autumn, minimum values were found again at the top of the BRZ, but maximum values were observed in the SE gully and border of the concession zone.
No significant differences were found concerning the four Hill numbers between the different zones in both seasons for 2008. Table 10 Overview of the diversity numbers concerning demersal fish fauna per station– monitoring stations Bligh Bank, 2008.
Area Zone Station Spring Autumn
HillN0 HillN1 HillN2 HillNinf HillN0 HillN1 HillN2 HillNinf
SE gully WBB01 15 6,0 4,7 3,5 16 7,5 4,8 2,5 top WBB02 11 1,5 1,2 1,1 12 1,3 1,1 1,0 Ref BB
NW gully WBB03 16 5,1 3,3 2,1 18 6,1 3,8 2,3 BBB SE border WBB04 13 4,7 3,1 2,0 22 9,7 7,3 4,5
SE gully WBB05 12 3,1 2,1 1,5 22 9,9 7,3 4,0 top WBB06 11 1,9 1,3 1,1 16 1,7 1,2 1,1 Conc
NW gully WBB07 12 4,1 2,7 1,8 20 5,7 3,1 1,8 BBB NW border WBB08 18 5,2 3,7 2,4 18 7,1 4,9 2,9
SE gully WOH01 13 4,5 2,7 1,7 19 8,6 6,4 4,2
top WOH02 8 1,7 1,3 1,1 13 1,7 1,2 1,1 Ref HB
NW gully WOH03 13 3,3 2,0 1,5 20 5,2 3,0 1,9

Chapter 7. Soft substrate epifauna and demersal fish fauna 111
0
5
10
15
20
25
Diversity numbers Blighbank 2008
HillN0 HillN1 HillN2 HillNinf
0
5
10
15
20
25
WBB
01
WBB
02
WBB
03
WBB
04
WBB
05
WBB
06
WBB
07
WBB
08
WOH01
WOH02
WOH03
SE gully top NW gully
SE border
SE gully top NW gully
NW border
SE gully top NW gully
Ref BB BBB Conc BBB Ref HB
Figure 6. Column chart of diversity numbers concerning demersal fish for all stations and zones - monitoring
stations Bligh Bank, 2008.
7.4.4. Demersal fish: community analysis
7.4.4.1. Thorntonbank (C-power concession): condition in 2008
After the reduction of the database based on densities and frequencies of occurrences, 18 species were taken into account for spring and 23 species for autumn.
The MDS plot of the spring samples showed a clear distinction between the fish tracks taken on the sandbank tops (WT 2-5-8 and WG2) and slopes (WT4), and the sandbank gullies (WT1, WT3, WT6, WT7, WT9) (Figure 7). ANOSIM analysis based on the differences between these two groups resulted in an R-value of 0.54 (p=0.008), which indicates significant differences between the groups. The similarities within these groups were 70% and 72% for the group of top samples and the group of gully samples, respectively. The SIMPER procedure indicated that mainly varying densities of lesser weever, the two dragonet species and dab were responsible for the similarities within groups and the differences between groups: dab and dragonet were found in higher densities in the gully samples, while lesser weever was more dominant in the top samples. Additionally, sprat was found abundantly in the top samples WT5, WT2 and WG2. The isolated position of the top sample WG2 was due to the presence of Ballan wrasse at that location.
spring

S. Vandendriessche, K. Hostens & J. Wittoeck 112
WG2 WT1WT2
WT3
WT4
WT5
WT6
WT7
WT8
WT9
Stress: 0,07Thorntonbank2008 spring Thorntonbank2008 autumn
WG2
WT1
WT2
WT3
WT4
WT5
WT6
WT7
WT8
WT9
Stress: 0,03
Figure 7. MDS plots of spring and autumn samples, indicating groupings based on position in a gully (dark grey
contour) or on a sandbank top (light grey contour)- monitoring stations Thorntonbank, 2008. The MDS plot of the autumn samples showed a grouping of the fish tracks taken on the sandbank
tops (WT 2-5-8 and WG2) and slopes (WT4) (Figure 7). The species composition of the top samples of the Thorntonbank differed slightly from the gully samples of the TRZ (WT1, WT3) and the WCZ (WT6). The gully samples from the ECZ (WT7, WT9) were positioned at a larger multivariate distance in the plot. ANOSIM analysis based on the differences between the observed groups (1 = tops, 3 = gullies of ECZ, 2 = gullies of WCZ and TRZ) resulted in an R-value of 0.54 (p=0.01), which indicates significant differences between the groups. The similarities within these groups were rather high ( group 1: 82%, group 2: 87%, group 3: 70%). The species responsible for the differences between groups and the similarities within groups were identified using the SIMPER procedure. The group consisting of top samples was characterized by high densities of lesser weever, sand goby and dab. The gully samples of the TRZ and the WCZ were mostly populated by lesser weever, horse mackerel (however also present at station WT9) and dragonet. The gullies of the ECZ were characterized by dragonet, dab and solenette. The still considerable distance between samples WT7 and WT9 in this group was the result of high densities of hooknose and whiting at WT9 and of bib, poor cod and dab at WT7.
7.4.4.2. Thorntonbank (C-power concession): comparison 2005 - 2008
For a comparison between years, the data of 2005 and 2008 were analyzed together per season (Figure 8). The multivariate analysis based on spring data showed a straightforward primary separation of fish tracks based on sampling year (average dissimilarity between years = 46%, similarity within years slightly higher in 2005 (65% vs. 68%)), mainly based on varying densities of herring, sprat and hooknose (mostly 2005) and lesser weever (2008). Within years, the earlier described grouping of fish tracks taken on sandbank tops (and slopes) and in sandbank gullies remains a fact. A two-way ANOSIM revealed significant differences between years and sampling positions (tops vs gullies): R= 0.78 for the difference between year groups (p=0.001), and R=0.62 for the difference between sampling position groups (p=0.001). Hence, interannual differences should be considered dominant to differences between sandbank tops/slopes and gullies considering spring samples. The four groups discerned in the MDS (tops 2005, gullies 2005, tops 2008, gullies 2008) were characterized by average similarities of 68-73%. Gullies and sandbanks tops in 2005 were both dominated by sprat, herring and dab, but the groups were distinguishable based on differing densities of dragonet (gullies), solenette (gullies) and herring (tops). In 2008, gully and top samples both supported the presence of lesser weever, dragonet and dab, but groups were still separated based on density variations in dab, dragonet and solenette.
The clear grouping of samples according to sampling year and position observed in spring was not duplicated in autumn. Two-Way ANOSIM R-values for differences between years and sampling positions were significant, but were both much lower than in spring (years groups R= 0.26, p=0.007; sampling position groups R= 0.32, p=0.002). Apparently, the effect of sampling year was less outspoken in autumn compared to spring. The effect of sampling position was still important, but with a higher degree of overlap between groups than in spring, especially concerning stations from the Thorntonbank reference zone and the WCZ (stations WT1-6). The differences between both years

Chapter 7. Soft substrate epifauna and demersal fish fauna 113
were mainly due to the local abundance of horse mackerel and whiting in 2005 and of poor cod in 2008. The highest degree of coherence (82% similarity) was observed in the group of top samples from 2008, which was characterized by the species lesser weever, sand goby and dab. Lesser weever and sand goby were also abundant in the top samples from 2005, but these samples also harbored large numbers of horse mackerel. Gully samples from both years showed the highest contribution percentages from the species dab, dragonets and solenette.
WG105
WG205WG208
WG305
WT105
WT108
WT205WT208
WT305
WT308
WT405
WT408
WT505
WT508
WT605
WT608WT705
WT708
WT805
WT808
WT905
WT908
Stress: 0,12
20052008
Thorntonbank2005‐2008 spring
WG105
WG205
WG208
WG305
WT105
WT108WT205
WT208
WT305
WT308
WT405
WT408
WT505
WT508
WT605
WT608WT705
WT708
WT805
WT808 WT905
WT908
Stress: 0,11Thorntonbank 2005‐2008 autumn
Figure 8. MDS plot of spring (upper) and autumn (lower) samples, indicating groupings based on position in a gully (dark grey contour) or on a sandbank top (light grey contour)- monitoring stations Thorntonbank, 2005 &
2008.

S. Vandendriessche, K. Hostens & J. Wittoeck 114
7.4.4.3. Bligh Bank (Belwind concession): condition in 2008
After the reduction of the database based on densities and frequencies of occurrences, 19 species were taken into account for spring and 27 species for autumn.
The MDS plot of the spring samples showed a clear distinction between the fish tracks taken on the sandbank tops (WBB02, WBB06, WOH02), and the sandbank gullies (rest of the samples) (Figure 9). ANOSIM analysis based on the differences between these two groups resulted in a very high R-value of 0.88 (p=0.006), which indicates that most of the variation in species composition is explained by the position of the sample on a sandbank top or in a sandbank gully. The similarities within these groups were 77% and 81% for the group of gully samples and the group of top samples, respectively. The SIMPER procedure indicated that mainly varying densities of lesser weever, plaice and dab were responsible for the similarities within groups; the differences between groups (39% dissimilarity) was mainly caused by the species whiting, cod and and dragonet that were especially abundant in the gully samples (the dragonet C. lyra was only found in gullies, the reticulated dragonet C. reticulatus was found in both sample types).
The subdivision based on sampling position was equally clear from the MDS based on autumn samples, with a similar ANOSIM R (R= 0.83, p=0.006). The similarity within the groups was a bit larger than in spring (79% for gully samples, 87% for top samples). Lesser weever was found in all samples, but with highest densities in the top samples; top samples also typically contained plaice and sand gobies. Gully samples mainly yielded lesser weever, dragonet and dab and some of the gully stations showed local concentrations of whiting (stations WBB08, WBB05 and WOH1) and poor cod (stations WOH1 and WBB04).
WBB01
WBB02
WBB03
WBB04
WBB05
WBB06
WBB07 WBB08
WOH01WOH02
WOH03
Stress: 0,05Blighbank 2008 spring
WBB01
WBB02 WBB03
WBB04
WBB05WBB06 WBB07
WBB08
WOH01
WOH02WOH03
Stress: 0,09Blighbank 2008 autumn
Figure 9. MDS plots of spring and autumn samples, indicating groupings based on position in a gully (dark grey
contour) or on a sandbank top (light grey contour)- monitoring stations Bligh Bank, 2008.
7.4.5. Demersal fish: length-frequency
7.4.5.1. Thorntonbank (C-Power concession): condition in 2008 and comparison 2005 - 2008
For all fish species, the mean total length was determined. Additionally, the average length-frequency distribution was determined and visualized (Figure 12) for most of the species of which the distribution was already analyzed in 2005 (De Maersschalck et al, 2006). Sole and herring were seldomly found in 2008 and were no longer considered; two species of sandeel (Ammodytes tobianus and Hyperoplus lanceolatus) on the other hand were found abundantly in 2008 and were incorporated in the analyses. Plaice Pleuronectes platessa
In 2008, the length of plaice ranged from 80-380mm. In autumn, individuals were considerably larger than in spring (mean 218mm versus 180mm). The 0 and 1+ year classes were of equal importance in spring, but the 1+ year class was more abundant in autumn. Significant differences between top samples and gully samples were observed in autumn (p=0.008), with the highest mean

Chapter 7. Soft substrate epifauna and demersal fish fauna 115
total length observed in the gullies (226mm vs 210mm on the tops). No differences were observed considering mean total length as a result of sampling zone in either of the seasons.
The length-frequency distributions of 2005 and 2008 show similar patterns, but there were higher densities of individuals of year class 1+ in autumn 2008 (length classes between 190 and 240mm). The increase of individuals of this particular size was visible in all stations (Figure 10), but was quite spectacular at station WT9. The differences between gullies and tops are consistent over the years.
0
0,5
1
1,5
2
2,5
3
WG1 WG2 WG3 WT1 WT2 WT3 WT4 WT5 WT6 WT7 WT8 WT9 WG2 WT1 WT2 WT3 WT4 WT5 WT6 WT7 WT8 WT9
2005 2008
#/10
00m²
density increase plaice length 190‐240mpm / autumn 2005‐2008
Figure 10. Column chart showing the density of plaice (length 190-240mm) at all stations between years -
monitoring stations Thorntonbank, 2005 & 2008. Sprat Sprattus sprattus
In 2008, sprat was only caught in spring at lengths ranging between 80 and 13mm (mean 108mm – Dominant Size Class (=DSC) 90-100mm). No differences were observed considering mean total length as a result of sampling zone or position on a sandbank top or in a gully.
The length-frequency distributions of 2005 and 2008 show similar patterns, but there were higher densities of all size classes in spring 2005. The decrease in 2008 was visible in all stations, resulting in a virtual absence at the gully stations and very low densities at the top stations WG2, WT2 and WT5. Dab Limanda limanda
The individuals of dab caught in 2008 had lengths of 40-350mm (1 extreme of 70cm in spring 2005 at WT3), with averages in spring and autumn of 141 and 118mm. The length-frequency distribution in spring showed 1 density peak at 130-140mm, while the distribution of autumn had a bimodal shape representing year class 0 (DSC 70-80mm) and year class 1+ (DSC 170-180mm). No differences were observed considering mean total length as a result of sampling zone or position on a sandbank top or in a gully.
The length-frequency distributions of 2005 and 2008 showed some differences:
- Whereas the year classes in 2005 were clearly separated in 2005, they formed one single
curve in 2008 showing higher densities of larger individuals. This might be the result of the difference in sampling dates (end of February in 2005, half of March in 2008).
- In autumn 2008, the year class 0 was much more important than in 2005, with densities per size class that were up to five times higher. Within the length range of 50-110mm (Figure 11), this increase in densities was mainly due to changes at stations WT7 and WT9 (gully stations of the ECZ).

S. Vandendriessche, K. Hostens & J. Wittoeck 116
0
2
4
6
8
10
12
14
16
WG1 WG2 WG3 WT1 WT2 WT3 WT4 WT5 WT6 WT7 WT8 WT9 WG2 WT1 WT2 WT3 WT4 WT5 WT6 WT7 WT8 WT9
2005 2008
#/10
00m²
density increase dab length 50‐110mm / autumn 2005‐2008
Figure 11. Column chart showing the density of dab (length 50-110mm) at all stations between years -
monitoring stations Thorntonbank, 2005 & 2008. Solenette Buglossidium luteum
In 2008, very little variation was observed in length (range 600-130mm), with average lengths of 103mm in spring and 102mm in autumn. The length-frequency distributions of both seasons are very similar in shape, with higher densities per size class in autumn. The dominant size class was the one of 100-110mm for both seasons. No differences were observed considering mean total length between the zones and between tops and gullies.
In spring samples of 2005 and 2008, similar densities of solenette were observed, but the DSC shifted from 80-90mm in 2005 to 100-110mm in 2008. In autumn, the DSC stayed the same, but densities ware considerably higher per size class in 2008 (mainly station WT9). Reticulated dragonet Callionymus reticulatus
The mean lengths of the reticulated dragonet were very similar in both seasons (92mm in spring, 96mm in autumn. The length-frequency curve showed the same shape, with a DSC of 90-100mm in both seasons. No differences were observed considering mean total length as a result of sampling position or zone.
While the shape of the length-frequency distribution remained, the densities per size class were reduced by half in 2008 compared to 2005. This reduction was most pronounced in the NE gully samples WT3, WT6 and WT9, while top samples showed similar densities per size class. Scaldfish Arnoglossus laterna
The length of scaldfish in 2008 ranged from 40 to 150mm, with averages of 110mm in spring and 108mm in autumn. In both seasons, two year classes could be distinguished based on the length-frequency data, with dominant size classes of 70-80mm and 120-130mm. In both seasons, the year class 1+ showed the highest densities per length class. No differences were observed considering mean total length as a result of sampling position or zone.
The same two year classes were also observed in both seasons of 2005. The year class 0, however, was more pronounced in autumn 2008 than in 2005. Generally, the densities per year class were higher in autumn 2008. For the length interval 60-90mm, increases were observed in all stations. For length class 120-130mm, however, increases could be attributed to observed changes at stations WT3 and WT9 (NE gully stations of the TRZ and the ECZ). Dragonet Callionymus lyra
The length of dragonet in 2008 ranged from 70 to 250mm, with averages of 148mm in spring and 129mm in autumn. One density peak of small juveniles (DSC 100-110mm) was observed in spring; the curve from autumn was bimodal with density peaks at the length classes of 100-110mm and 160-170mm. No differences were observed considering mean total length as a result of sampling position or zone.
While the patterns of the length-frequency distribution and the position of the DSC‘s remained, the densities per size class were reduced in spring 2008 and were higher in autumn 2007 (especially concerning the youngest year class). These changes were seen at all stations with a similar intensity.

Chapter 7. Soft substrate epifauna and demersal fish fauna 117
0
0,02
0,04
0,06
0,08
0,1
0,12
0,14
0,16
50 70 90 110
130
150
170
190
210
230
250
270
290
310
330
350
370
#/10
00m²
Pleuronectes platessa
2005 autumn 2005 spring
50 70 90 110
130
150
170
190
210
230
250
270
290
310
330
350
370
Pleuronectes platessa
2008 autumn 2008 spring
0
0,5
1
1,5
2
2,5
3
3,5
4
4,5
30 40 50 60 70 80 90 100
110
120
130
140
150
#/10
00m²
Sprattus sprattus
30 40 50 60 70 80 90 100
110
120
130
140
150
Sprattus sprattus
0
0,2
0,4
0,6
0,8
1
1,2
30 50 70 90 110
130
150
170
190
210
230
250
270
290
310
330
350
#/10
00m²
Limanda limanda
30 50 70 90 110
130
150
170
190
210
230
250
270
290
310
330
350
Limanda limanda
0
0,2
0,4
0,6
0,8
1
1,2
1,4
1,6
1,8
50 60 70 80 90 100
110
120
130
140
150
#/10
00m²
Buglossidium luteum
50 60 70 80 90 100
110
120
130
140
150
Buglossidium luteum
0
0,2
0,4
0,6
0,8
1
1,2
1,4
30 40 50 60 70 80 90 100
110
120
130
140
150
#/10
00m²
length (mm)
Callionymus reticulatus
30 40 50 60 70 80 90 100
110
120
130
140
150
length (mm)
Callionymus reticulatus

S. Vandendriessche, K. Hostens & J. Wittoeck 118
0
0,02
0,04
0,06
0,08
0,1
0,12
0,14
0,16
0,18
0,2
30 40 50 60 70 80 90 100
110
120
130
140
150
160
#/10
00m²
Arnoglossus laterna
2005 autumn 2005 spring
30 40 50 60 70 80 90 100
110
120
130
140
150
160
Arnoglossus laterna
2008 autumn 2008 spring
0
0,2
0,4
0,6
0,8
1
1,2
1,4
30 40 50 60 70 80 90 100
110
120
130
140
150
160
170
180
190
200
210
220
230
240
250
#/10
00m²
Callionymus lyra
30 40 50 60 70 80 90 100
110
120
130
140
150
160
170
180
190
200
210
220
230
240
250
Callionymus lyra
0
0,05
0,1
0,15
0,2
0,25
0,3
0,35
0,4
0,45
30 40 50 60 70 80 90 100
110
120
130
140
150
#/10
00m²
Agonus cataphractus
30 40 50 60 70 80 90 100
110
120
130
140
150
Agonus cataphractus
0
0,5
1
1,5
2
2,5
3
3,5
4
4,5
5
50 60 70 80 90 100
110
120
130
140
150
160
170
180
190
200
#/10
00m²
Trachurus trachurus
50 60 70 80 90 100
110
120
130
140
150
160
170
180
190
200
Trachurus trachurus
0
0,1
0,2
0,3
0,4
0,5
0,6
0,7
30 35 40 45 50 55 60 65 70 75 80 85
#/10
00m²
length (mm)
Pomatoschistus minutus
30 35 40 45 50 55 60 65 70 75 80 85
length (mm)
Pomatoschistus minutus

Chapter 7. Soft substrate epifauna and demersal fish fauna 119
0
0,2
0,4
0,6
0,8
1
1,2
1,4
1,6
30 40 50 60 70 80 90 100
110
120
130
140
150
160
170
180
190
200
#/10
00m²
Echiichthys vipera
2005 autumn 2005 spring
30 40 50 60 70 80 90 100
110
120
130
140
150
160
170
180
190
200
Echiichthys vipera
2008 autumn 2008 spring
0
0,05
0,1
0,15
0,2
0,25
30 35 40 45 50 55 60 65 70 75 80 85
#/10
00m²
Pomatoschistus lozanoi
30 35 40 45 50 55 60 65 70 75 80 85
Pomatoschistus lozanoi
0
0,2
0,4
0,6
0,8
1
1,2
1,4
1,6
1,8
2
70 80 90 100
110
120
130
140
150
160
170
#/10
00m²
Trisopterus minutus
70 80 90 100
110
120
130
140
150
160
170
Trisopterus minutus
0
0,02
0,04
0,06
0,08
0,1
0,12
100
110
120
130
140
150
160
170
180
190
200
210
220
230
#/10
00m²
Trisopterus luscus
100
110
120
130
140
150
160
170
180
190
200
210
220
230
Trisopterus luscus
0
0,01
0,02
0,03
0,04
0,05
0,06
0,07
0,08
0,09
130
140
150
160
170
180
190
200
210
220
230
240
250
260
270
280
290
300
310
320
330
#/10
00m²
length (mm)
Merlangius merlangus
130
140
150
160
170
180
190
200
210
220
230
240
250
260
270
280
290
300
310
320
330
length (mm)
Merlangius merlangus

S. Vandendriessche, K. Hostens & J. Wittoeck 120
0
0,005
0,01
0,015
0,02
0,025
0,03
120
130
140
150
160
170
180
190
200
210
220
230
240
250
260
270
280
290
300
310
320
#/10
00m²
Hyperoplus lanceolatus
2005 autumn 2005 spring
120
130
140
150
160
170
180
190
200
210
220
230
240
250
260
270
280
290
300
310
320
Hyperoplus lanceolatus
2008 autumn 2008 spring
0
0,01
0,02
0,03
0,04
0,05
0,06
0,07
0,08
0,09
120
130
140
150
160
170
180
190
200
210
220
230
#/10
00m²
length (mm)
Ammodytes tobianus
120
130
140
150
160
170
180
190
200
210
220
230
length (mm)
Ammodytes tobianus
Figure 12. Averaged length-frequency distributions (all fish tracks) of 17 fish species - monitoring stations
Thorntonbank, 2005 & 2008.
Hooknose Agonus cataphractus The lengths of hooknose in 2008 varied between 70 and 120mm, with mean lengths of 90 and
112mm in spring and autumn. Very low densities were observed per size class (max 0.05 Ind/1000m²); the dominant size classes were the one of 90-100mm in spring and 110-120mm in autumn.
The observed densities in 2008 were considerably lower than in 2005, especially in spring. Additionally, the individuals were generally larger (DSC 70-80mm in 2005; 90-100mm in 2008). This reduction was visible at all stations, resulting in low density values in gully samples and a virtual absence of this species in the top samples.
Horse mackerel Trachurus trachurus
Horse mackerel was only found in fish tracks in autumn, with a length range of 60-150mm (average 107mm). No differences were observed considering mean total length as a result of sampling position or zone. When comparing 2005 and 2008, the length range and the pattern in length-frequency are quite similar, except for the lower densities per size class observed in 2008 (up to 10 times lower). This reduction in density was most pronounced at stations WT1, WT4 and especially WG2 (Figure 13).

Chapter 7. Soft substrate epifauna and demersal fish fauna 121
0
10
20
30
40
50
60
70
80
WG1WG2WG3WT1WT2WT3WT4WT5WT6WT7WT8WT9WG2WT1WT2WT3WT4WT5WT6WT7WT8WT9
2005 2008
#/10
00m²
density decrease horse mackerel length 100‐130mm / autumn 2005‐2008
Figure 13. Column chart showing the density of horse mackerel (length 100-130mm) at all stations between
years - monitoring stations Thorntonbank, 2005 & 2008. Sand goby Pomatoschistus minutus
The sand goby Pomatoschistus minutus showed a length rage of 45-80mm in 2008, with an average of 66mm in spring and 61mm in autumn. The DSC was 70-75mm in autumn and 60-65mm in spring. No differences were observed considering mean total length as a result of sampling position or zone. The observed patterns showed very little changes over de years, except for a small decrease in length towards 2008 (average 61mm compared to 65mm in 2005). Lesser weever Echiichthys vipera
The total length of the lesser weever varied between 60 and 180mm in 2008, with a mean length of 118mm in spring and 111mm in autumn. The dominant size class evolved from 120-130mm in spring to 110-120mm in autumn. The densities per size class were two to three times higher in autumn than in spring. There were no obvious differences between the investigated zones. However, differences between top samples and gully samples appeared significant in autumn (p:0.03): the mean total length was 12mm higher in gully samples (mean 117mm) compared to top samples (mean 105mm).
The length-frequency distributions from 2005 and 2008 showed similar shapes, but the spring densities per size class doubled in 2008. This density increase (especially at 100-140mm length) was most pronounced in the TRZ (WT1-3) and the WCZ (WT4-6) (Figure 14). Lozano’s goby Pomatoschistus lozanoi
This species showed a length rage of 30-65mm in 2008, with an average of 55mm in spring and 50mm in autumn. The DSC was 50-55mm in autumn and 55-60mm in spring. No differences were observed considering mean total length as a result of sampling position or zone. The observed patterns showed very little changes over de years, except for a density decrease in the length classes between 45 and 65mm in autumn. While Lozano’s goby was quite abundant in the ECZ in 2005 (51-60 Ind/1000m²), and especially in the gullies, almost no individuals were found in this zone in 2008 (0-45 Ind/m²).

S. Vandendriessche, K. Hostens & J. Wittoeck 122
0
0,5
1
1,5
2
2,5
3
3,5
4
4,5
WG1WG2WG3WT1WT2WT3WT4WT5WT6WT7WT8WT9WG2WT1WT2WT3WT4WT5WT6WT7WT8WT9
2005 2008
#/10
00m²
density increase lesser weever length 100‐140mm / spring 2005‐2008
Figure 14. Column chart showing the density of lesser weever (length 100-140mm) at all stations between years
- monitoring stations Thorntonbank, 2005 & 2008.
Poor cod Trisopterus minutus and bib Trisopterus luscus Poor cod was almost exclusively found in autumn of both years. Length in 2008 ranged from 90-
170mm, with an average length of 105mm in autumn and a DSC of 110-120mm. The DSC’s of both years were identical, but densities per size class were about 10 times higher in 2008. This is solely the result of extremely high numbers observed at station WT7 in autumn 2008 (64 Ind/1000m² for individuals of 90-150mm in length).
In 2008, bib was caught at length of 100-210mm, with a DSC of 170-180mm in autumn. In 2005, two year classes could be distinguished (DSC: 120-130mm and 170-180mm) from catches at stations WG1, WG3 and WT7. In 2008, bib was only caught at station WT7 and these individuals mainly belonged to year class 1+.
Whiting Merlangius merlangus
The total length of whiting varied between 150 and 300mm, with a mean length of 217mm in spring and 220mm in autumn. In spring, larger juveniles were caught (DSC 190-200mm & 240-250mm). In autumn, the densities of whiting were much lower and the individuals were either small (140-190mm) or rather large (270-290mm). This is a totally different picture than the one observed in 2005, in which whiting was most abundant in autumn and the fraction of smaller individuals (140-180mm) was more important in spring. In autumn 2008, whiting was caught in low densities at only 3 stations (WT3-6-9), while this species was abundantly found in all gully stations in 2005. The changes in year class strengths between years were best observed at stations WT1-2-3-5-6-7-9.
Sandeels Hyperoplus lanceolatus and Ammodytes tobianus
The great sandeel H. lanceolatus showed a length range of 12-320mm. Mean length was slightly higher in autumn compared to spring (232 vs. 227mm). The length frequency distribution was rather discontinuous but three density peaks can roughly be distinguished in both seasons (at the size classes of 160-170mm, 220-230mm and 280-290mm in spring; at 190-200mm, 250-260mm and 280-290mm in autumn). No differences were observed considering mean total length as a result of sampling zone or position. Since the length-frequency distribution showed no distinguishable patterns in 2005 due to low densities (half of the ones observed in 2008) and low frequency of occurrence, no straightforward comparison between the years could be made.
The sandeel A. tobianus was caught at lengths ranging from 120 to 200mm, with average lengths of 162 and 173mm in spring and autumn of 2008. The DSC for both seasons was the one of 170-180mm, which is 10mm larger than the DSC observed in 2005. Autumn densities per size class were higher in 2008, but the most striking difference between the years is the abundance of sandeels in spring 2008 compared to their scarcity in spring 2005. In spring 2005, sandeels were found at 2 stations only (WG3 and WT7). In 2008, seven stations harbored sandeels, with highest densities in the TRZ and the WCZ.

Chapter 7. Soft substrate epifauna and demersal fish fauna 123
7.4.5.2. Bligh Bank (Belwind concession): condition in 2008
For all fish species, the mean total length was determined. Additionally, the average length-frequency distribution was determined and visualized for the ten species with the overall highest densities and frequencies of occurrences (Figure 15).
The total length of the lesser weever Echiichtys vipera varied between 40 and 170mm, with a mean length of 111mm in spring and 107mm in autumn. Two length groups were distinguishable in both spring and autumn (spring: 40-60mm & 80-160mm; autumn: 60-80mm & 90-170mm). There were no obvious differences between the concession zone and the reference zones. However, differences between top samples and gully samples appeared significant in both spring and autumn (p:0.02 & 0.01, respectively): the mean total length was generally higher in gully samples (mean 114mm in spring, 112mm in autumn) compared to top samples (mean 105mm in spring, 92mm in autumn).
The total length of dab Limanda limanda varied between 50 and 320mm, with a mean length of 139mm in spring and 146mm in autumn. In spring, individuals from year class 0 were rare and most individuals belonged to year class 1 (DSC 120-130mm). Older fish reached a maximum size of 310mm. In autumn, year class 0 was more important than in spring (DSC 70-80mm), and the DSC of year class 1 was 120-130mm. Older fish reached a maximum size of 320mm. No differences were observed considering mean total length as a result of sampling position or zone.
The total length of whiting Merlangius merlangus varied between 140 and 320mm, with a mean length of 184mm in spring and 190mm in autumn. In spring, larger juveniles were caught (DSC 210-22mm & 230-240mm). In autumn, the densities of whiting were much lower but the individuals were about 60mm larger than in spring (DSC 270-280mm). The maximum encountered length increased from 300mm in spring to 320mm in autumn. No differences were observed considering mean total length as a result of sampling zone. Whiting was almost exclusively found in gully samples.
Dragonets Callionymus lyra were caught at sizes ranging from 60-250mm, with average values of 97mm in spring and 88mm in autumn. The first and second year classes were present in both seasons, but the bimodal pattern was best discerned in autumn due to higher densities. The dominant size classes for both size groups were identical in spring and autumn (year class 0: 90-100mm; year class 1: 160-170mm). This species was only found in gully samples of the investigated zones; no differences were observed considering mean total length between the zones.
Solenette Buglossidium luteum caught in the Bligh Bank monitoring area showed very little variation in length (range 70-130mm), with average lengths of 65mm in spring and 77mm in autumn. The length-frequency distributions of both seasons are very similar in shape, with higher densities per size class in autumn. The dominant size class was the one of 100-110mm for both seasons. Solenette was only found in gully samples of the investigated zones; no differences were observed considering mean total length between the zones.
In autumn, individuals of the species plaice Pleuronectes platessa were considerably larger compared to individuals observed in spring (mean 238mm versus 179mm). In spring, mainly juveniles at the end of their first year were caught (DSC 150-160mm). Older individuals reached lengths of max. 330mm. In autumn, the length-frequency-distribution shifted about 80mm to the right (DSC 130-240mm), with higher densities per size class than in spring. Larger individuals attained lengths of about 300mm, with some outliers of up to 440mm. No differences were observed considering mean total length as a result of sampling position or zone.
The mean lengths of the reticulated dragonet C. reticulatus (92mm in spring, 85mm in autumn) were very similar to the ones found for C. lyra, but the reticulated dragonet showed maximum values of only 120-140mm compared to 230-250mm for C. lyra. In autumn, higher densities of small individuals were recorded (DSC 70-80mm) than in spring (DSC 90-100mm). No differences were observed considering mean total length as a result of sampling position or zone.
The sand goby Pomatoschistus minutus showed a length rage of 45-75mm, with an average of 66mm in spring and 58mm in autumn. Total densities per fish track were similar in spring and autumn, but the frequency of occurrence was higher in autumn (all autumn samples , only in 5 spring samples). The DSC was 55-60mm in autumn, which is slightly lower than the DSC in spring (60-65mm). No differences were observed considering mean total length as a result of sampling position or zone.

S. Vandendriessche, K. Hostens & J. Wittoeck 124
Poor cod Trisopterus minutus was only found in fish tracks from gully stations, with the highest frequency of occurrence in autumn. The dominant size classes were 100-110mm and 140-150mm for autumn and spring, respectively. Only in autumn, a clear unimodal curve could be distinguished.
The great sandeel Hyperoplus lanceolatus was found in all samples, with a length range of 90-380mm. Mean length was higher in autumn compared to spring (267 vs. 234mm). In spring, three density peaks could be distinguished at the size classes of 160-170mm, 210-220mm and 290-300mm. The length-frequency distribution from autumn samples was rather discontinuous, with 3 density peaks at 200-210mm, 230-240mm and 310-320mm. No differences were observed considering mean total length as a result of sampling zone. In autumn, there was a significant difference concerning length between top samples and gully samples (p= 0.01; mean length gullies 277mm, mean length tops 239mm).

Chapter 7. Soft substrate epifauna and demersal fish fauna 125
0
1
2
3
4
5
6
30 40 50 60 70 80 90 100
110
120
130
140
150
160
170
180
190
200
#/10
00m²
Echiichthys vipera
autumn spring
0
0,1
0,2
0,3
0,4
0,5
0,6
0,7
0,8
0,9
1
30 50 70 90 110
130
150
170
190
210
230
250
270
290
310
#/10
00m²
Limanda limanda
0
0,1
0,2
0,3
0,4
0,5
0,6
0,7
0,8
100
120
140
160
180
200
220
240
260
280
300
320
#/10
00m²
Merlangius merlangus
0
0,1
0,2
0,3
0,4
0,5
0,6
0,7
0,8
0,9
30 50 70 90 110
130
150
170
190
210
230
250
270
290
#/10
00m²
Callionymus lyra
0
0,1
0,2
0,3
0,4
0,5
0,6
30 40 50 60 70 80 90 100
110
120
130
140
150
#/10
00m²
length (mm)
Buglossidium luteum
0
0,05
0,1
0,15
0,2
0,25
110
130
150
170
190
210
230
250
270
290
310
330
350
370
390
410
430
#/10
00m²
Pleuronectes platessa
autumn spring
0
0,05
0,1
0,15
0,2
0,25
0,3
30 40 50 60 70 80 90 100
110
120
130
140
150
160
170
180
190
200
#/10
00m²
Callionymus reticulatus
0
0,05
0,1
0,15
0,2
0,25
0,3
0,35
0,4
0,45
30 35 40 45 50 55 60 65 70 75 80
#/10
00m²
Pomatoschistus minutus
0
0,1
0,2
0,3
0,4
0,5
0,6
0,7
30 40 50 60 70 80 90 100
110
120
130
140
150
160
170
180
190
200
#/10
00m²
Trisopterus minutus
0
0,01
0,02
0,03
0,04
0,05
0,06
0,07
30 50 70 90 110
130
150
170
190
210
230
250
270
290
310
330
350
370
390
#/10
00m²
length (mm)
Hyperoplus lanceolatus
Figure 15. Averaged length-frequency distributions (all fish tracks) of 10 fish species - monitoring stations
Bligh Bank, 2008.

S. Vandendriessche, K. Hostens & J. Wittoeck 126
7.4.6. Epibenthos: density
7.4.6.1. Thortonbank (C-power) and Bligh Bank (Belwind concession): condition in 2008
In 2008, the total epibenthos densities were generally higher (> twice) in autumn than in spring in most zones on the Thorntonbank (Table 11). The seasonal difference was even more pronounced on the Bligh Bank, with very low densities in spring in all zones (on average only 4 ind/1000m² in spring vs. 24 ind/1000m² in autumn).
Per season, the densities were comparable between both the Western Concession Zone (WCZ) and Eastern Concession Zone (ECZ) on the Thorntonbank (Figure 16). While densities were comparable between the WCZ and its gullies per season, the values from the gullies at the ECZ were on average five times higher than the values observed within (i.e. on top of) the ECZ. In the Thorntonbank reference zone (TRZ), densities were comparable between the top and the gullies of the bank in spring (like in the WCZ), but three times higher in the gullies than the top in autumn (like in the ECZ). For the Bligh Bank, the density values were on average six times higher in the border and gullies than on the top of both concession zone (BCZ) and reference zones on the Bligh Bank (BRZ) and Hinderbanken (HRZ) in both seasons (Table 14).
In spring 2008, the dominant taxonomic groups were shrimps (Caridea, 75%) and echinoderms (Echinodermata, 15%) for both WCZ and ECZ (Table 12, Figure 16). This was also the case in the gullies of both zones, except for the NW gully of ECZ where shrimps were almost completely replaced by hermit crabs (Anomura, 80%). In the gullies around the TRZ, shrimps, echinoderms and hermit crabs were equally abundant.
In autumn 2008, shrimps were less dominant (on average 10%) and comparable with the presence of brachyuran crabs (9%), while the dominant species groups were echinoderms (40%) and hermit crabs (30%) in both concession zones, their neighboring gullies and the reference zones on the Thorntonbank (Table 13, Figure 16). A higher percentage of other species (mainly cephalopods and bivalve mollusks) were noted in autumn in almost all subzones.
On the top of the Goote Bank reference zone (GRZ), echinoderms dominated the epibenthos in both seasons, which is (at least for spring) quite different from the TRZ or the concession zones.
For the Bligh Bank and Hinderbanken, there was a clear dominance of echinoderms (on average 40%) and hermit crabs (40%) in all subzones in both seasons, although it should be stressed again that the tops of these zones were almost void of epibenthic life in spring 2008 (Table 14, Figure 16). Brachyuran crabs (10%), bivalves and cephalopods (the latter mainly in autumn) followed as important groups in most subzones, while caridean shrimps were virtually absent in 2008 in any subzone of the Bligh Bank.
Only few species contributed to the overall density values, i.e. Crangon crangon (mainly in spring in all locations) for the Caridea; Ophiura albida and to a lesser extent Ophiura ophiura (both at higher densities in autumn) for the Echinodermata; Pagurus bernhardus (higher densities in autumn, with exceptionally high densities in spring in the NW gully of the eastern concession zone) for the Anomura; Liocarcinus holsatus (mainly in autumn) for the Brachyura; Alloteuthis subulata (only in autumn in all samples) for Cephalopoda; and several Spisula species (mainly in autumn in the NW gullies) for the Bivalvia.
7.4.6.2. Thorntonbank (C-power concession): comparison 2005 - 2008
Some general trends for the epibenthos remained quite similar in both years when comparing the different zones of the Thorntonbank monitoring area (Thorntonbank references zone, eastern and western concession zone and Goote Bank reference zone) per season:
- The densities in de WCZ were only a little higher than in the ECZ - The densities were generally much higher in the gullies than on the tops in all zones, with
the exception of the SE gully of the WCZ. - The densities were generally higher in the NW gullies in all zones and seasons - The main species composition and the most abundant species remained the same,
although in different proportions.

Chapter 7. Soft substrate epifauna and demersal fish fauna 127
In 2005 the epibenthos densities decreased from spring towards autumn, while in 2008 the opposite was true in almost all subzones (Figure 16). When comparing the total epibenthos densities per season between the years 2005 and 2008, the spring densities were significantly higher in 2005 (40 ind/1000m²) vs. 2008 (15 ind/1000m²). The densities were 2 to 5 times lower in 2008, which was most outspoken in the TRZ and in the gullies, and to a lesser extent on the top in the western concession zone. The reduction was not necessarily due to one group, but was seen in almost all taxonomic groups, with the common crab species Liocarcinus holsatus almost absent in the spring 2008 hauls.
In contrast to the spring situation, the total autumn densities were significantly higher in 2008 (34 ind/1000m²) vs. 2005 (12 ind/1000m²). The densities were 2 to 5 times higher in 2008, both in the gullies as on the tops of both concession and reference zones. This difference was mostly due to higher densities of hermit crabs and echinoderms in autumn 2008; caridean shrimps and brachyuran crabs were only present in low numbers in autumn of both years. Table 11 Overview of the mean density of the epibenthos per taxonomic group for the examined years and seasons – monitoring stations Thorntonbank and Bligh Bank.
Season Zone mean density mean density per taxonomic group (#/1000m²)
#/1000m² Anomura Brachyura Caridea Echinodermata Bivalvia Cephalopoda Gastropoda other thornton 2005 40 4.6 6.2 18.0 11.3 <0.1 <0.1 <0.1 <0.1 thornton 2008 15 5.9 0.6 5.5 2.5 <0.1 <0.1 <0.1 <0.1 spring
Bligh Bank2008 4 1.3 0.5 0.1 1.4 0.6 <0.1 <0.1 <0.1 thornton 2005 13 0.7 3.8 1.5 5.2 0.3 1.1 0.4 <0.1
thornton 2008 35 8.7 2.4 1.9 17.2 1.5 1.3 1.8 <0.1 autumn
Bligh Bank2008 24 8.9 2.9 <0.1 9.9 1.5 0.7 0.1 <0.1
Table 12 Overview of the density of the epibenthos per station and per taxonomic group – monitoring stations Thorntonbank, spring 2005 & 2008.
Thorntonbank/Goote Bank Spring 2005 Area Zone Station spring density spring density per taxonomic group (#/1000m²)
#/1000m² Anomura Brachyura Caridea Echinodermata Bivalvia Cephalopoda Gastropoda other SE gully WT1 24 5.3 0.3 4.2 12.5 0.3 - 1.5 -
top WT2 18 3.3 0.4 3.7 10.3 - - - - Ref Th NW gully WT3 69 8.9 7.6 28.0 23.7 0.3 - - 0.2 SE gully WT4 6 1.7 0.8 2.8 0.9 - <0.1 - -
top WT5 15 2.3 0.6 4.1 7.8 - - - - West Conc
NW gully WT6 66 5.7 21.4 31.1 7.6 0.1 - - - SE gully WT7 90 8.3 20.4 48.7 12.2 0.2 0.1 - 0.1
top WT8 5 1.9 0.5 1.5 1.1 - - - - East Conc
NW gully WT9 72 3.5 4.3 37.7 26.0 0.1 <0.1 0.1 - top WG2 33 2.0 0.5 11.5 19.4 - - <0.1 -
SE gully WG1 79 7.2 1.3 30.9 38.1 0.7 - 0.2 0.3 Ref Gb
NW gully WG3 382 2.8 1.6 17.5 359.4 - - - 0.9
Thorntonbank/Goote Bank Spring 2008 Area Zone Station spring density spring density per taxonomic group (#/1000m²)
#/1000m² Anomura Brachyura Caridea Echinodermata Bivalvia Cephalopoda Gastropoda other SE gully WT1 6 1.3 0.6 1.8 1.8 0.2 - - -
top WT2 5 0.6 0.1 3.9 0.9 - - - - Ref Th NW gully WT3 13 6.1 0.5 2.5 2.6 0.9 - 0.1 - SE gully WT4 5 0.6 <0.1 3.2 0.9 - 0.1 - -
top WT5 9 0.8 0.1 6.9 1.0 0.1 - - - West Conc
NW gully WT6 13 1.4 0.2 9.2 1.5 0.3 <0.1 0.1 <0.1 SE gully WT7 28 3.3 2.0 16.0 6.5 0.5 - - -
top WT8 7 0.3 0.1 4.9 1.3 <0.1 - 0.1 - East Conc
NW gully WT9 48 38.6 1.4 0.7 6.1 0.6 <0.1 0.4 <0.1 Ref Gb top WG2 18 0.5 0.3 1.9 15.2 0.1 - - -

S. Vandendriessche, K. Hostens & J. Wittoeck 128
Table 13 Overview of the density of the epibenthos per station and per taxonomic group – monitoring stations Thorntonbank, autumn 2005 & 2008.
Thorntonbank/Goote Bank Autumn 2005 Area Zone Station autumn density autumn density per taxonomic group (#/1000m²)
#/1000m² Anomura Brachyura Caridea Echinodermata Bivalvia Cephalopoda Gastropoda other SE gully WT1 14 0.9 1.3 0.5 6.6 0.5 1.4 2.8 <0.1
top WT2 8 0.5 2.2 0.8 3.1 0.1 0.7 0.1 - Ref Th NW gully WT3 23 1.5 2.8 1.2 16.2 0.6 0.9 0.1 - SE gully WT4 4 0.1 1.2 1.3 - - 1.1 - -
top WT5 8 0.3 3.6 2.3 0.8 0.1 1.1 - - West Conc
NW gully WT6 13 1.1 3.7 0.7 6.0 0.5 0.8 - <0.1 SE gully WT7 11 0.5 2.5 2.8 3.8 <0.1 1.4 0.2 0.3
top WT8 6 0.6 1.9 0.1 0.8 0.1 1.9 <0.1 - East Conc
NW gully WT9 30 0.5 15.0 4.0 9.4 0.5 0.9 - <0.1 top WG2 5 0.4 0.8 0.1 1.8 <0.1 2.1 <0.1 -
SE gully WG1 15 1.9 0.7 0.5 8.7 0.1 1.7 0.6 0.4 Ref Gb
NW gully WG3 20 0.5 0.8 <0.1 16.4 <0.1 1.7 0.1 0.3
Thorntonbank/Goote Bank Autumn 2008 Area Zone Station autumn density autumn density per taxonomic group (#/1000m²)
#/1000m² Anomura Brachyura Caridea Echinodermata Bivalvia Cephalopoda Gastropoda other SE gully WT1 31 8.9 1.3 0.2 15.8 0.2 3.6 0.6 <0.1
top WT2 10 2.1 1.1 1.2 4.8 0.2 0.8 - - Ref Th NW gully WT3 40 8.3 2.5 0.8 21.0 6.7 0.8 - - SE gully WT4 9 2.9 1.2 0.9 2.5 0.1 1.9 - -
top WT5 14 4.2 1.2 2.3 5.0 0.3 1.2 - - West Conc
NW gully WT6 21 8.5 1.5 1.9 6.6 0.8 1.0 0.4 - SE gully WT7 49 16.8 4.4 1.6 25.0 0.2 0.9 0.4 -
top WT8 19 5.6 1.7 2.7 7.6 - 0.9 0.1 - East Conc
NW gully WT9 120 21.1 6.4 5.8 66.3 5.2 0.5 15.0 - Ref Gb top WG2 25 3.5 0.8 0.9 15.6 0.2 3.2 0.2 -
Table 14 Overview of the density of the epibenthos per station and per taxonomic group – monitoring stations Bligh Bank, spring and autumn 2008.
Bligh Bank/Hinderbanken Spring 2008 Area Zone Station spring density spring density per taxonomic group (#/1000m²)
#/1000m² Anomura Brachyura Caridea Echinodermata Bivalvia Cephalopoda Gastropoda other SE gully WBB01 3 1.4 1.1 0.2 0.3 0.3 0.0 0.1 -
top WBB02 1 0.3 <0.1 0.3 0.1 - - - - Ref BB
NW gully WBB03 9 1.1 1.3 0.1 1.9 3.6 0.2 - 0.4 BBR SE border WBB04 6 4.2 0.5 <0.1 1.0 0.4 <0.1 0.1 -
SE gully WBB05 3 2.1 <0.1 - 1.1 0.1 - 0.1 - top WBB06 1 0.2 - 0.2 0.3 - - - - BCZ
NW gully WBB07 5 0.6 0.6 - 3.9 0.2 - - 0.1 BBR NW border WBB08 4 0.9 0.3 - 2.4 0.6 <0.1 - 0.1
SE gully WOH01 15 2.8 0.7 <0.1 9.7 1.3 0.1 - 0.2 top WOH02 <1 0.2 <0.1 0.1 0.1 - - - -
Ref HB
NW gully WOH03 3 0.8 0.1 - 1.9 - - - -
Bligh Bank/Hinderbanken Autumn 2008 Area Zone Station autumn
density autumn density per taxonomic group (#/1000m²)
#/1000m² Anomura Brachyura Caridea Echinodermata Bivalvia Cephalopoda Gastropoda other SE gully WBB01 34 7.1 10.3 0.1 12.5 2.8 0.8 0.1 0.1
top WBB02 4 1.9 0.7 - 0.3 <0.1 0.8 0.1 <0.1 Ref BB
NW gully WBB03 34 7.1 1.9 <0.1 21.0 2.2 1.1 0.6 0.1 BBR SE border WBB04 37 18.7 4.7 0.2 9.8 2.7 0.8 0.1 0.1
SE gully WBB05 23 9.3 1.0 - 10.4 1.0 0.8 0.2 <0.1 top WBB06 4 1.9 0.5 0.1 1.0 0.1 0.2 - - BCZ
NW gully WBB07 30 14.0 2.1 - 11.7 1.6 0.3 - - BBR NW border WBB08 28 11.0 1.8 - 12.9 1.6 0.7 0.1 0.1
SE gully WOH01 62 15.4 3.8 0.2 38.9 2.7 0.6 0.3 0.1 top WOH02 7 3.6 1.0 - 1.6 0.7 0.3 0.1 0.1
Ref HB
NW gully WOH03 28 13.3 1.7 - 10.7 1.5 0.4 0.4 -

Chapter 7. Soft substrate epifauna and demersal fish fauna 129
0
10
20
30
40
50
60
70
80
90
WT1 WT2 WT3 WT4 WT5 WT6 WT7 WT8 WT9 WG2
SE gully
top NW gully
SE gully
top NW gully
SE gully
top NW gully
top
Ref Th West Conc East Conc Ref Gb
density (#/1000m²)
T0 ‐ Spring 2005 Thorntonbank
0102030405060708090
WT1 WT2 WT3 WT4 WT5 WT6 WT7 WT8 WT9 WG2
SE gully
top NW gully
SE gully
top NW gully
SE gully
top NW gully
top
Ref Th West Conc East Conc Ref Gb
T1 ‐ Spring 2008 Thorntonbank
0
10
20
30
40
50
60
70
80
90
WT1 WT2 WT3 WT4 WT5 WT6 WT7 WT8 WT9 WG2
SE gully top NW gully
SE gully top NW gully
SE gully top NW gully
top
Ref Th West Conc East Conc Ref Gb
density (#/1000m²)
T0 ‐ Autumn 2005 Thorntonbankothers
Echinodermata
Caridea
Brachyura
Anomura
0102030405060708090
WT1 WT2 WT3 WT4 WT5 WT6 WT7 WT8 WT9 WG2
SE gully top NW gully
SE gully top NW gully
SE gully top NW gully
top
Ref Th West Conc East Conc Ref Gb
T1 ‐ Autumn 2008 Thorntonbankothers
Echinodermata
Caridea
Brachyura
Anomura
0102030405060708090
WBB01
WBB02
WBB03
WBB04
WBB05
WBB06
WBB07
WBB08
WOH01
WOH02
WOH03
SE gully
top NW gully
SE border
SE gully
top NW gully
NW border
SE gully
top NW gully
Ref BB BBR Conc BBR Ref HB
T0 ‐ Spring 2008 Blighbank
0102030405060708090
WBB01
WBB02
WBB03
WBB04
WBB05
WBB06
WBB07
WBB08
WOH01
WOH02
WOH03
SE gully top NW gully
SE border
SE gully top NW gully
NW border
SE gully top NW gully
Ref BB BBR Conc. BBR Ref HB
T0 ‐ Autumn 2008 Blighbank
others
Echinodermata
Caridea
Brachyura
Anomura
Figure 16. Column chart of densities of epibenthos per taxonomic group for all stations and zones - monitoring
stations Thorntonbank and Bligh Bank, spring (left) and autumn (right) 2005 & 2008.
7.4.7. Epibenthos: biomass
7.4.7.1. Thortonbank (C-Power) and Bligh Bank (Belwind concession): condition in 2008
The patterns in biomass were largely comparable with the patterns found in terms of density. The biomass values were higher in autumn 2008 (on average twice as high) compared to the spring values in almost all zones in and around the Thornton and Bligh Bank concession zones (Table 15). The biomass was usually higher (on average 3 times) in the gullies surrounding the concession zones than on top of (i.e. within) the concession zones. This difference was even more pronounced in spring 2008 as a very low epibenthos biomass was recorded on top of the BCZ, while in autumn 2008 the difference between top and gully was less clear for the WCZ on the Thornton bank. The biomass patterns in the reference zones are quite similar with the concession zones, with higher values in autumn, higher values in the gullies and very low values on top of the BRZ and HRZ in spring 2008 (as in BCZ).
In spring 2008, the dominant taxonomic groups were shrimps (80%) followed by echinoderms (10%) for both WCZ and ECZ (Table 16, Figure 17). This was also the case for the top of the TRZ and in the gullies around both concession zones, except for the NW gully of ECZ where shrimps were almost completely replaced by hermit crabs (Anomura, 60%). In the gullies around the TRZ, shrimps, echinoderms and hermit crabs showed almost the same biomass. On top of the GRZ, the importance

S. Vandendriessche, K. Hostens & J. Wittoeck 130
of shrimps and echinoderms was completely reversed when compared to the other top locations in spring.
For the Bligh Bank (including Hinderbanken locations), the image in spring 2008 was rather different from the one in the Thorntonbank and more comparable with the assemblage composition in autumn (Table 18, Figure 17). There was a clear dominance of echinoderms (on average 40%) followed by hermit crabs (20%) and brachyuran crabs (10%) in all subzones, and of bivalves (20%) in the gullies.
In autumn 2008, shrimps were almost absent on the Thorntonbank and completely absent from the Bligh Bank (Table 17, Figure 17). In terms of biomass, the most important groups were echinoderms (on average 30%), brachyuran crabs (25%) and hermit crabs (15%) in the concession zones, their neighboring gullies and the reference zones for the Thorntonbank and Bligh Bank. Also higher biomasses of bivalves and cephalopods (both 10 %) were registered in autumn for almost all deeper subzones.
7.4.7.2. Thorntonbank (C-Power concession): comparison 2005 - 2008
Some general trends in biomass were similar in both years. Per year and season, the biomass on the tops of the different zones (WCZ, ECZ, TRZ and GRZ) was quite comparable. In most cases, the biomass in the gullies was higher than on the tops of the different zones (Figure 17). The dominance of caridean shrimps in spring and the low biomass of this species in autumn was registered in both years.
In spring the overall epibenthos biomass was 3 times higher in 2005 (120 gWW/1000m²) vs. 2008 (40 gWW/1000m²), except for the SE gully of the WCZ where a much higher biomass value was noted for caridean shrimps in spring 2008. The main species composition largely remained the same. The lower biomass values in spring 2008 were noted for all species groups, but were most visible for the brachyuran crabs in almost all sampling locations.
In autumn the overall biomass was comparable between both years (65 gWW/1000m²), although for most locations in the gullies and on the tops of both concession and reference zones, a little lower biomass was noted in 2008. Differences in the assemblage composition were noted, with lower biomass values in autumn 2008 (vs. autumn 2005) for brachyuran crabs and bivalves, and higher biomasses for hermit crabs and echinoderms in almost all zones.
Table 15 Overview of the mean biomass of the epibenthos per taxonomic group for the examined years and seasons – monitoring stations Thorntonbank and Bligh Bank.
Season Zone mean biomass mean biomass per taxonomic group (gWW/1000m²)
gWW/1000m² Anomura Brachyura Caridea Echinodermata Bivalvia Cephalopoda Gastropoda other thornton 2005 123 7.6 57.8 40.5 16.2 0.2 <0.1 0.2 <0.1 thornton 2008 39 6.4 3.5 20.7 7.0 1.2 0.1 <0.1 <0.1 spring
Bligh Bank2008 22 2.4 2.7 0.2 6.0 9.3 0.8 <0.1 0.2 thornton 2005 64 1.2 35.4 2.4 6.3 1.2 16.9 0.7 0.1
thornton 2008 65 9.5 20.3 2.7 19.6 6.5 3.9 2.4 <0.1 autumn
Bligh Bank2008 48 8.6 9.7 <0.1 16.9 8.3 4.6 0.1 0.1
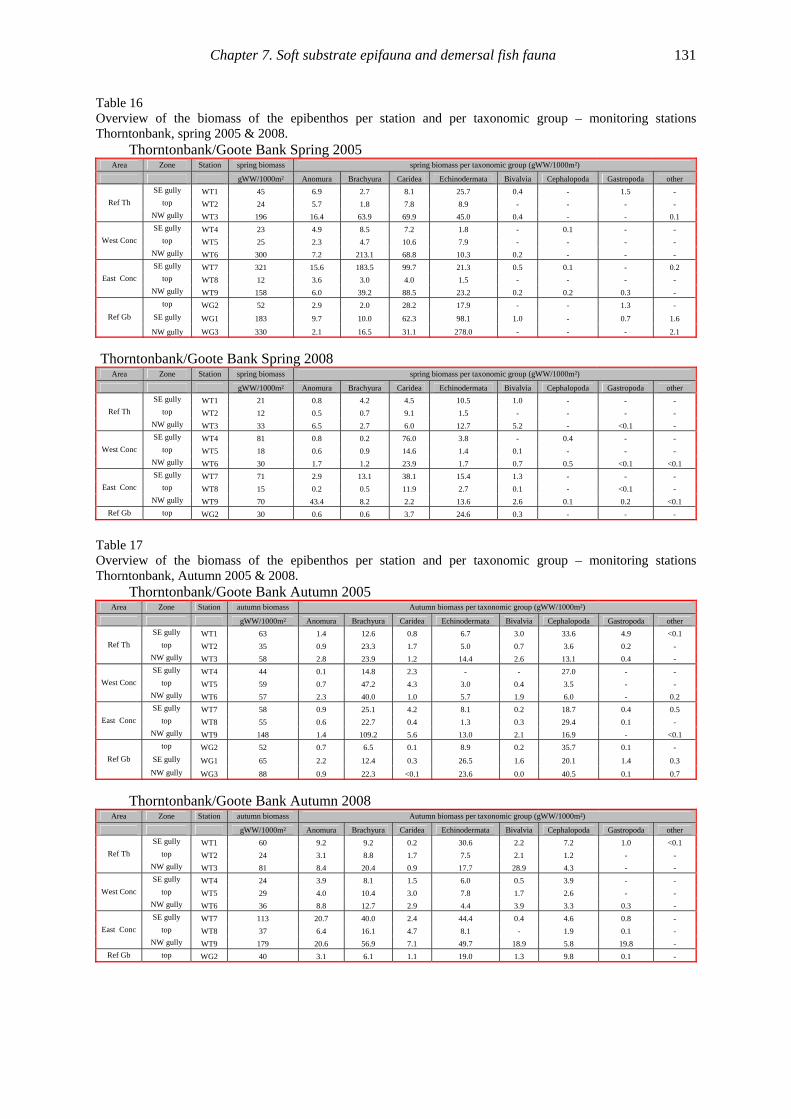
Chapter 7. Soft substrate epifauna and demersal fish fauna 131
Table 16 Overview of the biomass of the epibenthos per station and per taxonomic group – monitoring stations Thorntonbank, spring 2005 & 2008.
Thorntonbank/Goote Bank Spring 2005 Area Zone Station spring biomass spring biomass per taxonomic group (gWW/1000m²)
gWW/1000m² Anomura Brachyura Caridea Echinodermata Bivalvia Cephalopoda Gastropoda other SE gully WT1 45 6.9 2.7 8.1 25.7 0.4 - 1.5 -
top WT2 24 5.7 1.8 7.8 8.9 - - - - Ref Th NW gully WT3 196 16.4 63.9 69.9 45.0 0.4 - - 0.1 SE gully WT4 23 4.9 8.5 7.2 1.8 - 0.1 - -
top WT5 25 2.3 4.7 10.6 7.9 - - - - West Conc NW gully WT6 300 7.2 213.1 68.8 10.3 0.2 - - - SE gully WT7 321 15.6 183.5 99.7 21.3 0.5 0.1 - 0.2
top WT8 12 3.6 3.0 4.0 1.5 - - - - East Conc NW gully WT9 158 6.0 39.2 88.5 23.2 0.2 0.2 0.3 -
top WG2 52 2.9 2.0 28.2 17.9 - - 1.3 - SE gully WG1 183 9.7 10.0 62.3 98.1 1.0 - 0.7 1.6 Ref Gb
NW gully WG3 330 2.1 16.5 31.1 278.0 - - - 2.1
Thorntonbank/Goote Bank Spring 2008 Area Zone Station spring biomass spring biomass per taxonomic group (gWW/1000m²)
gWW/1000m² Anomura Brachyura Caridea Echinodermata Bivalvia Cephalopoda Gastropoda other SE gully WT1 21 0.8 4.2 4.5 10.5 1.0 - - -
top WT2 12 0.5 0.7 9.1 1.5 - - - - Ref Th NW gully WT3 33 6.5 2.7 6.0 12.7 5.2 - <0.1 - SE gully WT4 81 0.8 0.2 76.0 3.8 - 0.4 - -
top WT5 18 0.6 0.9 14.6 1.4 0.1 - - - West Conc NW gully WT6 30 1.7 1.2 23.9 1.7 0.7 0.5 <0.1 <0.1 SE gully WT7 71 2.9 13.1 38.1 15.4 1.3 - - -
top WT8 15 0.2 0.5 11.9 2.7 0.1 - <0.1 - East Conc NW gully WT9 70 43.4 8.2 2.2 13.6 2.6 0.1 0.2 <0.1
Ref Gb top WG2 30 0.6 0.6 3.7 24.6 0.3 - - -
Table 17 Overview of the biomass of the epibenthos per station and per taxonomic group – monitoring stations Thorntonbank, Autumn 2005 & 2008.
Thorntonbank/Goote Bank Autumn 2005 Area Zone Station autumn biomass Autumn biomass per taxonomic group (gWW/1000m²)
gWW/1000m² Anomura Brachyura Caridea Echinodermata Bivalvia Cephalopoda Gastropoda other SE gully WT1 63 1.4 12.6 0.8 6.7 3.0 33.6 4.9 <0.1
top WT2 35 0.9 23.3 1.7 5.0 0.7 3.6 0.2 - Ref Th NW gully WT3 58 2.8 23.9 1.2 14.4 2.6 13.1 0.4 - SE gully WT4 44 0.1 14.8 2.3 - - 27.0 - -
top WT5 59 0.7 47.2 4.3 3.0 0.4 3.5 - - West Conc NW gully WT6 57 2.3 40.0 1.0 5.7 1.9 6.0 - 0.2 SE gully WT7 58 0.9 25.1 4.2 8.1 0.2 18.7 0.4 0.5
top WT8 55 0.6 22.7 0.4 1.3 0.3 29.4 0.1 - East Conc NW gully WT9 148 1.4 109.2 5.6 13.0 2.1 16.9 - <0.1
top WG2 52 0.7 6.5 0.1 8.9 0.2 35.7 0.1 - SE gully WG1 65 2.2 12.4 0.3 26.5 1.6 20.1 1.4 0.3 Ref Gb
NW gully WG3 88 0.9 22.3 <0.1 23.6 0.0 40.5 0.1 0.7
Thorntonbank/Goote Bank Autumn 2008 Area Zone Station autumn biomass Autumn biomass per taxonomic group (gWW/1000m²)
gWW/1000m² Anomura Brachyura Caridea Echinodermata Bivalvia Cephalopoda Gastropoda other SE gully WT1 60 9.2 9.2 0.2 30.6 2.2 7.2 1.0 <0.1
top WT2 24 3.1 8.8 1.7 7.5 2.1 1.2 - - Ref Th NW gully WT3 81 8.4 20.4 0.9 17.7 28.9 4.3 - - SE gully WT4 24 3.9 8.1 1.5 6.0 0.5 3.9 - -
top WT5 29 4.0 10.4 3.0 7.8 1.7 2.6 - - West Conc NW gully WT6 36 8.8 12.7 2.9 4.4 3.9 3.3 0.3 - SE gully WT7 113 20.7 40.0 2.4 44.4 0.4 4.6 0.8 -
top WT8 37 6.4 16.1 4.7 8.1 - 1.9 0.1 - East Conc NW gully WT9 179 20.6 56.9 7.1 49.7 18.9 5.8 19.8 -
Ref Gb top WG2 40 3.1 6.1 1.1 19.0 1.3 9.8 0.1 -

S. Vandendriessche, K. Hostens & J. Wittoeck 132
Table 18 Overview of the biomass of the epibenthos per station and per taxonomic group – monitoring stations Bligh Bank, Spring and Autumn 2008.
Bligh Bank/Hinderbanken Spring 2008 Area Zone Station spring
biomass spring biomass per taxonomic group (gWW/1000m²)
gWW/1000
m² Anomura Brachyura Caridea Echinodermata Bivalvia Cephalopoda Gastropoda other SE gully WBB01 14 2.0 6.7 0.4 2.0 2.9 0.1 <0.1 -
top WBB02 2 0.5 0.2 0.6 0.3 - - - - Ref BB
NW gully WBB03 85 1.5 4.2 0.1 16.8 56.0 5.5 - 1.2 BBR SE border WBB04 15 6.9 2.6 0.1 3.0 2.6 0.1 <0.1 -
SE gully WBB05 15 5.9 0.1 - 7.9 0.6 - <0.1 - top WBB06 2 0.3 - 0.6 1.0 - - - - Conc
NW gully WBB07 24 1.2 5.7 - 9.0 7.6 - - 0.3 BBR NW border WBB08 17 1.2 1.8 - 8.1 4.9 0.3 - 0.4
SE gully WOH01 58 4.1 4.1 <0.1 34.9 14.0 0.2 - 0.3 top WOH02 1 0.4 0.0 0.3 0.1 - - - -
Ref HB
NW gully WOH03 7 1.1 0.5 - 5.4 - - - -
Bligh Bank/Hinderbanken Autumn 2008 Area Zone Station autumn
biomass autumn biomass per taxonomic group (gWW/1000m²)
gWW/1000
m² Anomura Brachyura Caridea Echinodermata Bivalvia Cephalopoda Gastropoda other SE gully WBB01 84 7.7 19.0 0.1 31.2 19.3 6.9 0.2 0.1
top WBB02 12 2.5 4.0 - 2.0 <0.1 2.9 0.2 <0.1 Ref BB
NW gully WBB03 74 7.3 12.0 <0.1 25.7 17.4 11.1 0.3 0.1 BBR SE border WBB04 72 15.5 18.7 0.1 18.3 12.2 6.6 0.1 0.3
SE gully WBB05 50 9.5 4.2 - 27.0 5.1 3.8 0.3 <0.1 top WBB06 12 2.2 3.5 <0.1 3.1 1.3 1.5 - - Conc.
NW gully WBB07 35 14.6 6.5 - 9.7 3.2 0.6 - - BBR NW border WBB08 49 9.3 10.0 - 17.9 7.7 3.8 0.1 0.2
SE gully WOH01 125 15.0 24.1 0.1 69.9 11.6 2.6 1.8 0.1 top WOH02 20 5.1 5.3 - 4.0 4.9 0.7 <0.1 <0.1
Ref HB
NW gully WOH03 47 15.3 7.1 - 17.4 5.0 1.9 0.5 -

Chapter 7. Soft substrate epifauna and demersal fish fauna 133
0
60
120
180
240
300
360
WT1 WT2 WT3 WT4 WT5 WT6 WT7 WT8 WT9 WG2
SE gully top NW gully
SE gully top NW gully
SE gully top NW gully
top
Ref Th West Conc East Conc Ref Gb
gWW/1000m²
T0 ‐ Spring 2005 Thorntonbank
0
30
60
90
120
150
WT1 WT2 WT3 WT4 WT5 WT6 WT7 WT8 WT9 WG2
SE gully top NW gully
SE gully top NW gully
SE gully top NW gully
top
Ref Th West Conc East Conc Ref Gb
gWW/1000m²
T1 ‐ Spring 2008 Thorntonbank
0
30
60
90
120
150
WT1 WT2 WT3 WT4 WT5 WT6 WT7 WT8 WT9 WG2
SE gully top NW gully
SE gully top NW gully
SE gully top NW gully
top
Ref Th West Conc East Conc Ref Gb
gWW/1000m²
T0 ‐ Autumn 2005 Thorntonbankothers
Echinodermata
Caridea
Brachyura
Anomura
0
30
60
90
120
150
WT1 WT2 WT3 WT4 WT5 WT6 WT7 WT8 WT9 WG2
SE gully top NW gully
SE gully top NW gully
SE gully top NW gully
top
Ref Th West Conc East Conc Ref Gb
gWW/1000m²
T1 ‐ Autumn 2008 Thorntonbankothers
Echinodermata
Caridea
Brachyura
Anomura
0
30
60
90
120
150
WBB
01
WBB
02
WBB
03
WBB
04
WBB
05
WBB
06
WBB
07
WBB
08
WOH01
WOH02
WOH03
SE gully
top NW gully
SE border
SE gully
top NW gully
NW border
SE gully
top NW gully
Ref BB BBR Conc BBR Ref HB
gWW/1000m²
T0 ‐ Spring 2008 Blighbank
0
30
60
90
120
150
WBB
01
WBB
02
WBB
03
WBB
04
WBB
05
WBB
06
WBB
07
WBB
08
WOH01
WOH02
WOH03
SE gully
top NW gully
SE border
SE gully
top NW gully
NW border
SE gully
top NW gully
Ref BB BBR Conc. BBR Ref HB
gWW/1000m²
T0 ‐ Autumn 2008 Blighbankothers
Echinodermata
Caridea
Brachyura
Anomura
Figure 17. Column chart of biomass of epibenthos per taxonomic group for all stations and zones - monitoring
stations Thorntonbank and Bligh Bank, spring (left) and autumn (right) 2005 & 2008.
7.4.8. Epibenthos: diversity
7.4.8.1. Thortonbank (C-Power) and Bligh Bank (Belwind concession): condition in 2008
In total, 37 epibenthic species were identified on and around the Thorntonbank/Goote Bank area in 2008, of which 30 species were observed in spring and 31 in autumn 2008. Only 24 species were found in both seasons, leaving 6 and 7 species which were only found in spring or autumn respectively. On and around the Bligh Bank/Hinderbanken area, a total of 41 epibenthic species were found, with 24 species common in both seasons and a total of 31, respectively 34, species in spring and autumn 2008. On average only 12 and 18 species were recorded per fish track in spring, respectively autumn (Table 19). In and around the windmill concession zones, 48 different epibenthic species were recorded in 2008 (Annex 7), of which 30 species were common to both bank systems, while 7, respectively 11 species were only found in the Thornton and Bligh Bank areas.
The reference zones (TRZ, GRZ, BRZ and HRZ) all showed similar seasonal and depth-related patterns in species richness and diversity, comparable to the concession zones (WCZ, ECZ and BCZ) (Table 20, Table 21, Figure 18). There was a clear difference between the number of species (N0) on top of the banks (and thus in the concession zones) vs. the gullies in the Thorntonbank area, with on average 9 species per location on the tops and 14 species in the gullies in spring 2008 and respectively 15 and 18 species per track in autumn. The difference between tops and gullies qua total number of species is even more pronounced, with 13 vs. 28 species in spring and 22 vs. 31 species in autumn.

S. Vandendriessche, K. Hostens & J. Wittoeck 134
All species that were found on the tops were also observed in the gullies, which shows that the gullies are clearly more diversified.
For the Bligh Bank/Hinderbanken area, more or less the same difference between tops and gullies was found in total number of species: 9 vs. 30 species in spring and 20 vs. 32 species in autumn, on tops and gullies respectively (Table 22, Figure 18). Also, most of the species found on the tops were also present in the gullies, while several species were only observed in the gullies. As has been shown, there was a clear increase in total species diversity from spring to autumn for the tops, and a smaller increase for the gullies, although on a per station base the increase was equally substantial for most of the gullies.
For the other diversity indices, the patterns were less pronounced (Figure 18). The values for N1, N2 and Ninf were much lower in spring 2008 in the Thorntonbank area compared to all other zones and seasons, with lower values on the tops compared to the gullies. In autumn 2008 for the Thornton area and in both seasons for the Bligh Bank area, the patterns were quite similar with average values of 5.9, 4.0 and 2.5 for the respective diversity indices (N1, N2 and Ninf) with only small differences between tops and gullies. In contrast to the other locations, slightly higher values were observed on the tops compared to the respective gullies in and around the Thorntonbank area in autumn 2008.
In spring 2008, only 6 epibenthic species occurred in all fish tracks in the Thorntonbank/Goote Bank area: Crangon crangon, Ophiura albida, Ophiura ophiura, Pagurus bernhardus, Liocarcinus holsatus and Asterias rubens. In autumn 2008 the same 6 species together with Sepiola atlantica and Alloteuthis subulata were recorded in all samples of this area. Nine, respectively 4 species were found in only one location in spring resp. autumn. For the Bligh Bank/Hinderbanken area the same species with the exception of Crangon crangon occurred in most of the locations both in spring and autumn 2008.
7.4.8.2. Thorntonbank (C-Power concession): comparison 2005 - 2008
Although a similar total number of species was observed in the Thorntonbank/Goote Bank area in both years (35 species in 2005; 37 species in 2008), only 29 species were found in both years, leaving 14 epibenthic species that were recorded in only one of the sampling years.
For all diversity indices the same patterns were noted in both years with higher values in autumn compared to spring (Figure 18). In spring 2005 almost no difference was noted between tops and gullies, while in spring 2008 the diversity indices were substantially higher in the gullies. Still, unless for number of species (N0), the other indices were lower for most sampling locations compared to 2005. For N1, N2 and Ninf a reduction of 40 % was calculated on the tops of the area, and a reduction of 15% for the gullies. On the other hand, in autumn almost the same values were recorded in 2005 and 2008 and the difference between tops and gullies showed an opposite trend with lower values in the gullies which was clear in autumn 2005 and less pronounced in autumn 2008. Table 19 Overview of the mean diversity indices of the epibenthos per taxonomic group for the examined years and seasons – monitoring stations Thorntonbank and Bligh Bank.
season zone mean diversity
S N1 N2 Ninf thornton 2005 11 4.5 3.5 2.3 thornton 2008 12 3.7 2.5 1.7 spring
Bligh Bank2008 13 6.0 4.1 2.5 thornton 2005 17 6.8 4.6 2.8 thornton 2008 17 6.5 4.8 3.0 autumn
Bligh Bank2008 18 5.8 3.8 2.4

Chapter 7. Soft substrate epifauna and demersal fish fauna 135
Table 20 Overview of the diversity indices of the epibenthos per station and per taxonomic group – monitoring stations Thorntonbank, spring 2005 & 2008.
Thorntonbank/Goote Bank Spring 2005 Area Zone Station spring diversity
S N1 N2 Ninf SE gully WT1 14 6.2 5.1 3.3
top WT2 9 3.9 3.1 2.1 Ref Th
NW gully WT3 14 5.0 3.8 2.6 SE gully WT4 8 4.4 3.5 2.3
top WT5 9 4.1 3.2 2.1 West Conc
NW gully WT6 10 4.0 3.1 2.2 SE gully WT7 14 4.3 3.0 1.9
top WT8 9 5.0 3.8 2.6 East Conc
NW gully WT9 14 3.6 2.7 2.0 top WG2 13 4.7 3.3 2.3
SE gully WG1 18 6.4 4.7 2.8 Ref Gb
NW gully WG3 14 2.0 1.4 1.2
Thorntonbank/Goote Bank Spring 2008 Area Zone Station spring diversity
S N1 N2 Ninf SE gully WT1 14 7.4 5.5 3.1
top WT2 6 2.7 1.9 1.4 Ref Th
NW gully WT3 15 5.2 3.4 2.1 SE gully WT4 8 3.1 2.1 1.5
top WT5 7 2.3 1.6 1.3 West Conc
NW gully WT6 12 2.9 1.8 1.4 SE gully WT7 17 4.8 2.9 1.8
top WT8 10 2.8 1.8 1.4 East Conc
NW gully WT9 18 2.4 1.5 1.2 Ref Gb top WG2 11.0 2.5 1.6 1.3
Table 21 Overview of the diversity indices of the epibenthos per station and per taxonomic group – monitoring stations Thorntonbank, autumn 2005 & 2008.
Thorntonbank/Goote Bank Autumn 2005 Area Zone Station autumn diversity
S N1 N2 Ninf SE gully WT1 18 8.1 5.2 2.8
top WT2 16 8.0 5.6 3.3 Ref Th
NW gully WT3 22 4.6 2.4 1.6 SE gully WT4 9 5.6 4.5 3.1
top WT5 15 6.1 4.1 2.4 West Conc
NW gully WT6 17 6.2 4.1 2.5 SE gully WT7 20 9.0 6.4 4.2
top WT8 15 8.1 5.8 3.3 East Conc
NW gully WT9 18 5.1 3.3 2.1 top WG2 15 9.0 7.4 4.8
SE gully WG1 22 11.6 8.5 4.8 Ref Gb
NW gully WG3 17 6.2 4.0 2.3
Thorntonbank/Goote Bank Autumn 2008 Area Zone Station autumn diversity
S N1 N2 Ninf SE gully WT1 24 7.1 5.4 4.1
top WT2 15 7.5 5.4 3.0 Ref Th
NW gully WT3 16 6.0 4.1 2.4 SE gully WT4 14 7.5 5.8 3.3
top WT5 17 7.0 5.4 3.4 West Conc
NW gully WT6 15 5.7 4.0 2.4 SE gully WT7 20 6.1 4.3 3.0
top WT8 11 5.7 4.8 3.3 East Conc
NW gully WT9 18 5.6 3.7 2.2 Ref Gb top WG2 18.0 6.2 4.4 2.5

S. Vandendriessche, K. Hostens & J. Wittoeck 136
Table 22 Overview of the diversity indices of the epibenthos per station and per taxonomic group – monitoring stations Bligh Bank, spring and autumn 2008.
Bligh Bank/Hinderbanken Spring 2008 Area Zone Station spring diversity
S N1 N2 Ninf SE gully WBB01 14 6.8 4.3 2.5
top WBB02 7 4.4 3.4 2.5 Ref BB
NW gully WBB03 20 11.4 8.4 4.0 BBR SE border WBB04 17 4.6 2.4 1.6
SE gully WBB05 9 3.7 2.4 1.6 top WBB06 6 5.0 4.5 3.0 Conc
NW gully WBB07 12 4.6 2.6 1.7 BBR NW border WBB08 16 7.3 4.9 2.8
SE gully WOH01 16 5.2 3.2 2.0 top WOH02 5 3.9 3.3 2.2 Ref HB
NW gully WOH03 7 3.7 2.8 1.9
Bligh Bank/Hinderbanken Autumn 2008 Area Zone Station autumn diversity
S N1 N2 Ninf SE gully WBB01 24 9.0 6.6 4.2
top WBB02 13 5.5 3.4 2.0 Ref BB
NW gully WBB03 25 5.2 2.9 1.8 BBR SE border WBB04 24 6.1 3.4 2.0
SE gully WBB05 16 5.8 3.9 2.4 top WBB06 11 5.4 3.4 2.0 Conc.
NW gully WBB07 11 4.1 2.9 2.2 BBR NW border WBB08 20 5.2 3.6 2.5
SE gully WOH01 20 5.2 3.3 2.1 top WOH02 16 6.3 3.6 2.0 Ref HB
NW gully WOH03 15 4.6 3.1 2.1

Chapter 7. Soft substrate epifauna and demersal fish fauna 137
0
5
10
15
20
25
WT1 WT2 WT3 WT4 WT5 WT6 WT7 WT8 WT9 WG2
SE gully top NW gully
SE gully top NW gully
SE gully top NW gully
top
Ref Th West Conc East Conc Ref Gb
Diversity
T0 ‐ Spring 2005 Thorntonbank
0
5
10
15
20
25
WT1 WT2 WT3 WT4 WT5 WT6 WT7 WT8 WT9 WG2
SE gully top NW gully
SE gully top NW gully
SE gully top NW gully
top
Ref Th West Conc East Conc Ref Gb
Diversity
T1 ‐ Spring 2008 Thorntonbank
0
5
10
15
20
25
WT1 WT2 WT3 WT4 WT5 WT6 WT7 WT8 WT9 WG2
SE gully top NW gully
SE gully top NW gully
SE gully top NW gully
top
Ref Th West Conc East Conc Ref Gb
Diversity
T0 ‐ Autumn 2005 Thorntonbank
S
N1
N2
Ninf
0
5
10
15
20
25
WT1 WT2 WT3 WT4 WT5 WT6 WT7 WT8 WT9 WG2
SE gully top NW gully
SE gully top NW gully
SE gully top NW gully
top
Ref Th West Conc East Conc Ref Gb
Diversity
T1 ‐ Autumn 2008 Thorntonbank
S
N1
N2
Ninf
0
5
10
15
20
25
WBB
01
WBB
02
WBB
03
WBB
04
WBB
05
WBB
06
WBB
07
WBB
08
WOH01
WOH02
WOH03
SE gully
top NW gully
SE border
SE gully
top NW gully
NW border
SE gully
top NW gully
Ref BB BBR Conc BBR Ref HB
Diversity
T0 ‐ Spring 2008 Blighbank
0
5
10
15
20
25
WBB
01
WBB
02
WBB
03
WBB
04
WBB
05
WBB
06
WBB
07
WBB
08
WOH01
WOH02
WOH03
SE gully
top NW gully
SE border
SE gully
top NW gully
NW border
SE gully
top NW gully
Ref BB BBR Conc. BBR Ref HB
Diversity
T0 ‐ Autumn 2008 Blighbank
S
N1
N2
Ninf
Figure 18. Column chart of diversity of epibenthos per taxonomic group for all stations and zones - monitoring
stations Thorntonbank and Bligh Bank, spring (left) and autumn (right) 2005 & 2008.
7.4.9. Epibenthos: community analysis
7.4.9.1. Thortonbank (C-Power) and Bligh Bank (Belwind concession): condition in 2008
After the reduction of the database based on densities and frequencies of occurrences (> 1%), 15 resp. 24 species were taken into account for spring and 17 resp. 21 species for autumn for the Thorntonbank/Goote Bank area, resp. Bligh Bank/Hinderbanken area.
The MDS plot of the spring 2008 samples clearly groups the fish tracks on the sandbank tops of the Thorntonbank and to a lesser extent the top of the Goote Bank (Figure 19). Station WT4, which is located on the SE slope of the WCZ, showed more similarities with the top than with the deeper gullies. Another group that can be delineated consists of the sampling locations in the NW gully. The SW gully samples are scattered around the plot. ANOSIM analysis based on the differences between these two groups resulted in an R-value of 0.56 (p=0.03), which indicates significant differences between the groups. Simper analysis calculated similarities within these groups of 75 % for the top locations and 75% for the NW gully locations. The differences between tops and gullies were mainly due to the higher abundance of hermit crab Pagurus bernhardus and lesser brittle star Ophiura albida in the gullies and the more common brittle star Ophiura ophiura on the tops. Additionally, higher

S. Vandendriessche, K. Hostens & J. Wittoeck 138
Thornton/Gootebank Spring 2008
s8-WT1
s8-WT2
s8-WT3
s8-WT4
s8-WT5
s8-WT6
s8-WT7
s8-WT8
s8-WT9
s8-WG2
Stress: 0.1, 15 sp > 1%
Top
NW‐Gully
densities of heart urchin Echinocardium cordatum and thick trough shell Spisula solida were recorded in the gullies and more green urchin Psammechinus miliaris in the top locations.
For the autumn 2008 samples of the Thorntonbank/Goote Bank area, a clear aggregation of the top and slope locations is visible in the MDS plot (80 % similarity in ANOSIM), while the gully locations are scattered (Figure 19). However, also the gully locations showed a high similarity of 70%. Only 25% dissimilarity was calculated between both top and gully locations. The differences were mainly due to higher densities in the gullies for the brittle star species Ophiura albida and O. ophiura and hermit crabs, next to netted dog whelk Nassarius reticulatus and several Spisula species.
a8-WT1
a8-WT2
a8-WT3
a8-WT4a8-WT5
a8-WT6
a8-WT7
a8-WT8
a8-WT9
a8-WG2
Thornton/Gootebank Autumn 2008 Stress: 0.05, 17 sp > 1%
TopGully
Figure 19. MDS plots of spring (left) and autumn (right) samples, indicating groupings based on position in a gully (dark grey contour) or on a sandbank top (light grey contour)- monitoring stations Thorntonbank, 2008.
The spring 2008 MDS plot of the Bligh Bank/Hinderbanken area clearly shows an aggregation of
the top locations, and a difference between the samples in the NW gully and those in the SE gully (pairwise test R = 0.6, p= 0.001) (Figure 20). ANOSIM calculated a similarity of 60 to 70 % within the 3 groups and on average 60% dissimilarity between the tops and gullies. Pagurus bernhardus and Ophiura albida occurred in much higher densities in the gullies. However, since the top samples in the Bligh Bank/Hinderbanken area were almost void of epibenthic life in spring 2008, the presence of several other species in the gullies also contributed to the difference between the tops and gullies. The difference between the NW gully and the SE gully was mainly due to higher densities of sword razor clam Ensis arcuatus and the ophiuroid Ophiura albida in the NW gully and higher densities of hermit crab Pagurus bernhardus in the SE gully, next to a large list of species that are more abundant in either the NW gullies or the SE gullies.
In the autumn 2008 MDS plot of data from the Bligh Bank/Hinderbanken area, only two groups could be distinguished, with a similarity of 80% for the gullies and 70% for the top locations (Figure 20). Fish track WBB07 is located on the NW slope and showed more affinity with the top locations than with the gullies. The dissimilarity of 35% between the top and gullies (R=0.69, p=0.003) is mainly due to higher densities in the gullies of Ophiura albida, Pagurus bernhardus, Ophiura ophiura, long legged spider crab Macropodia rostrata, flying crab Liocarcinus holsatus, starfish Asterias rubens and several Spisula species.

Chapter 7. Soft substrate epifauna and demersal fish fauna 139
s8-435
s8-WBB01
s8-WBB02
s8-WBB03
s8-WBB04
s8-WBB05s8-WBB06
s8-WBB07 s8-WBB08
s8-WOH01
s8-WOH02
s8-WOH03
Bligh/Hinderbank Spring 2008 Stress: 0.12, 24 sp > 1%
Top SE‐gully
NW‐gully
a8-435
a8-WBB02
a8-WBB03a8-WBB04
a8-WBB05
a8-WBB06a8-WBB07
a8-WBB08
a8-WOH01
a8-WOH02
a8-WOH03
Bligh/Hinderbank Autumn 2008 Stress: 0.08, 21 sp > 1%
Top
Gully
Figure 20. MDS plots of spring (left) and autumn (right) samples, indicating groupings based on position in a
gully (dark grey contour) or on a sandbank top (light grey contour)- monitoring stations Bligh Bank, 2008.
7.4.9.2. Thorntonbank (C-Power concession): comparison 2005 - 2008
After the reduction of the database based on densities and frequencies of occurrences (> 1%), 20 species were taken into account for spring and 24 species for autumn when comparing the Thorntonbank/Goote Bank area for 2005 and 2008 per season.
The MDS plot for the spring comparison showed a clear difference between top (75% similarity) and gully locations and a difference between 2005 (78 % similarity) and 2008 (64 % similarity) for the gully locations (Figure 21). The top locations were more or less aggregated per year. ANOSIM calculated a global R-value of 0.60 (p=0.001) and SIMPER calculated a 40% dissimilarity between the 3 groups. Liocarcinus holsatus, brown shrimp Crangon crangon, Ophiura albida and Pagurus bernhardus were present in much higher densities in the gullies compared to the tops in spring 2005. These species, together with several others were responsible for the difference between the gullies in 2005 vs. 2008, due to the very low densities in spring 2008. The difference between the top and gullies in 2008 was also due to higher densities of Pagurus bernhardus and Liocarcinus holsatus in the gullies, but Ophiura albida and Ophiura ophiura showed higher densities in the top locations.
s5-WT1s5-WT2
s5-WT3
s5-WT4
s5-WT5
s5-WT6
s5-WT7
s5-WT8
s5-WT9
s5-WG2
s8-WT1
s8-WT2 s8-WT3
s8-WT4
s8-WT5
s8-WT6
s8-WT7
s8-WT8
s8-WT9
s8-WG2
Thornton/Gootebank Spring 2005 vs.2008 Stress: 0.15, 20 sp > 1%
Top
Gully2008
Gully2005
a5-WT1
a5-WT2
a5-WT3
a5-WT4
a5-WT5
a5-WT6
a5-WT7
a5-WT8
a5-WT9
a5-WG2
a8-WT1
a8-WT2
a8-WT3
a8-WT4
a8-WT5a8-WT6
a8-WT7
a8-WT8
a8-WT9
a8-WG2
Thornton/Gootebank Autumn 2005 vs.2008 Stress: 0.16, 24 sp > 1%
Top
2008 2005
NW‐Gully
SE‐Gully
Figure 21. MDS plots of spring (left) and autumn (right) samples, indicating groupings based on position in a gully (dark grey contour) or on a sandbank top (light grey contour)- monitoring stations Thornton, 2005 vs.
2008. For the comparison of the autumn samples, the MDS plot showed a difference between 2005 and
2008, and a difference between tops vs. NW gully vs. SE gully (Figure 21). The ANOSIM pairwise test calculated a global R-value of 0.66 (p=0.001), while SIMPER calculated a similarity of 70 to 75% within the groups and 25 to 35% dissimilarity between the groups.
- Difference top locations - NW gullies: mainly due to higher densities of Ophiura albida, Pagurus bernhardus, Ophiura ophiura, Liocarcinus holsatus, Crangon crangon and Nassarius reticulatus in the NW gullies.
- Difference tops - SE gullies: mainly higher densities of Ophiura albida, Pagurus bernhardus, Ophiura ophiura, Asterias rubens in the SE gullies.

S. Vandendriessche, K. Hostens & J. Wittoeck 140
- Difference SE gullies - NW gullies: mainly due to higher abundance of Nassarius reticulatus, Spisula solida, Ophiura species and Liocarcinus holsatus in the NW gullies.
- Difference 2005 - 2008 for the SE gullies: mainly due to more Nassarius reticulatus in 2005 and higher densities of Pagurus bernhardus, Ophiura species and common squid Alloteuthis subulata in autumn 2008.
- Difference 2005 - 2008 for the NW gullies: mainly due to higher densities of Nassarius reticulatus, Ophiura species, Spisula solida and Crangon crangon in autumn 2008.
7.4.10. Epibenthos: length-frecuency
7.4.10.1. Thortonbank and Bligh Bank: condition in 2008 and comparison 2005 - 2008
For four epibenthic species (cf. De Maersschalck et al., 2006), the mean total length was determined. Additionally, the average length-frequency distribution was determined and visualized (Figure 25, Figure 26).
Brown shrimp Crangon crangon
The brown shrimp is a very common and abundant species in the Thorntonbank area: the species was encountered in all but one of the tows (WG2 in autumn 2005) taken in 2005 and 2008.
In 2008, the average length increased with 7mm from autumn to spring (45-52mm) but showed unimodal curves in both seasons. Similar patterns have been observed in 2005, but spring densities were about 3 times higher in the most abundant size classes (45-60mm) compared to 2008. Contrary to the results of 2005, no significant differences were observed in length between sandbank tops and gullies (Figure 22). There were no obvious differences between the concession area and both reference areas.
Crangon crangon
38
40
42
44
46
48
50
52
54
56
58
60
62
64
66
mean total len
gth (m
m)
Mean Mean±2*SD
autumn 2008
gully top gully top gully top gully top
spring 2008 autumn 2005 spring 2005 Figure 22. Whisker plot showing differences in mean total length between gully stations and sandbank top
stations (red arrow indicates significant difference) - monitoring stations Thorntonbank, 2005 & 2008. In the Bligh Bank area, brown shrimps were only encountered in half of the spring tows and in
relatively low densities (maximally 0,2 ind/1000m² compared to 15 ind/1000m² in the same period in the Thorntonbank area). The unimodal curve however shows a similar shape as in the Thorntonbank area, with a dominant size class of 55mm and a mean total length of 56,8mm. No significant differences were observed in length between sandbank tops and gullies and between the concession area and both reference areas.

Chapter 7. Soft substrate epifauna and demersal fish fauna 141
Allman shrimp Crangon allmanni Similar to 2005, only low densities of Allman shrimp were encountered in 2008. The average
length was higher in autumn compared to spring (40mm vs. 33mm). The dominant size classes were identical in autumn (35mm) and spring (40mm) of both years, but spring densities in all encountered size classes were significantly lower. This reduction is a reflection of a decreased percentage of tows in which this species was found (83% in 2005, 20% in 2008), and a lower density per station (Figure 23).
Similar to brown shrimps, Allmann shrimps were only encountered in spring in the Bligh Bank area in densities of a similar order of magnitude (0,04 – 0,1 ind/1000m²). The length range was very limited with specimens measuring 40-45mm.
0
0,5
1
1,5
2
2,5
3
3,5
WG1 WG2 WG3 WT1 WT2 WT3 WT4 WT5 WT6 WT7 WT8 WT9 WG2 WT1 WT2 WT3 WT4 WT5 WT6 WT7 WT8 WT9
2005 2008
#/10
00m²
Crangon allmanni size 35‐45mm
Figure 23. Column chart showing the density of Allman shrimp (length 35-45mm) at all stations between years -
monitoring stations Thorntonbank, 2005 & 2008.
Flying crab Liocarcinus holsatus This crab species was encountered in all autumn tows (both years) and in most spring tows
(except WT4 and WT9 in 2008). An analysis of the sex distribution shows that males were dominant in 2005 (mean 76% in autumn, 77% in spring) and in autumn 2008 (mean 83%). In spring 2008 however, females constituted more than 50% of the flying crab catch. Females were absent in tracks WT5, WT8 and WT9.
In 2008, males had an average carapax width of 34mm in autumn and 32mm in spring. For females, carapax widths averaged 28 and 30mm in autumn and spring respectively. For neither of the sexes, significant differences were observed concerning total length between sandbank gullies and tops and between the concession zone and the reference zones.
The length frequency curves for 2005 and 2008 of male flying crabs shows a similar shape in autumn, although there is a shift in DSC from 40mm to 35mm. The shape of the spring curve, however, shows a drastic decrease of density in all size classes to values below 0,02 ind per 1000m². This reduction was mainly due to the absence of peak densities as observed at WT3, WT6 and WT7 in 2005 (Figure 24). A similar reduction in the densities per size class was observed concerning females in both seasons.

S. Vandendriessche, K. Hostens & J. Wittoeck 142
0
2
4
6
8
10
12
14
16
WG1 WG2 WG3 WT1 WT2 WT3 WT4 WT5 WT6 WT7 WT8 WT9 WG2 WT1 WT2 WT3 WT4 WT5 WT6 WT7 WT8 WT9
2005 2008
#/10
00m²
Liocarcinus holsatus male, length 25‐45mm
Figure 24. Column chart showing the density of male flying crabs (length 35-45mm) at all stations between
years - monitoring stations Thorntonbank, 2005 & 2008. In 2008, the flying crab population of the Bligh bank area was dominated by males in autumn
(89%) and by females in spring (74%). This trend in seasonal sex distribution was also observed in the Thorntonbank area, but was more outspoken in the Bligh bank area. Both males and females were found in the majority of the tracks (males: 81% in autumn, 54% in spring – females:72% in autumn, 64% in spring).
Males had an average carapax width of 30mm in autumn and 32mm in spring. For females, carapax widths averaged 29 and 30mm in autumn and spring respectively. For neither of the sexes, differences were observed concerning total length between sandbank gullies and tops and between the concession zone and the reference zones.
Marbled swimming crab Liocarcinus marmoreus
Individuals of the marbled swimming crab were only sporadically found in 2005 and 2008 and were predominantly males. In 2008, males had an average carapax width of 29mm in autumn and 16mm in spring; females had an average carapax width of 31mm in autumn and 19mm in spring. Since the size-frequency distributions of this species were discontinuous, no trends could be described (figures not depicted).
The marbled swimming crab population of the Bligh bank area was dominated by males in both seasons (92% in autumn, 75% in spring). Females were found in only a few tracks (WBB04-5 in autumn, WBBO1-3-7 in spring). Marbled swimming crab males had an average carapax width of 26mm in autumn and 22mm in spring. For females, carapax widths averaged 29 and 30mm in autumn and spring respectively. No significant differences were observed in length between sandbank tops and gullies and between the concession area and both reference areas for males. Females were found in too few tracks to enable comparisons. Since the size-frequency distributions of this species were discontinuous, no trends could be described (figures not depicted).
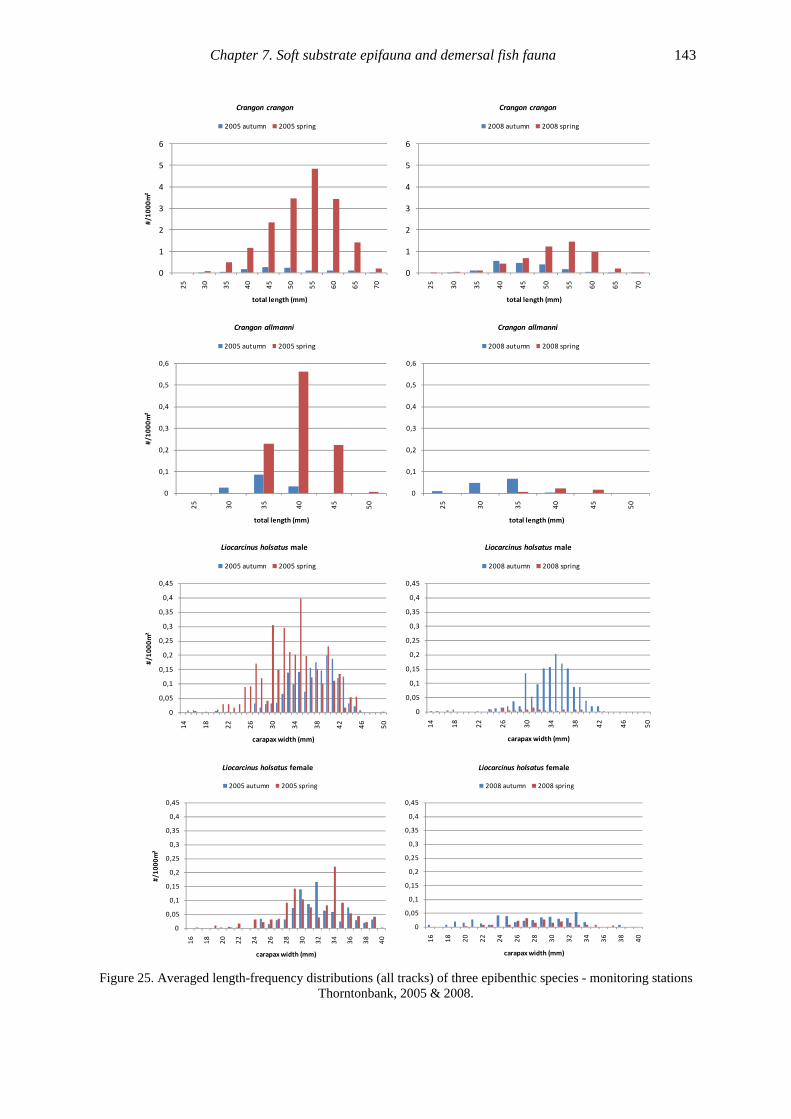
Chapter 7. Soft substrate epifauna and demersal fish fauna 143
0
1
2
3
4
5
6
25 30 35 40 45 50 55 60 65 70
#/10
00m²
total length (mm)
Crangon crangon
2005 autumn 2005 spring
0
1
2
3
4
5
6
25 30 35 40 45 50 55 60 65 70
total length (mm)
Crangon crangon
2008 autumn 2008 spring
0
0,1
0,2
0,3
0,4
0,5
0,6
25 30 35 40 45 50
#/10
00m²
total length (mm)
Crangon allmanni
2005 autumn 2005 spring
0
0,1
0,2
0,3
0,4
0,5
0,6
25 30 35 40 45 50
total length (mm)
Crangon allmanni
2008 autumn 2008 spring
0
0,05
0,1
0,15
0,2
0,25
0,3
0,35
0,4
0,45
14 18 22 26 30 34 38 42 46 50
#/10
00m²
carapax width (mm)
Liocarcinus holsatus male
2005 autumn 2005 spring
0
0,05
0,1
0,15
0,2
0,25
0,3
0,35
0,4
0,45
14 18 22 26 30 34 38 42 46 50
carapax width (mm)
Liocarcinus holsatus male
2008 autumn 2008 spring
0
0,05
0,1
0,15
0,2
0,25
0,3
0,35
0,4
0,45
16 18 20 22 24 26 28 30 32 34 36 38 40
#/10
00m²
carapax width (mm)
Liocarcinus holsatus female
2005 autumn 2005 spring
0
0,05
0,1
0,15
0,2
0,25
0,3
0,35
0,4
0,45
16 18 20 22 24 26 28 30 32 34 36 38 40
carapax width (mm)
Liocarcinus holsatus female
2008 autumn 2008 spring
Figure 25. Averaged length-frequency distributions (all tracks) of three epibenthic species - monitoring stations
Thorntonbank, 2005 & 2008.

S. Vandendriessche, K. Hostens & J. Wittoeck 144
0
0,002
0,004
0,006
0,008
0,01
0,012
0,014
0,016
0,018
40 45 50 55 60 65 70
#/10
00m²
total length (mm)
Crangon crangon
2008 autumn 2008 spring
0
0,1
0,2
0,3
0,4
0,5
0,6
40 45
#/10
00m²
total length (mm)
Crangon allmanni
2008 autumn 2008 spring
0
0,02
0,04
0,06
0,08
0,1
0,12
0,14
11 13 15 17 19 21 23 25 27 29 31 33 35 37 39 41 43
#/10
00m²
carapax width (mm)
Liocarcinus holsatus male
2008 autumn 2008 spring
0
0,02
0,04
0,06
0,08
0,1
0,12
0,14
17 19 21 23 25 27 29 31 33 35 37 41
#/10
00m²
carapax width (mm)
Liocarcinus holsatus female
2008 autumn 2008 spring
Figure 26. Averaged length-frequency distributions (all tracks) of 3 epibenthic species - monitoring stations
Bligh Bank, 2008.
7.4.11. The state of the demersal fish fauna: a summary
In the Thorntonbank monitoring area, the spring density of demersal fish was found to be higher in the gullies and lower on the tops (both years; see annex 8). Within the gully samples, the SE gullies harbored the highest densities in 2005, but densities were comparable between all gullies in 2008. The high spring densities observed in 2005 were mainly due to the abundant presence of clupeids (sprat and herring), while densities in 2008 were lower (65%) and largely limited to perciforms (mainly dragonets and lesser weever) and flatfish (mainly dab and solenette). The reduction of the density of clupeids was visible in all stations and zones (see annex 8), implying that it was caused by interannual variation in the distribution and/or demography of these species.
When comparing the autumn samples, fish densities in 2005 and 2008 were comparable, but the differences between gullies and sandbank tops were less outspoken than in spring (except the sandbank top station WT8 with low densities). Just as in spring 2008, the fish community was dominated by perciforms (mainly dragonets, lesser weever and hooknose) and flatfish (mainly dab and solenette) in both years. Station WT7 showed an aberrant species composition in 2008 due to the presence of high densities of bib and poor cod.
The species richness of demersal fish did not show significant differences between years, between tops and gullies and between concession zones and reference zones. However, the values were somewhat lower in samples WT4 (SE gully of the Western Concession Zone) and WT8 (sandbank top sample in the Eastern Concession Zone) in both years. Generally, a high variation in evenness was observed between the different fish tracks.
The analysis of the length frequency distributions of 17 fish species showed some clear shifts between years, but none could be attributed to the construction works in the western concession zone of the Thorntonbank. The most striking results were related to differences between sandbank tops and gullies (e.g. significant differences in mean total length for plaice in autumn samples of 2008) or to

Chapter 7. Soft substrate epifauna and demersal fish fauna 145
differences between years (e.g. strong reduction per size class of sprat and hooknose at all stations in 2008). Differences between the years may also partly result from differences in the timing of the sampling; samplings are snapshots in time and differences can occur within the same sampling season, especially concerning the occurrence and the development of cohorts.
While the spatial difference between sandbank tops and gullies was equally important in the Bligh Bank monitoring area; the patterns differed from the ones observed in the Thorntonbank monitoring area:
- Thorntonbank: the spring density was higher in the gullies and lower on the tops; differences between gullies and sandbank tops were less outspoken in autumn
- Bligh Bank: densities from the tops were 1,3 to 2 times higher in autumn compared to spring, while densities in the gullies remained similar. The high densities on the tops were mainly the result of the abundance of lesser weever.
Generally, the Bligh Bank monitoring area was found to be denser and richer than the Thorntonbank monitoring area (see annex 8).
In the Bligh Bank monitoring area, tops were dominated by perciforms (mainly lesser weever), while pleuronectiforms (mainly dab, solenette and plaice) were of similar importance as perciforms in the gullies. Some of the gully stations showed local concentrations of the gadiforms whiting and cod.
The species number was higher on the Bligh Bank (both concession zone and reference zone) than in the Hinderbanken reference zone in both seasons (difference of 8 species in spring and 5 species in autumn). Additionally, values from the sandbank tops were lower than from the neighboring gullies in the three investigated zones.
The analysis of the length-frequency distributions of 10 fish species did not reveal any significant differences between the concession zones and both reference zones. Some significant differences in mean total length were observed between fish caught at gully stations and fish caught at sandbank tops stations: specimens of lesser weever and great sandeel were generally larger in gully samples than in top samples.
7.4.12. The state of the epibenthos fauna: a summary
Apart from the natural difference between spring and autumn samples (with much higher values in autumn), all community analyses, density, biomass and diversity plots clearly showed a difference between the top samples (and thus in the concession zones) vs. the deeper gully samples, both for the Thornton/Goote Bank area and the Bligh Bank/Hinderbanken area. In almost all cases the values in the gullies were much higher than those on the tops of the banks (see annex 8). Furthermore, almost all species that were found on the tops were also present in the gullies (be it in different proportions), which clearly shows that the gullies are more diverse and richer than the tops of the different sandbanks.
While the diversity did not differ that much between spring and autumn in the gullies surrounding both sandbank systems, the increase in number of species from spring to autumn, be it in total or on a per sample base, was much more pronounced for the top locations. On the other hand, where the different top samples showed very high similarities in density and biomass (up to 80%), the variation in the gully samples was much greater, especially during autumn. As was seen in 2005 for the Thorntonbank, the analyses prove that there is a (small) difference between the NW gullies and the SE gullies around the Thornton/Goote Bank area and around the Bligh Bank/Hinderbanken area. Furthermore, the NW gullies seem to be more uniform (at least in spring) than the SE gullies.
Next to the differences in diversity, the spatial, seasonal and interannual differences were due to higher (or lower) densities of only a few common epibenthic species. Although the species assemblage changed from spring to autumn, especially in the Thorntonbank area, the common species remained the same: i.e. brown shrimp Crangon crangon (mainly in spring on Thorntonbank, almost not found on Bligh Bank); lesser brittlestar Ophiura albida (always), common brittlestar Ophiura ophiura (higher densities on top, less common than O. albida), hermit crab Pagurus bernhardus (much more abundant in the gullies), flying crab Liocarcinus holsatus (much lower densities in 2008, almost exclusively in the gullies and higher densities in autumn), Atlantic bobtail Sepiola atlantica and the squid Alloteuthis subulata (both mainly in autumn in all samples), thick through shell Spisula solida and starfish Asterias rubens (mainly in the gullies in autumn).

S. Vandendriessche, K. Hostens & J. Wittoeck 146
It should be stated that the densities and biomasses in the Bligh Bank/Hinderbanken area were very (extremely) low in spring 2008 (see annex 8). Although no clear explanation can be given, this is probably due to natural variability since also in the Thorntonbank area the densities were much lower in spring 2008 vs. spring 2005. In autumn 2008, the epibenthic assemblage of the Bligh Bank was much more comparable with the assemblage of the Thorntonbank and showed the same order of magnitude concerning variability. In contrast to the spring situation, the density and biomass values for the Thorntonbank (both concession and reference zones) were higher in autumn 2008 than in autumn 2005. Up till now, no changes can be shown in the patterns in (and around) the concession zones, and as such they remain largely comparable with the reference areas.
The analysis of the length frequency distributions of 2 shrimp species and 2 crab species showed no significant differences in mean total length or carapax width resulting from sampling position (sandbank tops and gullies) or from sampling zone (reference zones and concession zones). The observed differences between the length-frequency distributions of 2005 and 2008 in the Thorntonbank monitoring area were mainly due to an overall reduction of the epibenthic density in all size classes.
7.5. Discussion
7.5.1. Representativity of the reference zones
Within the Thorntonbank monitoring area, references zones were delineated on the Thorntonbank and on the neighboring Goote Bank. Each reference area was sampled at one sandbank top station and two slope/gully stations. The study of De Maersschalck et al. (2006) indicated that the Goote Bank gully stations differed substantially from the Thorntonbank gully stations. Stations WG1 and WG3 were consequently abandoned as reference in the T1 assessment. For the remaining reference stations, high similarities were found within the groups of sandbank top samples and gully samples per year (68-73% for fish, 60-80% for epibenthos), while no significant differences were observed between reference stations and stations from the concessions zones. Consequently, the reference stations are considered to be suitable as such. However, the reference zone for the study of the impact of windmills on the Thorntonbank is situated inside a concession area for sand extraction. Although no extraction activities have taken place so far, the value of the area as reference in the framework of windmill construction and exploitation is hypothecated. Consequently, the impact assessment monitoring of the C-Power windmill park (and of future sand extraction activities) would benefit from the establishment of a closed area inside the sand extraction concession zone.
Within the Bligh Bank monitoring area, reference zones were delineated on the Bligh Bank and on the neighboring Oosthinder within the Hinderbanken exploration zone. Again, each reference area was sampled at one sandbank top station and two slope/gully stations. For demersal fish, the patterns of density, taxonomic composition and length-frequency distributions in both reference zones reflected those from the concession zone. However, spring densities were higher in the Bligh Bank reference zone compared to the Hinderbanken reference zone, and gadiforms were far less abundant in the HRZ. Additionally, the species number was higher on the Bligh Bank (both concession zone and reference zone) than in the Hinderbanken reference zone in both seasons. For the epibenthos no differences could be shown between the concession zone and the reference zones. However, the reference zone on the Hinderbanken is situated within the current Hinderbanken sand exploration zone. Similar to the situation at the Thorntonbank, a problem might occur with this reference zone, when sand extraction would be allowed on the Hinderbanken in the future. Still, the reference zone on the Bligh Bank clearly fulfills its role.
7.5.2. Impact of the construction of six turbines on the Thorntonbank
The potential impact of windmill farms during the construction period can be divided into three categories: (1) destruction, (2) dredging and (3) disturbance (Petersen & Malm, 2006). The first factor

Chapter 7. Soft substrate epifauna and demersal fish fauna 147
involves the eradication of organisms at the site of the turbine footings, and is considered negligible since this is a very small surface compared to the entire concession zone. At the Thorntonbank construction site, no rare species or habitats are present and the loss of habitat at the position of the six turbines (490m² of foundations) is minimal. Dredging and disturbance due to construction of turbines and the establishment of cables, however, are considerably more important, especially for benthic and demersal fauna. During the study presented in this report, no obvious negative effects of the construction of six turbines have been detected for the ecosystem components epibenthos and fish. However, local effects in the vicinity of the turbines are hard to detect using long tracks, since all fauna over a length of 3500m are pooled in a single catch and information about the small-scale ‘patchiness’ of fauna is largely lost. An adaptation of the sampling design, as proposed in section 6.1, would result in a decrease in the detection level of local changes. These local changes are expected to manifest themselves more clearly after an increase of the size of impact following the construction of additional turbines.
Next to negative effects, effects of the presence of man-made constructions on the seabed include concentration of fish density and biomass around the solid structure (Wilhelmsson et al, 2006). Although physical structures have the potential to influence larger demersal fish species hundreds of metres away (Grove et al, 1991), significant effects have so far not been observed in the vicinity of the six windmills on the Thorntonbank.
Monitoring of the ecosystem components epibenthos and demersal fish will continue in the Thorntonbank area and in other windmill concession areas in order to detect any effects of additional construction activities and of specific effects during operation of the turbines. Since the results indicate that gullies are richer in density and biomass of demersal fish and epifauna, most effects are expected after the construction of turbines at the gullies of the Bligh Bank. In other words, the differences between sandbank tops and gullies indicate that turbines should preferably be placed on the sandbank tops for a minimal impact on demersal fish and epifauna.
7.5.3. Suggestions concerning sampling strategy
In 2008, a high sampling intensity (such as the one used in the Thorntonbank baseline study) was maintained for the evaluation of the Thorntonbank construction impact (T1), and was repeated for the Bligh Bank baseline study (T0). For the 2009 sampling campaigns, a modified sampling strategy is proposed, with which all required data will be obtained based on a reduced number of tracks within both research areas. This modification will reduce the work load and will allow the allocation of time and means to make concerted efforts in answering specific research questions (see section 6.2.2).
A reduction of the tracks can be justified based on: - the fact that the construction activities of C-power have been paused until further notice
and that the planned constructions in the concession zone of Belwind have yet to be started;
- the high similarity within the groups of gully samples and sandbank top samples that was demonstrated in the report for both demersal fish and epibenthos (see paragraph on representativity of reference areas).
In practice, parallel SE to NW tracks will be done on the Thorntonbank (northern concession zone), on the Bank zonder Naam2 and on the Bligh Bank. Samples will be gathered from sandbank tops and neighboring gullies. Additionally, sandbank top samples will be taken in the Thorntonbank reference zone and the southern concession zone, in order to evaluate the effect of the six already constructed windmills.
In this sampling strategy proposal, the number of tracks in the Thorntonbank and Bligh Bank reference zones are limited. However, extra community analyses will be done to examine the suitability of a number of standard monitoring stations (sampled during other monitoring assignments) as representatives for gullies in the vicinity of the concession zones (Figure 27). Furthermore, extra attention will be given to the effects of specific construction activities such as large displacements of sand, after they are reported by the construction companies.
2 The sampling station on the Bank zonder Naam was added in the light of the permit application by Eldepasco for the construction of a 216
megawatt windmill park.

S. Vandendriessche, K. Hostens & J. Wittoeck 148
Next to adapting the sampling strategy, it will be necessary to adapt the sampling technique, and more precisely the length of a fish track and the number of fish tracks. The cause for this specific adaptation is twofold:
1. The installation of cables on the seafloor for the transmission of the generated electricity will impair the passage of the beam trawl and hence the completion of a fish track of 3500m, which is the average length of the monitoring tracks so far.
2. Local effects in the vicinity of the turbines are hard to detect using long tracks, since all fauna over a length of 3500m are pooled in a single catch and information about the small-scale ‘patchiness’ of fauna is largely lost. A shortening of the tracks and an increase in the number of tracks would result in a higher spatial resolution in the analysis (especially in the close vicinity of the turbines), which would decrease the detection level of local changes.
However, before implementing shortened fish tracks in the monitoring program, the representativity of such tracks should be tested experimentally.
Figure 27. Sampling locations of the adapted sampling strategy, with fish tracks in the concession zones of
Thorntonbank and Bligh Bank and their immediate vicinity, and a number of standard ILVO monitoring stations in the northern part of the Belgian Continental Shelf.
7.5.4. Suggestions for future monitoring and analyses
7.5.4.1. Demersal versus semipelagic fish
In the analyses of the data concerning both monitoring areas, the community analyses concerning demersal fish were heavily influenced by the presence and locally high densities of (semi)pelagic and schooling fish species, such as herring, sprat, horse mackerel, whiting, bib and poor cod. Since the dispersion patterns and the extent of the mobility of truly demersal and semipelagic fish differ substantially, it would be advisable to adapt the analyses accordingly during future investigations. Excluding semipelagic fish from the analyses cannot be considered since aggregation effects in the vicinity of turbines can be expected (Grift et al, 2004). It is, however, advisable to complement the beam trawl data with data from other techniques (e.g. use of trammel nets, acoustics, mark-recapture experiments).
7.5.4.2. The need for a broader ecosystem view
Although the impact of windmill parks is being studied at the level of different ecosystem components, a need has been recognized by the involved scientific parties to incorporate a broader ecosystem view regarding the links between macrofauna, epifauna and fish and between the fauna

Chapter 7. Soft substrate epifauna and demersal fish fauna 149
from the artificial hard substrates and the surrounding soft substrates. A number of topics to be addressed are:
- the impact of a closed area on fisheries and vice versa, using data on fishing effort (e.g. VMS data)
- the function of hard substrates such as cobbles and concrete blocks (boulders) as egg deposition sites for fish
- changes in predation pressure and the competition between demersal and pelagic fish, and between epifauna from hard substrates and soft bottoms
- feeding guild structure, based on stomach analyses of a number of species - changes in population structure and length distribution - the impact of the deposition of organic (fecal) matter by hard substrate fauna on the
surrounding soft bottom fauna - shifts in sources and sinks due to varying productivity of the biota of hard substrates and
soft bottoms - impact of different types of artificial hard substrates (material of the poles) - the possibility of fishing in the vicinity of windmills using trammel nets instead of beam
trawl - the impact of noise generated by windmills
The outcome of these research topics would yield a better understanding of the processes underlying the (expected) changes in density, diversity, biomass and community structure resulting from windmill park construction and exploitation.
7.6. Conclusion
When comparing the data of 2005 and 2008, it is clear that the major driving forces of variation between the samples are (1) seasonality, (2) interannual differences, and (3) spatial differences (sandbank tops versus gullies). Significant differences due to the construction of the six present windmills have not been detected so far, and are rather expected to manifest themselves at the end of all construction works. However, this does not imply the absence of any effects. The results rather indicate that the (local) effects of the construction activities so far are subordinate to the natural variability within the ecosystem. Consequently, the detection of possible effects depends primarily on detailed comparisons on a spatial scale (impact stations versus reference stations) per year and season, rather than on long term trends per station (although effects will also manifest themselves eventually in long term analyses). This again stresses the importance of the choice of suitable reference areas, as they have been delineated in the present study, and their preservation throughout the monitoring period of the present and future windmill farms (cf. sand extraction concession in the Thorntonbank reference zone). Furthermore, impact areas and reference areas should be sampled adequately. During the construction activities of the six already present turbines, however, it became clear that sampling epifauna and demersal fish in their vicinity will present a challenge, since cables and other structures on the seafloor prevent the completion of the beam trawl tracks. Consequently, adaptations to the sampling strategy (mainly a shortening of the tracks) will be tested experimentally to evaluate their representativity and will then be implemented.
7.7. References
Clarke KR, Gorley RN (2001) PRIMER v5: user manual/tutorial. PRIMER-E, Plymouth Marine Laboratory, UK, 91pp.
De Maerschalck V, Hostens K, Wittoeck J, Cooreman K, Vincx M, Degraer S (2006) Monitoring van de effecten van het Thornton Windmolenpark op de benthische macro-invertebraten en de visfauna van zachte substraten – Referentietoestand. Eindrapport september 2006. Rapport ILVO-Visserij/Monitoring/2006-02, 136 pp.
Grift RE, Tulp I, Ybema MS, Couperus AS (2004) Base line studies North Sea wind farms: final report pelagic fish. RIVO report CO47/04, 77pp.

S. Vandendriessche, K. Hostens & J. Wittoeck 150
Grove RS, Nakamura M, Sonu CJ (1991) Design and engineering of manufactured habitats for fisheries enhancement. In Artificial habitats for Marine and freshwater fisheries. Eds. W Seaman, LM Sprague. Academic press, ISBN 0-12-634345-4. 285pp.
Hill MO, (1973). Diversity and evenness, a unifying notation and its consequences. Ecology, 54: 427 – 432.
Hostens K, Hillewaert H, Godart JF (2008a) Cruise report Belgica, Campaign ST2008/07. Report ILVO-Belgica 2008/3, 7 pp.
Hostens K, Moulaert I, Hillewaert H (2008b) Cruise report Belgica, Campaign ST2008/05, Part ILVO. Report ILVO-Belgica 2008/2, 14 pp.
Hostens K, Moulaert I, Hillewaert H, Degrendele K (2008c) Cruise report Belgica, Campaign ST2008/22abc. Report ILVO-Belgica 2008/4, 33 pp.
Petersen JK, Malm T, 2006. Offshore windmill farms: threats to or possibilities for the marine environment. Ambio 35(2): 75-80.
Vandendriessche S, Hostens K, Hillewaert H (2008) Voortgangsrapportage Monitoring van de effecten van de windmolenparken op zee op de epi- en visfauna van zachte substraten: jaar-0 Bligh Bank en jaar-1 Thorntonbank. Periode 1 maart 2008 – 15 november 2008. ILVO-Visserij-Windmolens 2008/1, 9 pp.
Wilhelmsson D, Malm T, Öhman C (2006) The influence of offshore windpower on demersal fish. ICES Journal of Marine Science 63: 775-784.