chapter 7 fish species diversity and fish biologykenanaonline.com/files/0075/75231/chap_7.pdf ·...
TRANSCRIPT

229
Chapter 7
Fish Species Diversity and Fish Biology
FISH SPECIES DIVERSITY
ntz (1976) and Latif (1984a) divided the High Dam Lake (i.e. Lake
Nasser and Lake Nubia) into three sections :
1. Northern section (about 250 km from High Dam), extending southwards from
High Dam to Amada or Tushka, is lacustrine.
2. Middle section (southern part of Lake Nasser from Tushka to Daweishat) is
semiriverine during the flood season, and lacustrine during the other seasons.
3. Southern section, extending from Daweishat to Akasha in Lake Nubia, is
riverine all year round.
Therefore, it can be said that Lake Nasser is almost lacustrine except in its
southern part (about 50 km in length), which has riverine characteristics during the
flood season. The Lake is eutrophic in some areas (khors), while it is mesotrophic
to oligotrophic in the main channel (about 80% of the Lake area). Such
characteristics of the Lake affect the fish species diversity which used to be
riverine, leading to the dominance of lacustrine fish.
The surface area as well as the volume of water suitable for fish in the
khors vary very much due to changing of water level. Khors or flooded flat
areas are very different in their characteristics as fish habitats. Thus, it is
worthy to know all the changes in surface and volume of water in these areas at
different water levels. This knowledge is of great interest for fish stock
assessment as well as for the fishery itself. The length of the shoreline and its
slope are important for the development of periphyton and littoral fauna,
which affect greatly the distribution of tilapiine spp., the most economic and
important group of fish, especially abundant on sandy areas. The distribution
E

232
of the benthic fish food organisms is also affected by the morphology of the Lake.
Oligochaetes are important fish food organisms and are mainly restricted to certain
areas. Chironomids are most abundant in shallow water (5-10 m deep). Periphyton
and phytoplankton are mainly restricted to the upper 2-4 m layer. During June and
July, i.e., the period of fast decreasing water level, the periphyton almost
disappears from the shore, being transferred into localities above the water level
forming sometimes real crusts on the dry shore there. This is especially the case in
flat areas, where a decrease of 3-4 m in water level causes the regression of lake
water for 5-10 km distance (e.g. in Khor Kalabsha). During the new fast increase of
the water level, at the beginning of the flood, there is no time for dense periphyton
development. The new green belt of periphyton is observed again only in
December or January.
The distribution of zooplankton is mainly affected by oxygen conditions.
Because of the depth restrictions during the stagnation period associated with lack
of oxygen in the hypolimnion, its amount is affected by the volume of the upper
water layers.
Aquatic snails are very abundant on rocky areas, and almost completely
absent from flat sandy shores. Thus, the distribution of the vector organisms of
Bilharzia is more promoted on rocky than in sandy areas. Generally, the increase of
the water level will increase the surface areas and the volume of the shallow water
zones not only in absolute values but simultaneously their proportion, as
compared with the total surface area of the Lake. Therefore, the uppermost water
level plays the most important role in the productivity of the Lake. In other words,
increasing water level is accompanied by an increase in the productivity of the
Lake. Also, sedimentation of fertile mud especially within the southern region of
Lake Nasser causes an increase in Lake productivity.
Generally, the fish species of new impoundments as Lake Nasser were
known in the original water where the reservoir is created. However, the response
of the "riverine" species to the new environment is different and this results in
marked differences in their relative abundance with lacustrine conditions. In the
early years, mormyrids disappeared from Lake Kainji, but fish of the genus
Citharinus became the most important and predatory fish and cichlids increased
(Lelek & El-Zarka, 1973).
In Lake Nasser, the 57 fish species recorded since 1964 (Table 78) belong to
16 families: Protopteridae, Polypteridae, Characidae, Citharinidae,
Distichodontidae, Mormyridae, Gymnarchidae, Cyprinidae, Clariidae,
Bagridae, Shilbeidae, Mochokidae, Malapteruridae, Cichlidae, Centropomidae
and Tetraodontidae (Latif 1974a). Some fish species are extremely rare. For

232
example, only one specimen of either Protopterus aethiopicus or Polypterus bichir
was caught. Furthermore, along the course of impoundment, some other
species became less common, while others behaved differently. For example,
Chelaethiops bibie and Leptocypris (Barilius) niloticus were common in the
southern region of the Lake in 1970, but at present they are infrequent. Latif (1974a)
pointed out that Eutropius niloticus, Schilbe uranoscopus, S. mystes, Alestes dentex, A.
baremoze, Mormyrus, Labeo spp. and Barbus spp. were more frequent in Lake Nubia
than in Lake Nasser. The reverse is true for Sarotherodon galilaeus, Oreochromis
niloticus, Hydrocynus forskalii, Brycinus nurse and Bagrus spp. Again Schilbe spp. are
more frequent in the southern part of Lake Nubia except during the flood, when
these species become common in flooded areas. On the other hand, Alestes baremoze
and A. dentex are repelled by these waters and thus become more common in the
southern part of Lake Nasser ahead of the flood than elsewhere in other times.
However, A. baremoze migrates upstream for spawning in Lake Nubia (Rashid
1977). Similar migration from natural lakes to connecting rivers for spawning have
been observed elsewhere (Durand & Loubens 1971, Hopson 1972). Nowadays the
most common fish species are 23 (Table, 102). During recent years specimens of
Oreochromis aureus and Tilapia zillii were recorded from the Lake.
In recent years, the Lake fisheries depend only upon a limited number of
species, which are given in the order of importance : Sarotherodon galilaeus,
Oreochromis niloticus, Hydrocynus forskalii, Brycinus nurse, Alestes dentex, A. baremoze,
Lates niloticus, Bagrus bajad, B. docmack, Synodontis serratus, Barbus bynni, Labeo horie,
L. coubie, L. niloticus and Eutropius niloticus. Sarotherodon galilaeus and Oreochromis
niloticus adapted well to the new conditions in the Lake. The most common open-
water species are Alestes spp., Hydrocynus forskalii and Eutropius niloticus. Brycinus
nurse and H. forskalii are also abundant in inshore waters as are Lates niloticus,
Oreochromis niloticus and Sarotherodon galilaeus.
Today, only two fish species : Sarotherodon galilaeus and Oreochromis niloticus
dominate the fish catch from the Lake, contributing about 90-95% of the total fish
production from Lake Nasser. Therefore, Tilapia species have proved to be very
well adapted and suited to the erratic ecosystem of the Lake. Others are
contemporary commercial fish species (i.e. Hydrocynus spp., Synodontis spp., Bagrus
spp., Lates niloticus and Brycinus nurse).
Thus, the species diversity has declined and some species are now restricted
only to the southern region of the Lake, while others have vanished completely
from it.
The khors (85 major) of Lake Nasser provide the most important habitat for
fish to breed and feed, because of their shallowness and abundance of

232
phytoplankton. The open and deep waters of the Lake are relatively poor in fishes
inspite of the fact that they are rich (to a certain extent) in plankton.
Table 78 Fishes recorded in Lake Nasser (Latif 1974a). [Plates 34 –49]
Family Species Local Name
Protopteridae Protopterus aethiopicus Dabib El-Hout Polypteridae Polypterus bichir Abu-Bichir Mormyridae Mormyrops anguilloides Gamhour Petrocephalus bane bane Gelmaya, Arminya Pollimyrus isidori Anooma Gnathonemus cyprinoides Um-Shafika Mormyrus kannume Um-Bowez Mormyrus caschive Boweza Hyperopisus bebe bebe Kalamya-Babeh Gymnarchidae Gymnarchus niloticus Rayah Niliah Characidae Hydrocynus forskalii Kalb El-Samak Hydrocynus vittatus Kalb El-Samak Hydrocynus brevis Kalb El-Samak Alestes dentex Rayah Alestes baremoze Rayah Brycinus nurse Sardina Distichodontidae Distichodus niloticus Lessan El-Bagar Citharinidae Citharinus citharus Kamara Citharinus latus Kamara Cyprinidae Chelaethiops bibie Bebe Labeo victorianus Lebeis Hagari Labeo niloticus Lebeis Nili (abyad) Labeo coubie Lebeis Aswad Labeo horie Lebeis Aswad Garra dembeensis Abu-Kors Barbus bynni Benni Barbus werneri Benni Barbus anema Benni Barbus perince Benni Barbus neglectus Benni Raiamas loati Morgan loti Leptocypris niloticus Bebee–Margan Nili Clariidae Clarias anguillaris Hout, Karmout Clarias gariepinus Hout, Karmout Heterobranchus longifilis Hout, Karmout Heterobranchus bidorsalis Hout, Karmout Schilbeidae Schilbe (Eutropius) niloticus Schilba Schilbe (Schilbe) mystus Schilba Schilbe (Schilbe)uranoscopus Schilba-Arabi Siluranodon auritus Schilba Bagridae Bagrus bajad Bayad Bagrus docmak Docmack Chrysichthys auratus Gurgar

233
Chrysichthys rueppelli Gurgar Schami Clarotes laticeps Abu-Meseka Auchenoglanis biscutatus Halouf Table 78 (cont.)
Auchenoglanis occidentalis Halouf Mochokidae Synodontis schall Schall Synodontis serratus Schall Synodontis clarias Schall Mochocus niloticus Mekawkas Nili Chiloglanis niloticus Kiloglans Malapteruridae Malapterurus electricus Rahaad Cichlidae Sarotherodon galilaeus Bolti Galili Oreochromis niloticus Bolti Nili Oreochromis aureus* Bolti Azrak Tilapia zillii Bolti Akhadar Centropomidae Lates niloticus Samous, Ishr-Bayad Tetraodontidae Tetraodon linneatus Fahaka
* This species was recently recorded in 1996 (SECSF).
BIOLOGY OF IMPORTANT FISH SPECIES
The study of the biology of Lake Nasser fishes was carried out by various
investigators: (Latif 1974b, Latif & Rashid 1972, 1983, Latif & Abdel-Azim 1973b,
Abdel-Azim 1974, 1991a and b, Latif et al. 1979, Talat 1979, Khallaf & Latif 1987,
Latif & Khallaf 1987, Yamaguchi et al. 1990, Agyapi 1992a, Mohamed, I. 1992b,
Mohamed, S. 1994, Adam 1994, 1995a & b, 1996a & b, Mekkawy et al. 1994,
Mekkawy & Mohamed 1995, Shenouda et al. 1995, Mekkawy, 1996, who studied
Oreochromis niltoicus and Sarotherodon galilaeus - Cichlidae); (Latif 1974b, Latif et
al.1979, Massoud et al. 1985, who studied Hydrocynus forskalii - Characidae); (Latif
1974b, Rashid, 1977, Latif et al. 1979, who studied Alestes spp. - Characidae); (Latif
1974b, Latif & Khallaf 1974a, El-Etreby 1976,1982, Latif et al. 1979, who studied Nile
perch Lates niloticus - Centropomidae); (Latif 1974b, Latif et al. 1979, 1984a-c, Abbas
1982, 1986, Mahmoud & Mekkawy 1991, Mekkawy & Mahmoud 1992a, who
studied Synodontidae); (Latif 1974b, Khallaf 1977, Latif et al. 1979, Latif & Khallaf
1996, who studied Schilbeidae); (Latif 1974b, Latif et al. 1979, Khallaf 1985, 1988;
Mekkawy 1997 a and b, Shenouda et al. 1994a and b, who studied Bagridae); (Latif
1974b, Latif et al. 1979, Abdel-Azim 1982, Mekkawy & Mahmoud 1992b, Shenouda
1992 who studied Cyprinidae) and Latif 1974b, Latif et al. 1979, El-Etreby 1985,
Mekkawy 1990, 1996, Aly 1993, who studied Mormyridae).
When referring to the fisheries of Lake Nasser it is inevitable to mention
some of the relevant aspects on the biology of the most important fish species
which may be the basis of development and management of lake fisheries.
1. FOOD AND FEEDING HABITS
The work of Latif et al. (1979) was the only complete study on the food and
feeding habits of the main fish species inhabiting Lake Nasser, hence reference to the
results of their work will be reviewed together with recent studies.

234
Analysis of gut contents of different species of fishes is considered one of
the most important methods to estimate the selectivity of natural food and the
ecological niche of various species. Furthermore, food analysis is used to determine the natural diet of species concerned and the extent of its availability in its natural habitat. Lake Nasser is rich in various food items including: periphyton, phytoplankton, zooplankton, insect larvae mainly chironomids and molluscs (gastropods and bivalves), oligochaetes, freshwater shrimps and many others). According to their feeding habits fish species inhabiting Lake Nasser can be divided into :
1. Periphyton-plankton feeders : mainly O. niloticus and S. galilaeus
2. Zooplankton-insect feeders : Alestes spp.
3. Omnivores : Labeo spp., Barbus spp. Synodontis sp., schilbeids and mormyrids.
4. Carnivores (piscivores): Lates niloticus, Hydrocynus spp., Bagrus spp. Clarias spp. and Heterobranchus spp.
The major food items and their percentage occurrence in the commercial fish species from Lake Nasser are shown in Table 79 (p. 238).
Oreochromis niloticus. Before the construction of Aswan High Dam and during the early years of filling, this species was the major tilapiine sp. contributing a high percentage of the total yield. Oreochromis niloticus feeds mainly on plant material: Cyanophyta (Oscillatoria, Lyngbya, Merismopedia, Dactyloccopsis, Anabaena, Microcystis spp. etc.) composing 30% of the total food and occurred in 90% of the fish (Latif et al. 1979). Diatoms (Melosira, Navicula, Cymbella, Synedra spp. etc.) formed about 25% and were recorded in 80% of the guts of examined fish. Chlorophyta (Cosmarium, Scendesmus, Crucigenia, Volvox spp. etc.) comprised 22% of the diet and were found in 80% of the guts of fish. The latter authors pointed out that higher plants formed only 7% and occurred in 40% of the fish. Copepods (e.g. Cyclops spp.) and Cladocera (e.g. Daphnia and Bosmina spp.) formed 15% of the food and were found in 20% of the fish. Also, the fish were seen grazing on periphytes (Latif et al. 1979). Abdel-Azim (1991b) found that the percentage composition of copepods, rotifers and cladocerans eaten by O. niloticus at different localities of Lake Nasser during early spring (1988) were 4.6, 0.05 and 1.25% respectively while during late summer it was 3.89; 0.21 and 1.88%. When considering the length of O. niloticus Abdel-Azim (1991a) pointed out that zooplankton constituted about 4.0, 6.9 and 10.4% of the stomach contents of lengths 3.9-9, 9.1-20 and 20.1-45 cm respectively. The food of fry of O. niloticus and S. galilaeus consisted mainly of nauplius larvae, copepodite stages of Copepoda, cladocerans and rotifers, in addition to other food items (Abdel-Mageed 1995). Mohamed, I. (1992b) mentioned that O. niloticus subsists mainly on Dinophyceae (Peridinium and Ceratium spp.), diatoms (Melosira, Navicula, Cymbella spp. etc.), blue-green algae (Merismopedia,

235
Lyngbya and Microcystis spp.), green algae (Scendesmus and Staurastrum spp.) (Table 80).
Sarotherodon galilaeus. The gut contents of S. galilaeus included more plant food than animal material. Latif et al. (1979) mentioned that diatoms and Chlorophytes were common in 90% of the fish, and they formed 40 % of the diet, while cyanophytes were less frequent and were found in small quantities (15%). Zooplankton organisms, cladocerans (Daphnia and Bosmina spp.) were rarely observed in the guts. Periphytes composed 40% of the food and were recorded in 25% of the guts of fish examined. Zooplankton (mainly copepods and cladocerans) comprised only 5% of the food and appeared in 15% of the fish (Latif et al. 1979). It is worth mentioning that S. galilaeus is nowadays the major tilapiine species in the total annual fish production (i.e. more than 60% of the annual catch).
Brycinus nurse. The percentage occurrence and composition of various food items in the guts of B. nurse (Figs. 116 and 117) indicates that insect larvae constitute the major food item (49%), followed by gastropods (25%), cladocerans (17%), copepods (9%), decapods (0.2%) and others (0.2%) (Latif et al. 1979).
Alestes baremoze. This species feeds mainly on insects which constitute 41.4% of the gut contents followed by cladocerans (21.9%), phytoplankton (18.5%), gastropods (9.8%) and copepods (8.4%) (Latif et al. 1979 - Fig. 118).
Schilbe (Eutropius) niloticus. This species feeds mainly on insect larvae (Chironomidae) and to a lesser extent on Odonata, fishes, water beetles. Worms, freshwater shrimps, bivalves were much less frequent (Latif et al. 1979). Fishes more than 23 cm long may feed mainly on other fish species e.g. Alestes spp.
Schilbe uranoscopus. Latif et al. (1979) mentioned that the gut contents of Schilbe uranoscopus included small fishes (Hydrocynus spp. and Alestes spp.), chironomid larvae and placopteran nymphs. Cyclops and Daphnia were accidentally ingested, apparently as the fish secures its food from surface waters.
Synodontis spp. They are omnivorous fish, utilizing animal food (fish, worms, molluscs and insects) and some food of plant origin taken incidentally when securing the food from the bottom or the crevices between stones. Both phyto- and zooplankton are occasionally taken by the fish while scooping its insect diet (Latif et al. 1979).
Labeo and Barbus spp. Latif et al. (1979) mentioned that Labeo and Barbus species are omnivorous, feeding mainly on diatoms, cyanophytes, worms and plant material.On analysing the gut contents of Labeo spp. (Labeo horie, L. coubie, L. niloticus) and Barbus bynni, Abdel-Azim (1982) found that they contain inorganic particles (sand and mud), aquatic plants (macrophytes and epiphytes), phytoplankton (diatoms, cyanophytes and chlorophytes), worms

236
and insect larvae. This food pattern denotes that the above-mentioned
Fig
. 116
Perc
en
tag
e o
ccu
rren
ce o
f d
iffe
ren
t fo
od
ite
ms
in t
he
gu
ts o
f B
ryci
nu
s n
urs
e (L
ati
f et
al.
19
79
).
Fig
. 117
Pe
rcen
tag
e c
om
po
siti
on
of
dif
fere
nt
foo
d i
tem
s
in t
he
gu
ts o
f B
ryci
nu
s n
urs
e (L
ati
f et
al.
19
79
).

237
Fig. 118 A: Percentage volume of different food items in the guts of Alestes
baremoze, B: Frequency occurrence of different food items in the guts of A.
baremoze (Latif et al. 1979).
238
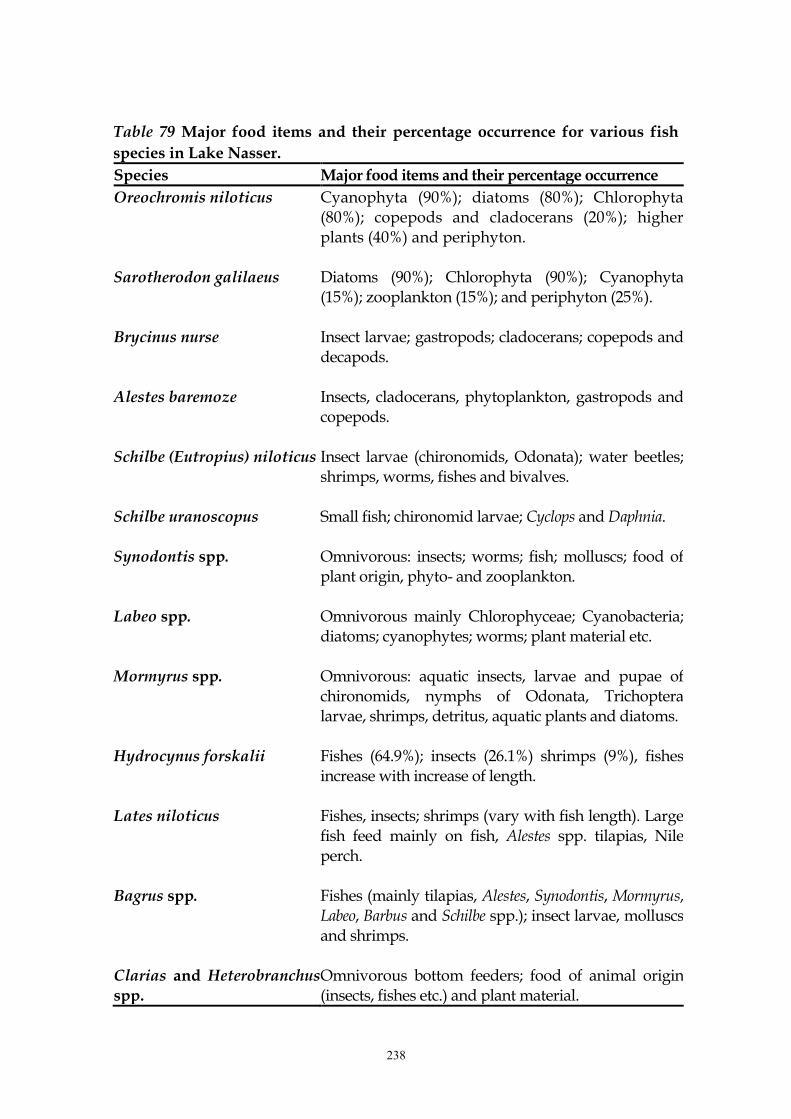
Table 79 Major food items and their percentage occurrence for various fish
species in Lake Nasser.
Species Major food items and their percentage occurrence
Oreochromis niloticus Cyanophyta (90%); diatoms (80%); Chlorophyta (80%); copepods and cladocerans (20%); higher plants (40%) and periphyton.
Sarotherodon galilaeus Diatoms (90%); Chlorophyta (90%); Cyanophyta (15%); zooplankton (15%); and periphyton (25%).
Brycinus nurse Insect larvae; gastropods; cladocerans; copepods and decapods.
Alestes baremoze Insects, cladocerans, phytoplankton, gastropods and copepods.
Schilbe (Eutropius) niloticus Insect larvae (chironomids, Odonata); water beetles; shrimps, worms, fishes and bivalves.
Schilbe uranoscopus Small fish; chironomid larvae; Cyclops and Daphnia.
Synodontis spp. Omnivorous: insects; worms; fish; molluscs; food of plant origin, phyto- and zooplankton.
Labeo spp. Omnivorous mainly Chlorophyceae; Cyanobacteria; diatoms; cyanophytes; worms; plant material etc.
Mormyrus spp. Omnivorous: aquatic insects, larvae and pupae of chironomids, nymphs of Odonata, Trichoptera larvae, shrimps, detritus, aquatic plants and diatoms.
Hydrocynus forskalii Fishes (64.9%); insects (26.1%) shrimps (9%), fishes increase with increase of length.
Lates niloticus Fishes, insects; shrimps (vary with fish length). Large fish feed mainly on fish, Alestes spp. tilapias, Nile perch.
Bagrus spp. Fishes (mainly tilapias, Alestes, Synodontis, Mormyrus, Labeo, Barbus and Schilbe spp.); insect larvae, molluscs and shrimps.
Clarias and Heterobranchus spp.
Omnivorous bottom feeders; food of animal origin (insects, fishes etc.) and plant material.

239
Table 80 Gut contents of Oreochromis niloticus from Khor El Ramla
(Mohamed, I. 1992b).
Phytoplankton Attached algae Zooplankton
Chlorophyta Bacillariophyta Chlorophyta Cladocera
Volvox spp. Cyclotella spp. Cladophora spp. Bosmina spp.
Pediastrum spp. Synedra spp. Oedogonium spp. Diaphanosoma spp.
Ankistrodesmus spp. Amphora spp. Spirogyra spp. Daphnia spp.
Scendesmus spp. Cymbella spp. Cyanophyta Ceriodaphnia spp.
Cosmarium spp. Cocconeis spp. Oscillatoria spp. Rotifera
Coelastrum spp. Navicula spp. Phormidium spp. Keratella spp.
Cyanophyta Diatoma spp. Lyngbya spp. Ostracoda
Chroococcus spp. Pyrrophyta Bacillariophyta Cypris spp.
Aphanocapsa spp. Peridinium spp. Melosira spp. Copepoda
Microcystis spp. Ceratium spp. Cyclops spp.
Merismopedia spp.
Table 81 Occurrence and ratio of various food items in the guts of Lates niloticus
according to different length groups (Shrimps = 100%) (Latif et al. 1979).
Length group (cm)
Occurrence (Shrimps as base)
% Ratio
Shrimps Insects Fish Shrimps Insects Fish
10-14.9 100 220 13.3 1 2.2 0.13
15-19.9 100 416.8 154.2 1 4.2 1.5
20-29.9 100 85 86.4 1 0.8 0.9
>30 100 29 85.4 1 0.3 0.8
fishes secure food materials from the bottom or among aquatic plants. The
different food components generally occur at varying degrees in the different
periods of the year (Abdel-Azim 1982). Abdel-Mageed (1995) found that the
stomach contents of adult Labeo spp. contained chironomid larvae, nematode
worms, copepods in addition to other food items.
Mormyrus spp. These fishes feed on aquatic insects, freshwater shrimps,
annelids and to a less extent fishes (Latif et al. 1979). Aly (1993) mentioned that
Mormyrus spp. feed mainly on larvae and pupae of chironomids, nymphs of
Odonata, Corixidae (water bugs), Cardina nilotica, larvae of Trichoptera,
Cladocera, detritus particles, in addition to aquatic plants and diatoms.
Hydrocynus forskalii. This species is carnivorous feeding on fishes (% occurrence
64.9), insects (% occurrence 26.1) and freshwater shrimps (% occurrence 9.0) (Latif
et al. 1979). The percentage occurrence of food items of H. forskalii varies according
to different lengths and during different seasons. The percentage occurrence of
242
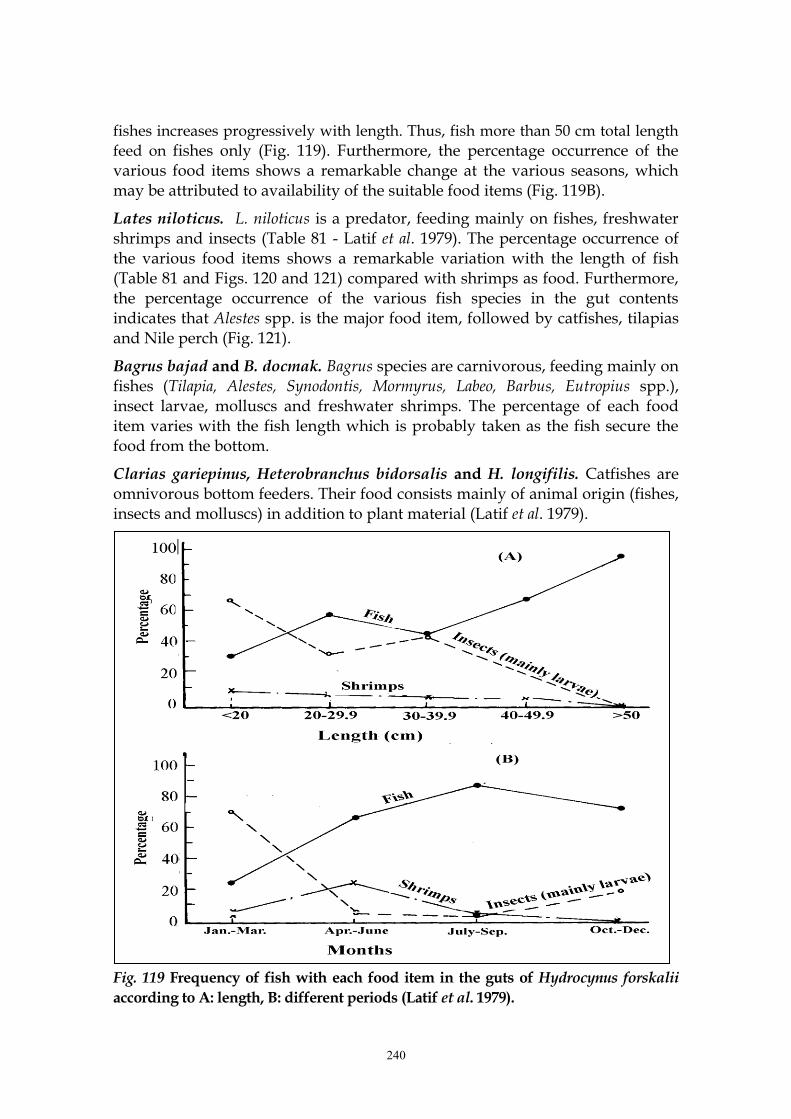
fishes increases progressively with length. Thus, fish more than 50 cm total length
feed on fishes only (Fig. 119). Furthermore, the percentage occurrence of the various food items shows a remarkable change at the various seasons, which may be attributed to availability of the suitable food items (Fig. 119B).
Lates niloticus. L. niloticus is a predator, feeding mainly on fishes, freshwater shrimps and insects (Table 81 - Latif et al. 1979). The percentage occurrence of the various food items shows a remarkable variation with the length of fish (Table 81 and Figs. 120 and 121) compared with shrimps as food. Furthermore, the percentage occurrence of the various fish species in the gut contents indicates that Alestes spp. is the major food item, followed by catfishes, tilapias and Nile perch (Fig. 121).
Bagrus bajad and B. docmak. Bagrus species are carnivorous, feeding mainly on fishes (Tilapia, Alestes, Synodontis, Mormyrus, Labeo, Barbus, Eutropius spp.), insect larvae, molluscs and freshwater shrimps. The percentage of each food item varies with the fish length which is probably taken as the fish secure the food from the bottom.
Clarias gariepinus, Heterobranchus bidorsalis and H. longifilis. Catfishes are omnivorous bottom feeders. Their food consists mainly of animal origin (fishes, insects and molluscs) in addition to plant material (Latif et al. 1979).
Fig. 119 Frequency of fish with each food item in the guts of Hydrocynus forskalii
according to A: length, B: different periods (Latif et al. 1979).

242
Fig. 120 Bimonthly frequency occurrence of different food items in the guts of
young and adult Lates niloticus (Latif et al 1979).
Fig. 121 Food of Lates niloticus, A: frequency of different food items, B: percentage
occurrence of different fish species in gut contents (Latif et al. 1979).
Month Month
Per
cen
tag
e
Per
cen
tag
e

242
2- AGE AND GROWTH For the development and management of the fisheries of Lake Nasser a
knowledge of the biological parameters of the various commercial fish species is of
utmost importance. Among these parameters are the age, growth, length weight
relationship as well as the calculated lengths and weights of the different age
groups. Hence, in the present study reference will be given to the results of various
investigators working on the biology of fish inhabiting Lake Nasser (Abdel-Azim
1974, Latif et al. 1979- 12 species, Agaypi (1992a) Tilapia species, Aly 1993 -
mormyrid species, and Adam 1994 - Tilapia species).
Length-weight Relationship
Oreochromis niloticus (Fig. 122)
Log W = -1.6193 + 2.9723 Log. L. (1965)
Log W = -1.4961 + 2.8773 Log. L. (1966)
Log W = -1.6891 + 3.0230 Log. L. (1970)
W = 0.165 x 10⁻² L 2.60 1982 Agaypi (1992a)
LogW = -4.2343 + 2.9396 Log. L (1989/1990) Adam (1994)
W = 2.466 x 10⁻² L 2.9310 (1989/1990) Mekkawy et al. (1994)
W = 0.0736 x 10⁻² L 2.8422 (1996) SECSF (1996)
Sarotherodon galilaeus (Fig. 123)
Log W = -1.7899 + 3.1240 Log L. (1972/1973) Abdel-Azim (1974)
W = 0.165 x 10⁻² L 2.6 (1982) Agaypi (1992a)
Log W = -3.7929 + 2.7792 Log L. (1989/1990) Adam (1994)
W = 3.145 x 10⁻² L 2.8687 (1989/1990) Mekkawy & Mohamed (1995)
W = 0.2534 x 10⁻² L 2.4490 (1996) SECSF (1996)
Brycinus nurse
Log W = - 4.8230 + 3.0925 Log L. (SL in mm) Alestes baremoze
Log W = - 1.9436 + 3.0702 Log L. (SL in cm) Hydrocynus forskalii
Log W = - 2.0143 + 3.0644 Log L. (SL in cm) Lates niloticus
Log W = - 4.3870 + 2.907 Log L. (SL in mm) Eutropius niloticus
Log W = - 5.2825 + 3.1602 Log L. (SL in mm) Labeo coubie
Log W = - 1.4130 + 2.9059 Log L. (SL in cm) Labeo horie
Log W = - 1.3617 + 2.8661 Log L. (SL in cm) Labeo niloticus
Log W = - 1.881 + 3.1472 Log L. (SL in cm) Labeo forskalii
Log W = - 1.4661 + 2.8820 Log L. (SL in cm)
}Abdel-Azim (1974)

243
Barbus bynni
Barbus bynni
Fig
. 12
3 L
en
gth
-we
igh
t re
lati
on
ship
of
S.
gali
laeu
s (A
da
m
19
94
).
F
ig.
122
Len
gth
-weig
ht
rela
tio
nsh
ip o
f O
.nil
oti
cus
(Ad
am
19
94
an
d 1
99
6b
).

244
Log W = - 1.7230 + 3.0805 Log L. (SL in cm)
Bagrus docmak and Bagrus bajad (El-Badawy 1991)
Log W = - 4.4779 + 2.8802 Log L.
Log W = - 4.3332 + 2.7858 Log L.
for Bagrus docmak.
for Bagrus bajad.
The value of the exponent, being 2.88 and 2.78 for B. docmak and B. bajad
respectively, shows that growth of these two species is allometric (Ricker 1975).
Mormyrus kannume (Aly 1993 - Fig. 124).
Log W = - 5.0332 + 3.0145 Log L.
Mormyrus caschive (Aly 1993 - Fig. 125).
Log W = - 4.83857 + 2.9359 Log L.
Fig. 124 Length-weight relationship of Mormyrus kannume from Lake Nasser (Aly 1993).

245
Fig. 125 Length-weight relationship of Mormyrus caschive (Aly 1993).
Condition factor
Adam (1994 and 1996b) calculated the condition factor of O. niloticus and S.
galilaeus in Lake Nasser (Fig. 126). It is obvious that the condition factor of O.
niloticus for all length groups ranged between 3.90 and 4.45. The values of
condition factor did not vary significantly with the increase in length and the
fluctuations in these values have no particular trend. In case of S. galilaeus, the
condition factor for all length groups ranged between 4.36 and 5.47 (Fig. 126). It is
obvious that the condition factor values mostly decrease with the increase of body
length.
Growth in length
Due to the fact that the life span of fish species is variable, fishes of Lake
Nasser attain different age groups. Latif et al. (1979) calculated the standard length
for the different age groups of some fish species from Lake Nasser (Fig. 127). It is
obvious that Lates niloticus has the highest length value (i.e. 130 cm). On the other
hand, Brycinus nurse has the lowest length value. The length attained by the oldest
age group of a given species may be attained by another one at a younger age (Latif
et al. 1979).
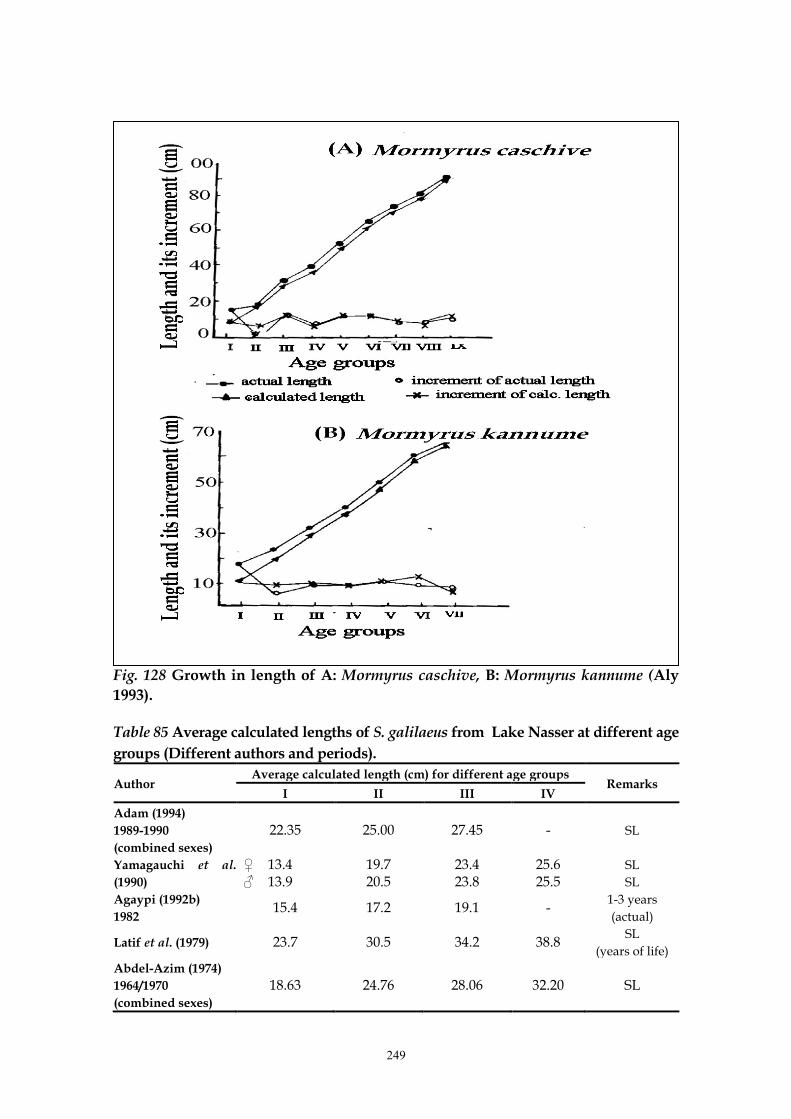
Aly (1993) calculated the standard lengths and increments for the different
age groups of both Mormyrus caschive and M. kannume (Fig. 128). Adam (1994)
calculated the standard lengths and increments for the different age groups of both
Oreochromis niloticus and Sarotherodon galilaeus (Tables 82 and 83 and Fig. 129). The
average actual standard lengths of O. niloticus for the successive age groups I to IV
were 24.10, 29.95, 35.40, and 39.15 cm, while the calculated lengths were 17.26,
25.82, 32.15, and 37.72 cm respectively (Table 82). For S. galilaeus the average
standard lengths for the successive age groups I to III were 22.35, 25.00 and 27.45

246
cm, however, the average calculated lengths were 16.16, 22.17 and 25.82 cm
respectively (Table 83). These values are in accordance with those previously
recorded in 1982 by Agaypi (1992a) who showed that O. niloticus attains 21.8 cm
and 420 g, 26.3 cm and 500 g, 31.6 cm and 1100 g. and 39 cm and 2000 g at the first
to fourth year of life, while S. galilaeus attains 20.6 cm and 400 g, 22.8 cm and 480 g
and 25.2 cm and 700 g at age 1-3 years. The low values of lengths as given by back
calculation may be attributed to the fact that they indicate the length of fish when
the annual ring is formed.
The average calculated lengths of O. niloticus and S. galilaeus for different
age groups, recorded by different authors are presented in Tables 84 and 85,
respectively. It is obvious that, in all cases, the growth rate of O. niloticus is higher
than that of S. galilaeus. Furthermore, Agaypi (1992a) in his studies on the growth
of both Tilapia species collected during 1982 from six different fishing areas in the
Lake, found that fish of both species caught from the southern region are larger in
size (length and weight) than those collected from the northern areas.
Comparing the growth rates at different years of life of O. niloticus in Lake
Nasser (Table 84) suggests that sizes recorded during 1989/1990 (Adam 1994) are
much less than those recorded in 1970 (Abdel-Azim 1974) i.e. a decrease of the
growth rate in recent years.
Table 82 Actual and calculated lengths of O. niloticus for different age
groups (Adam 1994).
Age group Actual standard length (cm) Calculated length (cm) No. of fish
examined Range Average Increment Average Increment
I 18-29 24.10 24.10 17.26 17.26 276 II 24-36 29.95 5.85 25.82 8.56 520
III 28-40 35.40 5.45 32.15 6.33 405
IV 34-45 39.15 3.75 37.72 5.57 73
Table 83 Actual and calculated lengths of S. galilaeus for different age
groups (Adam 1994).
Age group Actual standard length (cm) Calculated length (cm) No. of fish
examined Range Average Increment Average Increment
I 14-26 22.35 22.35 16.16 16.16 732
II 20-31 25.00 2.65 22.17 6.01 502
III 24-33 27.45 2.45 25.82 3.65 48
The growth rate of O. niloticus and S. galilaeus collected from different water
bodies is presented in Tables 86 and 87 which show that the growth rate of Tilapia
spp. in Lake Nasser is higher than that from other lakes, except for O. niloticus at
Jebel Aulia (Sudan), where the growth rate is higher than that in Lake Nasser in the
first and second years of life, and the values are nearly equal in the third year,
while in the fourth year, the growth rate of fish in Lake Nasser is higher.

247
Fig. 126 Variation of condition factor in O. niloticus and S.galilaeus (Adam 1994).

248
Fig. 127 Calculated standard length for different age groups of some fish species
(Latif et al. 1979).* Lates niloticus attains a length of 130 cm, at age group XV.
Table 84 Average calculated lengths of O. niloticus from Lake Nasser at different age
groups (Different authors and periods).
Author Average calculated length (cm) for different age groups
Remarks I II III IV
Adam (1994)
1989-1990
(combined sexes)
17.26 25.82 32.15 37.72 SL
Yamagauchi et al.
(1990)
♀ 16.8
♂ 17.3
25.2
25.4
30.1
30.9
32.9
34.7
SL
SL
Agaypi (1992a)
1982 21.8 26.2 31.6 39.0
1-4 years
(actual)
Abdel-Azim (1974)
1964/1970
(combined sexes)
20.0 29.6 35.5 40.2 SL
*
249
Fig. 128 Growth in length of A: Mormyrus caschive, B: Mormyrus kannume (Aly
1993).
Table 85 Average calculated lengths of S. galilaeus from Lake Nasser at different age
groups (Different authors and periods).
Author Average calculated length (cm) for different age groups
Remarks I II III IV
Adam (1994)
1989-1990
(combined sexes)
22.35 25.00 27.45 - SL
Yamagauchi et al.
(1990)
♀ 13.4 ♂ 13.9
19.7 20.5
23.4 23.8
25.6 25.5
SL
SL
Agaypi (1992b)
1982 15.4 17.2 19.1 -
1-3 years
(actual)
Latif et al. (1979) 23.7 30.5 34.2 38.8 SL
(years of life)
Abdel-Azim (1974)
1964/1970
(combined sexes)
18.63 24.76 28.06 32.20 SL
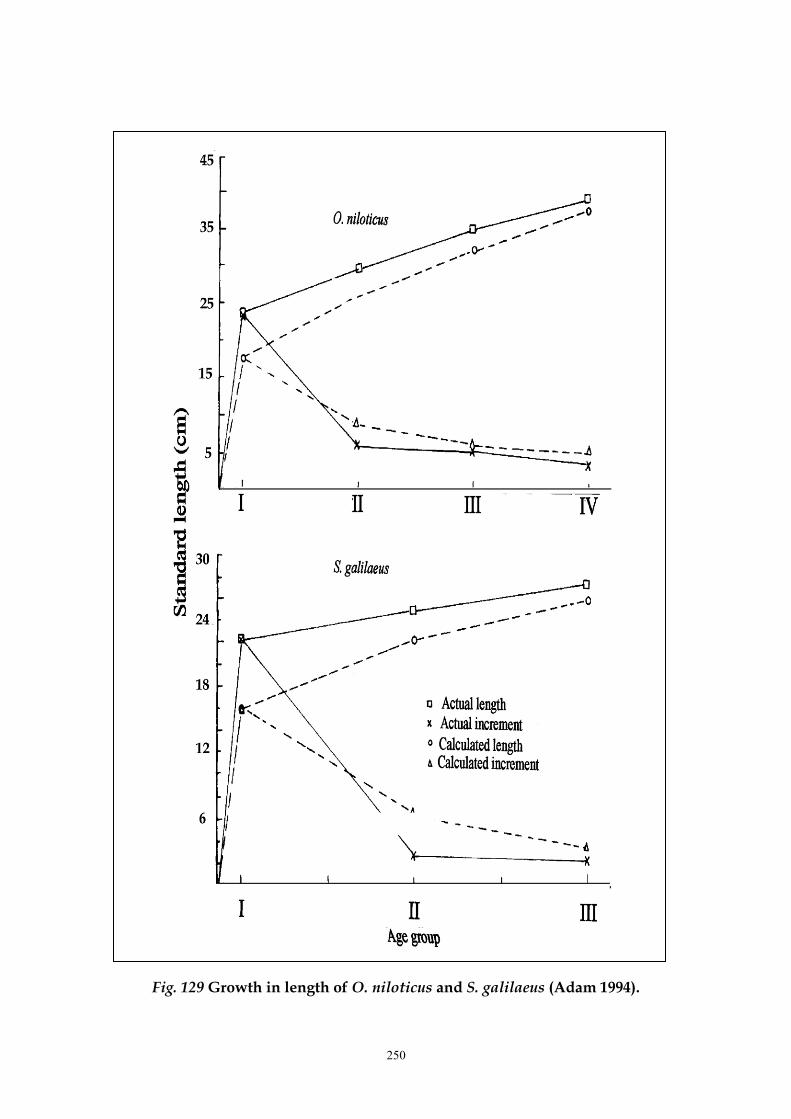
252
Fig. 129 Growth in length of O. niloticus and S. galilaeus (Adam 1994).

252
Growth in weight
The length-weight equations and the calculated lengths of the most
important fish species in Lake Nasser, were used to obtain the calculated weights
of different age groups. The calculated weights for different age groups of 14 fish
species are presented in Table 88 (Latif et al. 1979 and Aly 1993, Fig. 130). From
their results, it is obvious that the difference between different fish species, even
those belonging to the same genus is more prominent with weight than with
length. The results indicate that Oreochromis niloticus of age group IV has a
calculated weight of 2836 g as compared with 1344 g for Sarotherodon galilaeus (i.e.
more than twice).
Table 86 Growth rate of O. niloticus in different localities.
Lake and author Calculated length (cm) of O. niloticus at the end of each year
1 2 3 4 5
Lake Nasser (Adam 1994) 17.26 25.82 32.15 37.72 --
Lake Nasser (Latif et al. 1979) 26.0 37.8 45.5 50.8 -
Lake Maryut (Jensen 1958) 9.20 20.50 25.70 28.80 -
Lake Maryut (El Zarka et al. 1970) 8.40 21.20 29.20 32.70 37.60
Beteha Area, Syria
(El Bolock & Koura 1961) 9.90 16.40 20.40 27.50 --
Jebel Aulia, Sudan (Mahdi 1972) 24.40 28.80 32.00 36.00 43.70
Lake Tchad (Fryer & Iles 1972) 13.4 22.9 28.0 31.8 35.2* *Actual total length at age (years)
Table 87 Calculated total lengths (cm) of Sarotherodon galilaeus in different
localities.
Lake and author Years of Life
1 2 3 4 5 6
Lake Nasser (Adam 1994) (1989-1990)
22.35 25.0 27.45 -- -- Standard
length
Lake Nasser
(Latif et al. 1979) 23.7 30.5 34.2 38.8 -- --
Lake Maryut (Jensen 1958)
8.3 21.6 25.3 27.7 28.1 29.8
Lake Tiberias (Ben Tuvia 1960)
13.8 22.7 37.4 31.5 32.5 34.1
Lake Tchad (Blache et al. 1964)
13.2 22.3 27.0 30.2 31.4 --
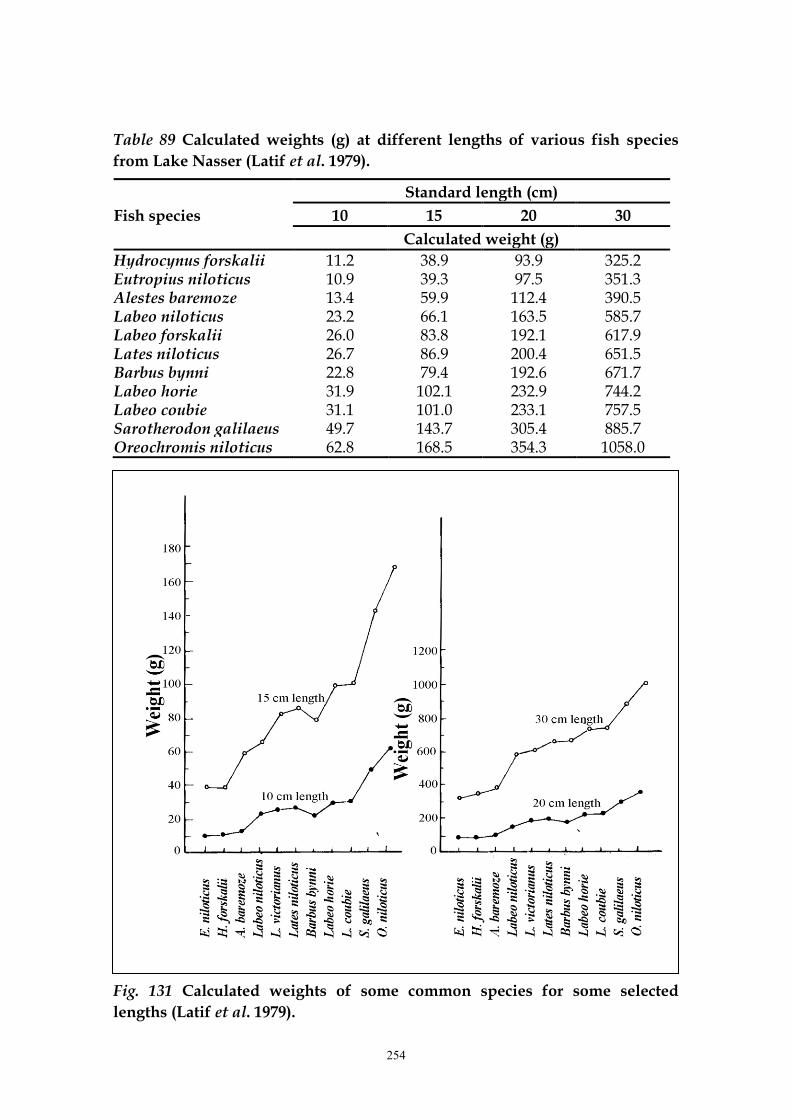
On the basis of the aforementioned length-weight relationships, Latif et al.
(1979) calculated the weight of fishes for some selected lengths (Table 89 and
Fig.131).

252
From the previous results it is obvious that some fish species are slender (as
Eutropius niloticus, Hydrocynus forskalii, Alestes baremoze), others have heavier bodies
(as Labeo niloticus, L. forskalii, Lates niloticus and Barbus bynni) and still others as
Sarotherodon galilaeus and Oreochromis niloticus have the heaviest weight (Latif et al.
1979).
The calculated weights and the annual increments of growth in weight of
Bagrus docmak and B. bajad for different age groups were recorded by El-Badawy
(1991) (Tables 90 and 91). There is a significant difference in growth between
Bagrus bajad and its relative Bagrus docmak which grows faster and lives for a longer
age (Tables 90 and 91).
Adam (1994) calculated the weights and the annual increments of growth in
weights of Oreochromis niloticus and Sarotherodon galilaeus for different age groups
(Tables 92 and 93 and Fig. 132). In case of O. niloticus, the growth increment in
weight for age-group I was the lowest (in contrast to length). The growth increment
increased progressively in the older ages up to age group IV. It is obvious that the
average weights of O. niloticus were higher than those of S. galilaeus (Tables 92 and
93). For S. galilaeus, the calculated weight of age group I was nearly equal to that of
O. niloticus; while those of age groups II and III were lesser than the calculated
values for the same age groups of O. niloticus. The growth increment in weight of S.
galilaeus was the lowest for age group I, then increased at age-group II and
decreased at age group III. When comparing the calculated lengths of O. niloticus
and S. galilaeus given by Latif et al. (1979) and those found by Adam (1994) (Tables
86 and 87) it can be seen that calculated lengths of both species at various age
groups during 1994 were lesser than those at 1974 suggesting a decrease in growth
during the last two decades.
Fig. 130 Growth in weight of A: Mormyrus caschive, B: Mormyrus kannume (Aly
1993).

253
T
ab
le
88
Calc
ula
ted
w
eig
hts
(g
) o
f v
ari
ou
s fi
sh
speci
es
fro
m
Lak
e
Nass
er
at
dif
fere
nt
ag
e
gro
up
s
(Lati
f et
al.
(1979).
Ag
e G
rou
p
X
2040
0*
- -
- -
- -
- -
*Aly
(1
99
3),
**
L.
nil
otic
us
att
ain
s 1
5 y
ears
old
an
d 5
0.7
5 k
g b
od
y w
eig
ht.
IX
- -
- -
7061
.9
- -
- -
VII
I
8271
7232
1150
5109
.0
- -
- -
VII
977.
0
5404
6736
2556
6826
6232
6250
3779
.8
2422
VI
360.
0
705.
97
4395
.0
4922
.5
2215
5429
4801
6098
2669
.1
1905
.6
V
34.5
2
1332
.0
221.
0
497.
49
3335
.0
3569
.3
1861
3864
3181
.3
4598
1446
.75
990.
5
IV
2836
.00
1344
.0
19.5
2
924.
2
185.
0
265.
18
2260
.5
2107
.7
1262
2615
2238
.2
3611
647.
6
477
III
2209
.0
943.
5
10.8
1
624.
2
105.
0
100.
8
134.
2
1168
731.
6
1638
1180
.9
2350
376.
8
219
II
1301
.0
674.
9
4.79
274.
5
60.5
27.2
7
540.
3
521.
9
331.
1
708.
2
584.
3
850
73.5
68
I 412.
4
315.
5
1.21
95.5
13.0
3.37
139.
9
156.
1
815
172.
2
210.
5
300
59.6
5
11
Fis
h s
peci
es
Ore
och
rom
is n
ilo
ticu
s
Sa
roth
ero
do
n g
ali
laeu
s
Bry
cin
us
nu
rse
La
beo
fo
rsk
ali
i
Eu
tro
piu
s n
ilo
ticu
s
Ale
stes
ba
rem
oze
La
beo
nil
oti
cus
Ba
rbu
s b
yn
ni
Hy
dro
cyn
us
fors
ka
lii
La
beo
ho
rie
La
beo
co
ub
ie
La
tes
nil
oti
cus*
*
Mo
rmy
rus
casc
hiv
e *
Mo
rmy
rus
ka
nn
um
e *
254
Table 89 Calculated weights (g) at different lengths of various fish species
from Lake Nasser (Latif et al. 1979).
Fish species
Standard length (cm)
10 15 20 30
Calculated weight (g)
Hydrocynus forskalii 11.2 38.9 93.9 325.2 Eutropius niloticus 10.9 39.3 97.5 351.3 Alestes baremoze 13.4 59.9 112.4 390.5 Labeo niloticus 23.2 66.1 163.5 585.7 Labeo forskalii 26.0 83.8 192.1 617.9 Lates niloticus 26.7 86.9 200.4 651.5 Barbus bynni 22.8 79.4 192.6 671.7 Labeo horie 31.9 102.1 232.9 744.2 Labeo coubie 31.1 101.0 233.1 757.5 Sarotherodon galilaeus 49.7 143.7 305.4 885.7 Oreochromis niloticus 62.8 168.5 354.3 1058.0
Fig. 131 Calculated weights of some common species for some selected
lengths (Latif et al. 1979).

255
Table 90 Actual and calculated weights and increments of Bagrus docmak for
different age-groups (El-Badawy 1991).
Age-group Actual weight (g) Calculated weight (g)
% weight from total Average Increment Average Increment
I 320 320 189 189 2.93
II 762 442 439 250 6.81
III 1388 626 1264 825 19.62
IV 2411 1023 1685 421 26.16
V 4346 1935 2688 1003 41.73
VI 11430 7084 6442 3754 100
Table 91 Actual and calculated weights and increments of Bagrus bajad for
different age-groups (El-Badawy 1991).
Age-group Actual weight (g) Calculated weight (g)
% weight from total Average Increment Average Increment
I 428 428 253 253 11.5
II 833 405 588 335 26.84
III 1577 744 1013 425 46.23
IV 2166 589 1513 500 69.06
V 2789 623 2191 678 100
Table 92 Actual and calculated weights and increments of O. niloticus for
different age-groups (Adam 1994).
Age-group Actual weight (g) Calculated weight (g)
% weight from total Average Increment Average Increment
I 598.10 598.10 219.58 219.58 10.04
II 1153.15 555.05 717.82 498.24 32.82
III 1866.45 713.30 1367.30 649.48 62.52
IV 2553.56 687.11 2187.12 819.82 100
Table 93 Actual and calculated weights and increments of S. galilaeus for
different age-groups (Adam 1994).
Age-group Actual weight (g) Calculated weight (g)
% weight from total Average Increment Average Increment
I 539.92 539.92 221.15 221.15 27.17
II 746.17 206.25 532.78 311.63 65.47
III 970.63 224.46 813.82 281.04 100
Effect of impoundment on the growth of Tilapia spp. in Lake Nasser
Comparing the lengths and weights of O. niloticus and S. galilaeus
recorded by Abdel-Azim (1974) during the early filling of Lake Nasser
(1964/70) and those of Adam (1994) (Tables 82, 83, 92 and 93 and Fig. 132),

256
Mekkawy et al. (1994) and Mekkawy & Mohamed (1995) during 1989/1990 and
the calculated lengths of both species given by Latif et al. (1979) (Figs. 133 and
134) a remarkable decrease in size is observed for both tilapiine species during
the last two decades.
Fig. 132 Actual and calculated weight of O. niloticus and S. galilaeus (Adam 1994).

257
When considering the results obtained by Adam (1994) and those of Mekkawy et al. (1994), and Mekkawy & Mohamed (1995), on the growth of both tilapiine species in Lake Nasser, during the same period (1989-1990), remarkable differences between their results are noticed. Thus, while Adam (1994) mentioned that the actual weights of O. niloticus at age groups I-IV ranged between 598.1 and 2553.6 g (Table, 92), Mekkawy et al. (1994) pointed out that the range was 150-875 g (Fig. 133B) for the same age groups. Moreover, Adam (1994) showed that the weights of S. galilaeus ranged between 539.9 and 970.6 g (Table, 93) for age group I-III. Mekkawy & Mohamed (1995) indicated that this range was 80-220 g (Fig. 134B) for the same age groups. It seems that figures given by Mekkawy et al. (1994) and Mekkawy & Mohamed (1995) are too low and do not represent the actual sizes of both tilapiine species fished during recent years. This view is supported by the results of recent studies carried out on the fisheries of Lake Nasser (SECSF, 1996) at four sectors covering the Lake (Khors: 1-El Ramla, Dihmit, Kalabsha, 2-Absco, Garf Hussein, Allaqi, 3-Wadi El Arab, Korosko, Thomas, Afiah, 4-Enaba, Tushka, Hemadeh) which showed the following:-
1. The percentage of O. niloticus of 500 g and less (less than 25 cm long) was about 6.3% of the total production by weight and more than 25% of the total number fished. The highest percentage (9.5%) was that for fish collected from sector 1, while that from the other sectors ranged from 2.5-3.8% where fish more than 500 g and 30 cm long were dominant. Furthermore, the average weight of O. niloticus collected from all sectors more than 500 g ranged from 532.9 to 4253.3 g and 23-47.9 cm long. Referring to the sizes recorded by Mekkawy et al (1994- Fig. 133) it is obvious that the maximum length and weight of O. niloticus was 34 cm and 875 g, being much less than that recorded by Adam (1994) and SECSF (1996).
2. The percentage weight of S. galilaeus less than 500 g and less than 23 cm long was 87% of the total production representing 92.1% of the total fish production by weight from sector 1 (El Ramla, Dihmit and Kalabsha). Furthermore, fishes ranging from 13 to 22.9 cm long ranged from 142.5 to 483.9 g; while those from 23 to 31 cm ranged from 557.1 to 1150 g. Thus, it seems that the dominant size of S. galilaeus was less than 23 cm long and less than 500g. When referring to Fig. 134, it is obvious that figures recorded by Mekkawy et al (1994) showing a maximum length of 23.5 cm and weight of 310 g for age group V, are much lower than those given by Adam (1995a & b) working during the same period and less than those recorded in 1996 (SECSF).
Nevertheless, it seems that during the last two decades a decrease in size of both tilapiine species occurred, being more remarkable in fishes from the northern region than from the southern one. This may be attributed - among other factors - to the effect of impoundment of Lake Nasser. Similar observations on the effect of impoundment on the diversity and biological characteristics of cichlids were reported for Lake Kainji (Lelek 1973, Balogun 1986), Lake Kariba (Balon & Coche 1974), Lake Kamburu (Dadzie 1980),

258
Lake

259
Fig. 133 Growth in length (cm) A; and weight (g), B; of different age groups of
O. niloticus during different periods.

262
Fig. 134 Growth in length (cm) A: and weight (g), B: of different age groups of
S. galilaeus during different periods.
Itezkitezhi (Kapasa & Cowx 1991) and Lake Nubia (Ali 1984). Mekkawy & Mohamed (1995) concluded that cichlids, especially O. niloticus and S. galilaeus, had a great ability, as reflected by their past impoundment prominence in the normal and dry conditions in the aged lakes, to adapt to the new lacustrine habitat, to feed on different items and to spawn successfully in a balanced equilibrium with the ecological and biological conditions. Furthermore, among tilapiine fishes S. galilaeus were able to adapt to special environmental factors and to predominate (Ben-Tuvia et al. 1992) in Lake Kinnert (Lake Tiberias) at the time at which O. niloticus declined (Ben-Tuvia 1960) and disappeared completely from the Lake (Ben-Tuvia et al. 1992). In Lake Nasser and other Egyptian lakes, O. niloticus has a higher growth rate than S. galilaeus. Further investigations on the other fish species of Lake Nasser are needed to find out the effect of impoundment and whether a decrease in their growth rate occurred in recent years on the basis of previous studies on the growth of these species.
3. REPRODUCTIVE BIOLOGY
The knowledge of reproductive biology : spawning season, length at first maturity, fecundity, etc. is one of the most important aspects in the development of fisheries by suggesting the suitable time for protection of fisheries, suitable size to be fished and also to prevent over-exploitation.
Spawning season
Based on the analysis of gonad index (Table 94), egg diameter and frequency of maturity stages, fishes of Lake Nasser may be assorted into three main groups:
a. The first group of fishes have a relatively long spawning season (e.g. Lates niloticus, Brycinus nurse, Oreochromis niloticus, Sarotherodon galilaeus). Two peaks at least were recorded, the first peak during March-May and the second during August-September (Figs. 135 and 136).
b. The second group particularly females are mature only in July, August and September (e.g. Eutropius niloticus, Alestes baremoze, Mormyrus kannume, M. caschive, Labeo coubie, L. horie, Barbus bynni (Figs. 137 - 139), Synodontis schall, Schilbe uranoscopus, Petrocephalus bane, and Mormyrops anguilloides). Spawning probably coincides with the commencement of the flood, which may stimulate this process. In other words, they are summer spawners.
c. Winter spawners mainly Labeo niloticus.
Spawning behaviour
O. niloticus and S. galilaeus are nest builders that prepare the nests in fine sand, sometimes with fine gravel in shallow waters particularly in khors or inundated areas. Bagrus spp. build also nests on the bottom substrate, close to some rocky areas. Lates niloticus is extremely different as it lays pelagic eggs. Large individuals of Clarias gariepinus were seen very actively swimming and

262
thrashing about amid partially submerged weeds, during the spawning season, an act which is probably connected with spawning.
It seems that most fishes of Lake Nasser have limited movements for
their spawning runs especially Tilapia spp. which move to the shallow coastal
waters with sandy bottom where they build their nests. However, Alestes
baremoze behave differently as males and females move upstream beyond the
Second Cataract and Amada area. There, they dwell along the narrow part of
the reservoir where they become affected by the early washes of the flood
which probably induces the process of spawning. This spawning behaviour of
Alestes baremoze is similar to that occurring in other African waters. Thus, Daget
(1952) recorded mass spawning of this species in the middle of Niger coinciding
with heavy rain which causes sudden drop of temperature. Hopson (1972)
postulated that mass movement of A. baremoze from Lake Tchad to the river
takes place each year at the flood time and that this migration is primarily
connected with spawning.
Macroscopic peculiarities of the gonads
Maturity stages. The monthly frequency (%) of different maturity stages of O.
niloticus is graphically presented in Fig. 140 (Adam, 1994). It is obvious that for
females O. niloticus, the mature stages (IV and V) increased gradually from 29%
in January to reach the maximum value (86%) in April. Then, a decline was
noticed in July (24%), followed by a slight increase in August and September
(27% and 28% respectively). A sharp decrease was observed in October and
November to reach 8% only, followed by a slight increase (11%) in December
(Fig. 140). The frequency of mature testes of O. niloticus increased gradually
from 24% in January to 78% in April, followed by a progressive decrease to
reach 25% in June. A gradual increase was noticed during the period from July
till September (29%; 31% and 46% respectively). A sharp decrease was recorded
in October (15%), followed by an increase of 21% in November to 28% in
December (Fig. 140). These results suggest that O. niloticus is a multispawner
spawning about 2-3 times during the year with a maximum in March-May.
Gonad index (GI). On analyzing the gonad index of Lake Nasser fishes, Latif et
al. (1979) assorted two main groups. The first one: Brycinus nurse, O. niloticus, S.
galilaeus and Lates niloticus have prolonged spawning season with two peaks
(March - May and August - September, Figs. 135 and 136). The second group of
fishes: A. baremoze; Eutropius niloticus, Labeo coubie, L. horie, Barbus bynni,
Synodontis schall, Schilbe uranoscopus, are mature only during the period July-
September (Fig. 137).
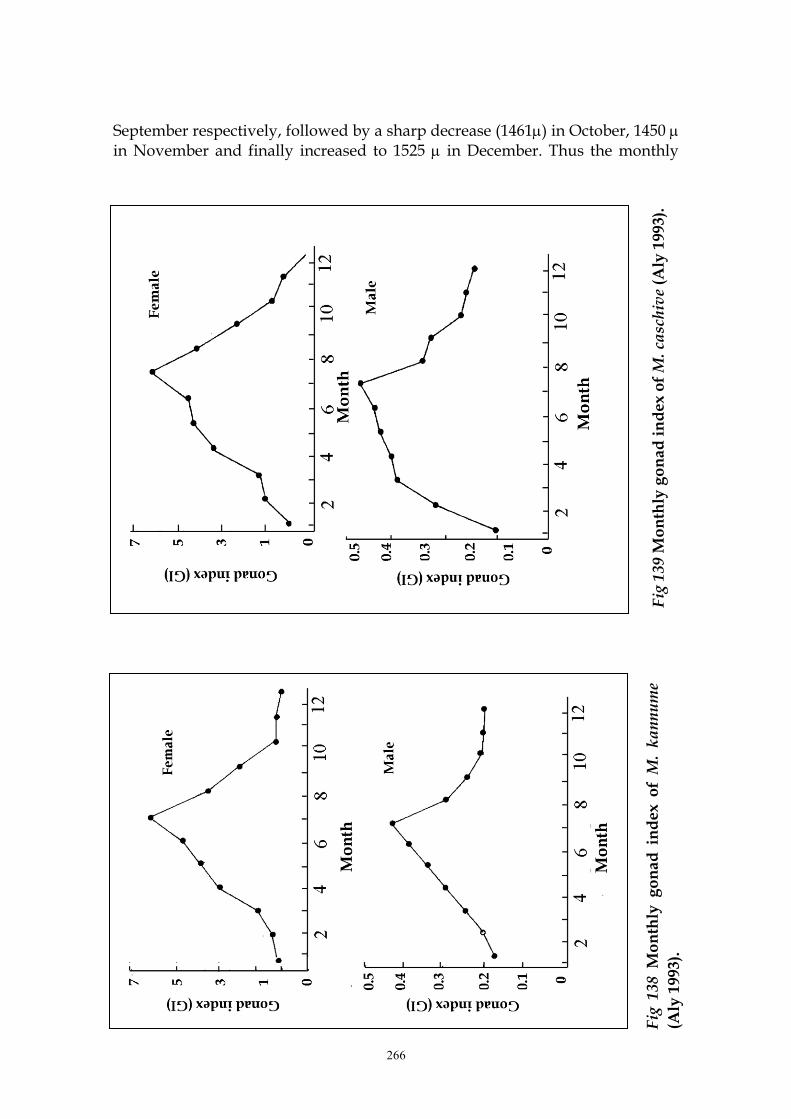
The monthly variations of gonad index of Mormyrus kannume and M.
caschive were studied by Aly (1993). Fig. 138 shows a gradual increase of the
gonad index of females and males of M. kannume in June which attains its
maximum (6.2 and 0.44 respectively) in July followed by a sharp decrease in the

262
value of gonad index till October. For M. caschive, almost the same trend was
observed (Fig. 139)
Fig. 135 Gonad index of Lates niloticus and Brycinus nurse (Latif et al. 1979)
Studies of Adam (1994) on the monthly variations of gonad index of Oreochromis niloticus (females and males) (Fig. 136) showed a gradual increase of the mean value of gonad index of female O. niloticus from January (0.540) to February (0.835) to March (1.266) then reached its maximum in April (1.408), followed by a decrease (0.909) in May. The mean gonad index of male O. niloticus was 0.117, 0.206 and 0.101 in March, April and May respectively (Fig. 136). However some females and males are mature during all months of the year. Adam (1994) concluded that the main spawning season of O. niloticus is during the period from March to May, and the second one in September. Latif
% m
atu
rity

263
and Rashid (1972) found that whether in female or male O. niloticus the average gonad index has two modes, appearing in April and September in females, being a month earlier in males.
Adam (1996a) pointed out that the spawning season of S. galilaeus
extends from March to September. The monthly maximum gonad index (GI) of
females ranged from 2.415 to 6.317 indicating that some females are fully
mature and spawn allover the year. The monthly maximum (GI) of males
ranged from 0.080 to 0.310 during all months, an indication that some males are
fully mature and spawn allover the year. It is concluded that one of the reasons
that may account for the predominance of S. galilaeus in Lake Nasser over O.
niloticus is that its spawning extends throughout the year, while spawning of O.
niloticus occurs about 2-3 times during the year. This suggests a competition for
the spawning grounds of both species which have the same spawning
behaviour. Furthermore, in S. galilaeus both parents are mouth brooders while
in O. niloticus only females are mouth brooders.
264
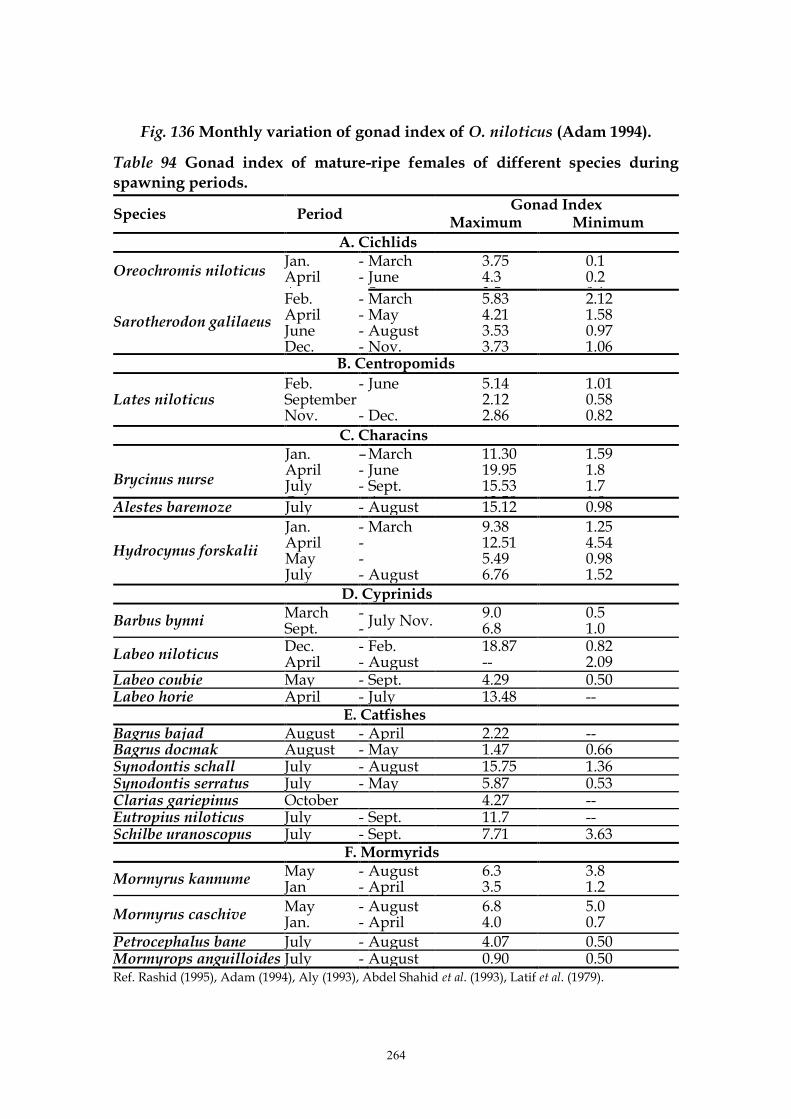
Fig. 136 Monthly variation of gonad index of O. niloticus (Adam 1994).
Table 94 Gonad index of mature-ripe females of different species during
spawning periods.
Species Period Gonad Index
Maximum Minimum
A. Cichlids
Oreochromis niloticus Jan. April August Oct.
----
March June Sept. Dec.
3.75 4.3 2.5 2.5
0.1 0.2 0.1 0.05
Sarotherodon galilaeus
Feb. April June Dec.
----
March May August Nov.
5.83 4.21 3.53 3.73
2.12 1.58 0.97 1.06
B. Centropomids
Lates niloticus Feb. September Nov.
- -
June Dec.
5.14 2.12 2.86
1.01 0.58 0.82
C. Characins
Brycinus nurse
Jan. April July Oct.
– -- -
March June Sept. August
11.30 19.95 15.53 13.59
1.59 1.8 1.7 1.0 Alestes baremoze July - August 15.12 0.98
Hydrocynus forskalii
Jan. April May July
- -- -
March August
9.38 12.51 5.49 6.76
1.25 4.54 0.98 1.52
D. Cyprinids
Barbus bynni March Sept.
--
July Nov. 9.0 6.8
0.5 1.0
Labeo niloticus Dec. April
--
Feb. August
18.87 --
0.82 2.09
Labeo coubie May - Sept. 4.29 0.50 Labeo horie April - July 13.48 --
E. Catfishes Bagrus bajad August - April 2.22 -- Bagrus docmak August - May 1.47 0.66 Synodontis schall July - August 15.75 1.36 Synodontis serratus July - May 5.87 0.53 Clarias gariepinus October 4.27 -- Eutropius niloticus July - Sept. 11.7 -- Schilbe uranoscopus July - Sept. 7.71 3.63
F. Mormyrids
Mormyrus kannume May Jan
- -
August April
6.3 3.5
3.8 1.2
Mormyrus caschive May Jan.
- -
August April
6.8 4.0
5.0 0.7
Petrocephalus bane July - August 4.07 0.50 Mormyrops anguilloides July - August 0.90 0.50 Ref. Rashid (1995), Adam (1994), Aly (1993), Abdel Shahid et al. (1993), Latif et al. (1979).
265
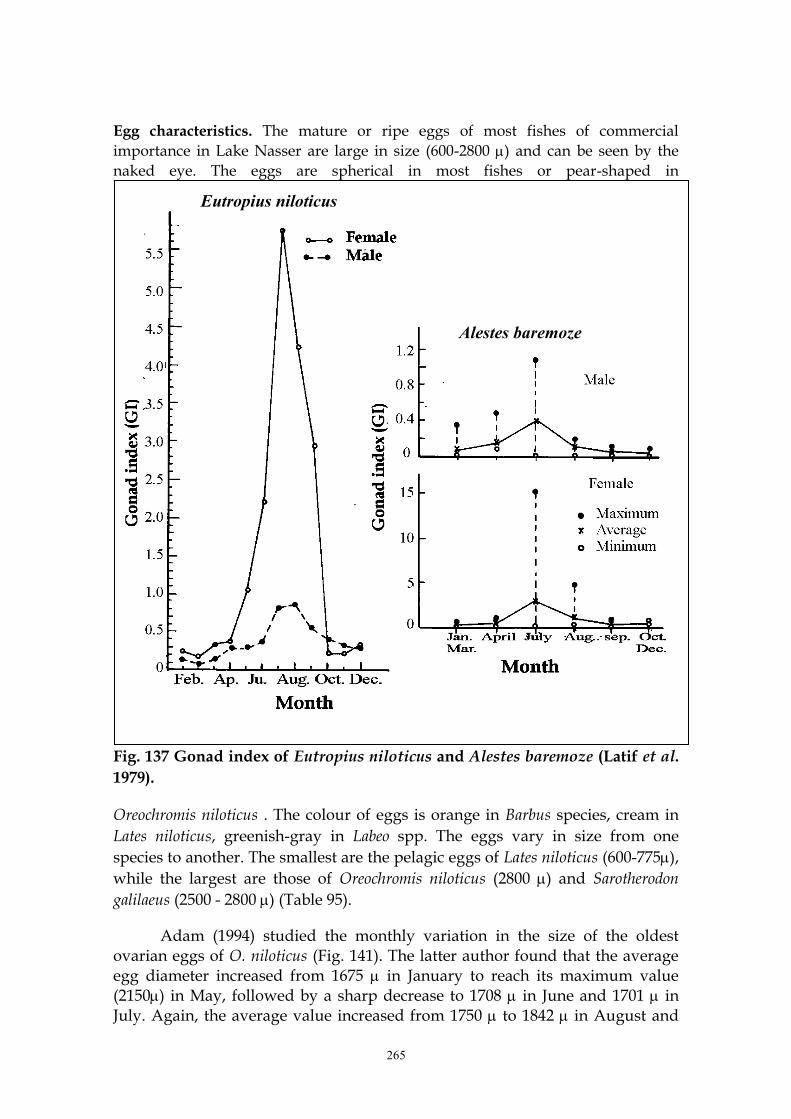
Egg characteristics. The mature or ripe eggs of most fishes of commercial
importance in Lake Nasser are large in size (600-2800 ) and can be seen by the
naked eye. The eggs are spherical in most fishes or pear-shaped in
Fig. 137 Gonad index of Eutropius niloticus and Alestes baremoze (Latif et al.
1979).
Oreochromis niloticus . The colour of eggs is orange in Barbus species, cream in
Lates niloticus, greenish-gray in Labeo spp. The eggs vary in size from one
species to another. The smallest are the pelagic eggs of Lates niloticus (600-775),
while the largest are those of Oreochromis niloticus (2800 ) and Sarotherodon
galilaeus (2500 - 2800 ) (Table 95).
Adam (1994) studied the monthly variation in the size of the oldest ovarian eggs of O. niloticus (Fig. 141). The latter author found that the average egg diameter increased from 1675 in January to reach its maximum value (2150) in May, followed by a sharp decrease to 1708 in June and 1701 in July. Again, the average value increased from 1750 to 1842 in August and
Eutropius niloticus
Alestes baremoze
266
September respectively, followed by a sharp decrease (1461) in October, 1450 in November and finally increased to 1525 in December. Thus the monthly
Fig
139
Mo
nth
ly g
on
ad
in
dex o
f M
. ca
sch
ive
(Aly
1993).
Fig
138
Mo
nth
ly g
on
ad
in
dex o
f M
. k
an
nu
me
(Aly
1993).

267

268
Fig. 140 Monthly percentage frequency of different maturity stages of O. niloticus (Adam 1994).
pattern of egg diameter of O. niloticus (Fig. 141) was, to some extent, similar to that of gonad index (Fig. 136). There are two peaks (in May and September) for the average values of egg diameter. The egg diameter of O. niloticus is somewhat larger (2800 ) than the egg diameter of S. galilaeus (2500-2800 ) (Table 95 - Aly 1993).
Fig. 141 Minimum, maximum and average diameter of oldest eggs of O.
niloticus in different months (Adam 1994).
Table 95 Diameter of mature ripe eggs of important fish species (Aly 1993).
Species Egg-diameter ()
Lates niloticus 600-775
Brycinus nurse 800-825
Alestes baremoze 935
Schilbe uranoscopus 800-825
Eutropius niloticus 850-1025
Hydrocynus forskalii 850-950
Labeo coubie 1000-1050
Labeo horie 1050-1200
Labeo niloticus 1050-1225
Synodontis serratus 1200-1225
Synodontis schall 1200-1260
Bagrus docmak 1350-1425
Mormyrus kannume 1925-2170
Mormyrus caschive 2100-2500

269
Oreochromis niloticus 2800
Sarotherodon galilaeus 2500-2800
First sexual maturity
The knowledge of size and age at the first sexual maturity of the commercial
fish species is of utmost importance in the development and management of
the fisheries of Lake Nasser. Studies by various investigators (Entz & Latif 1974,
Latif et al. 1979, Abdel-Azim 1982, Aly 1993) on the sexual maturity of different
fish species from Lake Nasser shows the smallest size of various fish species
when their first maturity is attained (Table 96).
Table 96 The smallest length of various fish species in Lake Nasser, attaining their first sexual maturity (Entz & Latif 1974, Latif et al. 1979, 1984b and c, Abdel-Azim 1982 and Aly 1993).
Species Minimum length at first sexual maturity (cm)
♂ ♀ Oreochromis niloticus 23 26 Sarotherodon galilaeus -- 16 Hydrocynus forskalii 30.5 29.5 Brycinus nurse 4.5 6 Alestes baremoze 20 23 Mormyrus kannume 32 34.6 Mormyrus caschive 40 32.3 Mormyrus anguilloides 50 50 Petrocephalus bane 17 18 Labeo niloticus 53 55 Labeo coubie 35 36 Labeo horie -- 33 Barbus bynni -- 57 Bagrus docmak -- 60 Synodontis serratus 31 35 Synodontis schall 24 28 Eutropius niloticus 16 18 Lates niloticus 38 30
Fecundity It is obvious that O. niloticus and S. galilaeus have the lowest values of fecundity, being mouth breeders, while Lates niloticus has the highest egg production (Table 97). The absolute fecundity ranges between 1.4 thousand, in S. galilaeus to 618.3 thousand in Lates niloticus (Table 97 A.) Also, the fecundity varies greatly with age as in Mormyrus caschive and Mormyrus kannume (Table 97B, Fig. 142). The fecundity of Eutropius niloticus and Alestes baremoze lies between that of Tilapia spp. and Lates niloticus. Thus, while the absolute fecundity ranges from 7.2 thousand for Tilapia spp. to 618.3 thousand for Lates niloticus, it ranges between 55 and 223.7 thousand eggs for age groups VI-VII (Table, 97 B) for Eutropius niloticus and A. baremoze (Latif et al. 1979).

272
As the fisheries of Lake Nasser is based on two major fish species i.e. O. niloticus and S. galilaeus, hence reference to various parameters of fecundity are referred to, based on studies by Aly (1993) and Adam (1994).
Table 97 Absolute fecundity (number of ovarian mature/ripe eggs) during the
peak of spawning season of various fish species in Lake Nasser.
A. Variation with length
Species Standard length
range (cm)
Average absolute fecundity
(thousand)
Relative fecundity eggs/cm
Oreochromis niloticus 26-45 2.9-7.0 88-186 Sarotherodon galilaeus 17.5-34.5 1.4-7.2 80-209
Brycinus nurse 6.5-13.5 6.5-24.5 1000-1815
Eutropius niloticus 20-34 31-65 1425-1832
Alestes baremoze 24-42 28.5-223.7 1187-5326
Lates niloticus 27.8-51.5 89.3-618.3 3208-12006
Mormyrus kannume 34.6 0.6-7.8 25-152
Mormyrus caschive 32.3 0.5-5.8 19-120
B. Variation with age
Age group S. galilaeus Oreochromis
niloticus
Lates
niloticus
Alestes
baremoze
Eutropius
niloticus
Mormyrus
caschive
Mormyrus
kannume
I 3300 3516 -- -- -- -- --
II 4400 4170 139,000 -- -- -- --
III 4900 5175 262,000 28,500 30,500 1,730 1,601
IV 5600 6090 481,900 97,900 37,500 3,734 3,450
V -- - -- 140,800 48,500 7,948 6,363
VI -- - -- 206,600 55,000 11,138 --
VII -- - -- 223,700 -- -- --
1. Oreochromis niloticus
For O. niloticus the following relationships were determined (Adam 1994):
Absolute fecundity
a. Fecundity versus length. The average number of eggs increased from 2485 to 7003 for the body length from 26 to 45 cm (Fig. 143). The relation between the two variables is as follows:
Log F = 0.5816 + 1.9948 Log L
(F = number of eggs, L = body length cm)
b. Fecundity versus weight . The average number of eggs increased from 2789 to 5729 for the body weight from 700 to 3500 g (Fig. 144). The relation between fecundity and body weight is as follows :
Log F = 2.2385 + 0.4321 Log W
272
(F = number of eggs; W = body weight)
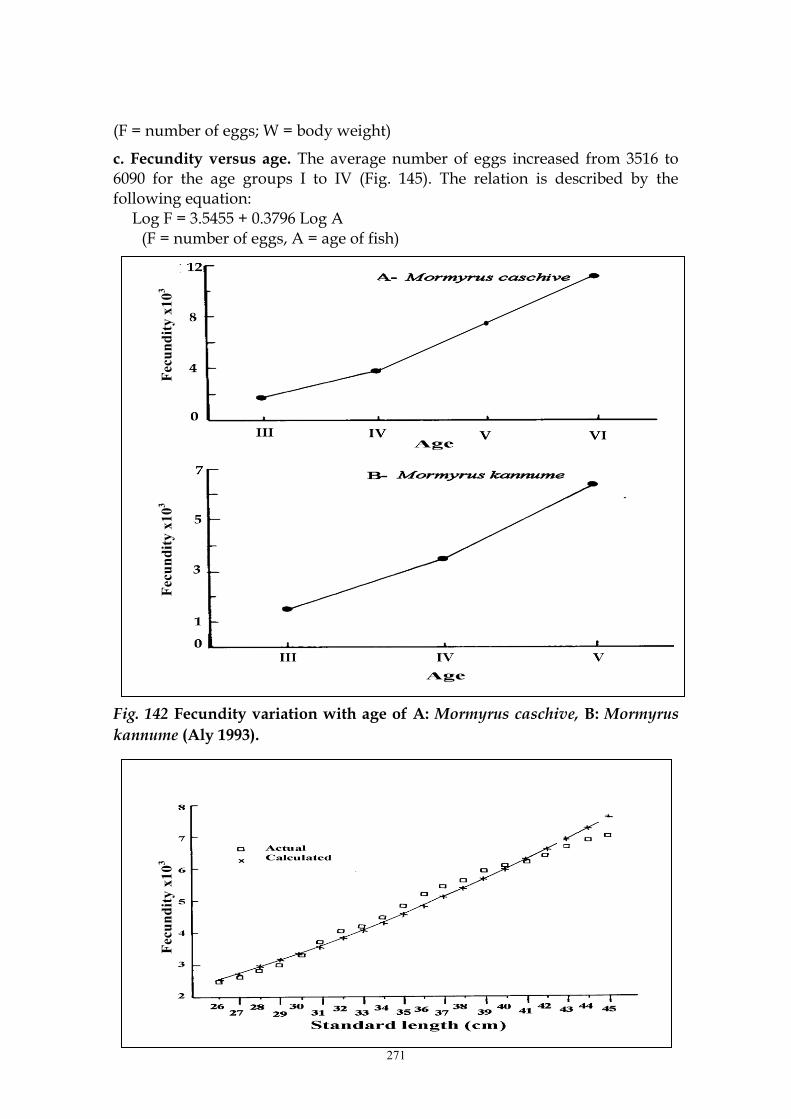
c. Fecundity versus age. The average number of eggs increased from 3516 to 6090 for the age groups I to IV (Fig. 145). The relation is described by the following equation:
Log F = 3.5455 + 0.3796 Log A (F = number of eggs, A = age of fish)
Fig. 142 Fecundity variation with age of A: Mormyrus caschive, B: Mormyrus
kannume (Aly 1993).
Fec
un
dit
y x
10
3F
ecu
nd
ity x
10
3F
ecu
nd
ity
x1
03

272
Fig. 143 Variation of absolute fecundity with length of O. niloticus (Adam 1994).
Fig. 144 Variation of absolute fecundity with weight of O. niloticus (Adam
1994).
Fecu
nd
ity
x10
3F
ecu
nd
ity
x1
03

273
Fig. 145 Variation of absolute fecundity with age of O. niloticus
(Adam 1994).
d. Fecundity versus gonad index. The average number of eggs ranged between
3205 and 6185 for the gonad index from 1.0 to 4.2 (Fig. 146). The relation is fit to
the following equation:
Log F = 3.4959 + 0.4761 Log GI
(F= number of eggs, GI = average gonad index).
Adam (1994) concluded that the absolute fecundity of O. niloticus
increased with length, weight, age and gonad index.
Relative fecundity
a. Relative fecundity versus length. The relative fecundity increases with the
increase of body length and its value ranges between 88.32 and 186.06/cm for
the body length range of 26 to 45 cm (Fig. 147). This relation is represented by
the following equation :
Log RF = 0.1520 + 1.3032 Log L
(RF = relative fecundity, L= standard length).
b. Relative fecundity versus weight. The relative fecundity increases with the
increase of body weight up to 1300 g, and its value ranges between 2.44 and
3.33 egg/g. For the body weight ranging from 1500 to 2500 g, the relative
fecundity decreases progressively from 2.92 to 1.97 egg/g with the exception of
average body weight 2300 g as it is 2.88 egg/g. The relative fecundity increases
from 2.16 to 3.32 egg/g for body weight ranging from 2700 to 3500 g (Fig.148).
The fluctuations of the relative fecundity with the body weight do not exhibit
any particular pattern. The relation is described as follows:
Log RF = 0.4394 - 0.0045 Log W
(RF = relative fecundity, W = body weight)
Fe
cun
dit
y x
10
3

274
Fig. 146 Variation of absolute fecundity with gonad index of O. niloticus (Adam 1994).
Fig. 147 Variation of relative fecundity with length of O. niloticus (Adam 1994).
(e
gg
/cm
)
(e
gg
/g)
(g)

275
Fig. 148 Variation of relative fecundity with weight of O. niloticus (Adam 1994).
2. Sarotherodon galilaeus
Aly (1993) calculated the absolute fecundity for S. galilaeus as follows:
(a) Fecundity versus length. The average number of eggs increased from
1400 to 7200 for the body length from 17.5 to 34.5 cm (Table 97A).
(b) Fecundity versus age. The average number of eggs increased from 3300
to 5600 for the age groups I to IV (Table 97B).
CONCLUSIONS
The food and feeding habits of fish species in Lake Nasser may be
divided into:
1. Periphyton-plankton feeders. a) Oreochromis niloticus which feeds on :
periphyton (Chlorophyta, Cyanophyta and diatoms), phytoplankton
(Chlorophyta, Cyanophyta, diatoms and Dinophyceae) and zooplankton
(Cladocera, Rotifera, Ostracoda and Copepoda).
b) Sarotherodon galilaeus feeds on: Periphyton (Chlorophyta, Cyanophyta and
diatoms), phytoplankton (diatoms, Chlorophyta and Cyanophyta) and
zooplankton (copepods and cladocerans).
2. Zooplankton-insect feeders. a) Brycinus nurse which feeds on copepods,
decapods, cladocerans, insect larvae and gastropods. (b) Alestes baremoze feeds
on copepods, cladocerans, insects, gastropods and phytoplankton.
3. Omnivores including Eutropius niloticus which feed on: insect larvae, water
beetles, Odonata, worms, freshwater shrimps, bivalves and fishes. Synodontis
spp. feed on: animal food including fishes, worms, molluscs and insects, in
addition to food of plant origin and phytoplankton. Schilbe uranoscopus feed on
small fish, chironomid larvae, nymphs of Pleocoptera, copepods and
cladocerans. Mormyrids feed on larvae and pupae of chironomids, nymphs of
Odonata, Corixidae (water-bugs), larvae of Trichoptera, cladocerans, detritus,
aquatic plants, diatoms, freshwater shrimps and fishes. Labeo spp. and Barbus
spp., their food consists of diatoms, cyanophytes, worms and plant material.
4. Carnivores including Lates niloticus which feed mainly on fish, freshwater
shrimps and insects. The percentage occurrence of fish increases with age.
Bagrus spp. feed on fishes, freshwater shrimps, insects and molluscs. While,
Clarias gariepinus and Heterobranchus spp. are bottom feeders feeding on fish,
insects, molluscs and plant food. Hydrocynus forskalii feed on fishes, insects and
freshwater shrimps.

276
It is to be noted that oligochaetes are always underestimated when
investigating stomach contents of fish, as they are very readily digestible and
leave no observable traces.
Some fish species, in Lake Nasser, are slender (as Eutropius niloticus,
Hydrocynus forskalii, Alestes baremoze), others have heavier bodies (as Labeo
niloticus, L. forskalii, Lates niloticus and Barbus bynni) and still others as
Sarotherodon galilaeus and Oreochromis niloticus have the heaviest weights.
The length-weight relationship and condition factor of the commercial
fishes in Lake Nasser, calculated by different authors, are given. The growth
rate in length of O. niloticus is higher than that of S. galilaeus. Growth rates of
both tilapiine species are higher in the southern region of the lake than those
inhabiting the northern region.
The difference in calculated weights between different fish species, even
those belonging to the same genus is more prominent with weight than with
length. O. niloticus of age group III has an average actual weight of 1866 g as
compared with 971 g for S. galilaeus. The growth increment in weight for age-
group I of O. niloticus is the lowest and increases progressively in the older ages
up to age group IV. The average weights of O. niloticus are higher than those of
S. galilaeus. For S. galilaeus, the calculated weight of age group I is nearly equal
to that of O. niloticus; while those of age groups II and III are less than the
calculated values for the same age groups in O. niloticus. The growth increment
in weight of S. galilaeus is the lowest for age group I, then increases in age-
group II and decreases in age-group III.
Comparing the calculated growth in length and weight of O. niloticus
and S. galilaeus during the last two decades suggests a marked decrease in the
growth rate of both tilapiine species during recent years. The effect of
impoundment on the growth of both Tilapia spp. is discussed.
The calculated weights for different age-groups of 14 fish species in Lake
Nasser are presented. There is a significant difference in growth between Bagrus
bajad and B. docmak. The latter species grows faster and lives for longer age.
As for reproduction of fishes of Lake Nasser three main groups can be
distinguished: -
a. Fishes which have prolonged spawning season mainly with two peaks
during spring and autumn (O. niloticus, S. galilaeus, Brycinus nurse and Lates
niloticus).
b. Summer spawners (Alestes baremoze, Eutropius niloticus, Labeo coubie, Labeo
horie, Barbus bynni, Mormyrus kannume and M. caschive)

277
c. Winter spawners as Labeo niloticus
O. niloticus, S. galilaeus and Bagrus spp. are nest builders, while Lates
niloticus is extremely different as it lays pelagic eggs. Alestes baremoze undergoes
a spawning migration which coincides with flood as both sexes move upstream
behind the Second Cataract and Amada, dwelling along the narrow part of the
reservoir affected by the early washes of the flood thus inducing spawning.
Monthly percentage frequency of different maturity stages in O. niloticus
(males and females) suggest multiple spawning with a maximum during
March-May and September. Sarotherodon galilaeus spawns most of the year as
mature fishes are encountered all the year round. Monthly variations of gonad
index of the commercial fish species in Lake Nasser are shown, indicating the
spawning season of these species.
Fish eggs vary in size from one species to another. The smallest are the
pelagic eggs of Lates niloticus (600-775 ) while the largest are those of O.
niloticus (2800) and S. galilaeus (2500-2800 ). The monthly variations in the size
of the oldest ovarian eggs of O. niloticus are given, an indication of their
spawning season which coincides with both gonad index and maturity stages.
The size at first sexual maturity of the commercial fish species in Lake
Nasser is mentioned, Bagrus docmak being the longest (60 cm for females) and
Brycinus nurse being the smallest as its first maturity is attained when 6 cm long.
The absolute fecundity ranges between 1.4 thousand in S. galilaeus to
618.3 thousand in Lates niliticus. Variations of absolute and relative fecundities
with length, weight, age and gonad index for O. niloticus are given. For S.
galilaeus, the absolute fecundity versus length and age are calculated.
One of the reasons that may account for the predominance of S. galilaeus
over O. niloticus in Lake Nasser during the last decade, may be the competition
for spawning sites as both species are nest builders and have a similar
spawning behaviour. Furthermore, considering the gonad index, maturity
stages and dominance of mature eggs shows that S. galilaeus may spawn
throughout the whole year, while O. niloticus spawns 2-3 times with two peaks
during March-May and August-September. In addition in S. galilaeus both
parents are mouth brooders, while in O. niloticus females are the only mouth
brooders.