chapter 7 economic growth: malthus and solow copyright © 2014 pearson education, inc
TRANSCRIPT

Chapter 7
Economic Growth:
Malthus and Solow
Copyright © 2014 Pearson Education, Inc.

1-2© 2014 Pearson Education, Inc.
Chapter 7 Topics
• Economic growth facts
• Malthusian model of economic growth
• Solow growth model
• Growth accounting

1-3© 2014 Pearson Education, Inc.
U.S. Per Capita Real Income Growth
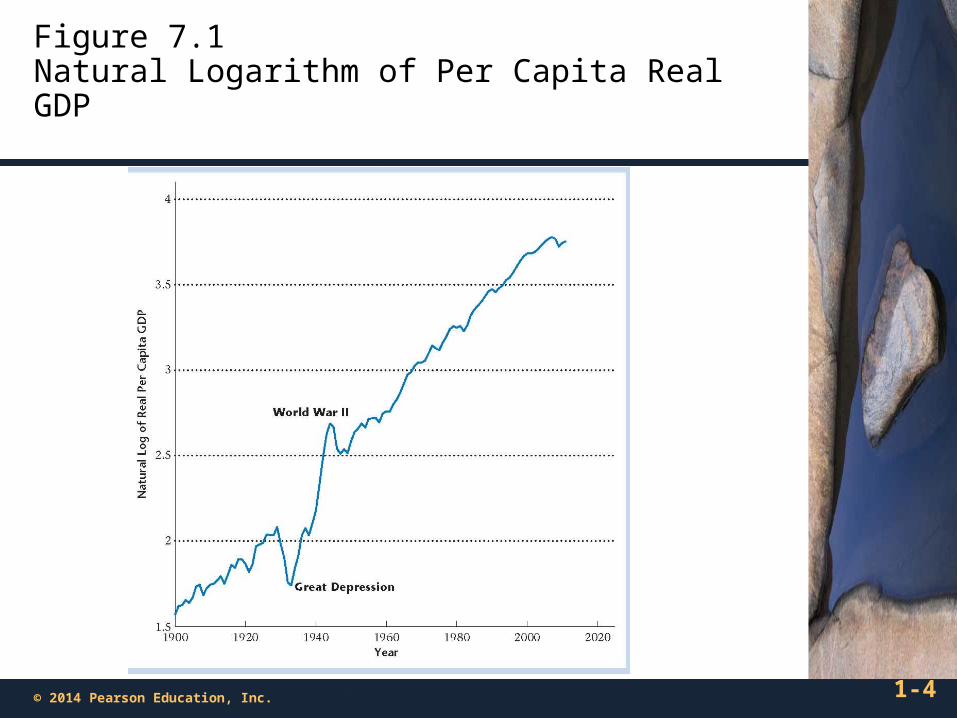
• Except for the Great Depression and World War II, growth in U.S. per capita real income has not strayed far from 2% per year since 1900.
1-4© 2014 Pearson Education, Inc.
Figure 7.1 Natural Logarithm of Per Capita Real GDP
1-5© 2014 Pearson Education, Inc.
Real Per Capita Income and the Investment Rate
• Across countries, real per capita income and the investment rate are positively correlated.

1-6© 2014 Pearson Education, Inc.
Figure 7.2Real Income Per Capita vs. Investment Rate

1-7© 2014 Pearson Education, Inc.
Real Per Capita Income and the Rate of Population Growth
• Across countries, real per capita income and the population growth rate are negatively correlated.

1-8© 2014 Pearson Education, Inc.
Figure 7.3Real Income Per Capita vs. the Population Growth Rate

1-9© 2014 Pearson Education, Inc.
Real Per Capita Income and Per Capita Income Growth
• There is no tendency for rich countries to grow faster than poor countries, and vice-versa.
• Rich countries are more alike in terms of rates of growth than are poor countries.

1-10© 2014 Pearson Education, Inc.
Figure 7.4Growth Rate in Per Capita Income vs. Level of Per Capita Income
1-11© 2014 Pearson Education, Inc.
A Malthusian Model of Economic Growth
• This model predicts that a technological advance will only increase population, with no long-run change in the standard of living.
1-12© 2014 Pearson Education, Inc.
Production Function
Output is produced from land and labor inputs.
),( NLzFY
1-13© 2014 Pearson Education, Inc.
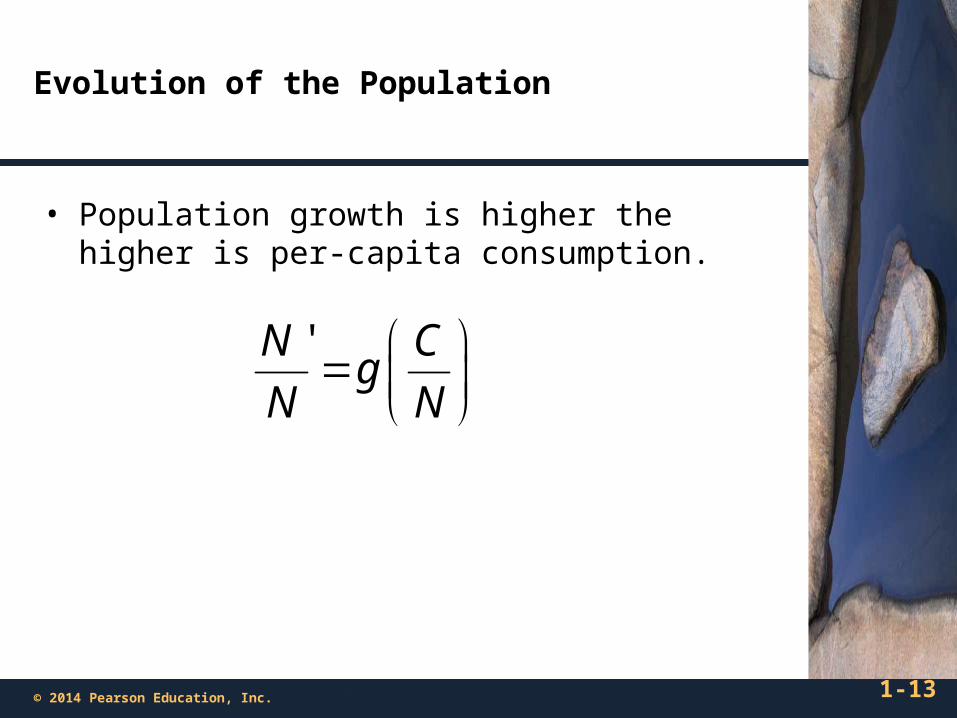
Evolution of the Population
• Population growth is higher the higher is per-capita consumption.
'N Cg
N N
1-14© 2014 Pearson Education, Inc.
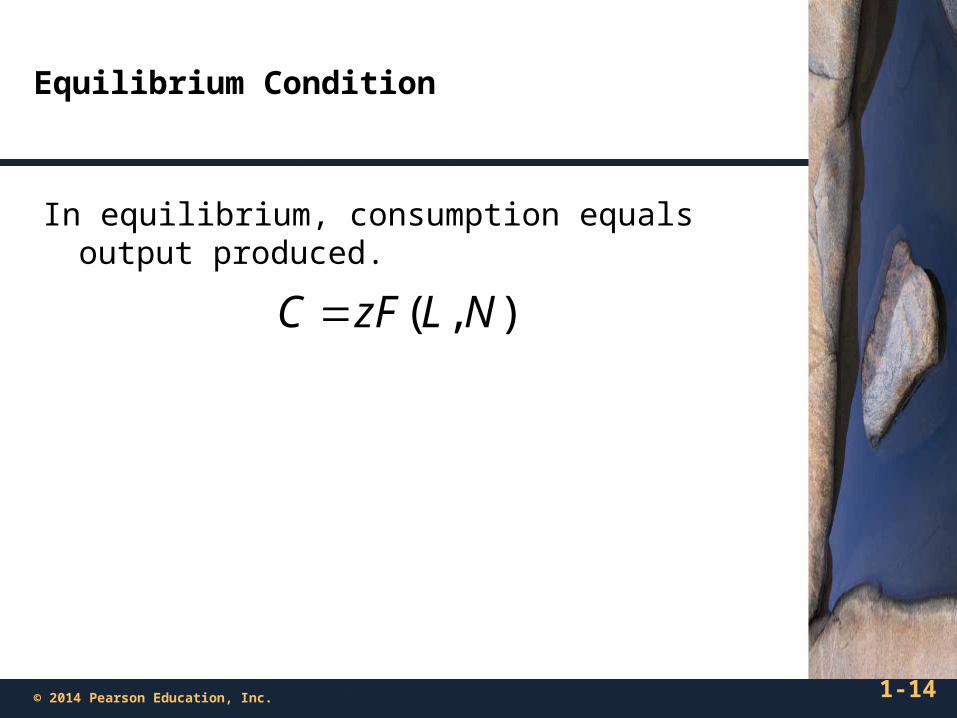
Equilibrium Condition
In equilibrium, consumption equals output produced.
),( NLzFC

1-15© 2014 Pearson Education, Inc.
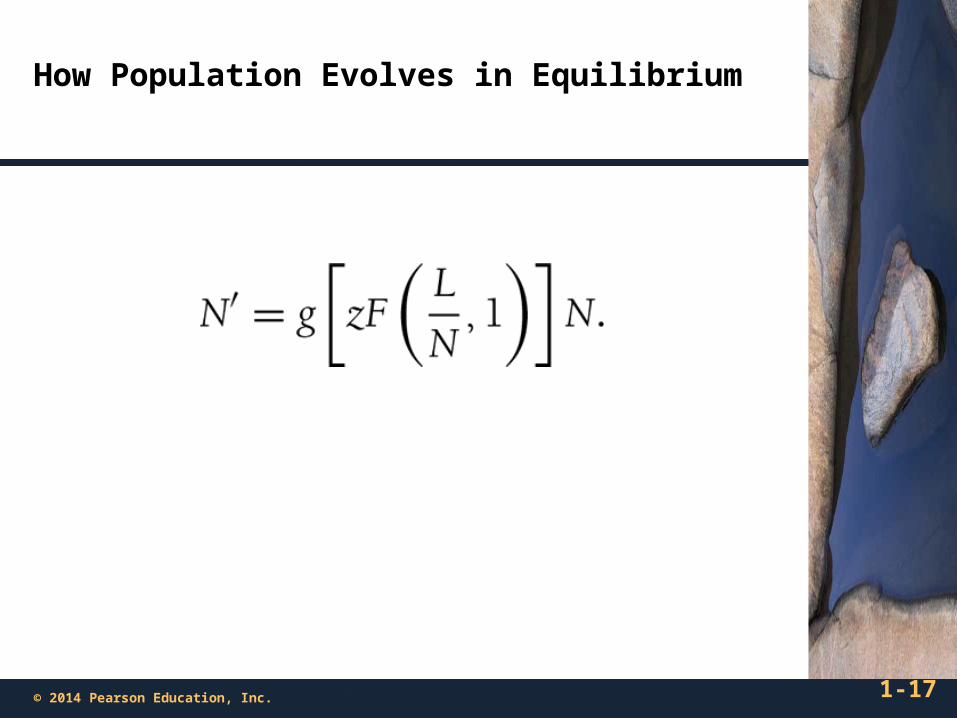
Equilibrium Evolution of the Population
• This equation describes how the future population depends on current population.
'[ ( , ) / ]
Ng zF L N N
N

1-16© 2014 Pearson Education, Inc.
Figure 7.5Population Growth Depends on Consumption per Worker in the Malthusian Model
1-17© 2014 Pearson Education, Inc.
How Population Evolves in Equilibrium
1-18© 2014 Pearson Education, Inc.
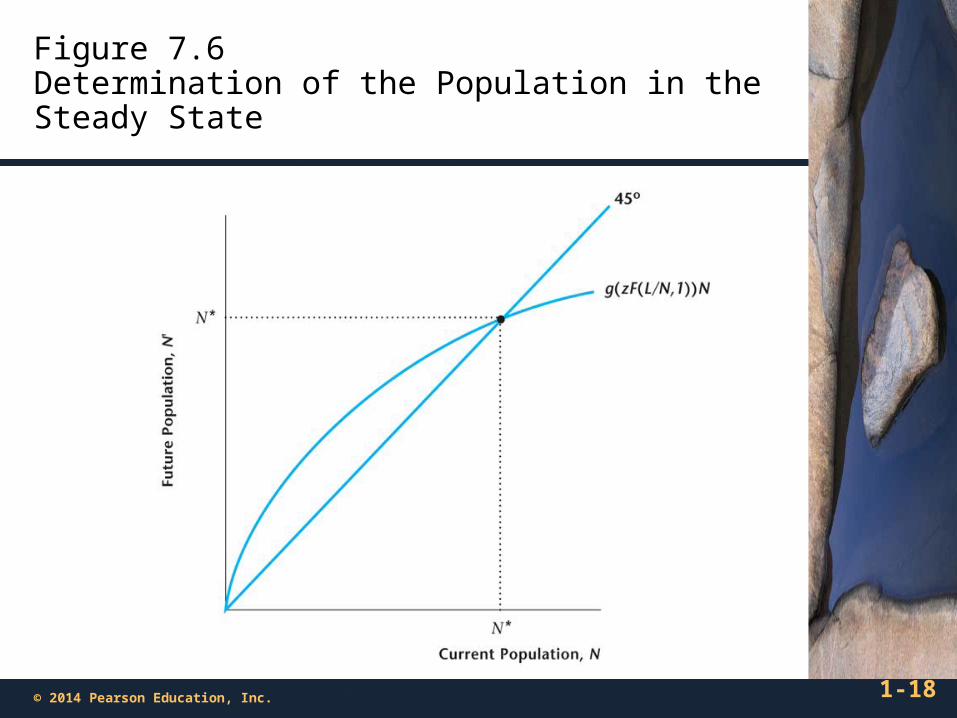
Figure 7.6Determination of the Population in the Steady State
1-19© 2014 Pearson Education, Inc.
The Per-Worker Production Function

1-20© 2014 Pearson Education, Inc.
Equilibrium Condition in Per-Worker Form
1-21© 2014 Pearson Education, Inc.
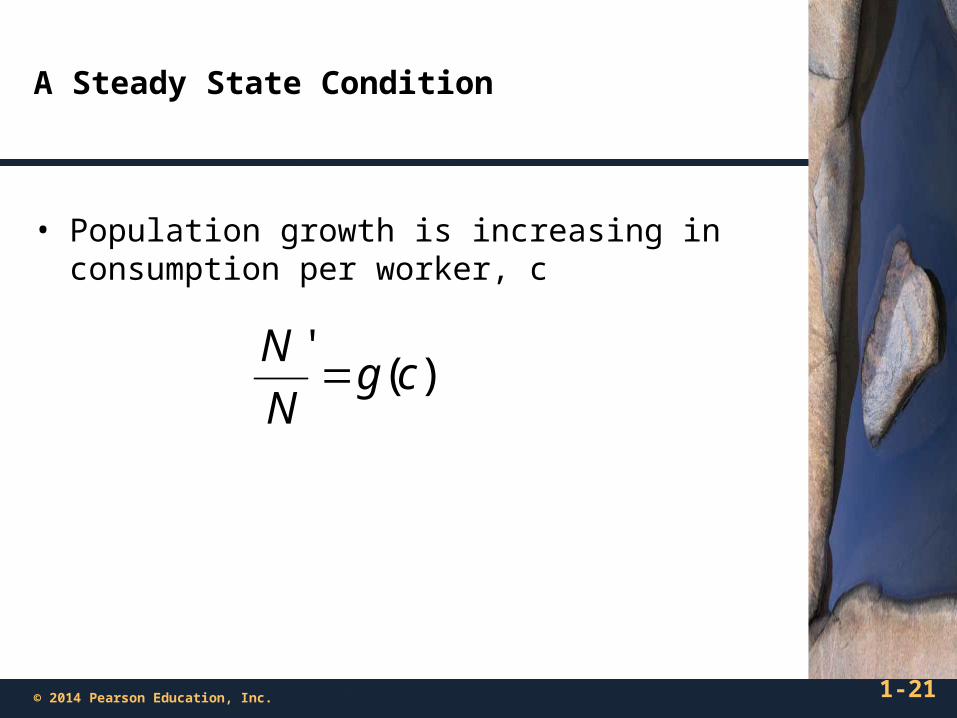
A Steady State Condition
• Population growth is increasing in consumption per worker, c
'( )
Ng c
N

1-22© 2014 Pearson Education, Inc.
Figure 7.7The Per-Worker Production Function

1-23© 2014 Pearson Education, Inc.
Figure 7.8Determination of the Steady State in the Malthusian Model

1-24© 2014 Pearson Education, Inc.
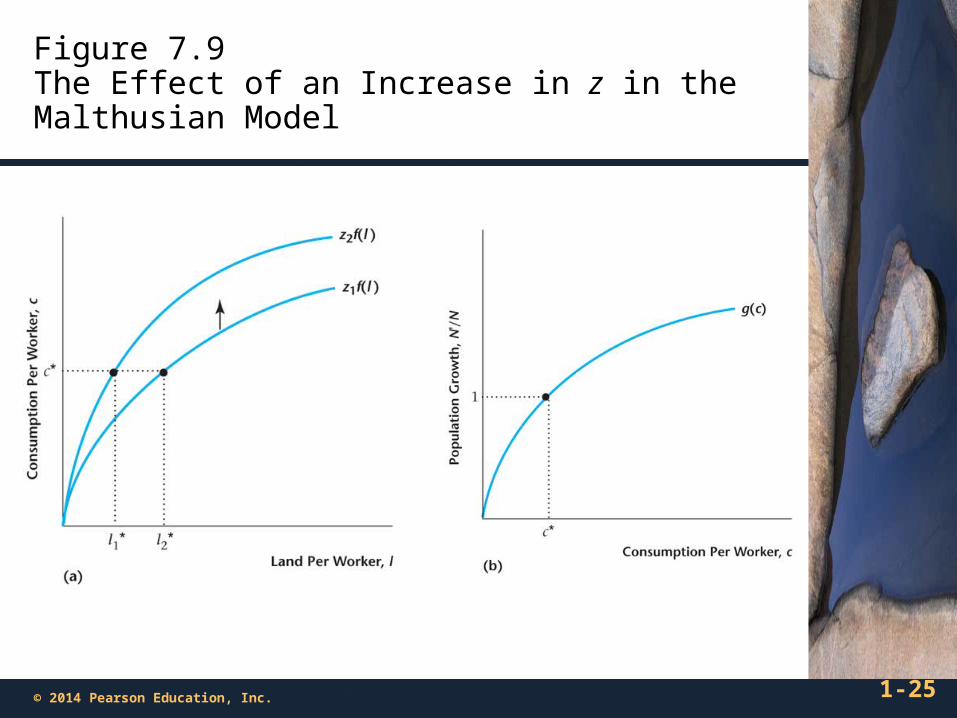
An Increase in z in the Malthusian Model
• If z increases, this shifts up the per-worker production function.
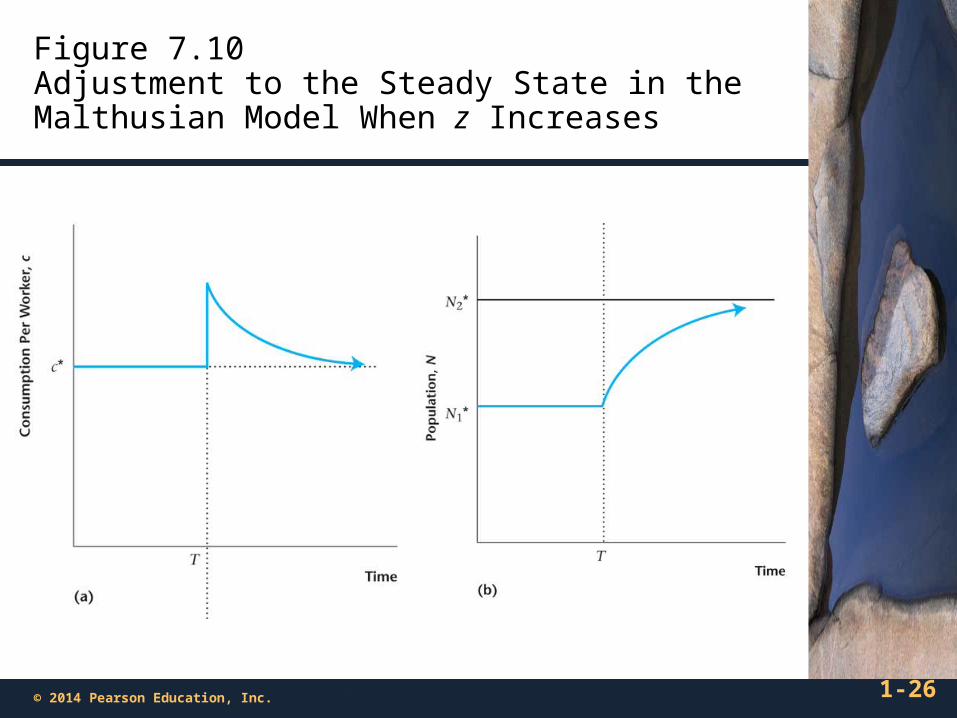
• In the long run, the population increases to the point where per capita consumption returns to its initial level.
• There is no long-run change in living standards.
1-25© 2014 Pearson Education, Inc.
Figure 7.9The Effect of an Increase in z in the Malthusian Model
1-26© 2014 Pearson Education, Inc.
Figure 7.10Adjustment to the Steady State in the Malthusian Model When z Increases
1-27© 2014 Pearson Education, Inc.
Population Control in the Malthusian Model
• Population control alters the relationship between population growth and per-capita consumption.
• In the long run, per capita consumption increases, and living standards rise.

1-28© 2014 Pearson Education, Inc.
Figure 7.11Population Control in the Malthusian Model

1-29© 2014 Pearson Education, Inc.
How Useful is the Malthusian Model?
• Model provides a good explanation for pre-1800 growth facts in the world.
• Malthus did not predict the effects of technological advances on fertility.
• Malthus did not understand the role of capital accumulation in growth.

1-30© 2014 Pearson Education, Inc.
Solow Growth Model
• This is a key model which is the basis for the modern theory of economic growth.
• A key prediction is that technological progress is necessary for sustained increases in standards of living.
1-31© 2014 Pearson Education, Inc.
Population Growth
NnN )1('
• In the Solow growth model, population is assumed to grow at a constant rate n.

1-32© 2014 Pearson Education, Inc.
Consumption-Savings Behavior
• Consumers are assumed to save a constant fraction s of their income, consuming the rest.
YsC )1(
1-33© 2014 Pearson Education, Inc.
Representative Firm’s Production Function
1-34© 2014 Pearson Education, Inc.
Constant Returns to Scale
• Constant returns to scale implies:
,1Y K
zFN N

1-35© 2014 Pearson Education, Inc.
Evolution of the Capital Stock
• Future capital equals the capital remaining after depreciation, plus current investment.
IKdK )1('

1-36© 2014 Pearson Education, Inc.
Figure 7.12The Per-Worker Production Function

1-37© 2014 Pearson Education, Inc.
Income-Expenditure Identity
• The income expenditure identity holds as an equilibrium condition.
ICY

1-38© 2014 Pearson Education, Inc.
Equilibrium
• In equilibrium, future capital equals total savings (= I) plus what remains of current K.
KdsYK )1('

1-39© 2014 Pearson Education, Inc.
Next Step
Substitute for output from the production function.
KdNKszFK )1(),('

1-40© 2014 Pearson Education, Inc.
Then,
Rewrite in per-worker form.
kdkszfnk )1()()1('
1-41© 2014 Pearson Education, Inc.
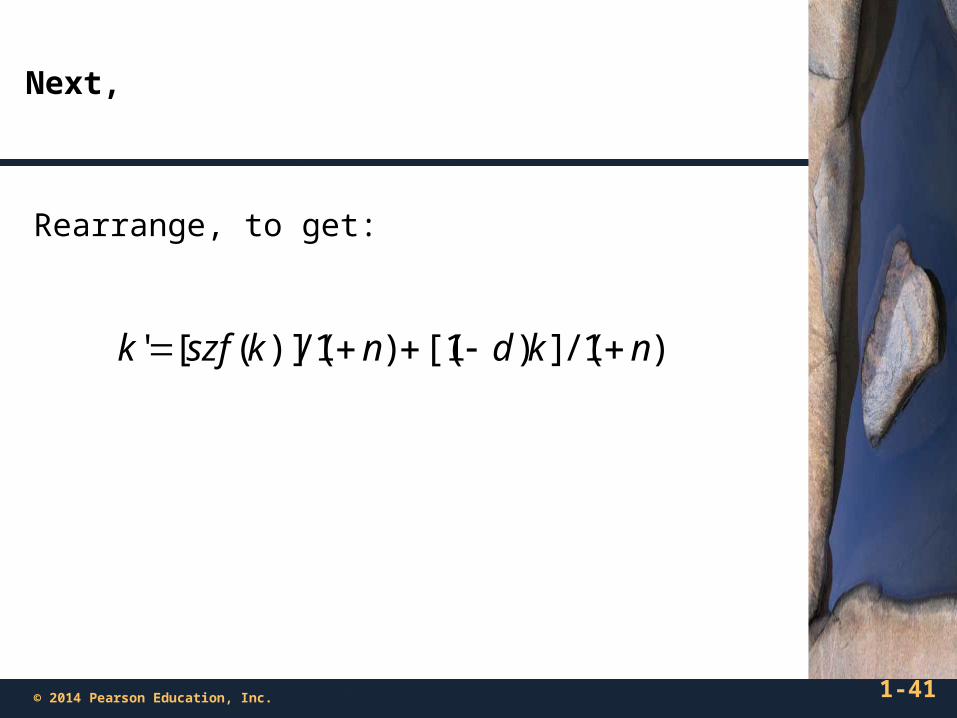
Next,
Rearrange, to get:
)1/(])1[()1/()]([' nkdnkszfk
1-42© 2014 Pearson Education, Inc.
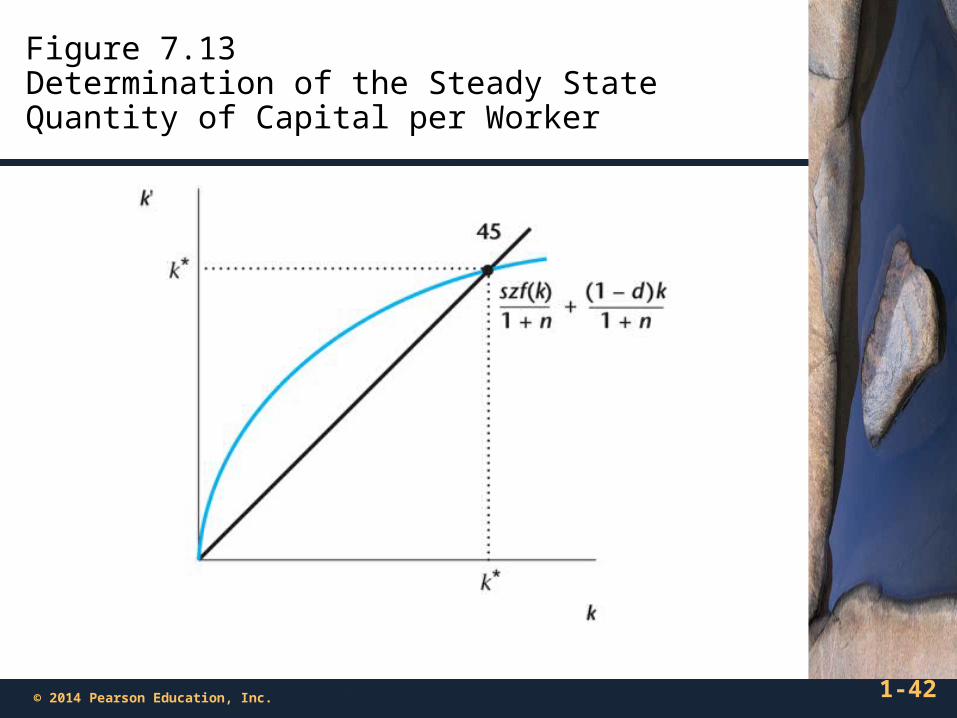
Figure 7.13 Determination of the Steady State Quantity of Capital per Worker

1-43© 2014 Pearson Education, Inc.
An Increase in the Savings Rate s
• In the steady state, this increases capital per worker and real output per capita.
• In the steady state, there is no effect on the growth rates of aggregate variables.
1-44© 2014 Pearson Education, Inc.
An Increase in the Savings Rate s
• In the steady state, this increases capital per worker and real output per capita.
• In the steady state, there is no effect on the growth rates of aggregate variables.

1-45© 2014 Pearson Education, Inc.
Figure 7.14Determination of the Steady State Quantity of Capital per Worker
1-46© 2014 Pearson Education, Inc.
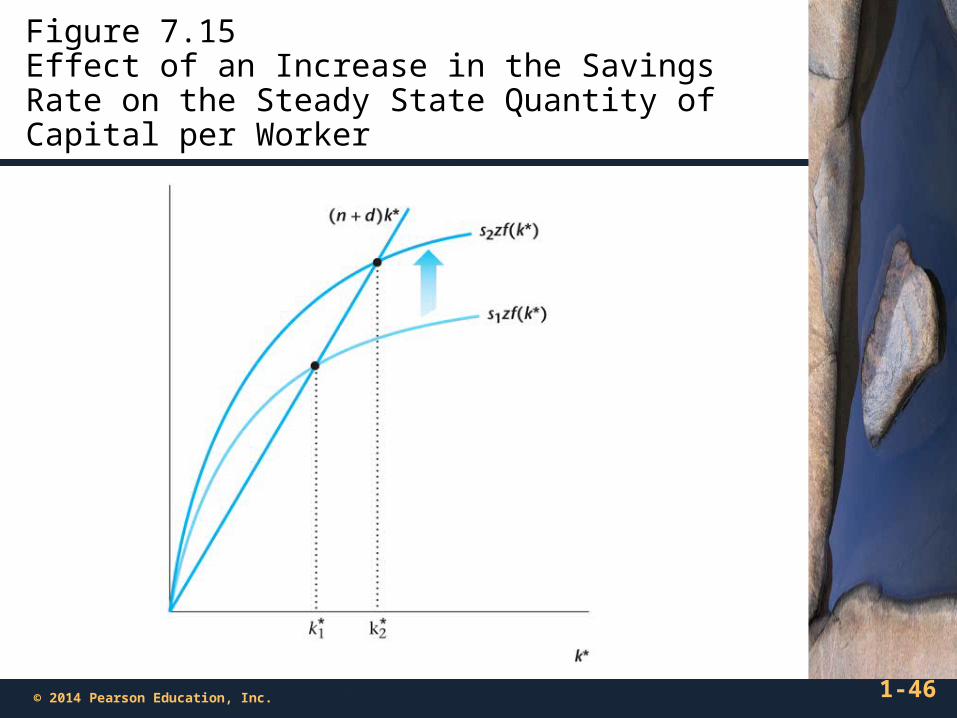
Figure 7.15Effect of an Increase in the Savings Rate on the Steady State Quantity of Capital per Worker

1-47© 2014 Pearson Education, Inc.
Figure 7.16Effect of an Increase in the Savings Rate at Time T
1-48© 2014 Pearson Education, Inc.
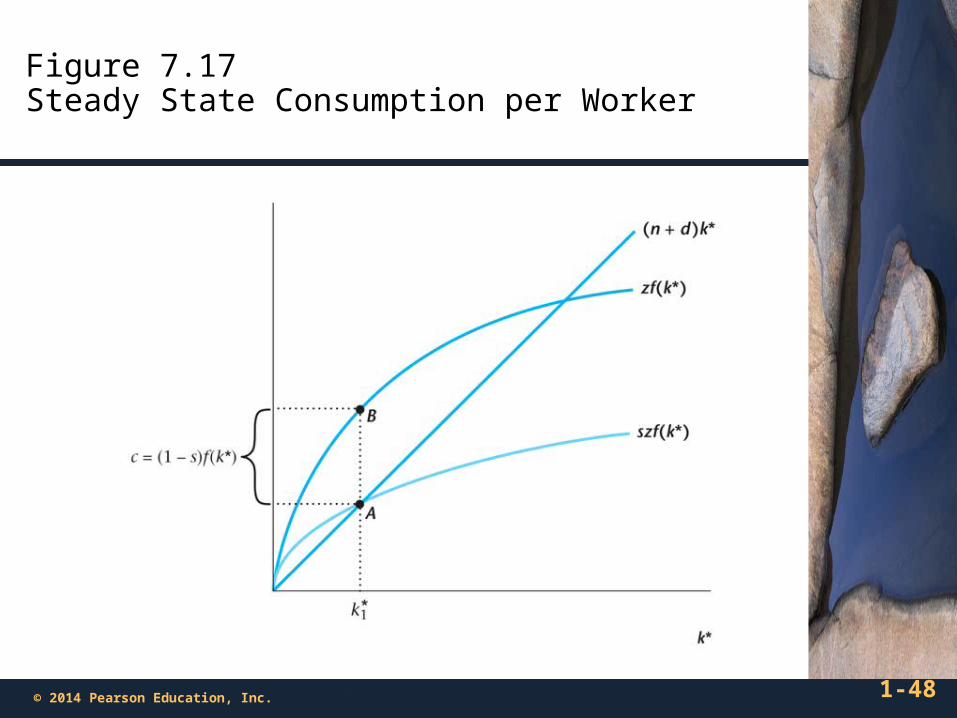
Figure 7.17Steady State Consumption per Worker
1-49© 2014 Pearson Education, Inc.
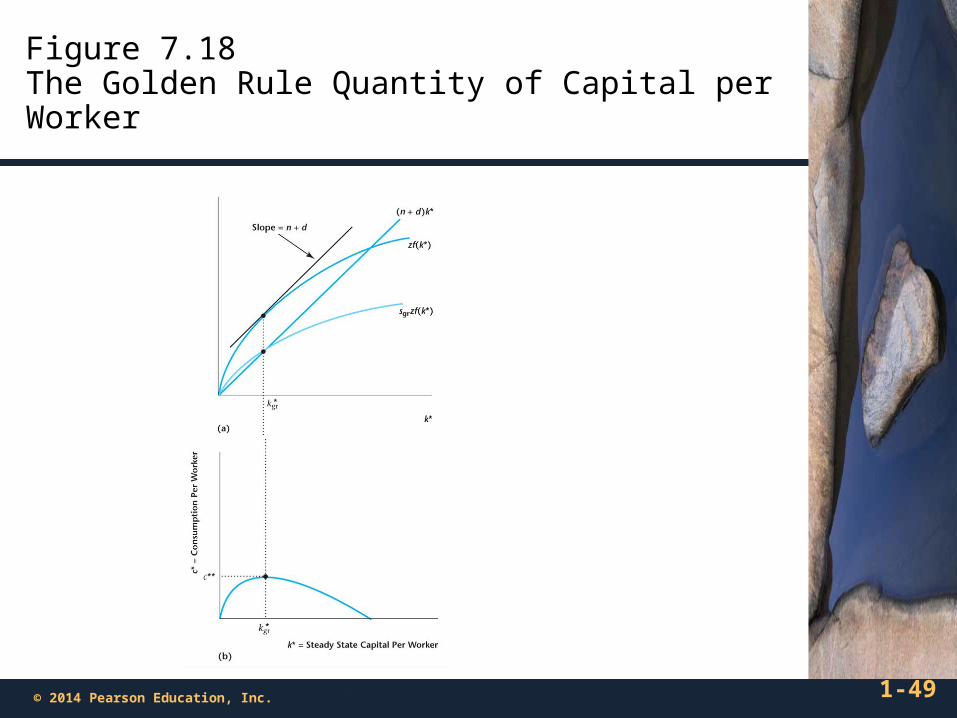
Figure 7.18The Golden Rule Quantity of Capital per Worker

1-50© 2014 Pearson Education, Inc.
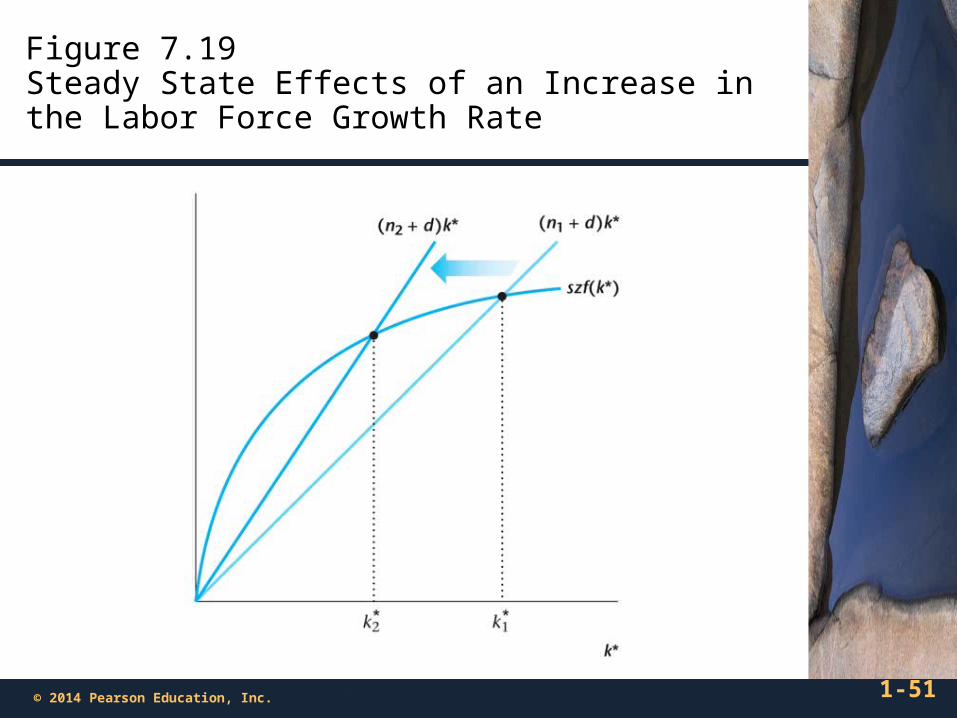
An Increase in the Population Growth Rate n
• Capital per worker and output per worker decrease.
• There is no effect on the growth rates of aggregate variables.
1-51© 2014 Pearson Education, Inc.
Figure 7.19Steady State Effects of an Increase in the Labor Force Growth Rate

1-52© 2014 Pearson Education, Inc.
Increases in Total Factor Productivity z
• Sustained increases in z cause sustained increases in per capita income.

1-53© 2014 Pearson Education, Inc.
Figure 7.20Increases in Total Factor Productivity in the Solow Growth Model

1-54© 2014 Pearson Education, Inc.
Growth Accounting
• An approach that uses the production function and measurements of aggregate inputs and outputs to attribute economic growth to: (i) growth in factor inputs; (ii) total factor productivity growth.
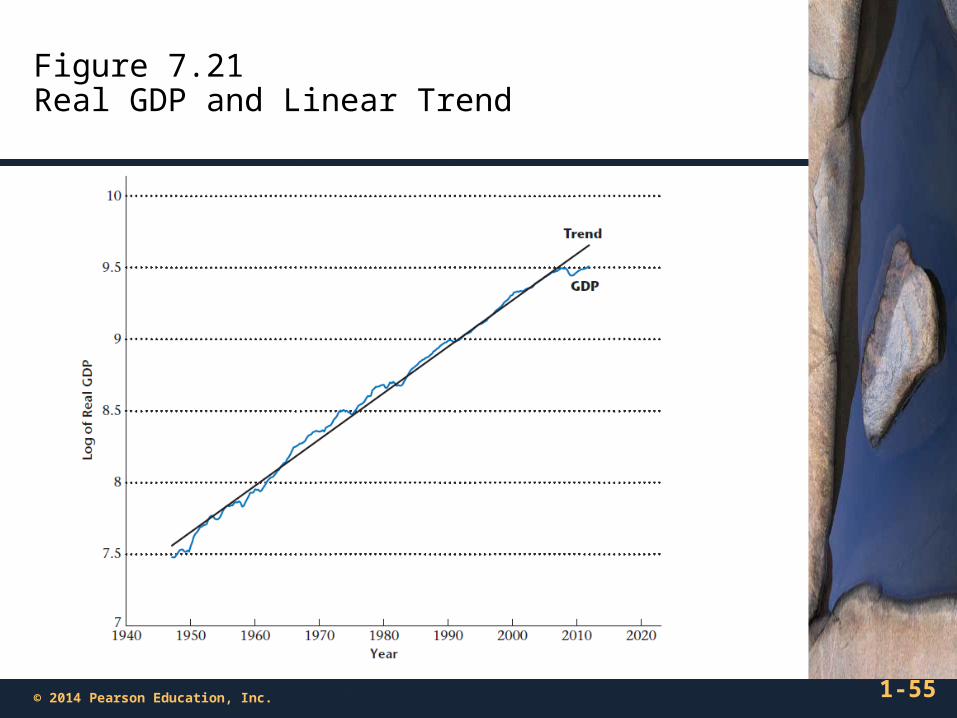
Figure 7.21Real GDP and Linear Trend
1-55© 2014 Pearson Education, Inc.
1-56© 2014 Pearson Education, Inc.
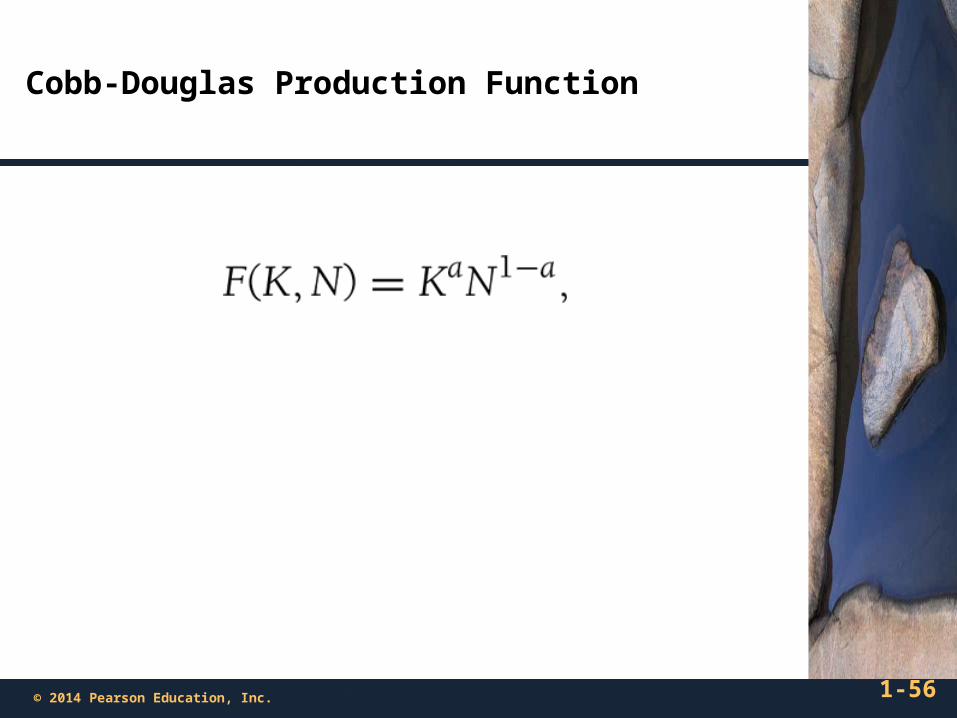
Cobb-Douglas Production Function

Figure 7.22Percentage Deviation of Real GDP from a Linear Trend
1-57© 2014 Pearson Education, Inc.

1-58© 2014 Pearson Education, Inc.
Cobb-Douglas Production Function
A labor share in national income of 70% gives:
0.3 0.7Y zK N
1-59© 2014 Pearson Education, Inc.
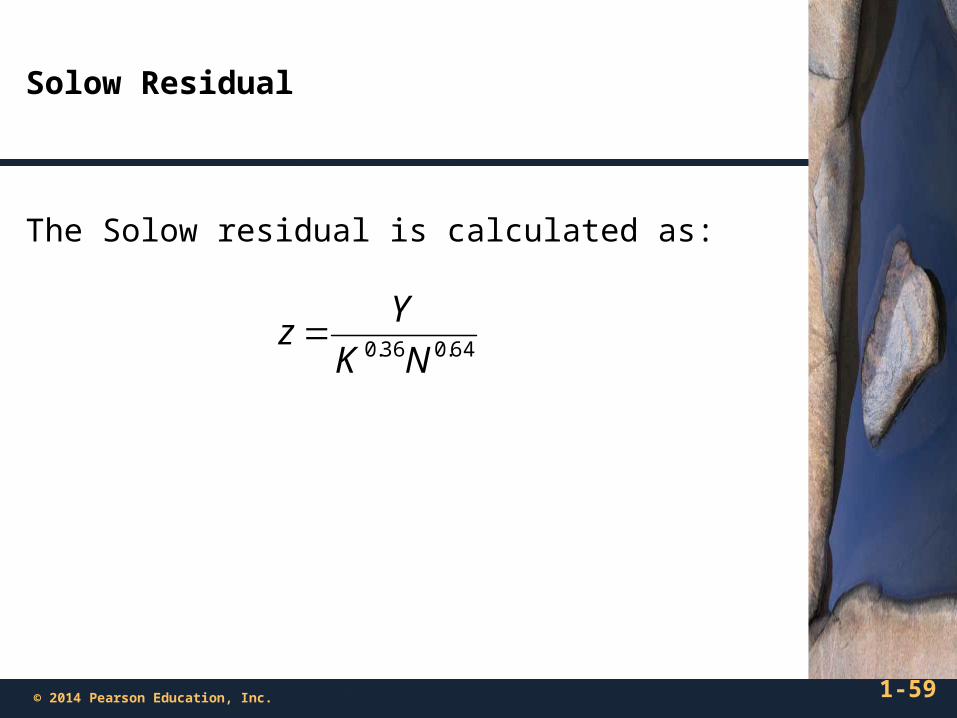
Solow Residual
The Solow residual is calculated as:
64.036.0 NK
Yz

1-60© 2014 Pearson Education, Inc.
Figure 7.23Natural Log of the Solow Residual

1-61© 2014 Pearson Education, Inc.
Average Annual Growth Rates in the Solow Residual
1-62© 2014 Pearson Education, Inc.
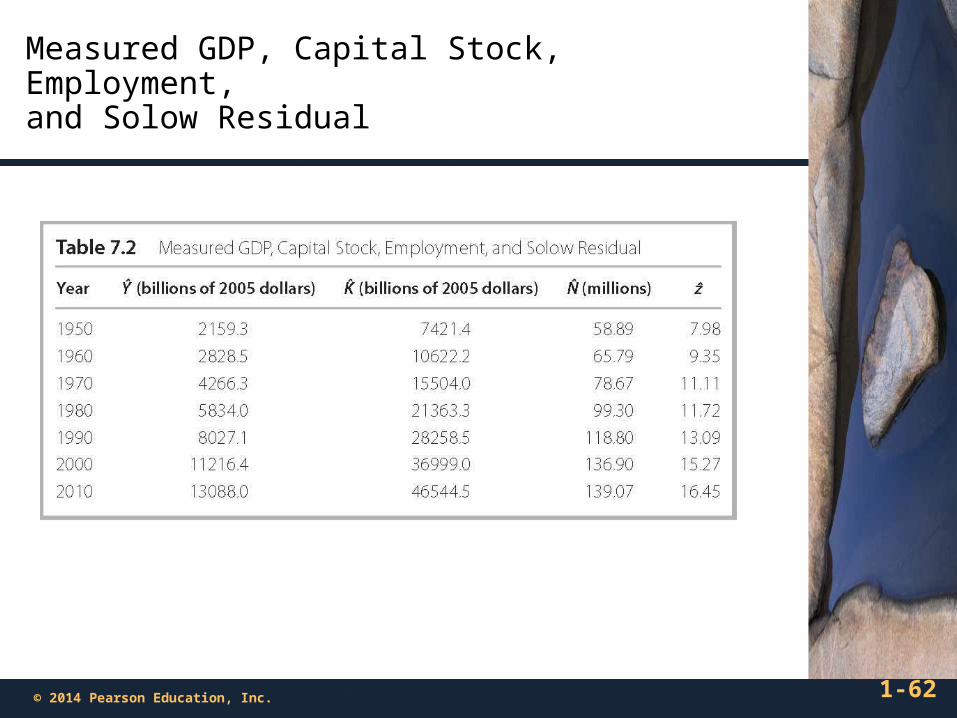
Measured GDP, Capital Stock, Employment, and Solow Residual
1-63© 2014 Pearson Education, Inc.
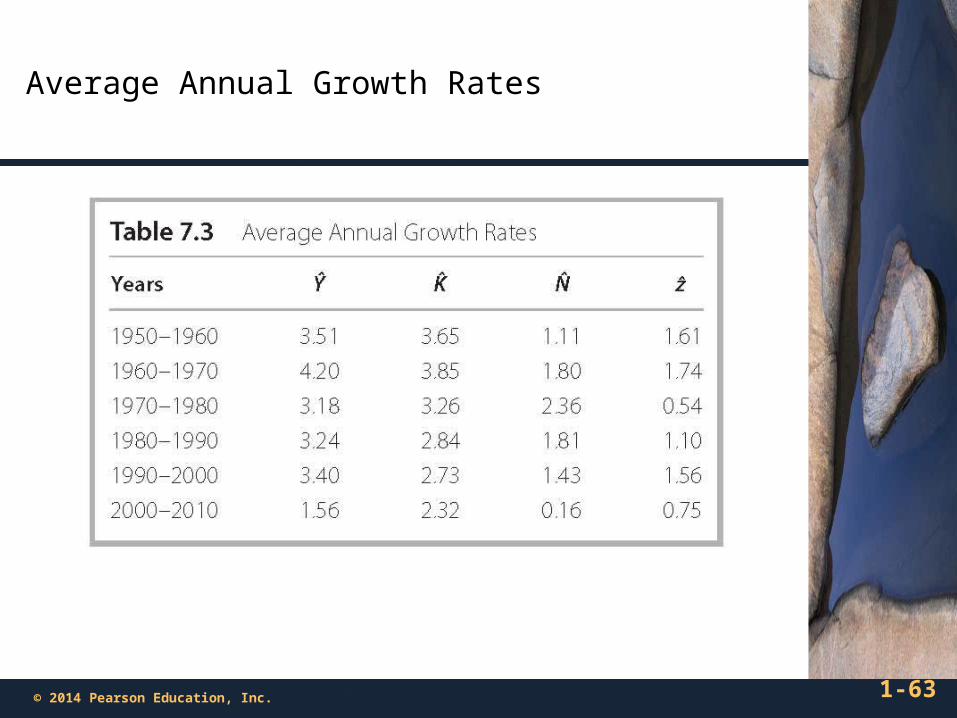
Average Annual Growth Rates