chapter 6 - week 10
TRANSCRIPT
Chapter 6-1
Quiz 3 – 5 % - Chapter 5 & 6Quiz 3 – 5 % - Chapter 5 & 6
Class Assignment – 5% - Chapter 6Class Assignment – 5% - Chapter 6
Week 11 – 6/12/2010
Chapter 6-2
Reporting and Analyzing Inventory
Accounting, Third Edition
Chapter 6-3
1. Describe the steps in determining inventory quantities.
2. Explain the basis of accounting for inventories and apply the inventory cost flow methods under a periodic inventory system.
3. Explain the financial statement and tax effects of each of the inventory cost flow assumptions.
4. Explain the lower-of-cost-or-market basis of accounting for inventories.
5. Compute and interpret the inventory turnover ratio.
6. Describe the LIFO reserve and explain its importance for comparing results of different companies.
7. Apply the inventory cost flow methods to perpetual inventory records.
8. Indicate the effects of inventory errors on the financial statements.
Study ObjectivesStudy ObjectivesStudy ObjectivesStudy Objectives
Chapter 6-4
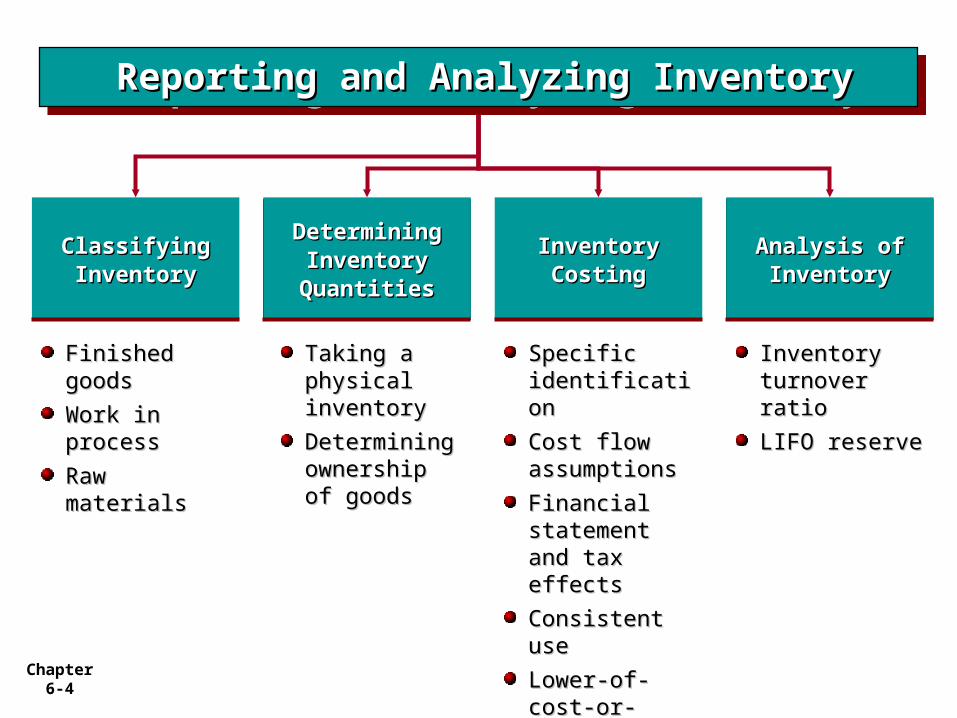
Classifying Classifying InventoryInventory
Classifying Classifying InventoryInventory
Finished goodsFinished goods
Work in processWork in process
Raw materialsRaw materials
Inventory Inventory turnover ratioturnover ratio
LIFO reserveLIFO reserve
Specific Specific identificationidentification
Cost flow Cost flow assumptionsassumptions
Financial Financial statement and statement and tax effectstax effects
Consistent useConsistent use
Lower-of-cost-Lower-of-cost-or-marketor-market
Taking a Taking a physical physical inventoryinventory
Determining Determining ownership of ownership of goodsgoods
Determining Determining Inventory Inventory QuantitiesQuantities
Determining Determining Inventory Inventory QuantitiesQuantities
Inventory Inventory CostingCosting
Inventory Inventory CostingCosting
Analysis of Analysis of InventoryInventory
Analysis of Analysis of InventoryInventory
Reporting and Analyzing InventoryReporting and Analyzing InventoryReporting and Analyzing InventoryReporting and Analyzing Inventory
Chapter 6-5
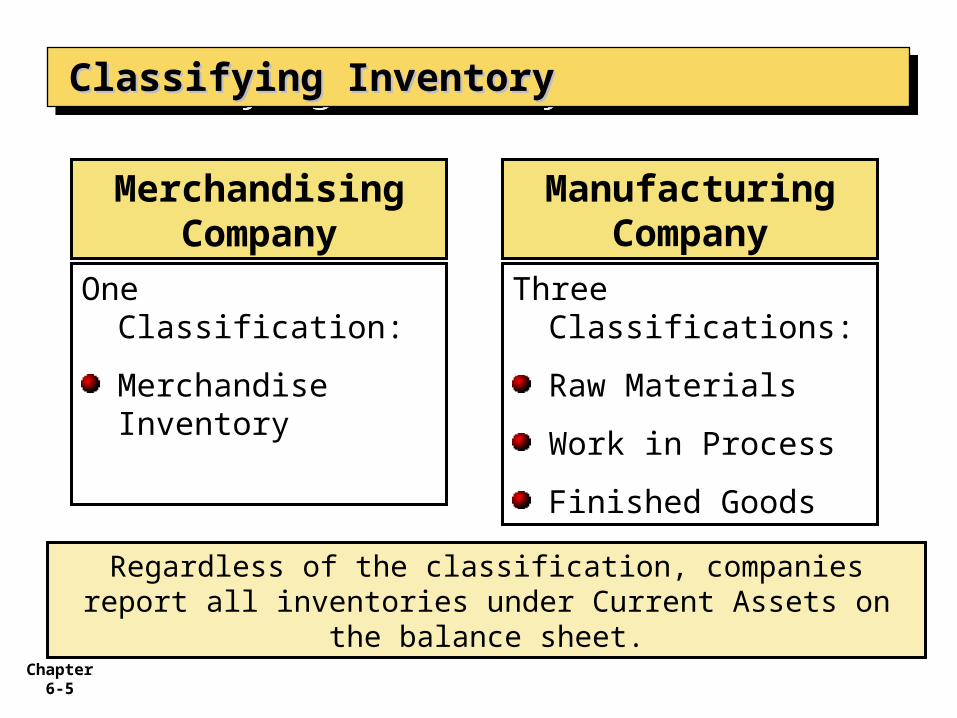
Classifying InventoryClassifying InventoryClassifying InventoryClassifying Inventory
One Classification:
Merchandise Inventory
Three Classifications:
Raw Materials
Work in Process
Finished Goods
Merchandising Company
Manufacturing Company
Regardless of the classification, companies report all inventories under Current Assets on the balance sheet.
Chapter 6-6
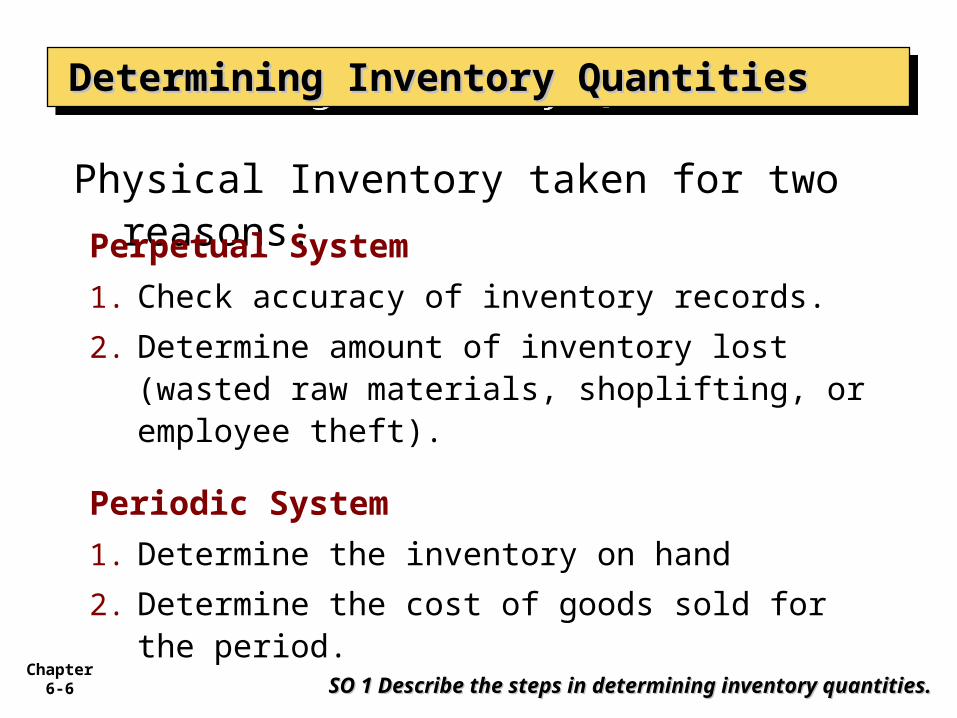
Physical Inventory taken for two reasons:Perpetual System
1. Check accuracy of inventory records.
2. Determine amount of inventory lost (wasted raw materials, shoplifting, or employee theft).
Periodic System
1. Determine the inventory on hand
2. Determine the cost of goods sold for the period.
Determining Inventory QuantitiesDetermining Inventory QuantitiesDetermining Inventory QuantitiesDetermining Inventory Quantities
SO 1 Describe the steps in determining inventory quantities.SO 1 Describe the steps in determining inventory quantities.
Chapter 6-7
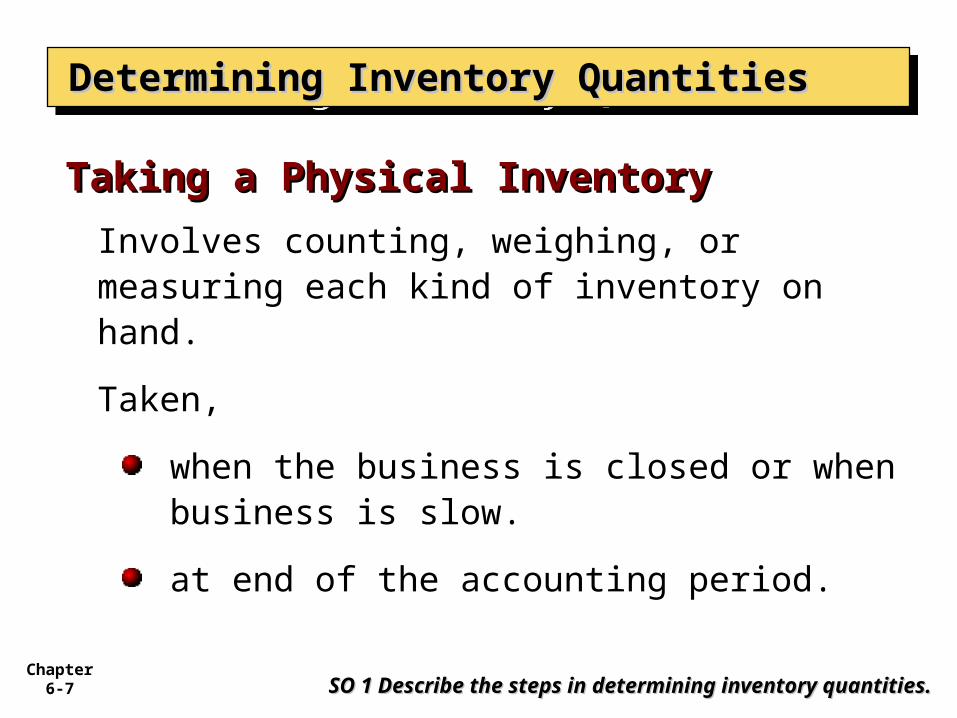
Involves counting, weighing, or measuring each kind of inventory on hand.
Taken,
when the business is closed or when business is slow.
at end of the accounting period.
Taking a Physical InventoryTaking a Physical Inventory
Determining Inventory QuantitiesDetermining Inventory QuantitiesDetermining Inventory QuantitiesDetermining Inventory Quantities
SO 1 Describe the steps in determining inventory quantities.SO 1 Describe the steps in determining inventory quantities.
Chapter 6-8
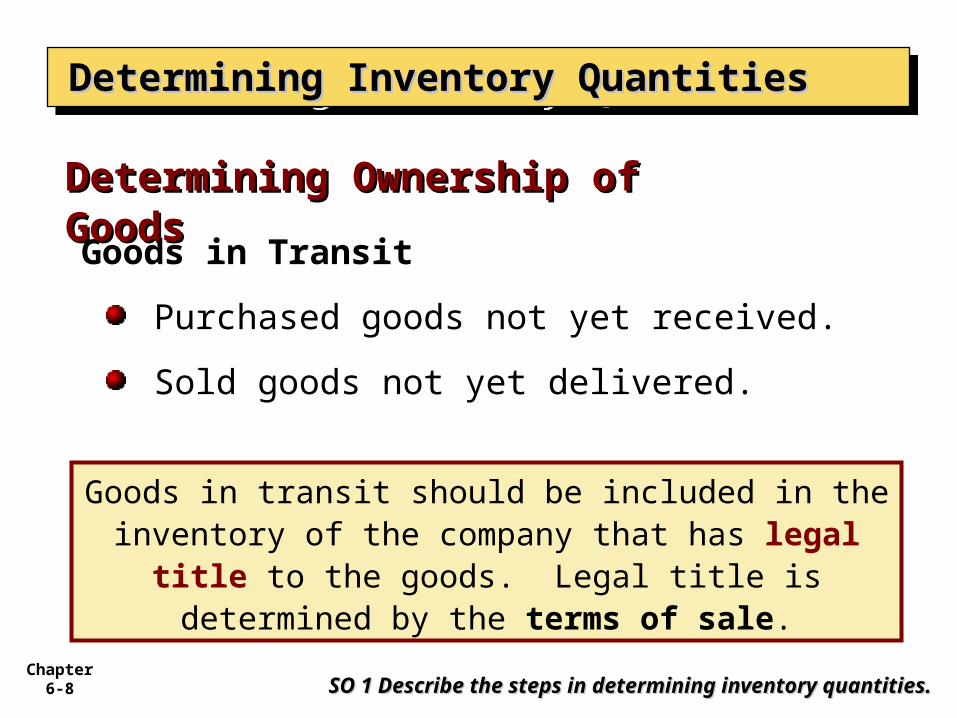
Goods in Transit
Purchased goods not yet received.
Sold goods not yet delivered.
Determining Ownership of Determining Ownership of GoodsGoods
Determining Inventory QuantitiesDetermining Inventory QuantitiesDetermining Inventory QuantitiesDetermining Inventory Quantities
SO 1 Describe the steps in determining inventory quantities.SO 1 Describe the steps in determining inventory quantities.
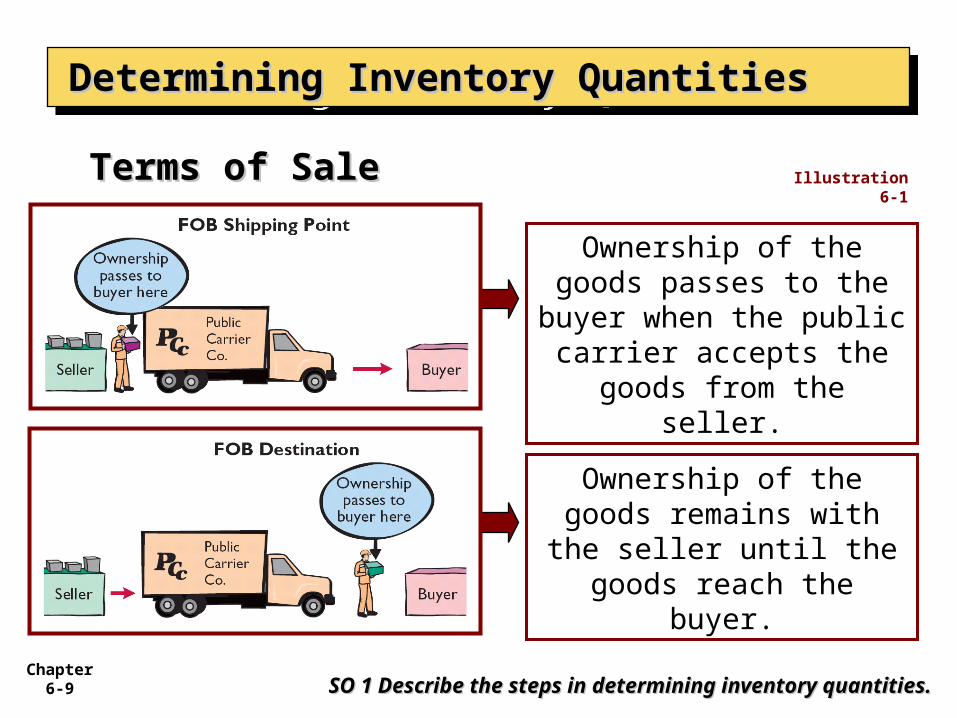
Goods in transit should be included in the inventory of the company that has legal title to
the goods. Legal title is determined by the terms of sale.
Chapter 6-9
Determining Inventory QuantitiesDetermining Inventory QuantitiesDetermining Inventory QuantitiesDetermining Inventory Quantities
SO 1 Describe the steps in determining inventory quantities.SO 1 Describe the steps in determining inventory quantities.
Illustration 6-1
Ownership of the goods passes to the buyer
when the public carrier accepts the goods from
the seller.
Ownership of the goods remains with the seller
until the goods reach the buyer.
Terms of SaleTerms of Sale

Chapter 6-10
Goods in transit should be included in the inventory of the buyer when the:
a. public carrier accepts the goods from the seller.
b. goods reach the buyer.
c. terms of sale are FOB destination.
d. terms of sale are FOB shipping point.
Review Question
Determining Inventory QuantitiesDetermining Inventory QuantitiesDetermining Inventory QuantitiesDetermining Inventory Quantities
SO 1 Describe the steps in determining inventory quantities.SO 1 Describe the steps in determining inventory quantities.
Chapter 6-11
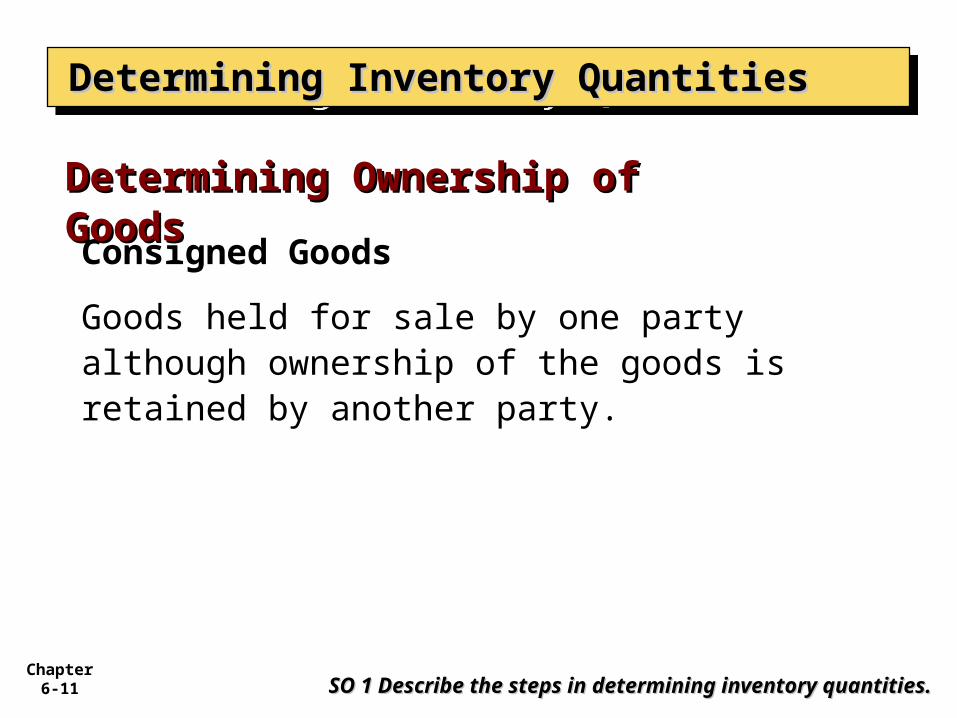
Consigned Goods
Goods held for sale by one party although ownership of the goods is retained by another party.
Determining Ownership of Determining Ownership of GoodsGoods
Determining Inventory QuantitiesDetermining Inventory QuantitiesDetermining Inventory QuantitiesDetermining Inventory Quantities
SO 1 Describe the steps in determining inventory quantities.SO 1 Describe the steps in determining inventory quantities.
Chapter 6-12
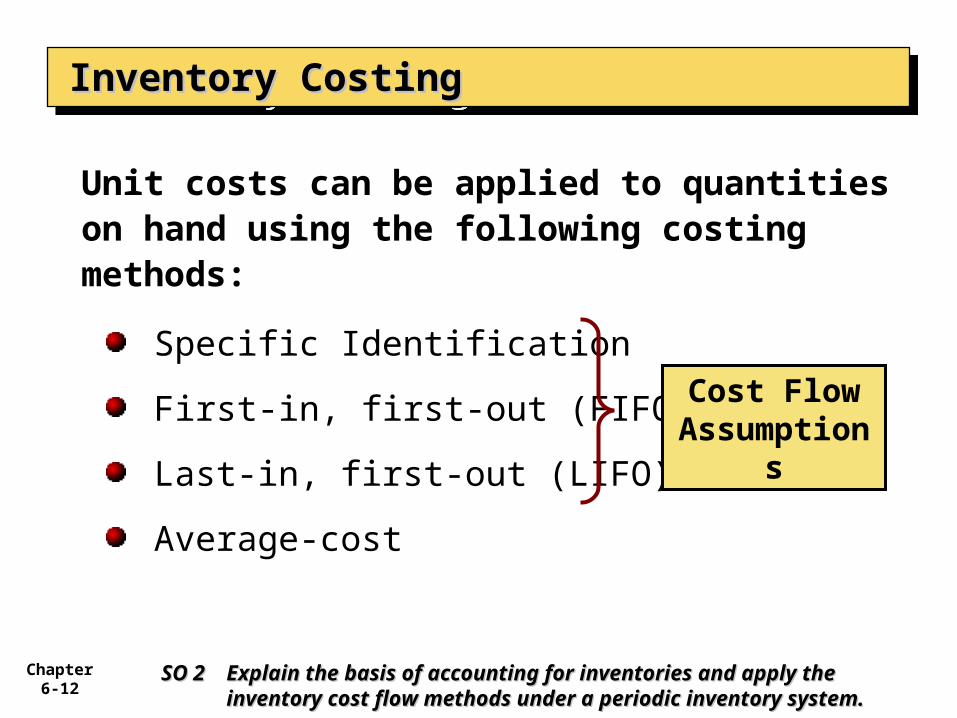
Unit costs can be applied to quantities on hand using the following costing methods:
Specific Identification
First-in, first-out (FIFO)
Last-in, first-out (LIFO)
Average-cost
Inventory CostingInventory CostingInventory CostingInventory Costing
SO 2 SO 2 Explain the basis of accounting for inventories and apply Explain the basis of accounting for inventories and apply the the inventory cost flow methods under a periodic inventory cost flow methods under a periodic inventory system.inventory system.
Cost Flow Assumptio
ns
Chapter 6-13
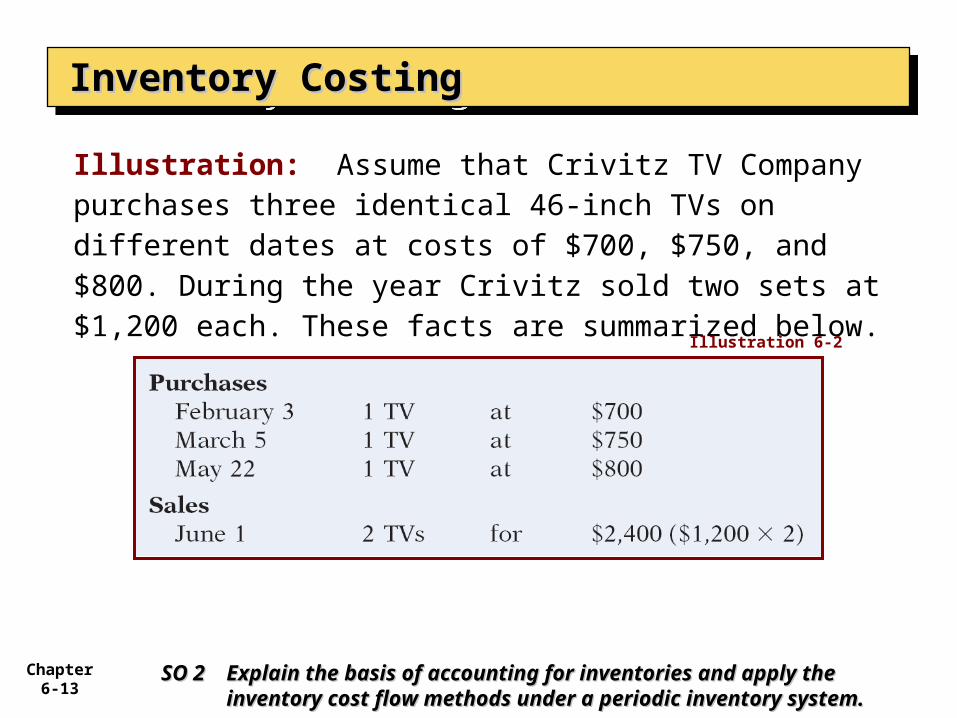
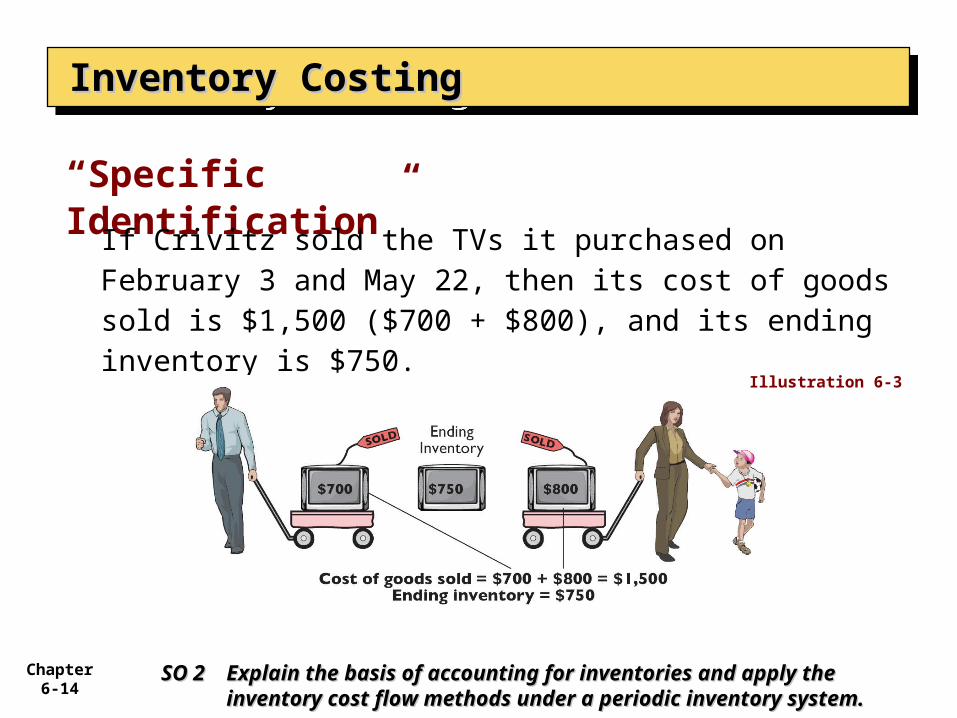
Illustration: Assume that Crivitz TV Company purchases three identical 46-inch TVs on different dates at costs of $700, $750, and $800. During the year Crivitz sold two sets at $1,200 each. These facts are summarized below.
Inventory CostingInventory CostingInventory CostingInventory Costing
Illustration 6-2
SO 2 SO 2 Explain the basis of accounting for inventories and apply Explain the basis of accounting for inventories and apply the the inventory cost flow methods under a periodic inventory cost flow methods under a periodic inventory system.inventory system.
Chapter 6-14
“Specific Identification”
Inventory CostingInventory CostingInventory CostingInventory Costing
If Crivitz sold the TVs it purchased on February 3 and May 22, then its cost of goods sold is $1,500 ($700 + $800), and its ending inventory is $750.
Illustration 6-3
SO 2 SO 2 Explain the basis of accounting for inventories and apply Explain the basis of accounting for inventories and apply the the inventory cost flow methods under a periodic inventory cost flow methods under a periodic inventory system.inventory system.
Chapter 6-15
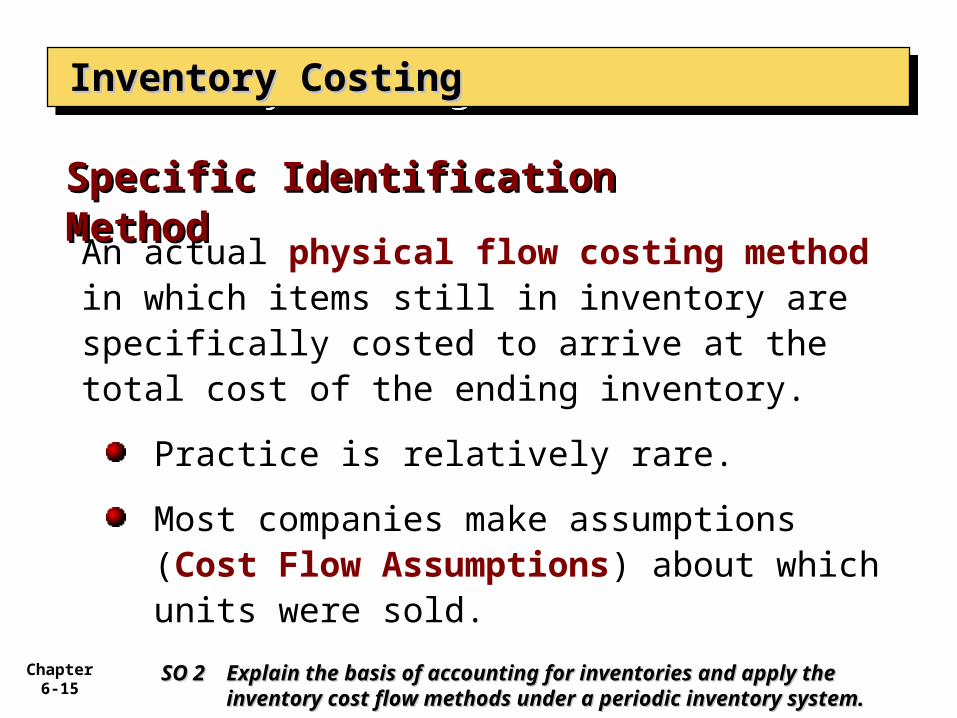
An actual physical flow costing method in which items still in inventory are specifically costed to arrive at the total cost of the ending inventory.
Practice is relatively rare.
Most companies make assumptions (Cost Flow Assumptions) about which units were sold.
Specific Identification MethodSpecific Identification Method
Inventory CostingInventory CostingInventory CostingInventory Costing
SO 2 SO 2 Explain the basis of accounting for inventories and apply Explain the basis of accounting for inventories and apply the the inventory cost flow methods under a periodic inventory cost flow methods under a periodic inventory system.inventory system.
Chapter 6-16
Inventory Costing – Cost Flow AssumptionsInventory Costing – Cost Flow AssumptionsInventory Costing – Cost Flow AssumptionsInventory Costing – Cost Flow Assumptions
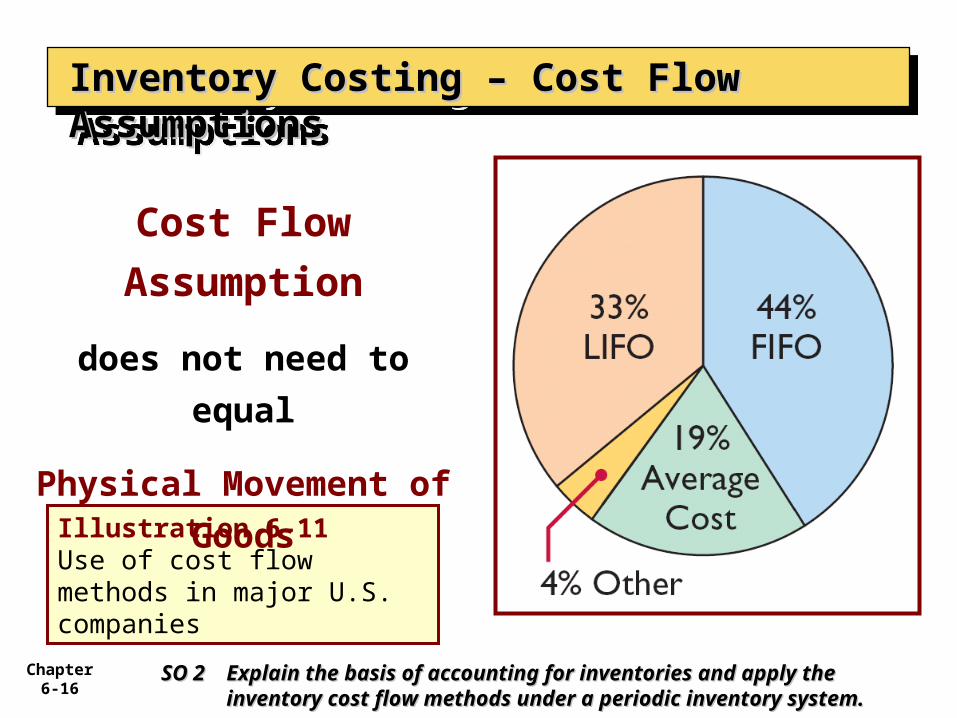
Illustration 6-11Use of cost flow methods in major U.S. companies
Cost Flow
Assumption
does not need to
equal
Physical Movement
of Goods
SO 2 SO 2 Explain the basis of accounting for inventories and apply Explain the basis of accounting for inventories and apply the the inventory cost flow methods under a periodic inventory cost flow methods under a periodic inventory system.inventory system.
Chapter 6-17
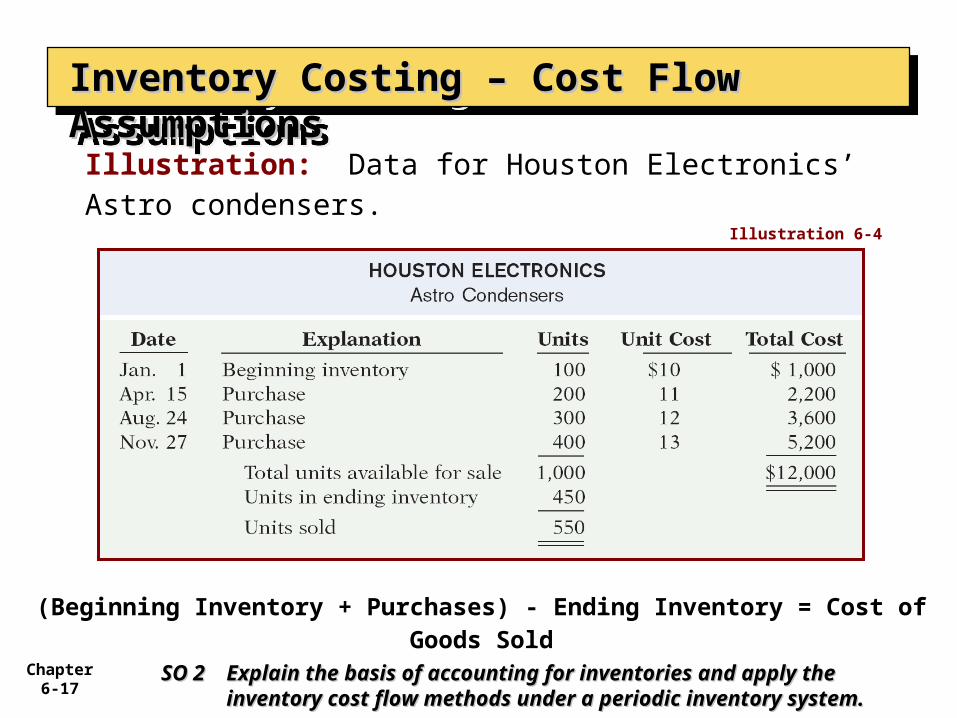
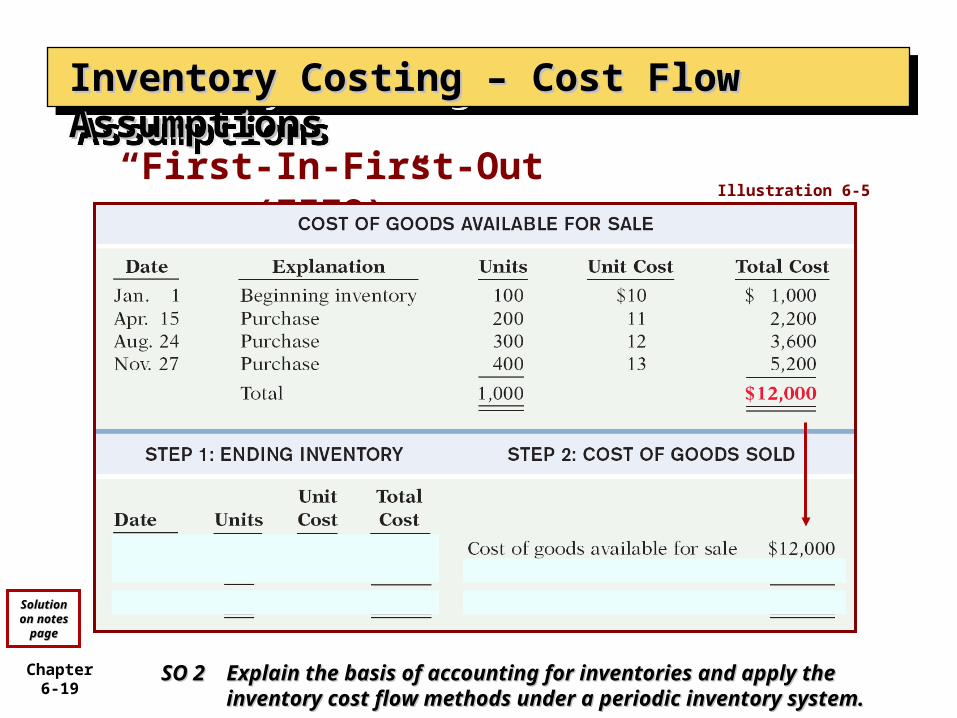
Illustration: Data for Houston Electronics’ Astro condensers.
Inventory Costing – Cost Flow AssumptionsInventory Costing – Cost Flow AssumptionsInventory Costing – Cost Flow AssumptionsInventory Costing – Cost Flow Assumptions
Illustration 6-4
(Beginning Inventory + Purchases) - Ending Inventory = Cost of Goods Sold
SO 2 SO 2 Explain the basis of accounting for inventories and apply Explain the basis of accounting for inventories and apply the the inventory cost flow methods under a periodic inventory cost flow methods under a periodic inventory system.inventory system.
Chapter 6-18
Earliest goods purchased are first to be sold.
Often parallels actual physical flow of merchandise.
Generally good business practice to sell oldest units first.
““First-In-First-Out (FIFO)”First-In-First-Out (FIFO)”
Inventory Costing – Cost Flow AssumptionsInventory Costing – Cost Flow AssumptionsInventory Costing – Cost Flow AssumptionsInventory Costing – Cost Flow Assumptions
SO 2 SO 2 Explain the basis of accounting for inventories and apply Explain the basis of accounting for inventories and apply the the inventory cost flow methods under a periodic inventory cost flow methods under a periodic inventory system.inventory system.
Chapter 6-19
“First-In-First-Out (FIFO)”
Inventory Costing – Cost Flow AssumptionsInventory Costing – Cost Flow AssumptionsInventory Costing – Cost Flow AssumptionsInventory Costing – Cost Flow Assumptions
Illustration 6-5
SO 2 SO 2 Explain the basis of accounting for inventories and apply Explain the basis of accounting for inventories and apply the the inventory cost flow methods under a periodic inventory cost flow methods under a periodic inventory system.inventory system.
SolutioSolution on n on
notes notes pagepage
Chapter 6-20
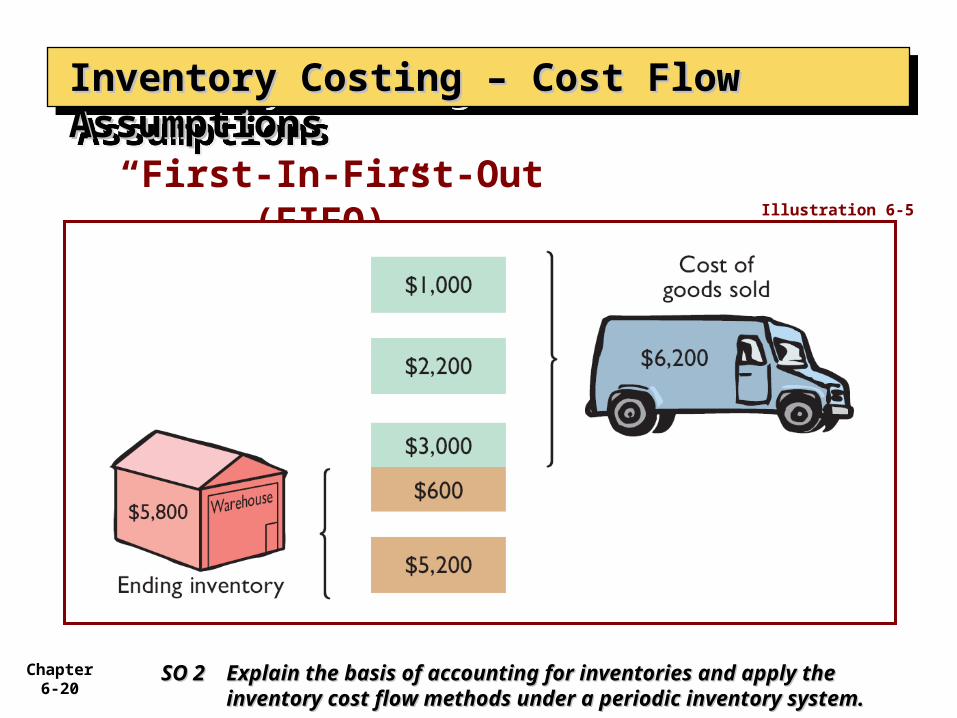
“First-In-First-Out (FIFO)”
Inventory Costing – Cost Flow AssumptionsInventory Costing – Cost Flow AssumptionsInventory Costing – Cost Flow AssumptionsInventory Costing – Cost Flow Assumptions
Illustration 6-5
SO 2 SO 2 Explain the basis of accounting for inventories and apply Explain the basis of accounting for inventories and apply the the inventory cost flow methods under a periodic inventory cost flow methods under a periodic inventory system.inventory system.
Chapter 6-21
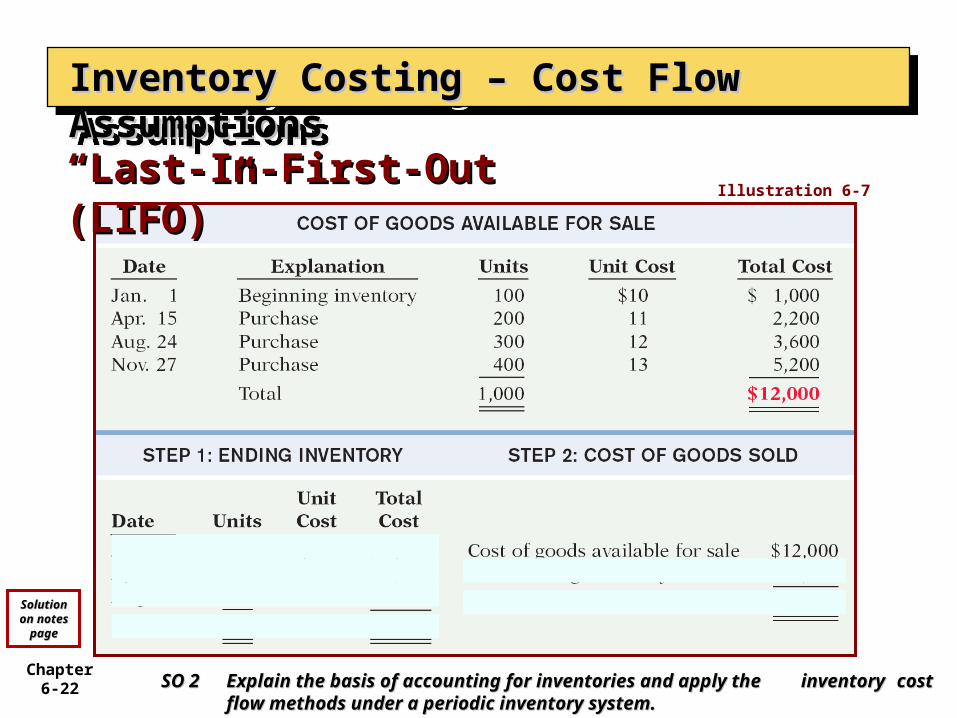
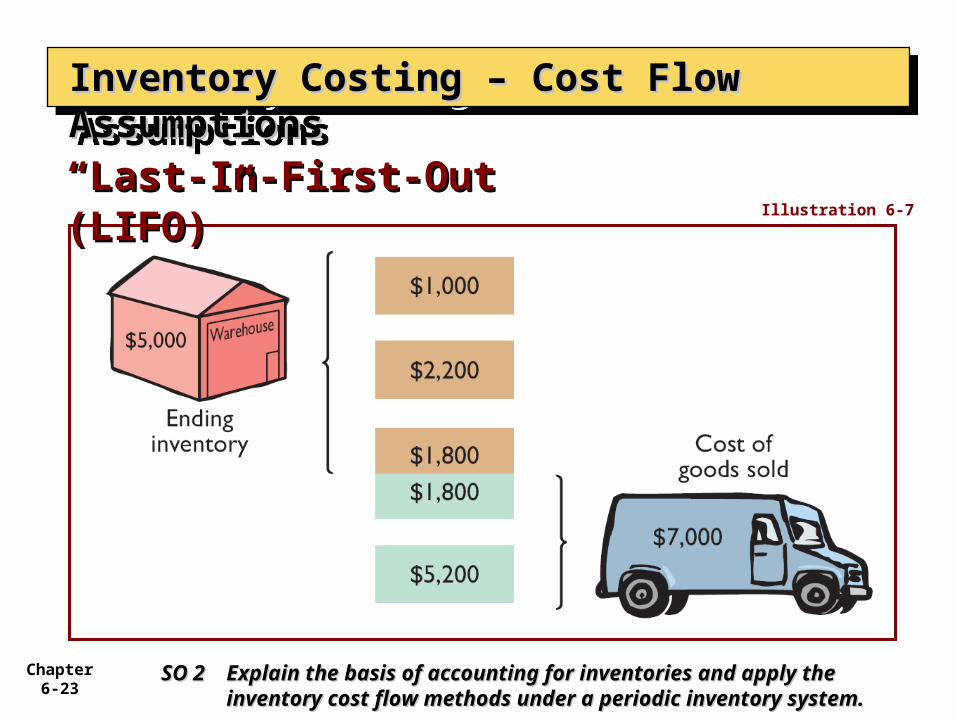
Latest goods purchased are first to be sold.
Seldom coincides with actual physical flow of merchandise.
Exceptions include goods stored in piles, such as coal or hay.
““Last-In-First-Out (LIFO)”Last-In-First-Out (LIFO)”
Inventory Costing – Cost Flow AssumptionsInventory Costing – Cost Flow AssumptionsInventory Costing – Cost Flow AssumptionsInventory Costing – Cost Flow Assumptions
SO 2 SO 2 Explain the basis of accounting for inventories and apply Explain the basis of accounting for inventories and apply the the inventory cost flow methods under a periodic inventory cost flow methods under a periodic inventory system.inventory system.
Chapter 6-22
““Last-In-First-Out Last-In-First-Out (LIFO)”(LIFO)”
Inventory Costing – Cost Flow AssumptionsInventory Costing – Cost Flow AssumptionsInventory Costing – Cost Flow AssumptionsInventory Costing – Cost Flow Assumptions
Illustration 6-7
SO 2 SO 2 Explain the basis of accounting for inventories and apply the Explain the basis of accounting for inventories and apply the inventory inventory cost flow methods under a periodic inventory cost flow methods under a periodic inventory system.system.
SolutioSolution on n on
notes notes pagepage
Chapter 6-23
““Last-In-First-Out (LIFO)”Last-In-First-Out (LIFO)”
Inventory Costing – Cost Flow AssumptionsInventory Costing – Cost Flow AssumptionsInventory Costing – Cost Flow AssumptionsInventory Costing – Cost Flow Assumptions
Illustration 6-7
SO 2 SO 2 Explain the basis of accounting for inventories and apply Explain the basis of accounting for inventories and apply the the inventory cost flow methods under a periodic inventory cost flow methods under a periodic inventory system.inventory system.
Chapter 6-24
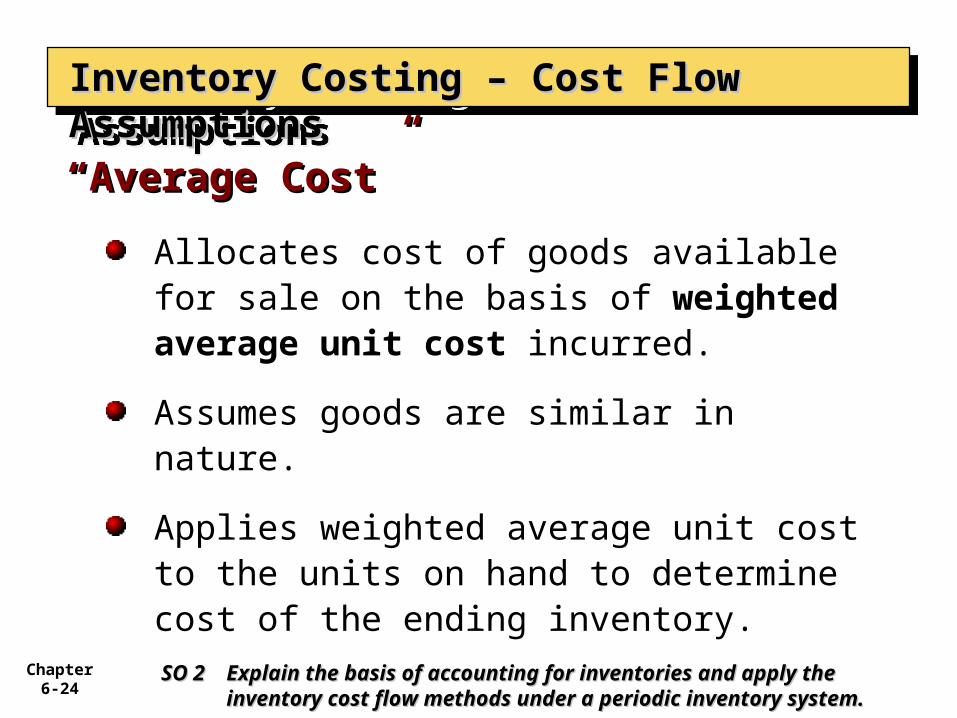
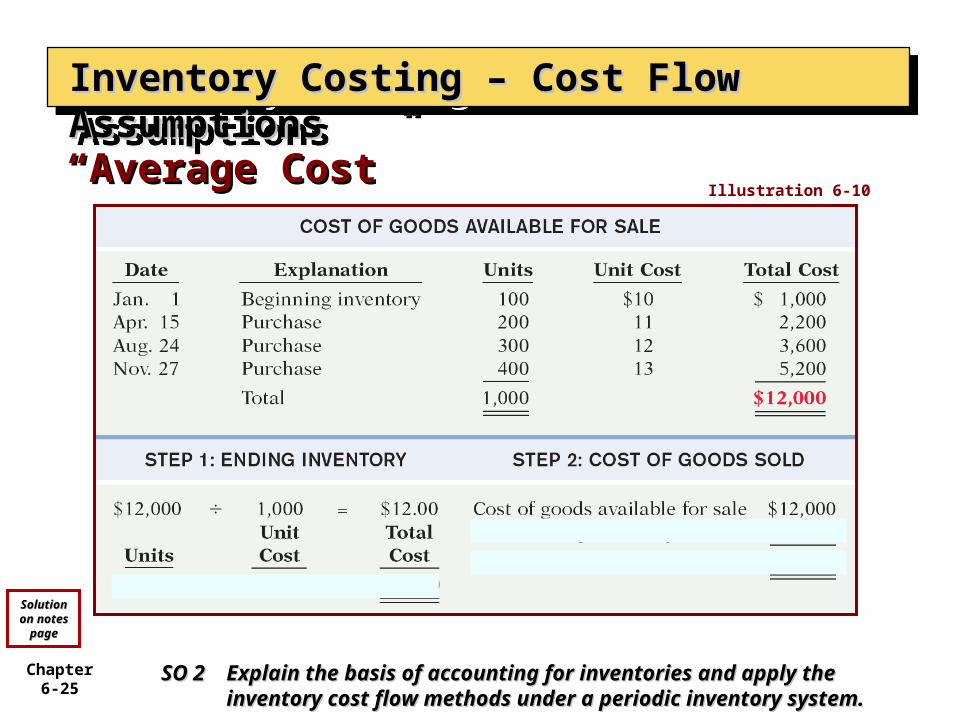
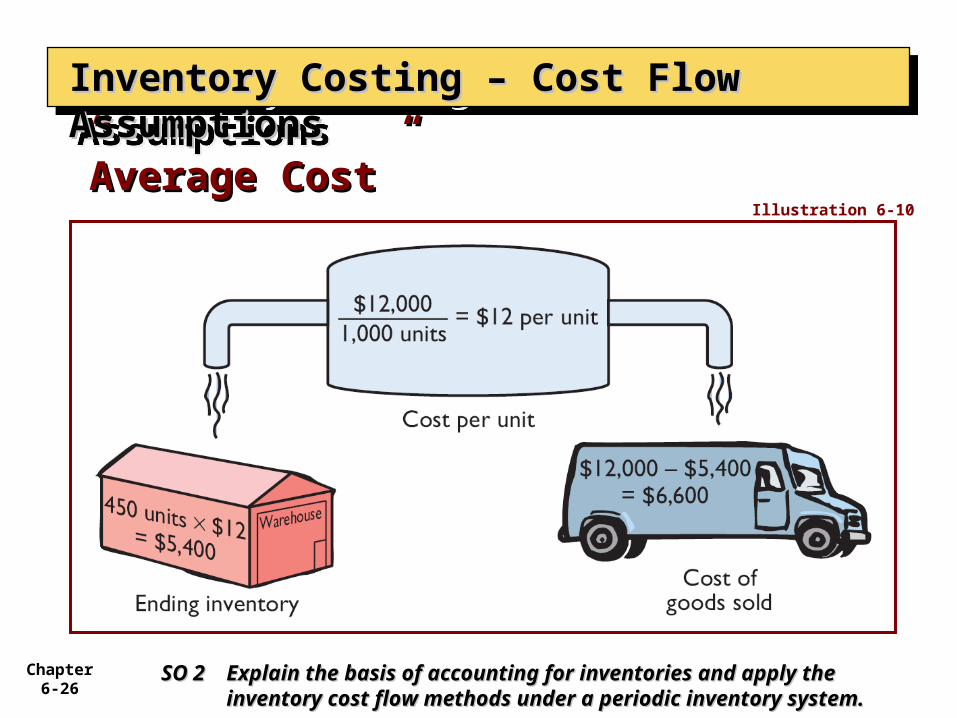
Allocates cost of goods available for sale on the basis of weighted average unit cost incurred.
Assumes goods are similar in nature.
Applies weighted average unit cost to the units on hand to determine cost of the ending inventory.
““Average Cost”Average Cost”
Inventory Costing – Cost Flow AssumptionsInventory Costing – Cost Flow AssumptionsInventory Costing – Cost Flow AssumptionsInventory Costing – Cost Flow Assumptions
SO 2 SO 2 Explain the basis of accounting for inventories and apply Explain the basis of accounting for inventories and apply the the inventory cost flow methods under a periodic inventory cost flow methods under a periodic inventory system.inventory system.
Chapter 6-25
““Average Cost”Average Cost”
Inventory Costing – Cost Flow AssumptionsInventory Costing – Cost Flow AssumptionsInventory Costing – Cost Flow AssumptionsInventory Costing – Cost Flow Assumptions
Illustration 6-10
SO 2 SO 2 Explain the basis of accounting for inventories and apply Explain the basis of accounting for inventories and apply the the inventory cost flow methods under a periodic inventory cost flow methods under a periodic inventory system.inventory system.
SolutioSolution on n on
notes notes pagepage
Chapter 6-26
””Average Cost”Average Cost”
Inventory Costing – Cost Flow AssumptionsInventory Costing – Cost Flow AssumptionsInventory Costing – Cost Flow AssumptionsInventory Costing – Cost Flow Assumptions
Illustration 6-10
SO 2 SO 2 Explain the basis of accounting for inventories and apply Explain the basis of accounting for inventories and apply the the inventory cost flow methods under a periodic inventory cost flow methods under a periodic inventory system.inventory system.
Chapter 6-27
FIFO
LO 3 LO 3 Explain the financial statement and tax effects Explain the financial statement and tax effects of of each of the inventory cost flow each of the inventory cost flow assumptions.assumptions.
Inventory Costing – Cost Flow AssumptionsInventory Costing – Cost Flow AssumptionsInventory Costing – Cost Flow AssumptionsInventory Costing – Cost Flow Assumptions
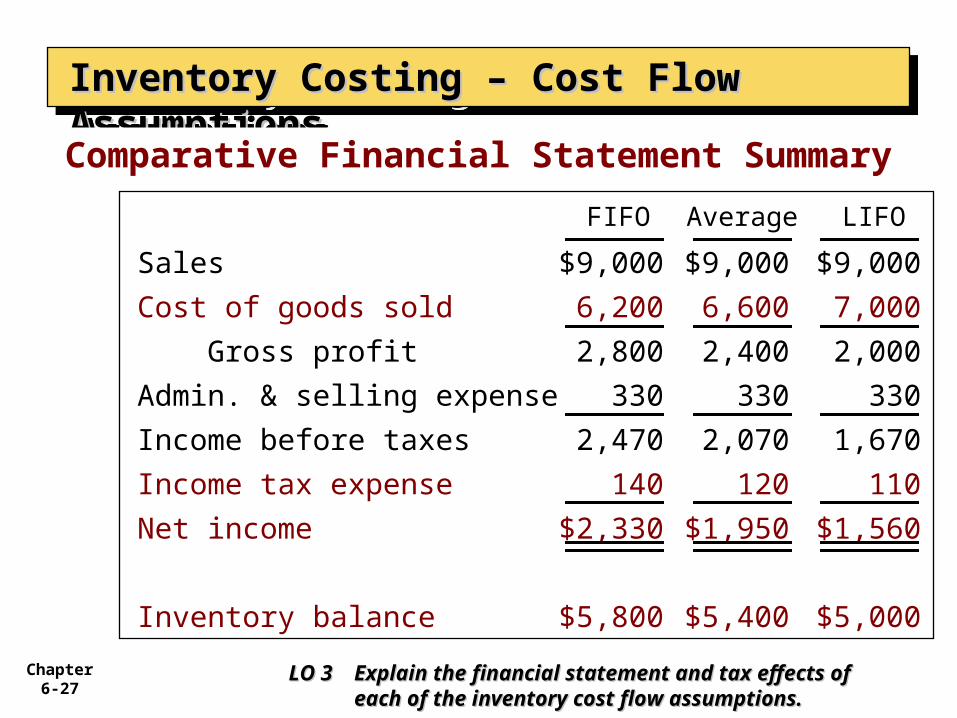
Sales $9,000 $9,000 $9,000
Cost of goods sold 6,200 6,600 7,000
Gross profit 2,800 2,400 2,000
Admin. & selling expense 330 330 330
Income before taxes 2,470 2,070 1,670
Income tax expense 140 120 110
Net income $2,330 $1,950 $1,560
Inventory balance $5,800 $5,400 $5,000
LIFOAverage
Comparative Financial Statement Summary
Chapter 6-28
FIFO
Inventory Costing – Cost Flow AssumptionsInventory Costing – Cost Flow AssumptionsInventory Costing – Cost Flow AssumptionsInventory Costing – Cost Flow Assumptions
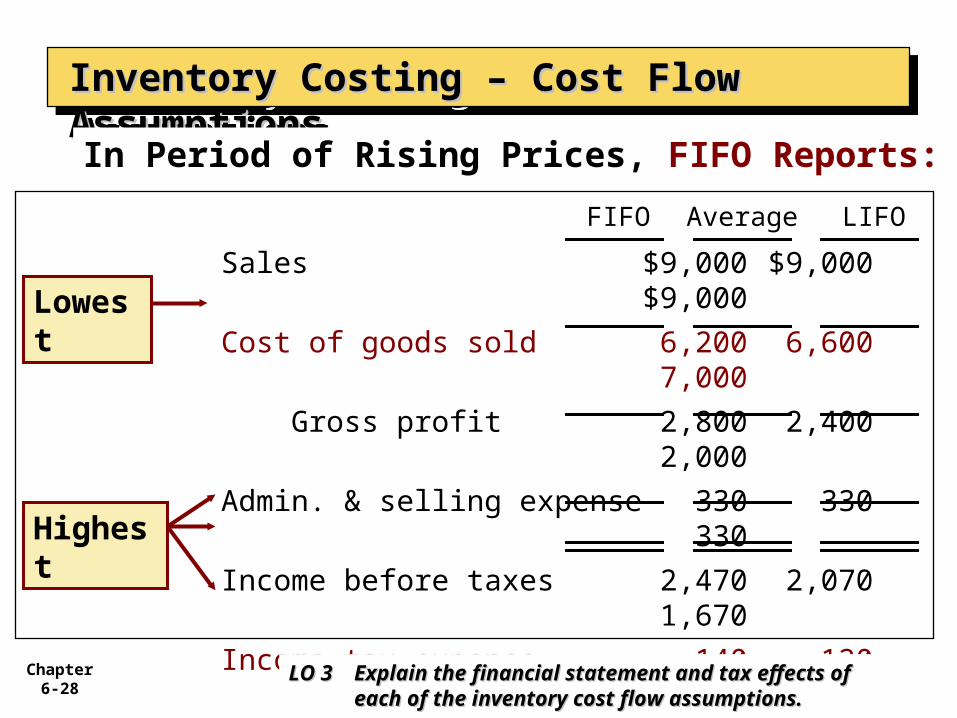
Sales $9,000 $9,000$9,000
Cost of goods sold 6,200 6,6007,000
Gross profit 2,800 2,4002,000
Admin. & selling expense 330 330330
Income before taxes 2,470 2,0701,670
Income tax expense 140 120110
Net income $2,330 $1,950$1,560
Inventory balance $5,800 $5,400$5,000
LIFOAverage
In Period of Rising Prices, FIFO Reports:
Highest
Lowest
LO 3 LO 3 Explain the financial statement and tax effects Explain the financial statement and tax effects of of each of the inventory cost flow each of the inventory cost flow assumptions.assumptions.
Chapter 6-29
FIFO
Inventory Costing – Cost Flow AssumptionsInventory Costing – Cost Flow AssumptionsInventory Costing – Cost Flow AssumptionsInventory Costing – Cost Flow Assumptions
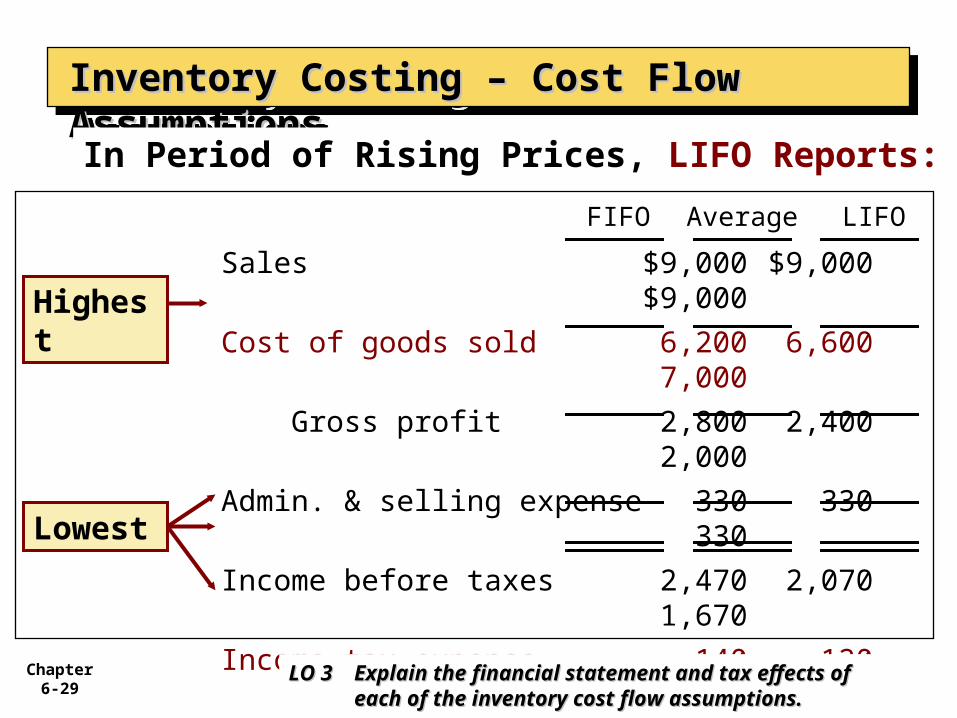
Sales $9,000 $9,000$9,000
Cost of goods sold 6,200 6,6007,000
Gross profit 2,800 2,4002,000
Admin. & selling expense 330 330330
Income before taxes 2,470 2,0701,670
Income tax expense 140 120110
Net income $2,330 $1,950$1,560
Inventory balance $5,800 $5,400$5,000
LIFOAverage
In Period of Rising Prices, LIFO Reports:
Lowest
Highest
LO 3 LO 3 Explain the financial statement and tax effects Explain the financial statement and tax effects of of each of the inventory cost flow each of the inventory cost flow assumptions.assumptions.
Chapter 6-30
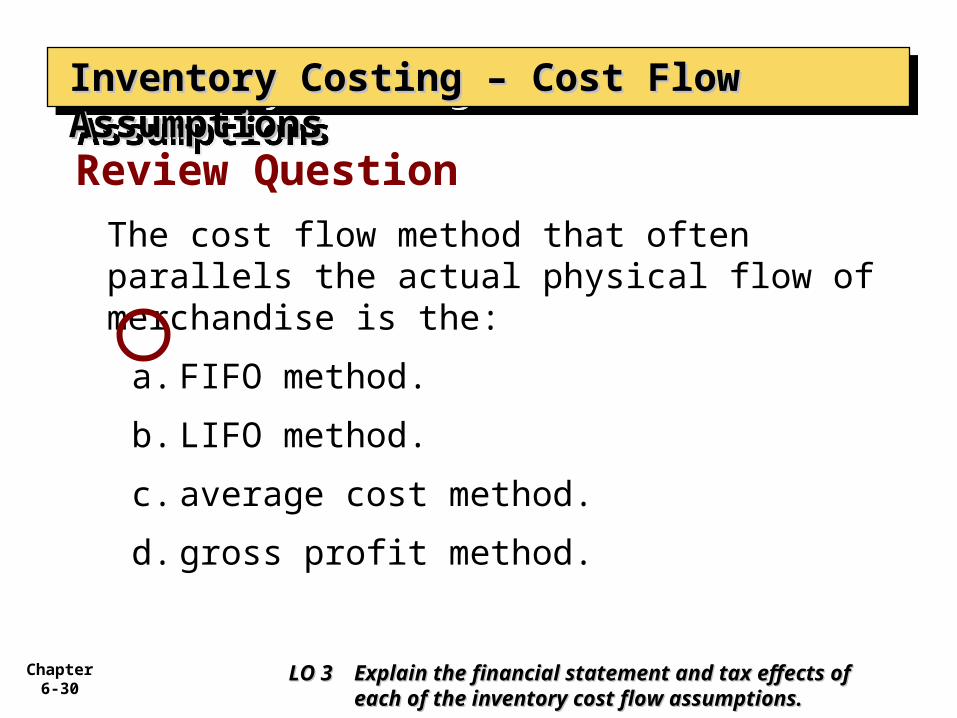
The cost flow method that often parallels the actual physical flow of merchandise is the:
a. FIFO method.
b. LIFO method.
c. average cost method.
d. gross profit method.
Review Question
Inventory Costing – Cost Flow AssumptionsInventory Costing – Cost Flow AssumptionsInventory Costing – Cost Flow AssumptionsInventory Costing – Cost Flow Assumptions
LO 3 LO 3 Explain the financial statement and tax effects Explain the financial statement and tax effects of of each of the inventory cost flow each of the inventory cost flow assumptions.assumptions.
Chapter 6-31
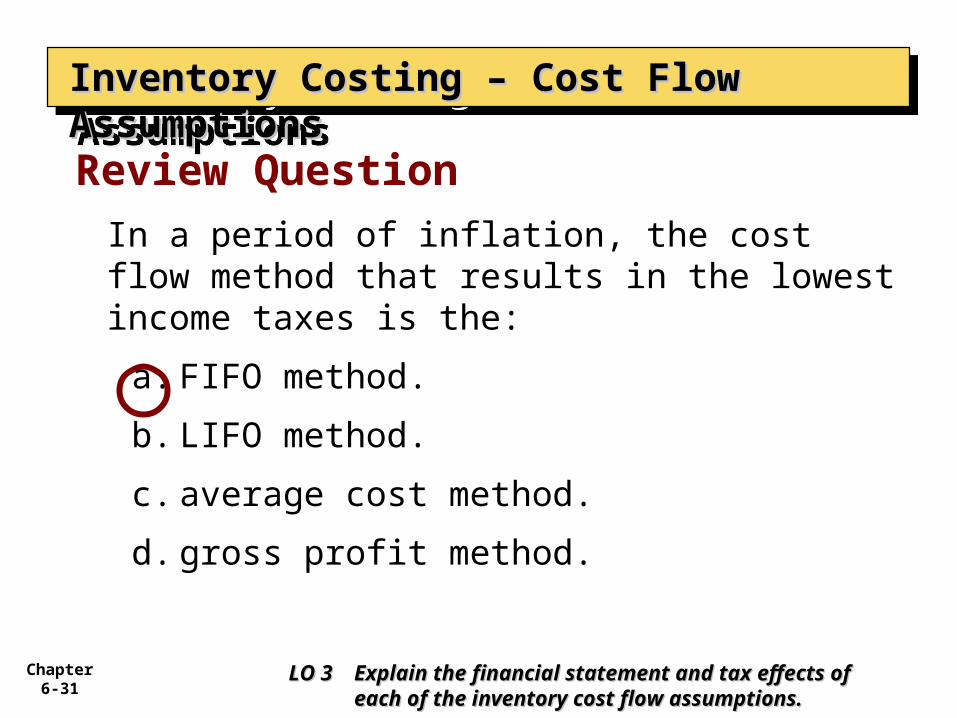
In a period of inflation, the cost flow method that results in the lowest income taxes is the:
a. FIFO method.
b. LIFO method.
c. average cost method.
d. gross profit method.
Review Question
Inventory Costing – Cost Flow AssumptionsInventory Costing – Cost Flow AssumptionsInventory Costing – Cost Flow AssumptionsInventory Costing – Cost Flow Assumptions
LO 3 LO 3 Explain the financial statement and tax effects Explain the financial statement and tax effects of of each of the inventory cost flow each of the inventory cost flow assumptions.assumptions.
Chapter 6-32
Using Cost Flow Methods Using Cost Flow Methods ConsistentlyConsistently
Inventory CostingInventory CostingInventory CostingInventory Costing
Method should be used consistently, enhances comparability.
Although consistency is preferred, a company may change its inventory costing method.
LO 3 LO 3 Explain the financial statement and tax effects Explain the financial statement and tax effects of of each of the inventory cost flow each of the inventory cost flow assumptions.assumptions.
Chapter 6-33
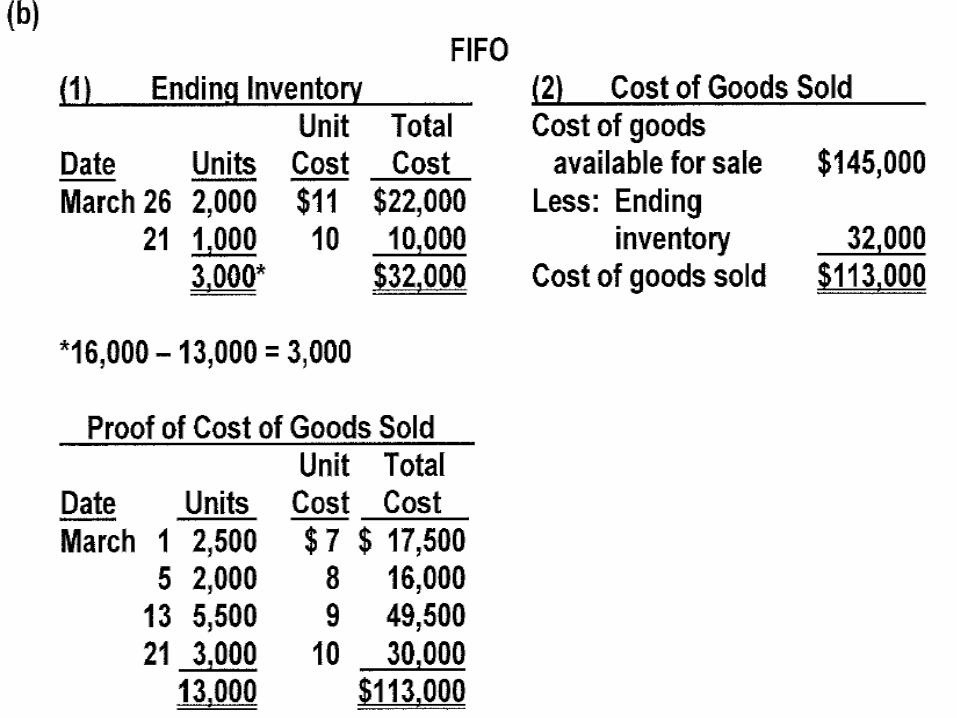
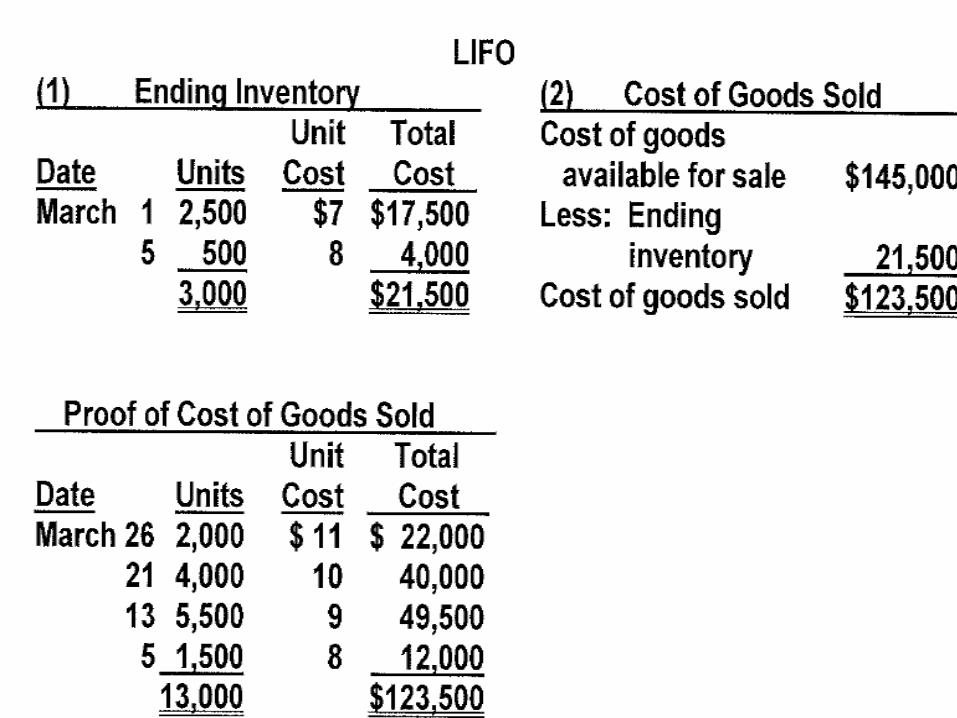
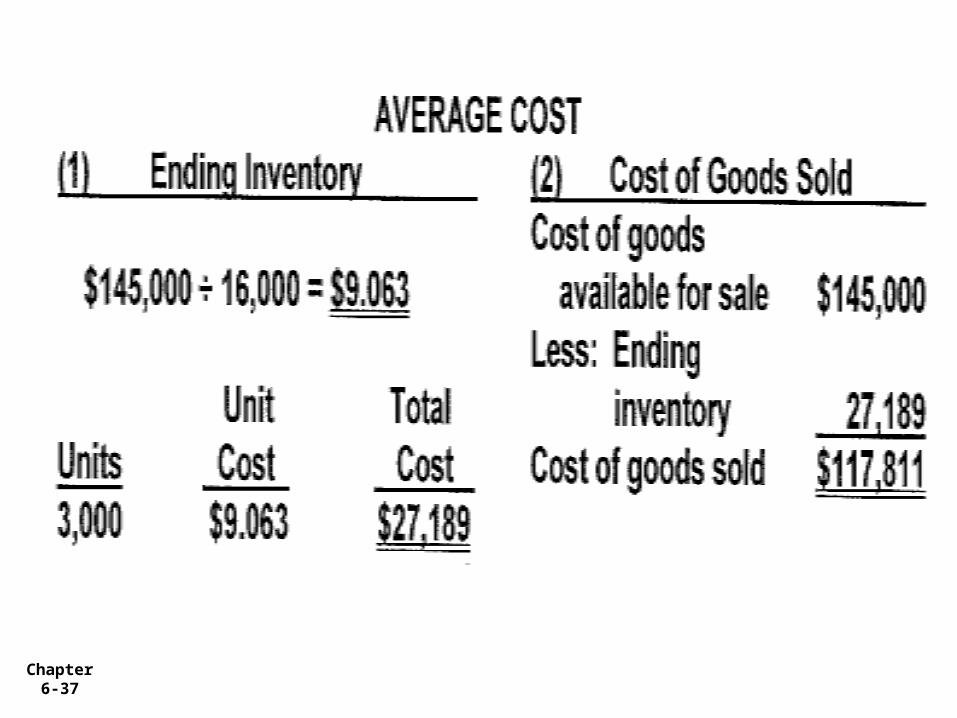
Question P6-2A on page 312Question P6-2A on page 312
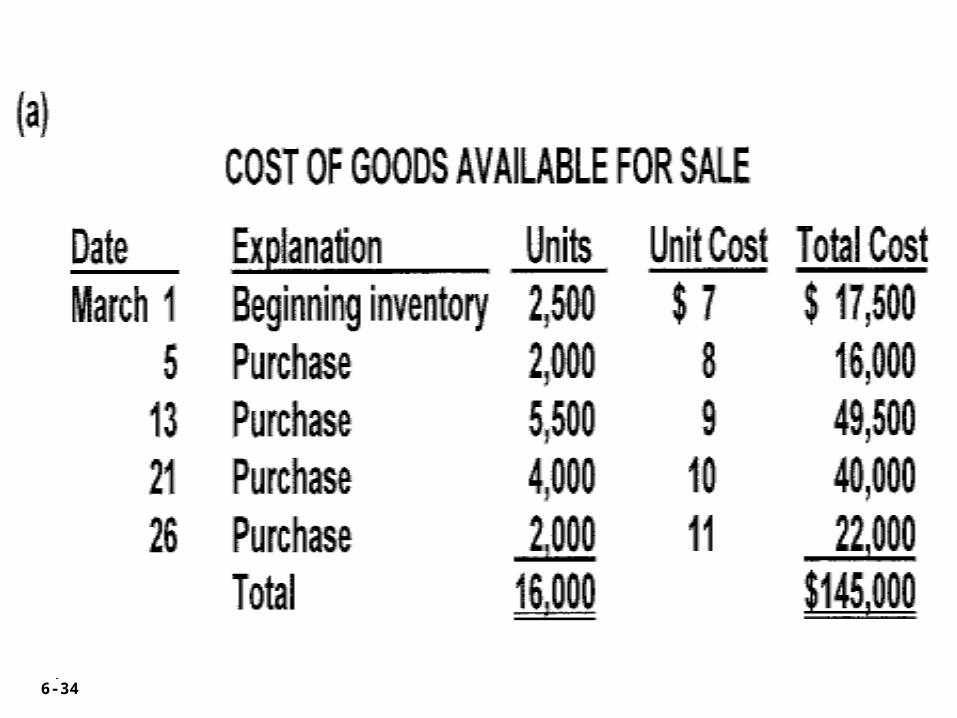
Chapter 6-34
Chapter 6-35
Chapter 6-36
Chapter 6-37

Chapter 6-38
Chapter 6-39
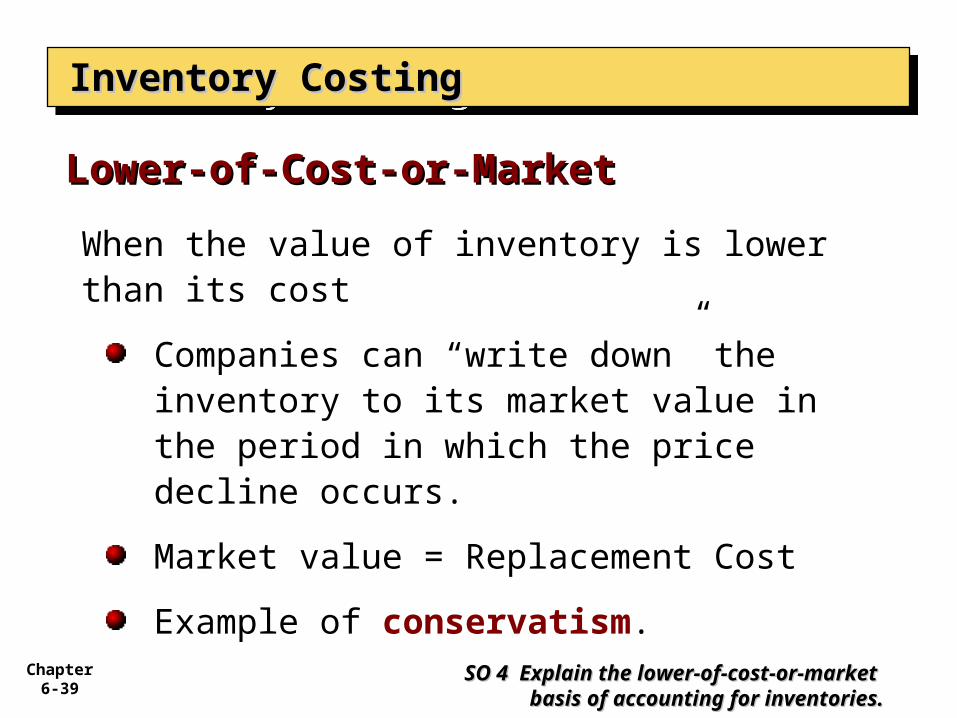
Lower-of-Cost-or-MarketLower-of-Cost-or-Market
Inventory CostingInventory CostingInventory CostingInventory Costing
SO 4 Explain the lower-of-cost-or-SO 4 Explain the lower-of-cost-or-market basis of accounting for market basis of accounting for inventories.inventories.
When the value of inventory is lower than its cost
Companies can “write down” the inventory to its market value in the period in which the price decline occurs.
Market value = Replacement Cost
Example of conservatism.
Chapter 6-40
Lower-of-Cost-or-MarketLower-of-Cost-or-Market
Inventory CostingInventory CostingInventory CostingInventory Costing
SO 4 Explain the lower-of-cost-or-SO 4 Explain the lower-of-cost-or-market basis of accounting for market basis of accounting for inventories.inventories.
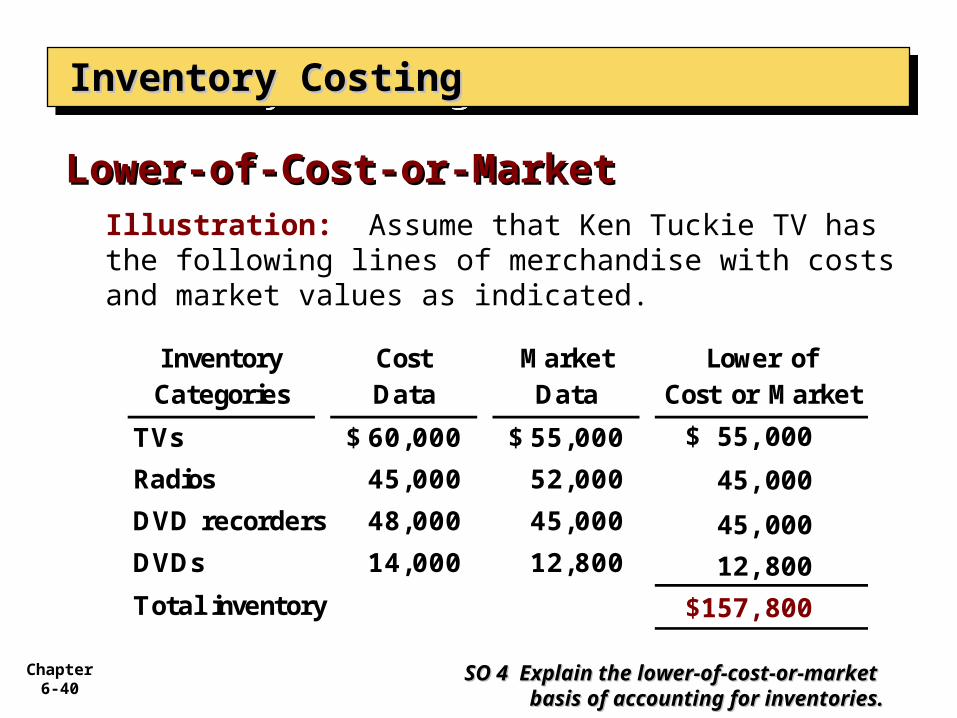
Illustration: Assume that Ken Tuckie TV has the following lines of merchandise with costs and market values as indicated.
Inventory Cost Market Lower ofCategories Data Data Cost or Market
TVs 60,000$ 55,000$
Radios 45,000 52,000
DVD recorders 48,000 45,000
DVDs 14,000 12,800
Total inventory
$ 55,000
45,000
45,000
12,800
$157,800
Chapter 6-41
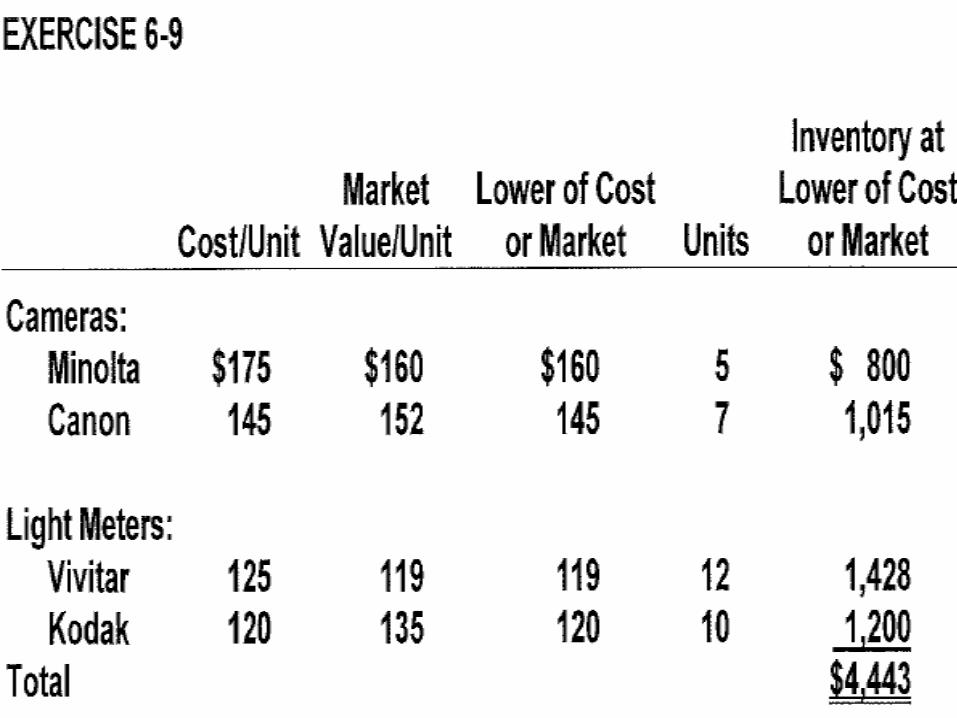
Ex 6-9 on page 309Ex 6-9 on page 309
Chapter 6-42
Chapter 6-43
Analysis of InventoryAnalysis of InventoryAnalysis of InventoryAnalysis of Inventory
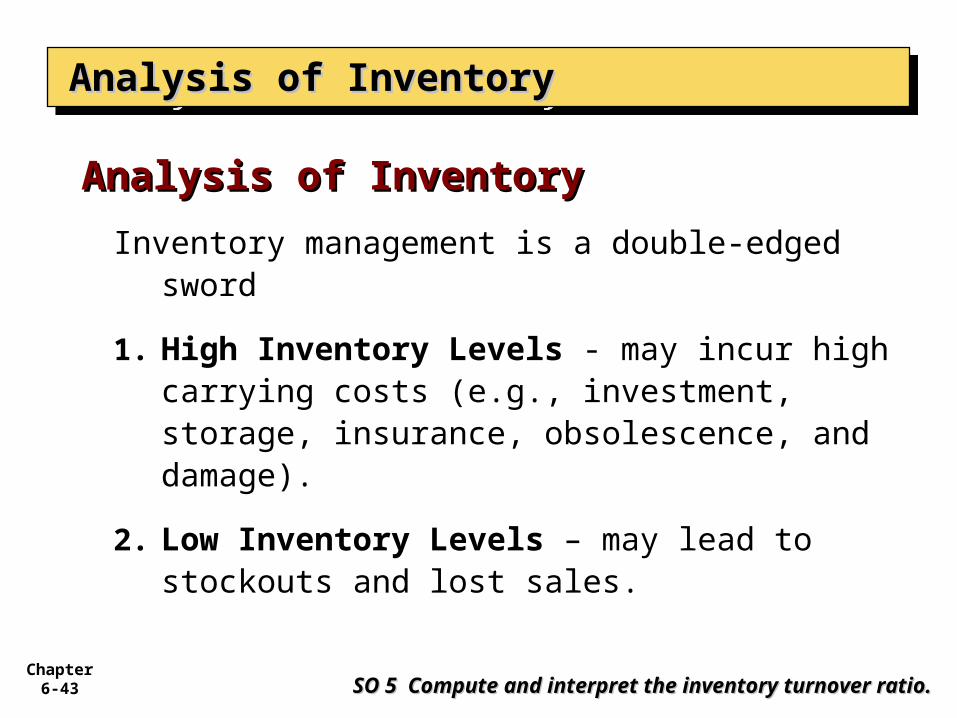
Inventory management is a double-edged sword
1. High Inventory Levels - may incur high carrying costs (e.g., investment, storage, insurance, obsolescence, and damage).
2. Low Inventory Levels – may lead to stockouts and lost sales.
Analysis of InventoryAnalysis of Inventory
SO 5 Compute and interpret the inventory turnover ratio.SO 5 Compute and interpret the inventory turnover ratio.
Chapter 6-44
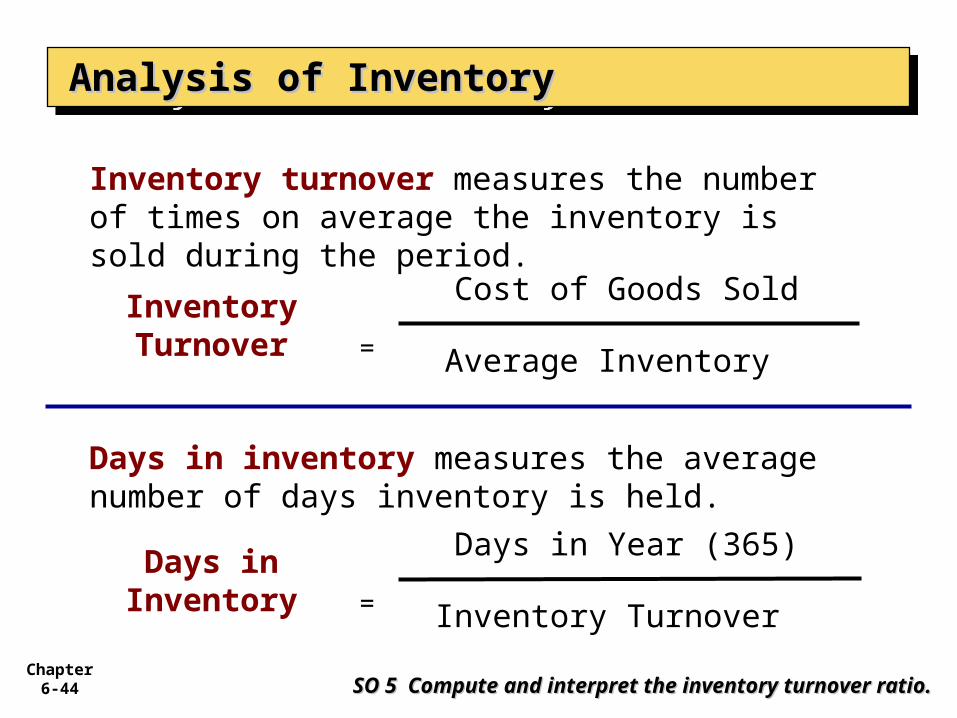
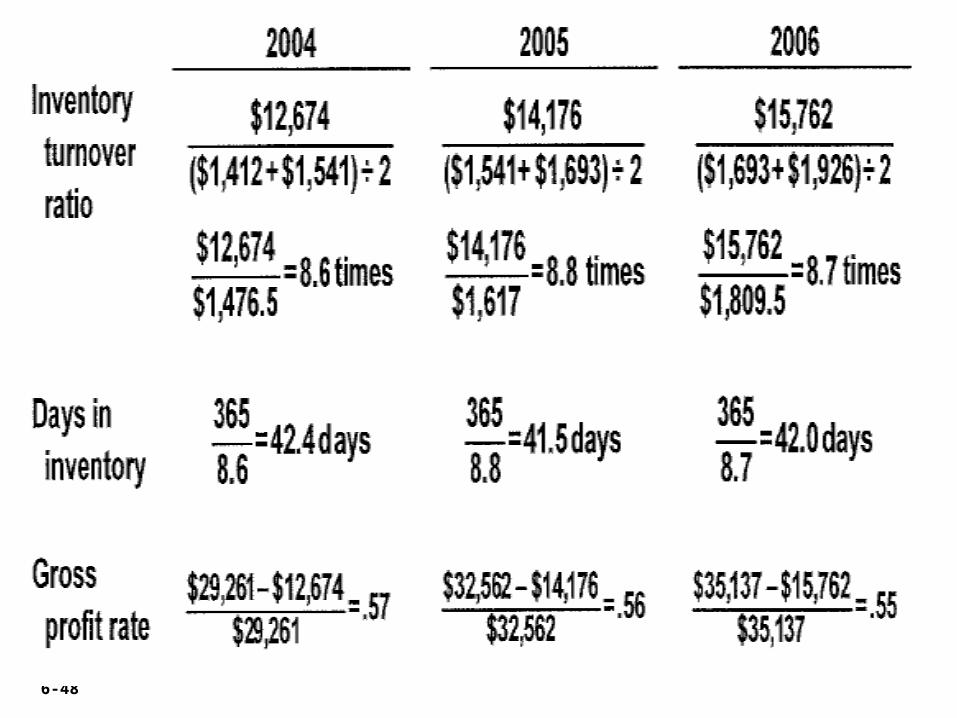
Inventory turnover measures the number of times on average the inventory is sold during the period.
Cost of Goods Sold
Average Inventory
Inventory Turnover
=
Days in inventory measures the average number of days inventory is held.
Days in Year (365)
Inventory Turnover
Days in Inventory
=
SO 5 Compute and interpret the inventory turnover ratio.SO 5 Compute and interpret the inventory turnover ratio.
Analysis of InventoryAnalysis of InventoryAnalysis of InventoryAnalysis of Inventory

Chapter 6-45
Illustration: The following data are available for Wal-Mart.
$264,152
(33,685 + 31,910) / 2
Inventory Turnover
2007
=
SO 5 Compute and interpret the inventory turnover ratio.SO 5 Compute and interpret the inventory turnover ratio.
Analysis of InventoryAnalysis of InventoryAnalysis of InventoryAnalysis of Inventory
=
8.1 times
365 Days
8.1
Days in inventory
2007
=
=45.1 Days
Chapter 6-46
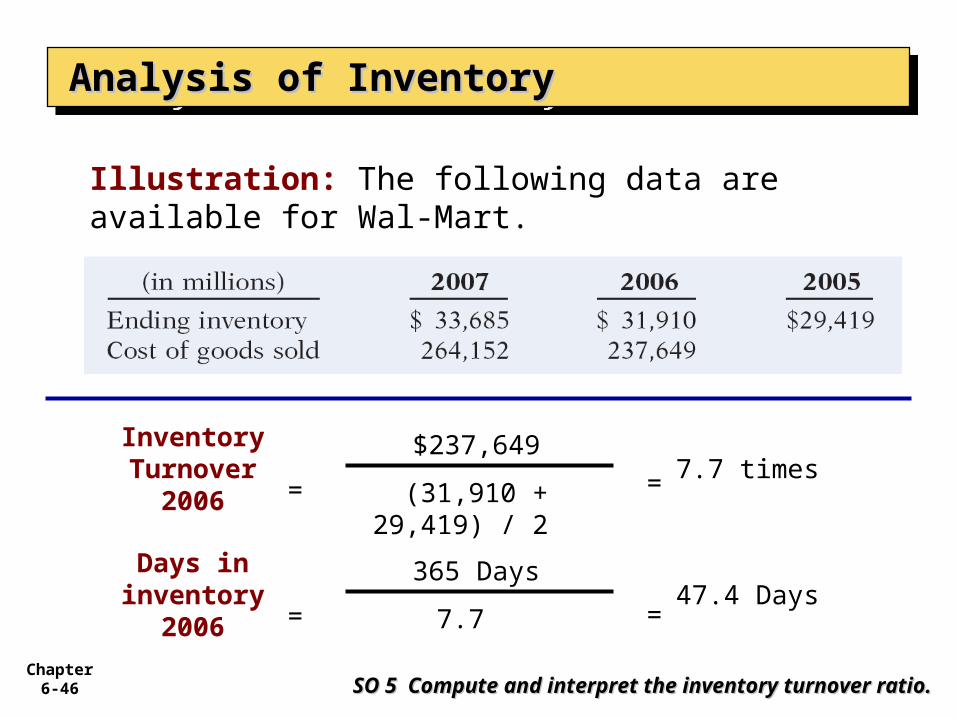
Illustration: The following data are available for Wal-Mart.
$237,649
(31,910 + 29,419) / 2
Inventory Turnover
2006
=
SO 5 Compute and interpret the inventory turnover ratio.SO 5 Compute and interpret the inventory turnover ratio.
Analysis of InventoryAnalysis of InventoryAnalysis of InventoryAnalysis of Inventory
= 7.7 times
365 Days
7.7
Days in inventory
2006
=
=47.4 Days
Chapter 6-47
Ex 6-10 on page 309Ex 6-10 on page 309
Chapter 6-48
Chapter 6-49
Analysis of InventoryAnalysis of InventoryAnalysis of InventoryAnalysis of Inventory
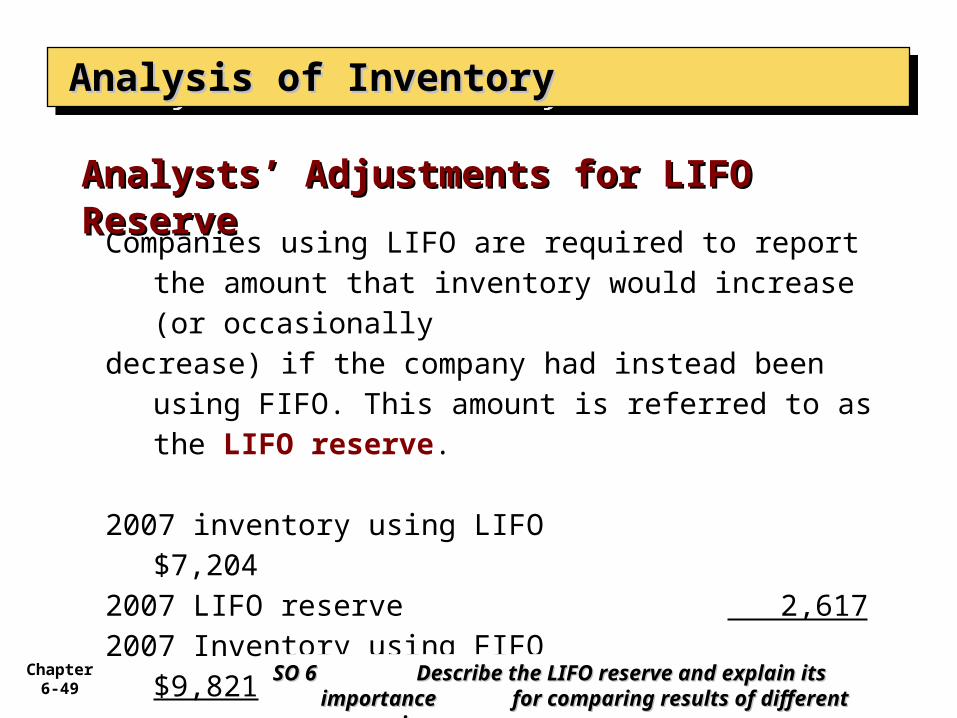
Companies using LIFO are required to report the amount that inventory would increase (or occasionally
decrease) if the company had instead been using FIFO. This amount is referred to as the LIFO reserve.
2007 inventory using LIFO $7,2042007 LIFO reserve 2,6172007 Inventory using FIFO $9,821
Analysts’ Adjustments for LIFO Analysts’ Adjustments for LIFO ReserveReserve
SO 6 SO 6 Describe the LIFO reserve and explain its Describe the LIFO reserve and explain its importance importance for comparing results of different for comparing results of different companies.companies.
Chapter 6-50
Analysis of InventoryAnalysis of InventoryAnalysis of InventoryAnalysis of Inventory
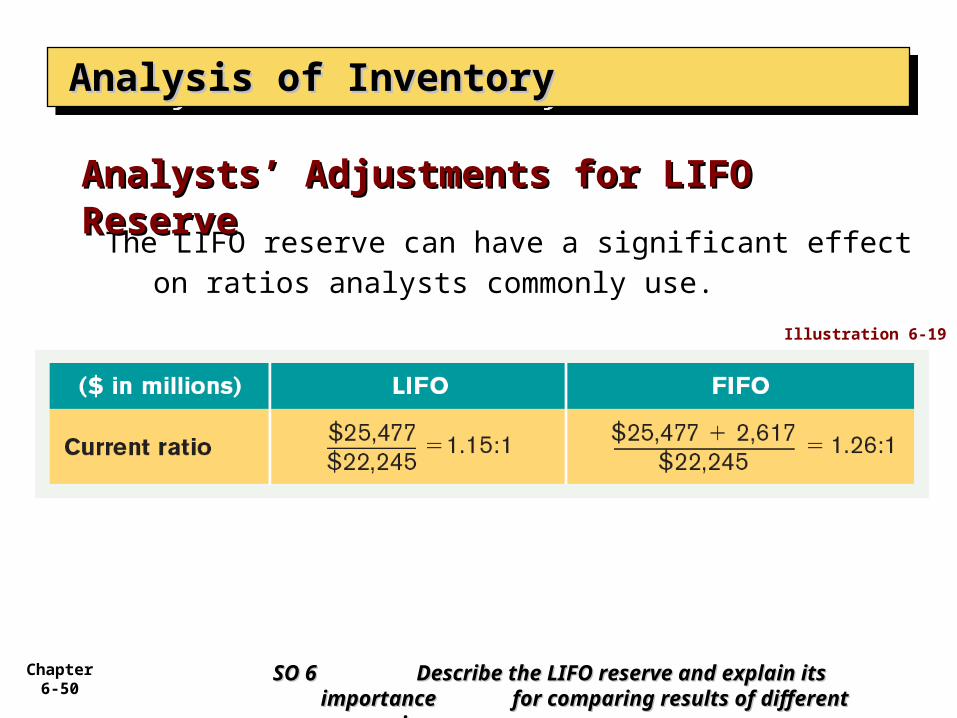
The LIFO reserve can have a significant effect on ratios analysts commonly use.
Analysts’ Adjustments for LIFO Analysts’ Adjustments for LIFO ReserveReserve
SO 6 SO 6 Describe the LIFO reserve and explain its Describe the LIFO reserve and explain its importance importance for comparing results of different for comparing results of different companies.companies.
Illustration 6-19
Chapter 6-51
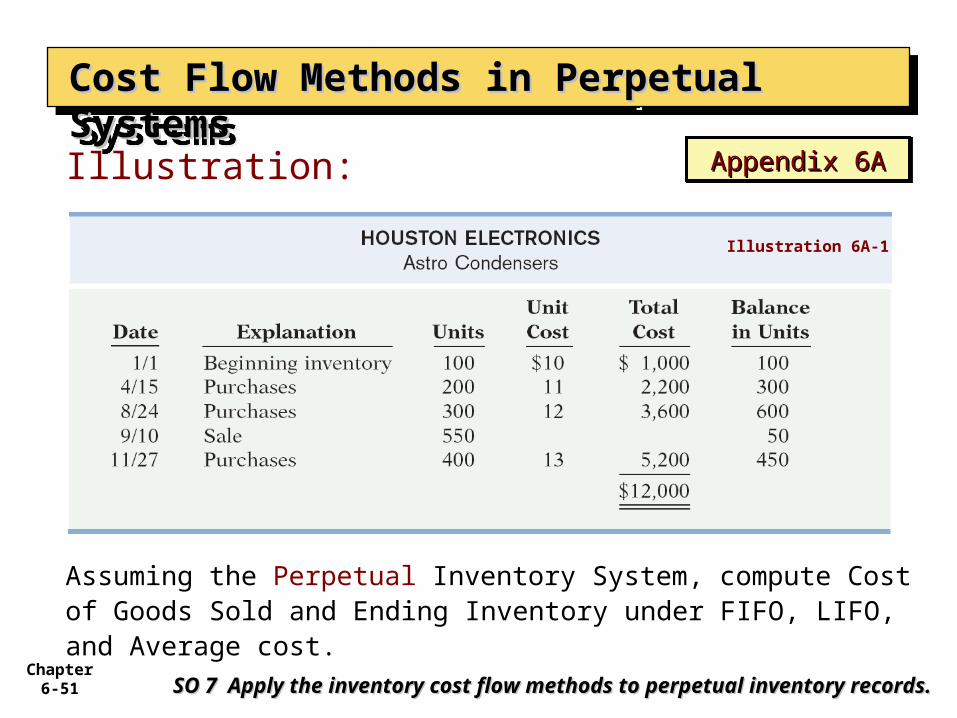
Illustration:
Cost Flow Methods in Perpetual SystemsCost Flow Methods in Perpetual SystemsCost Flow Methods in Perpetual SystemsCost Flow Methods in Perpetual Systems
SO 7 Apply the inventory cost flow methods to perpetual inventory SO 7 Apply the inventory cost flow methods to perpetual inventory records.records.
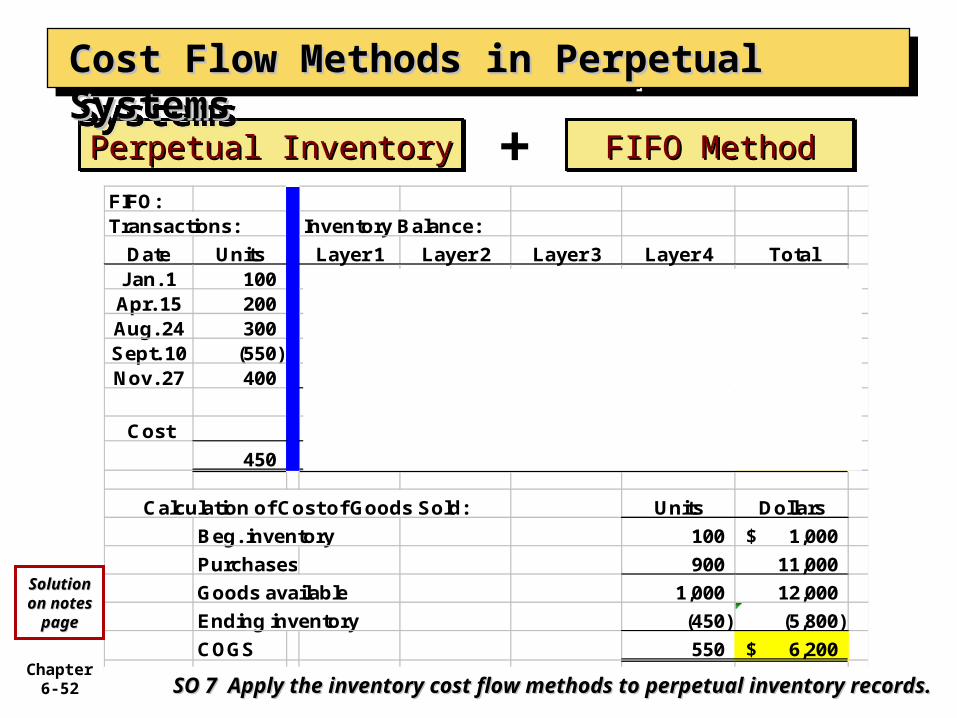
Assuming the Perpetual Inventory System, compute Cost of Goods Sold and Ending Inventory under FIFO, LIFO, and Average cost.
Appendix 6AAppendix 6AAppendix 6AAppendix 6A
Illustration 6A-1
Chapter 6-52
FIFO:Transactions: Inventory Balance:
Date Units Layer 1 Layer 2 Layer 3 Layer 4 TotalJan. 1 100 100 Apr. 15 200 200 Aug. 24 300 300 Sept. 10 (550) (100) (200) (250) Nov. 27 400 400
- - 50 400 450 Cost 10$ 11$ 12$ 13$
450 -$ -$ 600$ 5,200$ 5,800$
Calculation of Cost of Goods Sold: Units Dollars
Beg. inventory 100 1,000$
Purchases 900 11,000
Goods available 1,000 12,000
Ending inventory (450) (5,800)
COGS 550 6,200$
Perpetual InventoryPerpetual InventoryPerpetual InventoryPerpetual Inventory FIFO MethodFIFO MethodFIFO MethodFIFO Method+
Cost Flow Methods in Perpetual SystemsCost Flow Methods in Perpetual SystemsCost Flow Methods in Perpetual SystemsCost Flow Methods in Perpetual Systems
SO 7 Apply the inventory cost flow methods to perpetual inventory SO 7 Apply the inventory cost flow methods to perpetual inventory records.records.
SolutioSolution on n on
notes notes pagepage
Chapter 6-53
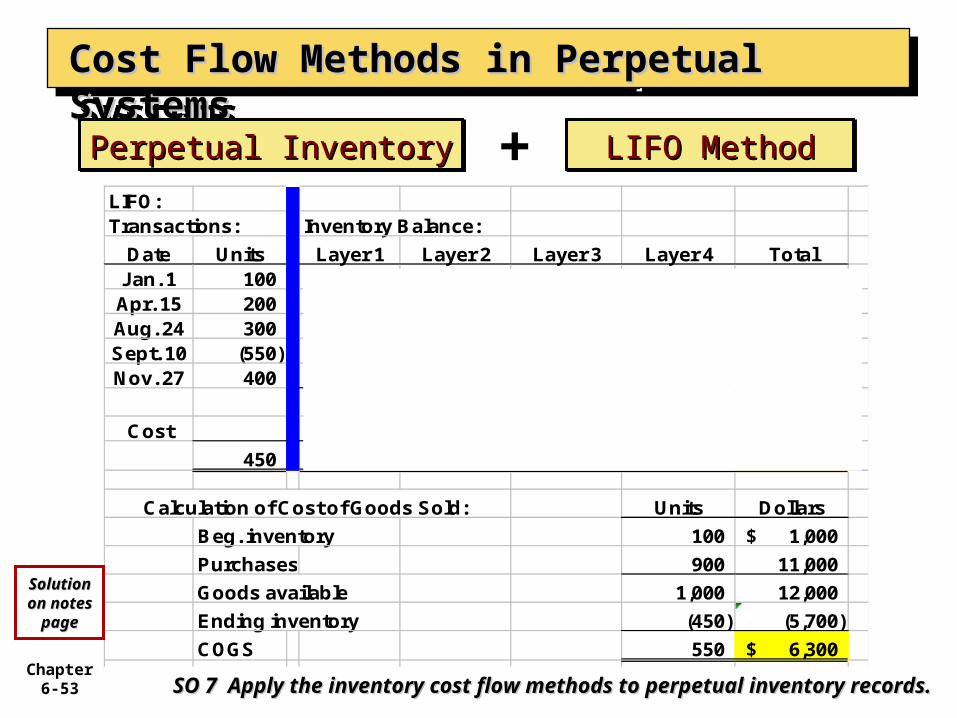
LIFO:Transactions: Inventory Balance:
Date Units Layer 1 Layer 2 Layer 3 Layer 4 TotalJan. 1 100 100 Apr. 15 200 200 Aug. 24 300 300 Sept. 10 (550) (50) (200) (300) Nov. 27 400 400
50 - - 400 450 Cost 10$ 11$ 12$ 13$
450 500$ -$ -$ 5,200$ 5,700$
Calculation of Cost of Goods Sold: Units Dollars
Beg. inventory 100 1,000$
Purchases 900 11,000
Goods available 1,000 12,000
Ending inventory (450) (5,700)
COGS 550 6,300$
LIFO MethodLIFO MethodLIFO MethodLIFO Method
Cost Flow Methods in Perpetual SystemsCost Flow Methods in Perpetual SystemsCost Flow Methods in Perpetual SystemsCost Flow Methods in Perpetual Systems
SO 7 Apply the inventory cost flow methods to perpetual inventory SO 7 Apply the inventory cost flow methods to perpetual inventory records.records.
Perpetual InventoryPerpetual InventoryPerpetual InventoryPerpetual Inventory +
SolutioSolution on n on
notes notes pagepage
Chapter 6-54
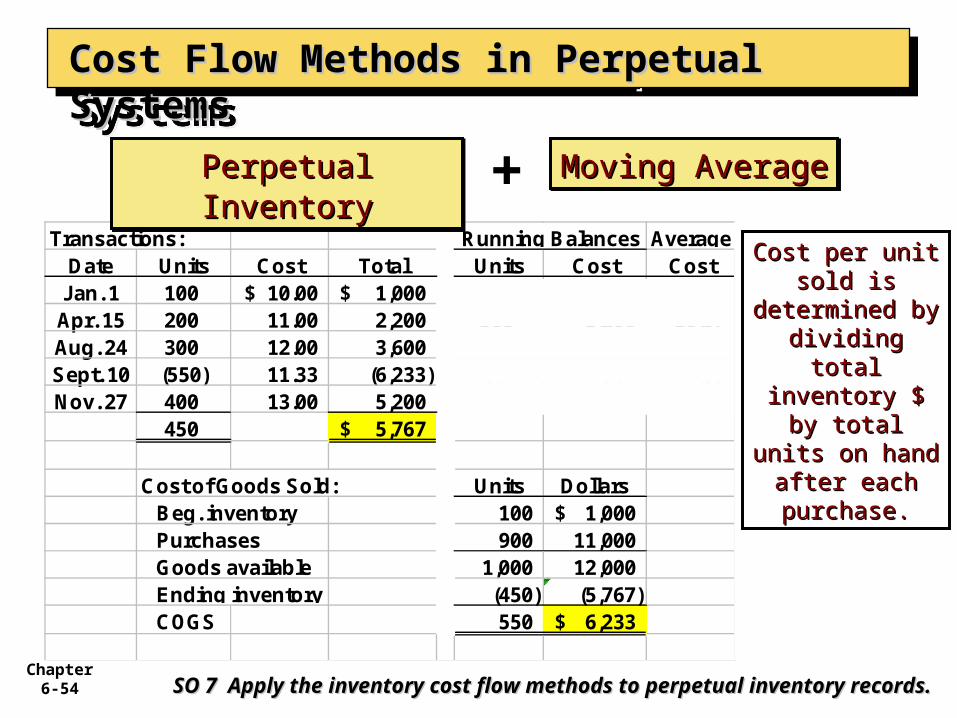
Transactions: AverageDate Units Cost Total Units Cost Cost
Jan. 1 100 10.00$ 1,000$ 100 1,000$ 10.00$ Apr. 15 200 11.00 2,200 300 3,200 10.67 Aug. 24 300 12.00 3,600 600 6,800 11.33 Sept. 10 (550) 11.33 (6,233) 50 567 11.33 Nov. 27 400 13.00 5,200 450 5,767 12.46
450 5,767$
Cost of Goods Sold: Units DollarsBeg. inventory 100 1,000$ Purchases 900 11,000 Goods available 1,000 12,000 Ending inventory (450) (5,767) COGS 550 6,233$
Running Balances
Perpetual InventoryPerpetual InventoryPerpetual InventoryPerpetual Inventory Moving AverageMoving AverageMoving AverageMoving Average
Cost per unit Cost per unit sold is sold is
determined by determined by dividing total dividing total
inventory $ by inventory $ by total units on total units on
hand after hand after each purchase.each purchase.
+
Cost Flow Methods in Perpetual SystemsCost Flow Methods in Perpetual SystemsCost Flow Methods in Perpetual SystemsCost Flow Methods in Perpetual Systems
SO 7 Apply the inventory cost flow methods to perpetual inventory SO 7 Apply the inventory cost flow methods to perpetual inventory records.records.
Chapter 6-55
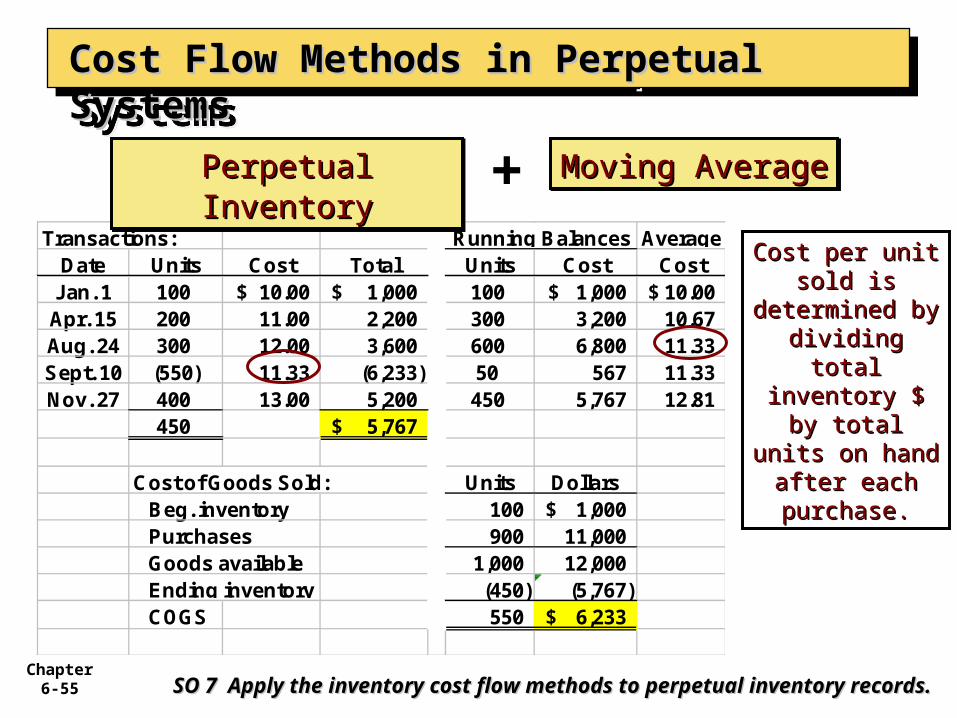
Transactions: AverageDate Units Cost Total Units Cost Cost
Jan. 1 100 10.00$ 1,000$ 100 1,000$ 10.00$ Apr. 15 200 11.00 2,200 300 3,200 10.67 Aug. 24 300 12.00 3,600 600 6,800 11.33 Sept. 10 (550) 11.33 (6,233) 50 567 11.33 Nov. 27 400 13.00 5,200 450 5,767 12.81
450 5,767$
Cost of Goods Sold: Units DollarsBeg. inventory 100 1,000$ Purchases 900 11,000 Goods available 1,000 12,000 Ending inventory (450) (5,767) COGS 550 6,233$
Running Balances
Perpetual InventoryPerpetual InventoryPerpetual InventoryPerpetual Inventory Moving AverageMoving AverageMoving AverageMoving Average
Cost per unit Cost per unit sold is sold is
determined by determined by dividing total dividing total
inventory $ by inventory $ by total units on total units on
hand after hand after each purchase.each purchase.
+
Cost Flow Methods in Perpetual SystemsCost Flow Methods in Perpetual SystemsCost Flow Methods in Perpetual SystemsCost Flow Methods in Perpetual Systems
SO 7 Apply the inventory cost flow methods to perpetual inventory SO 7 Apply the inventory cost flow methods to perpetual inventory records.records.
Chapter 6-56
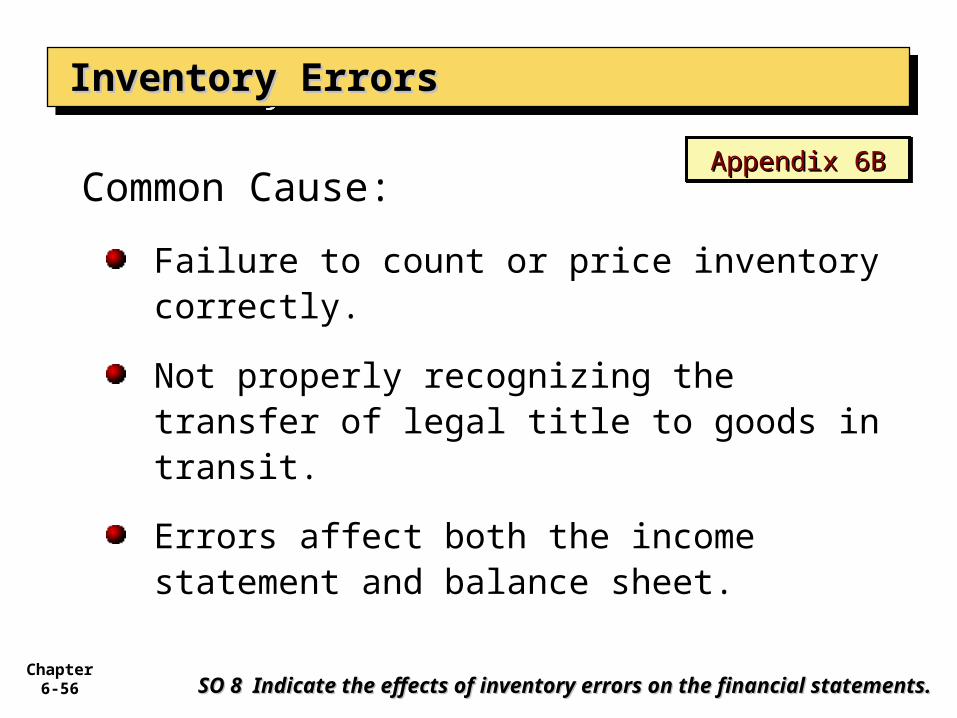
Inventory ErrorsInventory ErrorsInventory ErrorsInventory Errors
SO 8 Indicate the effects of inventory errors on the financial SO 8 Indicate the effects of inventory errors on the financial statements.statements.
Common Cause:
Failure to count or price inventory correctly.
Not properly recognizing the transfer of legal title to goods in transit.
Errors affect both the income statement and balance sheet.
Appendix 6BAppendix 6BAppendix 6BAppendix 6B
Chapter 6-57
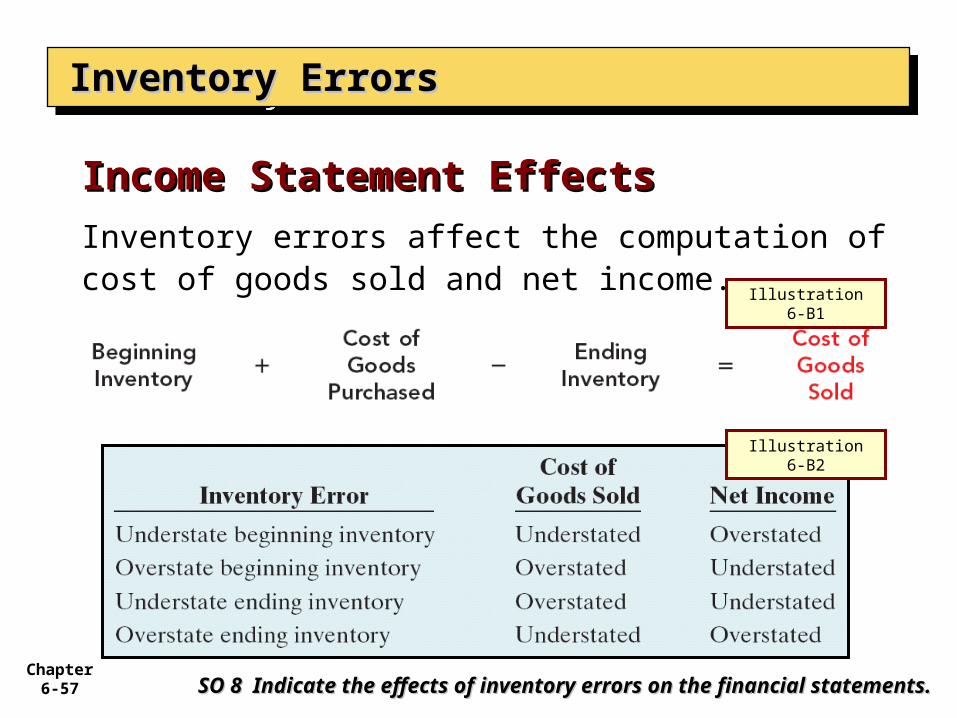
Inventory ErrorsInventory ErrorsInventory ErrorsInventory Errors
SO 8 Indicate the effects of inventory errors on the financial SO 8 Indicate the effects of inventory errors on the financial statements.statements.
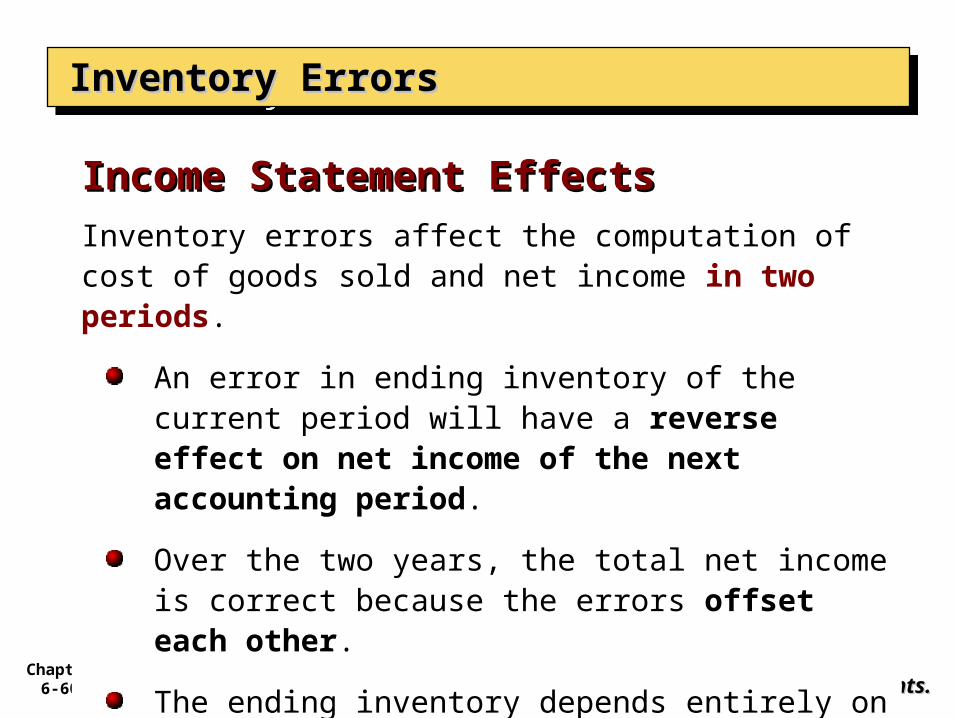
Inventory errors affect the computation of cost of goods sold and net income.
Income Statement EffectsIncome Statement Effects
Illustration 6-B2
Illustration 6-B1
Chapter 6-58
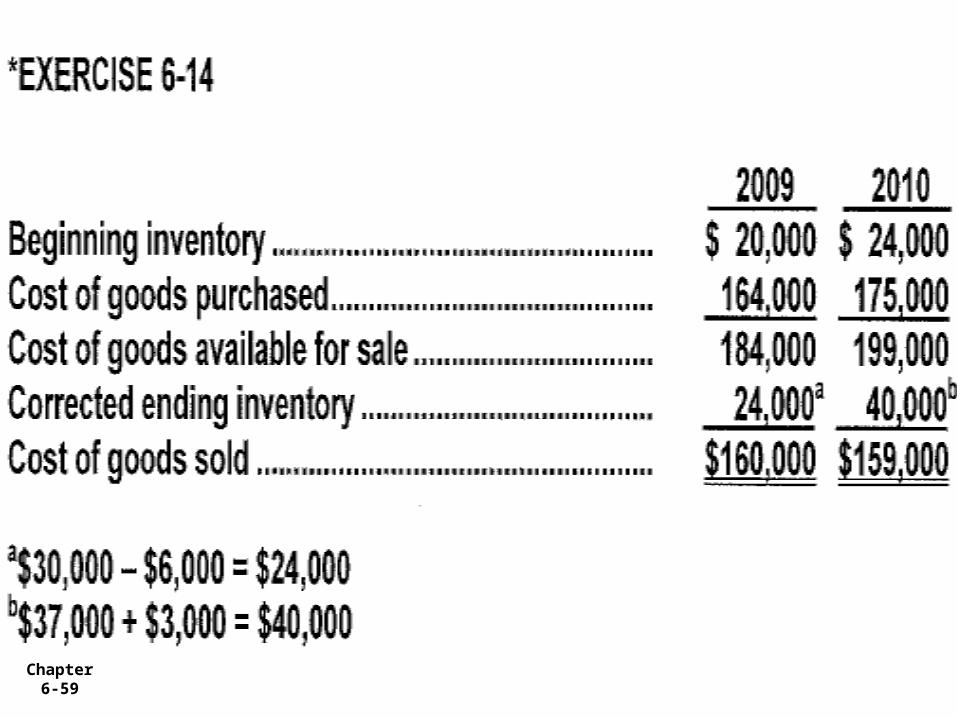
Ex 6-14 on page 310
Chapter 6-59
Chapter 6-60
Inventory ErrorsInventory ErrorsInventory ErrorsInventory Errors
SO 8 Indicate the effects of inventory errors on the financial SO 8 Indicate the effects of inventory errors on the financial statements.statements.
Inventory errors affect the computation of cost of goods sold and net income in two periods.
An error in ending inventory of the current period will have a reverse effect on net income of the next accounting period.
Over the two years, the total net income is correct because the errors offset each other.
The ending inventory depends entirely on the accuracy of taking and costing the inventory.
Income Statement EffectsIncome Statement Effects
Chapter 6-61
Inventory ErrorsInventory ErrorsInventory ErrorsInventory Errors
SO 8 Indicate the effects of inventory errors on the financial SO 8 Indicate the effects of inventory errors on the financial statements.statements.
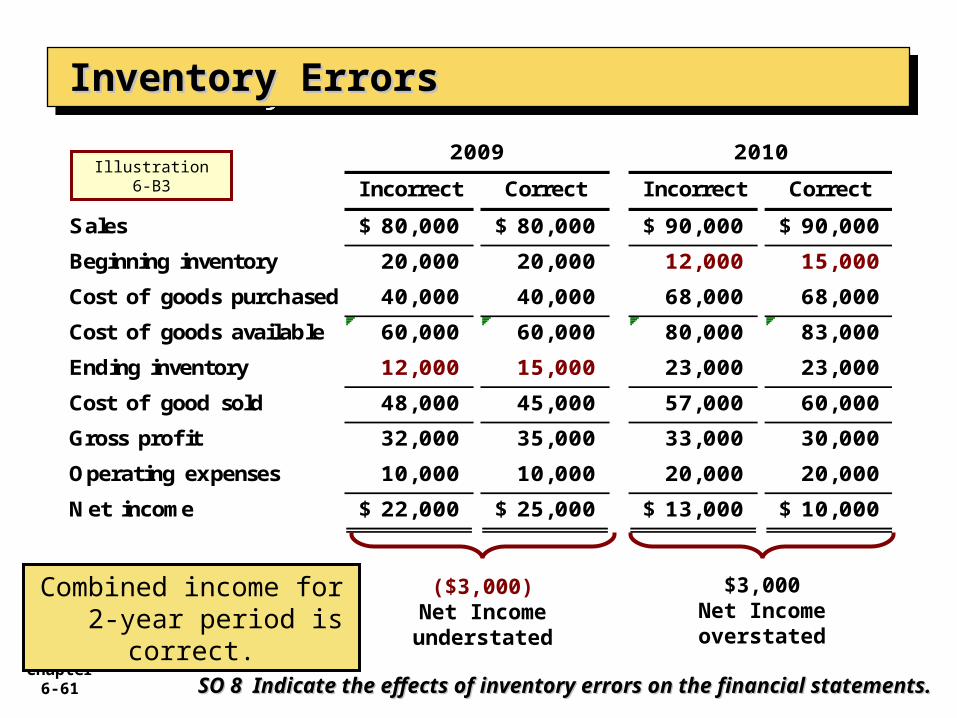
I ncorrect Correct Incorrect Correct
Sales 80,000$ 80,000$ 90,000$ 90,000$
Beginning inventory 20,000 20,000 12,000 15,000
Cost of goods purchased 40,000 40,000 68,000 68,000
Cost of goods available 60,000 60,000 80,000 83,000
Ending inventory 12,000 15,000 23,000 23,000
Cost of good sold 48,000 45,000 57,000 60,000
Gross profit 32,000 35,000 33,000 30,000
Operating expenses 10,000 10,000 20,000 20,000
Net income 22,000$ 25,000$ 13,000$ 10,000$
2009 2010
($3,000)Net Income understated
$3,000Net Income overstated
Combined income for 2-year period is
correct.
Illustration 6-B3
Chapter 6-62
Understating ending inventory will overstate:
a. assets.
b. cost of goods sold.
c. net income.
d. owner's equity.
Review QuestionReview Question
Inventory ErrorsInventory ErrorsInventory ErrorsInventory Errors
SO 8 Indicate the effects of inventory errors on the financial SO 8 Indicate the effects of inventory errors on the financial statements.statements.
Chapter 6-63
Inventory ErrorsInventory ErrorsInventory ErrorsInventory Errors
SO 8 Indicate the effects of inventory errors on the financial SO 8 Indicate the effects of inventory errors on the financial statements.statements.
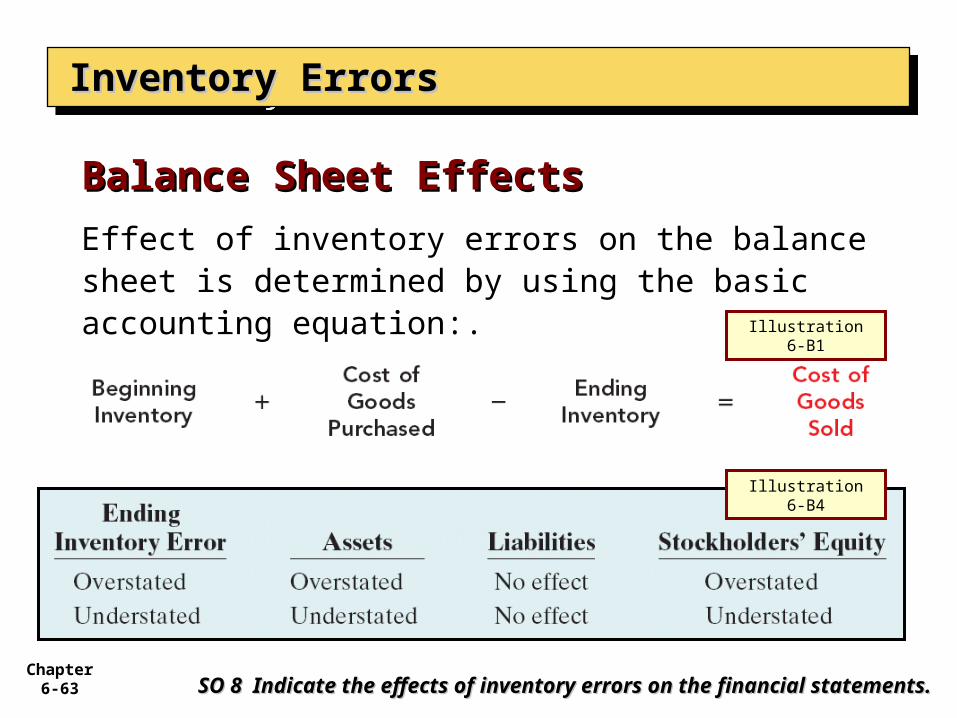
Effect of inventory errors on the balance sheet is determined by using the basic accounting equation:.
Balance Sheet EffectsBalance Sheet Effects
Illustration 6-B1
Illustration 6-B4