chapter 6 software engineers’ perspective towards km...
TRANSCRIPT

Chapter 6
Software Engineers’ Perspective towards KM
Practices in Indian Software Engineering
Organisations
“Good judgment comes from experience, and experience often comes from bad judgment” — Rita Mae Brown

Design of Experience Base Model for Software Process Improvement
198
6.1 Introduction
An employee is one of the valuable assets of the organisation and perhaps the most important
of all that contributes maximum in the efficiency and productivity of that organisation. In
fact, satisfied employees make for satisfied customers. Unmistakably, employee satisfaction
is utmost important and demands greater attention if client satisfaction is to be yielded and
reinforced. This means that significant efforts must be devoted to hire the right type of
personnel, nurturing and developing them, providing them with needed support,
compensating them adequately and inventing ways of retaining the best among them for as
long as possible.
Most businesses rely on the fact that their employees possess relevant knowledge and that
they can apply it to the task at hand. But a serious problem exists; this knowledge is not
owned by the organisation as such. Rather the knowledge is owned and controlled by its
employees. The following statements illustrate this situation:
“Our knowledge has legs - it walks home everyday”1
“Not only do you have experience walking out the door, you have inexperience walking in
the door”2
“An organisation’s knowledge walks out of the door every night and it might never come
back”3
The success or failure of the KM systems and the various KM practices claimed to be
adopted by software engineering organisations can be best judged from software engineers’
point of view as they are the ones who are the first-hand users of the KM systems and
technologies. The software engineers are the face of the SE organisations and can reflect the
true picture of the state of affairs in the area of KM in software industry. These are the people
who are actually engaged in the sharing and managing of their knowledge through KM
1 Leif Edvinsson, Brain of the year ‘98, Director of Intellectual Capital, Skandia Insurance Co. 2 Scott Eliot, Director Knowledge Management Product Groups, Lotus (KMWorld 2001) 3 Kevin Abley (Capgemini) in OR Society Conference on Knowledge Management, London, 1998

Design of Experience Base Model for Software Process Improvement
199
systems on a day to day basis. Therefore, their perspective is very important for
understanding the actual extent of KM in Indian software industry.
The perceptual world of a software manager is different from the perceptual world of
software engineers. Therefore, it is equally important to know about the software engineers’
perception for the development of an organisation. This chapter justifies the need of the
research and analyses the software engineers’ perception regarding KM system whether they
have adapted happily or is there any problem to be solved for further improvement. The study
also tests the hypothesis that whether SE organisations groups, work experience, age and
educational qualifications have significant influence on software engineers’ perceptions or
not.
At the outset, it is important to mention here that the contents of this chapter additionally
enrich the present study. The study of software engineers’ perspective towards KM is not an
explicit objective of the present research work. However, to have a holistic view, an attempt
was made to judge the software engineers’ perspective towards KM induction in Indian
software engineering environment. For this purpose, a questionnaire was prepared and
administered to the software engineers to get their views on various dimensions of KM
practices used in the industry (cf. Questionnaire set II in Appendix B). A sample of 302
software engineers was taken, drawing 100 each from three types of software companies.
6.2 Demographic Profile of the Respondents
Table 6.1 highlights the socio-economic background of the software engineers, interviewed
with the help of a questionnaire.
Table 6.1 reveals that out of 302 Software engineers, 40% belongs to age group of 25-35 and
36% are of 36-45 years of age and the remaining are either less than 25 years or above 46
years. The table reveals that maximum software engineers are above 5 years of domain
experience. Education-wise 144 software engineers (48%) have some professional
qualification, 70 (23%) software engineers are graduates and 79 (26%) software engineers are
post-graduates.

Design of Experience Base Model for Software Process Improvement
200
Table 6.1
Demographic Profile of the Respondents
Group /Sub Group Number %age
Type of SE Company
Type I
Type II
Type III
100
100
102
33.11
33.11
33.77
Age Group
Below 25
25-35
36-45
46-55
Above 55
34
121
109
29
9
11.26
40.07
36.09
09.60
2.98
Work Experience
Below 1 yr
1-3 yrs
3- 5 yrs
Above 5 yrs
74
50
28
150
24.50
16.56
9.28
49.67
Qualification
Graduate
Post Graduate
Professional
Ph.D.
70
79
144
09
23.18
26.16
47.68
2.98
Total 302 100.00
For the purpose of analysing the perception of software engineers about knowledge
management in SE environment, this research divided the questionnaire into 5 sections. The
results of the analysis are also presented in the same scheme.
1. Awareness and understanding of KM
2. Knowledge sharing attitudes of the respondents
3. Respondents’ perception on KM and organisational issues
4. Perception on various organisational attributes related to KM
5. Perception about organisational IT Infrastructure

Design of Experience Base Model for Software Process Improvement
201
6.3 KM Awareness and Understanding
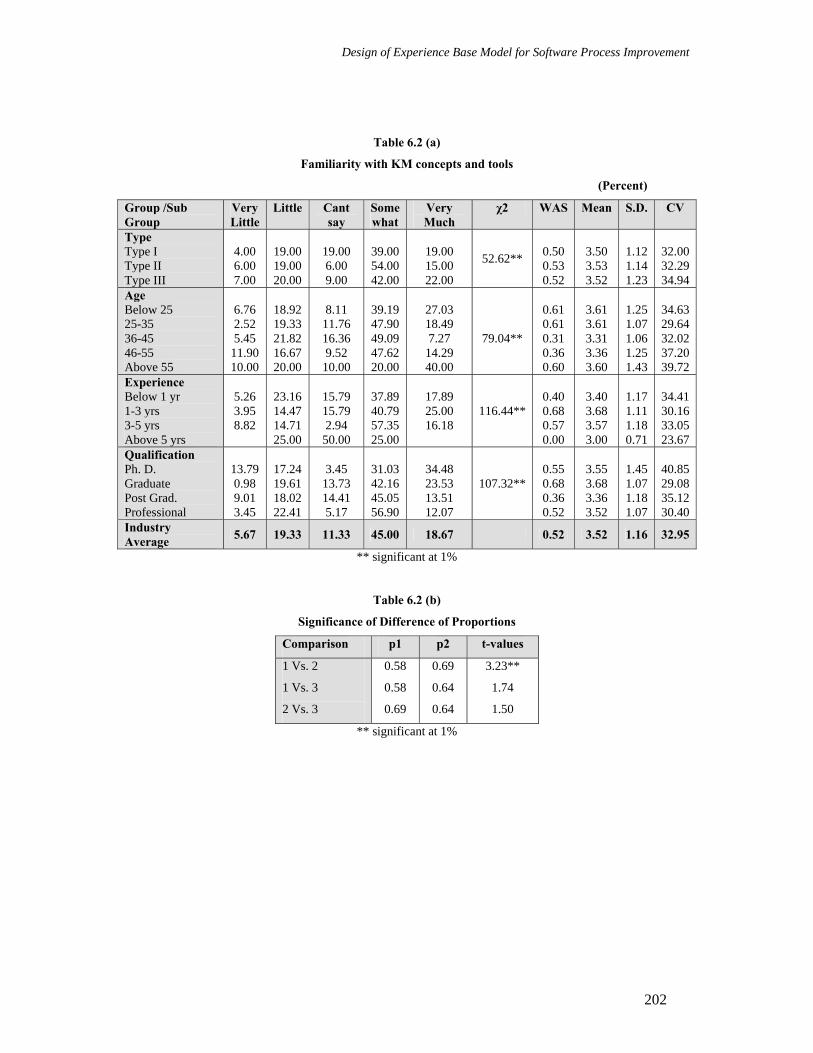
6.3.1 Familiarity with KM concepts and tools
In Type I organisations, 39% respondents know to some extent about KM concepts (cf. table
6.2 (a)). Similarly, in Type II and Type III, 54% and 42% respectively know somewhat about
knowledge management. On the basis of age profile of the respondents, less than 50%
respondents are somewhat familiar with the concepts and tools for managing knowledge. On
the other hand, less than 60% respondents know KM to some extent on the basis of their
work experience. Qualification wise, below 35% respondents are familiar to a large extent
about KM. Overall, 63.67% respondents have know-how about KM concepts and tools and
techniques for managing knowledge.
Statistically, co-efficient of variation reveals that there is more variability in the opinion of
Type III respondents and more consistency in Type I and Type II organisation respondents.
Overall, WAS of three organisation groups is insignificant because it is less than 1. The chi-
square test shows that the differences in the opinions of organisation group respondents is
significant at 1% LOS, thus leading to the rejection of null hypothesis (H01: The software
engineers are not acquainted with the concepts and tools of knowledge management) and
hence the result that the Software engineers are familiar with KM concepts and tools. The t-
test expresses the significant difference in organisation Type I and II at 1% LOS.
Design of Experience Base Model for Software Process Improvement
202
Table 6.2 (a)
Familiarity with KM concepts and tools
(Percent)
Group /Sub Group
Very Little
Little Cant say
Somewhat
Very Much
χ2 WAS Mean S.D. CV
Type Type I Type II Type III
4.00 6.00 7.00
19.00 19.00 20.00
19.00 6.00 9.00
39.00 54.00 42.00
19.00 15.00 22.00
52.62**
0.50 0.53 0.52
3.50 3.53 3.52
1.12 1.14 1.23
32.00 32.29 34.94
Age Below 25 25-35 36-45 46-55 Above 55
6.76 2.52 5.45
11.90 10.00
18.92 19.33 21.82 16.67 20.00
8.11
11.76 16.36 9.52
10.00
39.19 47.90 49.09 47.62 20.00
27.03 18.49 7.27
14.29 40.00
79.04**
0.61 0.61 0.31 0.36 0.60
3.61 3.61 3.31 3.36 3.60
1.25 1.07 1.06 1.25 1.43
34.63 29.64 32.02 37.20 39.72
Experience Below 1 yr 1-3 yrs 3-5 yrs Above 5 yrs
5.26 3.95 8.82
23.16 14.47 14.71 25.00
15.79 15.79 2.94
50.00
37.89 40.79 57.35 25.00
17.89 25.00 16.18
116.44**
0.40 0.68 0.57 0.00
3.40 3.68 3.57 3.00
1.17 1.11 1.18 0.71
34.41 30.16 33.05 23.67
Qualification Ph. D. Graduate Post Grad. Professional
13.79 0.98 9.01 3.45
17.24 19.61 18.02 22.41
3.45
13.73 14.41 5.17
31.03 42.16 45.05 56.90
34.48 23.53 13.51 12.07
107.32**
0.55 0.68 0.36 0.52
3.55 3.68 3.36 3.52
1.45 1.07 1.18 1.07
40.85 29.08 35.12 30.40
Industry Average 5.67 19.33 11.33 45.00 18.67 0.52 3.52 1.16 32.95
** significant at 1%
Table 6.2 (b)
Significance of Difference of Proportions
Comparison p1 p2 t-values
1 Vs. 2
1 Vs. 3
2 Vs. 3
0.58
0.58
0.69
0.69
0.64
0.64
3.23**
1.74
1.50
** significant at 1%

Design of Experience Base Model for Software Process Improvement
203
6.3.2 Knowledge Repository/ KM Software System in Organisations
It was attempted to judge how far the SE organisations which have invested hugely in
technology provide platforms for acquisition and sharing of knowledge through KM software
systems or do SE companies have knowledge repositories of some sort where accumulated
organisational knowledge is stored for future reuse. Organisation group-wise, in Type I, 92%
of the respondents say their organisations do not provide any formal knowledge repository
and KM software systems. Of Type II and III, 93% and 90% of the respondents respectively
state that SE companies do not have any repository for storing knowledge. Age group-wise,
majority of the respondents say that companies do not have any knowledge repository or KM
software system in place. 86.49% respondents of below 25 years and 90% respondents of
more than 55 years of age also gave the same answer.
Work experience wise also, majority of the respondents state that their organisations do not
have any formal knowledge repository or KM software systems. The same is the view given
by the majority of the respondents on the basis of qualification. Overall, almost 92%
respondents confirm the absence of any organisational knowledge repository system and any
KM software in the SE environment. The chi-square test reveals that the results are
statistically insignificant both at 1% and 5% LOS. Thus, the null hypothesis (H02: SE
organisations do not have any knowledge repository or a KM software system) is accepted.

Design of Experience Base Model for Software Process Improvement
204
Table 6.3
Availability of Knowledge Repository/ KM Software System in Organisations
(Percent)
Group /Sub Group Yes No χ2
Organisation Group
Type I
Type II
Type III
8.00
7.00
10.00
92.00
93.00
90.00
2.44
Age Group
Below 25
25-35
36-45
46-55
Above 55
13.51
5.88
7.27
7.14
10.00
86.49
94.12
92.73
92.86
90.00
12..82
Work Experience
Below 1 yr
1-3 yrs
3-5 yrs
Above 5 yrs
8.42
13.16
7.35
3.77
91.58
86.84
92.65
96.23
14.27
Qualification
Ph. D.
Graduate
Post Grad.
Professional
6.90
12.75
6.31
5.17
93.10
87.25
93.69
94.83
10.32
Industry Average 88..3333 9911..6677
6.3.3 Preference for Source of Information
Table 6.4 reflects the fact that majority respondents prefer the most the sources outside their
organisational knowledge sources like Internet to look for the problem-solving information.
Contacting a fellow worker or colleague is at the second rank followed by the corporate
knowledge repository. The main reason behind the least average score to the knowledge
repository could be the absence of any such source or the repository could be ill-managed or
not regularly updated.

Design of Experience Base Model for Software Process Improvement
205
Table 6.4
Preference for Source of Information
Source of information Average Rank Average Score Ranks
Corporate knowledge repository 2.17 44.19 3
Outside sources, e.g., Internet 1.88 54.04 1
Co-worker 1.95 51.77 2
6.3.4 Benefits of Documenting SE Knowledge
The software engineers were asked to rank the benefits they perceive the well documented SE
knowledge could provide to their projects. In response to this, the shorter activity time
appeared to be the most important benefit of documenting the SE project knowledge. This is
followed by the re-usability advantage at second rank though the average score is much poor
(65.69) than shorter activity time (83.55). But re-usability is the core motivation behind
knowledge management in software engineering. From the average score in Table 6.5, it is
evident that better product quality is another benefit of documenting the SE projects
knowledge, according to the Software engineers, though reduced budget and other product
cost factors do not get that much importance in Software engineers viewpoint.
Table 6.5
Benefits of well documented SE knowledge
Benefits of well documented SE knowledge Average Rank Average Score Ranks
Shorter activity time 1.65 83.55 1
Cheaper product 4.86 37.66 4
Better product quality 4.86 37.77 3
Reduced activity budget 4.94 36.58 5
Re-usability 2.90 65.69 2

Design of Experience Base Model for Software Process Improvement
206
6.3.5 Reasons behind not re-using experience
In order to know the reasons for the lack of knowledge re-use in software engineering
organisations, the respondents were asked to rank the importance they attach to the reasons
behind their not re-using experience in their working. Table 6.6 reflects that Software
engineers cite the lack of mutual trust among Software engineers as they rank the option
“others don’t share experience” as the first reason followed by the lack of documentation of
knowledge at the second rank. The next reason for not re-using experience with average score
of almost 50 is that project members do not discuss things in a well organised and formal
manner so that there is a proper flow of experience sharing among team members. Lack of
monetary compensation or other benefits and incentives for re-using experience has also been
cited as a reason behind not re-using experience.
Table 6.6
Reasons for not using Experience
Reasons for not using experience Average Rank Average Score Ranks
Lack of incentives/ compensation for reuse 3.60 48.36 4
I would rather be seen as an innovative software professional 4.10 40.03 6
Others don’t share experience 2.26 70.71 1
Nothing is documented well enough 3.27 53.79 2
Project teams don’t discuss things 3.53 49.49 3
Inadequate IT/ software support 3.65 47.47 5

Design of Experience Base Model for Software Process Improvement
207
6.4 Knowledge Sharing Attitude
6.4.1 Knowledge sharing is good
Table 6.7(a) indicates that organisation group-wise, in Type I organisations, 97% respondents
agreed that knowledge-sharing is good. Similarly, majority of respondents of Type II and III
organisations expressed that knowledge-sharing is good. Age-wise, majority of the
respondents of below 25 years of age and above 55 years strongly agree to the statement.
Work experience-wise, 98.53% Software engineers with 3-5 years experience and 96.05%
respondents with 1-3 years experience agree that sharing knowledge is good. Qualification-
wise, 63.73% graduate and 67.57% post-graduate respondents strongly agree that knowledge-
sharing is a positive activity while 93.10% PhD and 98.28% professional respondents were
also in the favour of knowledge sharing.
In nutshell, 98% respondents in all favour knowledge sharing activity in SE organisations.
This very clearly indicates that Software engineers are very positive towards sharing their
domain knowledge with their co-workers. Co-efficient of variation reveals that there is more
variability in the opinion of Type I organisations’ respondents and more consistency in Type
II and III organisations’ respondents. The Coefficient of variation is highest in case of Type I
companies (i.e. 12.04) which shows the highest intra-group difference of opinions among the
respondents as compared to those of Type II and III companies.
Overall, WAS of three organisation groups is greater than 1 which implies that majority of
the respondents do agree with the statement ‘Knowledge sharing is good’. Since the
calculated value (CV) of Chi-square is greater than the table value (TV) the results are
significant at 1% LOS and the null hypothesis (H03: Software engineers believe that
knowledge sharing is not good) is rejected. Thus, it can be inferred that the Software
engineers in all types of organisations feel that knowledge sharing is good. The t-test
indicates the significant difference in organisation Type I and II at 5% LOS.

Design of Experience Base Model for Software Process Improvement
208
Table 6.7 (a)
Knowledge sharing is good
(Percent)
Group /Sub Group SD D N A SA χ2 WAS Mean S.D. CV Type Type I Type II Type III
1.00
3.00
2.00
37.00 32.00 34.00
60.00 67.00 64.00
21.10**
1.57 1.65 1.62
4.57 4.65 4.62
0.55 0.54 0.52
12.04 11.61 11.26
Age Below 25 25-35 36-45 46-55 Above 55
2.38
1.35 0.84 5.45
33.78 44.54 21.82 28.57 10.00
64.86 54.62 72.73 69.05 90.00
95.09**
1.64 1.54 1.67 1.64 1.90
4.64 4.54 4.67 4.64 4.90
0.51 0.52 0.57 0.61 0.30
10.99 11.45 12.21 13.15 6.12
Experience Below 1 yr 1-3 yrs 3-5 yrs Above 5 yrs
1.32
2.63 1.47 3.77
27.37 34.21 35.29 45.28
72.63 61.84 63.24 50.94
50.52**
1.73 1.57 1.62 1.47
4.73 4.57 4.62 4.47
0.45 0.67 0.52 0.57
9.51 13.35 11.26 12.75
Qualification Ph. D. Graduate Post Grad. Professional
0.98
6.19 0.98 0.90 1.72
34.48 34.31 31.53 39.66
58.62 63.73 67.57 58.62
33.88**
1.52 1.61 1.67 1.57
4.52 4.61 4.67 4.57
0.62 0.56 0.49 0.53
13.72 12.15 10.49 11.60
Industry Average 0.33 1.67 34.33 63.67 1.61 4.61 0.54 11.71 SA= Strongly Agree; A= Agree; N= Neutral; D= Disagree; SD= Strongly Disagree
* significant at 5% ** significant at 1%
Table 6.7 (b)
Significance of Difference of Proportions
Comparison p1 p2 t-values
1 Vs. 2
1 Vs. 3
2 Vs. 3
0.97
0.97
0.99
0.99
0.98
0.98
2.02*
0.91
1.16
* significant at 5%

Design of Experience Base Model for Software Process Improvement
209
6.4.2 Knowledge sharing and positive changes in company
Generally it is believed that the Software engineers feel that knowledge sharing will not make
any positive changes in the company. However, in practice it may not be the case. This
question was asked to software engineers of the three organisation groups. In case of
organisation Type I, 75% respondents were of the view that knowledge sharing brings
positive changes in the company. Majority of the respondents of group II and III
organisations also confirmed this view. Age-wise, 73.13% respondents of 36-45 years aged
feel that knowledge sharing results into positive changes. 25% respondents of 46-55 years
age agree to the statement. 95.45% respondents of below 25 years disagree to the statement.
On the basis of experience, 76.67% respondents having 1 to 3 years experience disagree to
the above statement. Majority of the respondents of the highest experience feel that
knowledge sharing is necessary for making positive changes possible in their organisations.
Qualification-wise, majority of the graduate, post-graduate and professional respondents
disagree to the statement ‘Knowledge sharing will not make any positive changes in the
company’. 33% PhD respondents are of the view that knowledge sharing can not bring any
positive changes in their work environment. Overall, the majority of respondents (76.11%)
believe strongly that knowledge sharing can bring positive changes in organisation.
Co-efficient of variation reveals that there is more variability in the opinion of Software
engineers of Type II organisations’ respondents and more consistency in Type I and III
organisations’ respondents. Overall, WAS of three organisation groups is less than 1. It
means majority of respondents disagree with the given statement. The chi-square test shows
that the differences in the opinion of organisation group respondents are insignificant. Hence,
we accept null hypothesis H04: As per the perception of software engineers, knowledge
sharing will make positive changes in the company. The t-test shows the insignificant
difference in various organisation groups. Difference may exist due to some fluctuations in
sampling.

Design of Experience Base Model for Software Process Improvement
210
Table 6.8(a)
Knowledge sharing will not make any positive changes in the company
(Percent)
Group /Sub Group SD D N A SA χ2 WAS Mean S.D. CV
Type Type I Type II Type III
13.33 13.33 13.33
61.67 60.00 66.67
6.67 10.00 3.33
15.00 6.67 13.33
3.33 10.00 3.33
14.86
0.67 0.60 0.73
3.67 3.60 3.73
0.99 1.11 0.96
26.98 30.83 25.74
Age Below 25 25-35 36-45 46-55 Above 55
45.45 2.99 13.43 15.00
50.00 61.19 73.13 40.00 100.0
7.46 4.48 20.00
4.55 16.42 5.97 25.00
11.94 2.99
21.54
1.36 0.27 0.88 0.45 1.00
4.36 3.27 3.88 3.45 4.00
0.71 1.14 0.82 1.02 0.00
16.28 34.86 21.13 29.57 0.00
Experience Below 1 yr 1-3 yrs 3-5 yrs Above 5 yrs
22.22
10.53 13.95
46.67 76.67 68.42 65.12
13.33 10.53 6.98
20.00 6.67 10.53 9.30
11.11 3.33
4.65
25.80
0.49 0.63 0.79 0.74
3.49 3.63 3.79 3.74
1.33 0.75 0.77 0.97
38.11 20.66 20.32 25.94
Qualification Ph. D. Graduate Post Grad. Professional
15.91 10.59 17.78
66.67 59.09 68.24 55.56
9.09 7.06 4.44
13.64 10.59 13.33
33.33 2.27 3.53 8.89
18.89
0.00 0.73 0.72 0.60
3.00 3.73 3.72 3.60
1.41 0.96 0.92 1.18
47.00 25.74 24.73 32.78
Industry Average 13.33 62.78 6.67 11.67 5.56 0.67 3.67 1.03 28.07
SA= Strongly Agree; A= Agree; N= Neutral; D= Disagree; SD= Strongly Disagree
* significant at 5% ** significant at 1%
Table 6.8(b)
Significance of Difference of Proportions
Comparison p1 p2 t-values
1 Vs. 2
1 Vs. 3
2 Vs. 3
0.75
0.75
0.73
0.73
0.80
0.80
0.29
0.93
1.22

Design of Experience Base Model for Software Process Improvement
211
6.4.3 Knowledge sharing and competitiveness among peers
It is commonly believed that sharing knowledge reduces competitiveness among the peers.
This notion was verified from software engineers of the three organisation groups. 72%
respondents of Type I organisations agreed that knowledge-sharing reduces the
competitiveness among peers. Similarly, in Type II and III organisations, majority of the
respondents agreed that sharing knowledge reduces competitiveness among the peers. On the
basis of the work experience of the Software engineers, majority of the respondents also
agreed to the statement ‘Sharing knowledge reduces competitiveness among the peers’.
Overall, 67.67% respondents were in favour of the statement and 21.33% respondents did not
agree that sharing knowledge reduces competitiveness among the peers.
Co-efficient of variation reveals that there is more variability in the opinion of Type III
organisations’ respondents and more consistency in Type I and II organisations’ respondents.
Overall, WAS of three organisation groups is insignificant as it is less than 1. Since the
calculated value (CV) of Chi-square is greater than the table value (TV) the results are
significant at 1% LOS and the null hypothesis (H05: Sharing knowledge does not reduce
competitiveness among the peers.) is rejected. Thus, it can be inferred that sharing knowledge
reduces competitiveness among the peers. The t-test indicates that the difference in the
opinion of respondents of Type I and III and also between Type II and III is significant at 1%
LOS respectively.

Design of Experience Base Model for Software Process Improvement
212
Table 6.9(a)
Knowledge sharing reduces competitiveness among peers
(Percent)
Group /Sub Group SD D N A SA χ2 WAS Mean S.D. CV
Type Type I Type II Type III
3.00 5.00 11.00
13.00 9.00 23.00
12.00 10.00 11.00
37.00 29.00 23.00
35.00 47.00 32.00
76.92**
0.88 1.04 0.42
3.88 4.04 3.42
1.12 1.17 1.42
28.87 28.96 41.52
Age Below 25 25-35 36-45 46-55 Above 55
8.11 7.56 3.64 4.76
12.16 16.81 21.82 7.14 10.00
16.22 9.24 7.27 11.90 10.00
31.08 26.89 34.55 23.81 50.00
32.43 39.50 32.73 52.38 30.00
61.78**
0.68 0.74 0.71 1.12 1.00
3.68 3.74 3.71 4.12 4.00
1.26 1.33 1.23 1.16 0.89
34.24 35.56 33.15 28.16 22.25
Experience Below 1 yr 1-3 yrs 3-5 yrs Above 5 yrs
6.32 5.26 8.82 5.66
12.63 14.47 17.65 15.09
12.63 5.26 11.76 13.21
24.21 31.58 27.94 37.74
44.21 43.42 33.82 28.30
58.03**
0.87 0.93 0.60 0.68
3.87 3.93 3.60 3.68
1.28 1.24 1.34 1.19
33.07 31.55 37.22 32.34
Qualification Ph. D. Graduate Post Grad. Professional
8.82 4.50 8.62
3.45 13.73 17.12 18.97
17.24 9.80 11.71 8.62
34.48 34.31 26.13 25.86
44.83 33.33 40.54 37.93
47.56**
1.21 0.70 0.81 0.66
4.21 3.70 3.81 3.66
0.85 1.30 1.26 1.37
20.19 35.14 33.07 37.43
Industry Average 6.33 15.00 11.00 29.67 38.00 0.78 3.78 1.27 33.60 SA= Strongly Agree; A= Agree; N= Neutral; D= Disagree; SD= Strongly Disagree
* significant at 5% ** significant at 1%
Table 6.9(b)
Significance of Difference of Proportions
Comparison p1 p2 t-values
1 Vs. 2
1 Vs. 3
2 Vs. 3
0.72
0.72
0.76
0.76
0.55
0.55
1.29
4.99**
6.25**
* significant at 5% ** significant at 1%

Design of Experience Base Model for Software Process Improvement
213
6.4.4 Knowledge sharing is time consuming and additional responsibility
The software engineers were asked whether knowledge sharing is time consuming and seems
to be an additional responsibility. Organisation group-wise, 52% respondents of Type I
organisations agreed that knowledge sharing is time consuming and seems to be an additional
responsibility. Similarly, 51% respondents of Type II companies and 65% respondents of
Type III companies agreed that knowledge sharing is time consuming and an additional
responsibility. On the basis of work experience, more than 50% respondents of less than 1
year experience believe that knowledge sharing is time consuming and an additional
responsibility, while 64.7% respondents of 3-5 years experience and 58.49% respondents of
more than 5 years experience said that knowledge sharing is time consuming and seems to be
an additional responsibility. Only 27.34% respondents were of the view that knowledge
sharing is not time consuming. Overall, 34.67% respondents agree and 21.33% respondents
strongly agree to the statement. Hence, it can be concluded that software engineers are of the
opinion that sharing knowledge consumes their time and also increases their responsibility.
The chi-square test shows that the difference in the opinion of organisation group respondents
is significant at 1% LOS. The null hypothesis (H06: Knowledge sharing is not time
consuming and does not seem to be an additional responsibility.) is rejected. In other words,
we can infer that Software engineers feel that knowledge sharing is time consuming and an
additional responsibility. The t-test shows the significant difference in organisation Type I
and III and also in organisation group II and III at 1% LOS. Co-efficient of variation reveals
that there is more variability in the opinion of Type II organisations’ respondents and more
consistency in Type I and Type III organisations’ respondents. Overall, WAS of three
organisation groups is insignificant because it is less than 1.

Design of Experience Base Model for Software Process Improvement
214
Table 6.10(a)
Knowledge sharing is time consuming and additional responsibility
(Percent)
Group /Subgroup SD D N A SA χ2 WAS Mean S.D. CV Type Type I Type II Type III
16.00 17.00 14.00
11.00 16.00 8.00
21.00 16.00 13.00
28.00 33.00 43.00
24.00 18.00 22.00
37.19**
0.33 0.19 0.51
3.33 3.19 3.51
1.37 1.36 1.30
41.14 42.63 37.04
Age Below 25 25-35 36-45 46-55 Above 55
14.86 15.13 20.00 16.67
10.81 13.45 10.91 7.14 20.00
10.81 22.69 12.73 16.67 10.00
32.43 26.89 47.27 45.24 30.00
31.08 21.85 9.09 14.29 40.00
99.32**
0.54 0.27 0.15 0.33 0.90
3.54 3.27 3.15 3.33 3.90
1.41 1.35 1.31 1.28 1.14
39.83 41.28 41.59 38.44 29.23
Experience Below 1 yr 1-3 yrs 3-5 yrs Above 5 yrs
15.79 18.42 11.76 16.98
12.63 13.16 10.26 11.32
14.74 23.68 13.24 13.21
38.95 31.58 30.88 35.85
17.89 13.16 33.82 22.64
76.90**
0.31 0.08 0.65 0.36
3.31 3.08 3.65 3.36
1.33 1.31 1.35 1.39
40.18 42.53 36.99 41.37
Qualification Ph. D. Graduate Post Grad. Professional
17.24 21.57 13.51 8.62
6.90 9.80 16.22 8.62
10.34 16.67 17.12 18.97
41.38 32.35 33.33 37.93
24.14 19.61 19.82 25.86
41.47**
0.48 0.19 0.30 0.64
3.48 3.19 3.30 3.64
1.38 1.43 1.32 1.20
39.66 44.83 40.00 32.97
Industry Average 15.67 11.67 16.67 34.67 21.33 0.34 3.34 1.35 40.42 SA= Strongly Agree; A= Agree; N= Neutral; D= Disagree; SD= Strongly Disagree
* significant at 5% ** significant at 1%
Table 6.10(b)
Significance of Difference of Proportions
Comparison p1 p2 t-values
1 Vs. 2
1 Vs. 3
2 Vs. 3
0.52
0.52
0.51
0.51
0.65
0.65
0.28
3.73**
4.01**
** significant at 1%

Design of Experience Base Model for Software Process Improvement
215
6.4.5 Knowledge sharing and compensation
It is generally believed that everyone likes to be compensated in one form or the other for
sharing one’s knowledge. The same was asked to 302 Software engineers. In Type I
organisations, 90% respondents agree that knowledge sharing must be compensated. (cf.
Table 6.11 (a)). Similarly, in Type II and III, majority of the respondents agree to the
statement. On the basis of the age, experience and qualification profile of the software
engineers, majority of the respondents agree that knowledge sharing must be compensated.
63.87% respondents of 25-35 years strongly agree to the statement. Overall, majority of the
respondents (92.33%) do agree that knowledge sharing must be compensated.
Co-efficient of variation reveals that there is more variability in the opinion of Type I
organisations’ respondents and more consistency in Type II and III organisations’
respondents. Overall, WAS of three organisation groups is greater than 1 which means
majority of the respondents agree that knowledge sharing must be compensated. The chi-
square test reveals that the difference in the opinion of respondents of organisation groups is
significant at 1% LOS. Hence, the null hypothesis (H07: Software engineers do not want that
knowledge sharing must be compensated.) is rejected and it can be inferred that Software
engineers want that their organisations must compensate their knowledge-sharing activity.
The t-test shows the significant difference in organisation Type I and II and also in Type II
and III at 1% LOS.

Design of Experience Base Model for Software Process Improvement
216
Table 6.11(a)
Knowledge sharing must be compensated
(Percent)
Group /Sub Group SD D N A SA χ2 WAS Mean S.D. CV Type Type I Type II Type III
2.00
1.00
8.00 1.00 11.00
39.00 39.00 24.00
51.00 60.00 64.00
78.12**
1.37 1.59 1.51
4.37 4.59 4.51
0.80 0.51 0.73
18.31 11.11 16.19
Age Below 25 25-35 36-45 46-55 Above 55
0.84 1.82
0.84
16.22 2.52 5.45
20.00
32.43 31.93 34.55 40.48 40.00
51.35 63.87 58.18 59.52 40.00
98.67**
1.35 1.57 1.47 1.60 1.20
4.35 4.57 4.47 4.60 4.20
0.74 0.67 0.76 0.49 0.75
17.01 14.66 17.00 10.65 17.86
Experience Below 1 yr 1-3 yrs 3-5 yrs Above 5 yrs
1.47
1.32
7.37 9.21 2.94 7.55
41.05 23.68 32.35 37.34
51.58 65.79 63.24 54.72
198.22**
1.44 1.54 1.56 1.47
4.44 4.54 4.56 4.47
0.63 0.72 0.69 0.63
14.19 15.86 15.13 14.09
Qualification Ph. D. Graduate Post Grad. Professional
1.96
0.98
13.79 6.86 6.31 3.45
27.59 32.35 36.94 34.48
58.62 57.84 56.76 62.07
38.24**
1.45 1.43 1.50 1.59
4.45 4.43 4.50 4.59
0.72 0.82 0.61 0.56
16.18 18.51 13.56 12.20
Industry Average 0.67 0.33 6.67 34.00 58.33 1.49 4.49 0.70 15.59 SA= Strongly Agree; A= Agree; N= Neutral; D= Disagree; SD= Strongly Disagree
* significant at 5% ** significant at 1%
Table 6.11(b)
Significance of Difference of Proportions
Comparison p1 p2 t-values
1 Vs. 2
1 Vs. 3
2 Vs. 3
0.90
0.90
0.99
0.99
0.88
0.88
5.58**
0.90
6.31**
** significant at 1%
Table 6.12
Comparative Analysis of Knowledge Sharing Attitudes
(Percent)
Knowledge sharing Attitude Mean SD D N A SA Knowledge sharing is good. 4.61 0 0.33 1.67 34.33 63.67 Knowledge sharing must be compensated. 4.49 0.67 0.33 6.67 34.00 58.33 Sharing knowledge reduces competitiveness among the peers. 3.78 6.33 15.00 11.00 29.67 38.00 Knowledge sharing will not make any positive changes in the company. 3.67 13.33 62.78 6.67 11.67 5.56
Knowledge sharing is time consuming and seems to be an additional responsibility. 3.34 15.67 11.67 16.67 34.67 21.33

Design of Experience Base Model for Software Process Improvement
217
6.5 Rewards for Knowledge sharing
After judging the knowledge sharing attitude of the software engineers, it was attempted to
know the Software engineers’ preference of various methods of rewarding knowledge-
sharing activity. In the opinion of the majority of the respondents, rewarding knowledge
sharing initiative of employees with higher score in staff Key Performance Indicators is the
most preferred option while rewarding with special incentives like promotions, transfer to the
desired department/ project team etc. gain second rank (cf. Table 6.13). Financial incentives
for knowledge sharing are not very desirable by the Software engineers as compared to
higher score in their performance report or promotion benefit etc. as it has 50.87 average
score. It is also clear from Table 6.13 that getting no rewards or incentives for knowledge
sharing activity is the least preferred option which means that software engineers feel
strongly that knowledge sharing should be rewarded by some means in their organisations.
Table 6.13
Methods of Rewarding knowledge sharing activity
Rewards for Knowledge Sharing Average Rank Average Score Ranks
Higher score in staff KPIs 1.70 82.90 1
Provide recognition 5.18 33.12 4
Financially 3.94 50.87 3
Incentives like promotions 3.33 59.52 2
No rewards/ incentives 5.21 32.68 5

Design of Experience Base Model for Software Process Improvement
218
6.6 Software Engineers Perceptions on KM Issues
6.6.1 KM and Software engineers’ efficiency and productivity
The biggest advantage that the KM can provide is assumed to be increased efficiency and
productivity. The software engineers who are the actual users of the KM were asked their
views on ‘to what extent KM has increased employee’s efficiency and productivity?’
Organisation group wise, in Type I organisations, 96.67% respondents agree that KM does
increase employee’s efficiency and productivity in organisations. Similarly, 90% respondents
of Type II as well Type III organisations’ respondents also agree that KM enhances
productivity and efficiency. Age-wise, majority of the respondents of all the ages have agreed
to the statement. On the basis of experience, majority of the respondents also agree to the
statement. Education-wise, 100% Ph.D. and more than 96% professional respondents have
agreed that KM is beneficial to software engineers as far as the efficiency and productivity is
concerned.
Overall, 45% of the total respondents believe that KM increases employees’ efficiency and
productivity to a large extent and 47% of the total respondents are of the view that KM
increases employees’ efficiency and productivity to some extent. Thus, overall, the majority
of respondents (92.22%) think that KM increases employees’ efficiency and productivity.
Statistically, Co-efficient of variation reveals that there is more variability in the opinion of
software engineers of Type III and Type II organisations’ respondents and more consistency
in Type I Organisations’ respondents. Overall, WAS of three organisation groups is greater
than 1. It means majority of the respondents are satisfied that KM increases employees’
efficiency and productivity. The t-test reveals significant difference in the opinions of
respondents of organisation groups Type I and II and in organisation groups Type I and III at
5% LOS.

Design of Experience Base Model for Software Process Improvement
219
Table 6.14 (a)
KM and Software engineers’ efficiency and productivity
(Percent)
Group /Sub Group
Not at All
Very Little
Cant Say
Some Extent
Large Extent
χ2 WAS Mean S.D. CV
Type Type I Type II Type III
3.33 3.33 3.33
6.67 6.67
55.00 40.00 46.67
41.67 50.00 43.33
11.91
1.35 1.37 1.30
4.35 4.37 4.30
0.65 0.75 0.74
14.94 17.16 17.21
Age Below 25 25-35 36-45 46-55 Above 55
13,64 1.49 2.99
27.27 2.99
31.82 41.79 49.25 80.00 25.00
27.27 53.73 47.76 20.00 75.00
103.17**
0.73 1.48 1.42 1.20 1.75
3.73 4.48 4.42 4.20 4.75
1.01 0.63 0.65 0.40 0.43
27.08 14.06 14.71 9.52 9.05
Experience Below 1 yr 1-3 yrs 3-5yrs Above 5 yrs
6.67 3.33 10.53
13.33
37.78 30.00 36.84 66.67
42.22 66.67 52.33 33.33
76.81**
1.16 1.60 1.32 1.33
4.16 4.60 4.32 4.33
0.89 0.66 0.92 0.47
21.39 14.35 21.30 10.85
Qualification Ph. D. Graduate Post Grad. Professional
11.36
2.57
9.09 2.35
66.67 56.82 51.76 25.64
33.33 22.73 45.88 71.79
67.57**
1.33 0.91 1.44 1.67
4.33 3.91 4.44 4.67
0.47 0.87 0.54 0.61
10.85 22.25 12.16 13.06
Industry Average
3.33 4.44 47.22 45.00 1.34 4.34 0.72 16.59
* significant at 5% ** significant at 1%
Table 6.14 (b)
Significance of Difference of Proportions
Comparison p1 p2 t-values
1 Vs. 2
1 Vs. 3
2 Vs. 3
0.97
0.97
0.90
0.90
0.90
0.90
2.07 *
2.07 *
0.00
* significant at 5%

Design of Experience Base Model for Software Process Improvement
220
6.6.2 KM and Organisation’s overall performance
All the respondents of Type I organisations and 90% of Type III organisations’ respondents
agree that overall performance of organisations has improved due to KM induction. Age-wise
also, all the respondents of below 25 years of age and above 55 years of age feel that overall
performance of organisations has improved due to KM induction. On the basis of experience,
majority of the lower and highly experienced respondents feel that overall performance of
organisations has improved due to KM induction. Qualification-wise, all the Ph.D. software
engineers agree to the same. Majority of the respondents of graduate, post-graduate and
professional qualifications have also responded that overall performance of organisations has
improved due to KM induction. Overall, the majority of respondents (91.12%) are satisfied
that KM induction in their organisations has improved the overall performance of their
organisations.
Co-efficient of variation reveals that there is more variability in the opinion of software
engineers of Type II and Type III organisations’ respondents and more consistency in Type I
organisations’ respondents. Overall, WAS of the three organisation groups is significant
because it is greater than 1. The chi-square test shows that the difference in the opinions of
organisation group respondents is significant at 1% LOS. The t-test shows significant
difference in organisation group Type I and II, also in organisation group I and III at 1%
LOS.

Design of Experience Base Model for Software Process Improvement
221
Table 6.15 (a)
KM and Organisation’s overall performance
(Percent)
Group /Sub Group
Not at All
Very Little
Cant Say
Some Extent
Large Extent
χ2 WAS Mean S.D. CV
Type Type I Type II Type III
3.33
6.67 3.33
10.00 3.33
78.33 30.00 73.33
21.67 53.33 16.67
89.05**
1.22 1.30 0.97
4.22 4.30 3.97
0.41 0.90 0.80
9.72 20.93 20.15
Age Below 25 25-35 36-45 46-55 Above 55
2.99
5.97 10.00
11.94
40.91 55.22 71.64 65.00 50.00
59.09 32.84 19.40 25.00 50.00
73.29**
1.59 1.21 0.99 1.05 1.50
4.59 4.21 3.99 4.05 4.50
0.49 0.64 0.84 0.80 0.50
10.68 15.20 21.05 19.75 11.11
Experience Below 1 yr 1-3 yrs 3-5 yrs Above 5 yrs
21.05 2.56
4.44 13.33 10.53
46.67 53.33 31.58 82.05
48.89 33.33 36.84 15.38
101.77**
1.44 1.20 0.84 1.10
4.44 4.20 3.84 4.10
0.58 0.65 1.14 0.50
13.06 15.48 29.69 12.20
Qualification Ph. D. Graduate Post Grad. Professional
2.35
9.09 2.35
4.71 10.26
100.0 75.00 55.29 53.85
15.91 35.29 35.90
45.49**
1.00 0.98 1.19 1.26
4.00 3.98 4.19 4.26
0.00 0.72 0.82 0.63
0.00 18.09 19.57 14.79
Industry Average
1.11 3.33 4.44 60.56 30.56 1.16 4.16 0.75 18.03
** significant at 1%
Table 6.15 (b)
Significance of Difference of Proportions
Comparison p1 p2 t-values
1 Vs. 2
1 Vs. 3
2 Vs. 3
1.00
1.00
0.83
0.83
0.90
0.90
4.67 **
3.55 **
1.52
** significant at 1%
Design of Experience Base Model for Software Process Improvement
222
6.6.3 KM induction and Software engineers’ overall workload
As per Table 6.16(a), 68.33% of respondents from Type I organisations do not feel that their
overall workload and job burden has reduced due to KM induction in their organisations.
Similarly, in Type II and Type III organisations, majority of the respondents responded that
their workload and job burden has not reduced due to KM induction. Only a few respondents
said that the overall workload and job burden has reduced due to KM induction in
organisations. Overall, 57.78% respondents replied that their workload and job burden has
not reduced at all or has reduced very little due to KM induction in their organisations.
Co-efficient of variation reveals that there is more variability in the opinion of software
engineers of Type II organisations’ respondents and more consistency in Type I and Type III
organisations’ respondents. Overall, WAS of three organisation groups is insignificant
because it is less than 1. The chi-square test shows that the difference in the opinions of
organisation group respondents is significant at 1% LOS. The t-test shows the insignificant
difference in various organisation groups, difference exists due to some fluctuations.

Design of Experience Base Model for Software Process Improvement
223
Table 6.16 (a)
KM induction and Reduction in Software engineers’ Job Burden
(Percent)
Group /Sub Group
Not at All
Very little
Cant Say
Some Extent
Large Extent
χ2 WAS Mean S.D. CV
Type Type I Type II Type III
30.00 40.00 10.00
38.33 16.67 38.33
3.33 10.00
28.33 33.33 38.33
3.33 6.67 3.33
50.87**
-0.63 -0.50 -0.13
2.37 2.50 2.87
1.26 1.45 1.13
53.16 58.00 39.37
Age Below 25 25-35 36-45 46-55 Above 55
13.64 41.79 16.42 30.00
22.73 23.88 46.27 15.00 25.00
2.99 5.97 10.00
63.64 28.36 26.87 30.00 75.00
2.99 4.48 15.00
76.96**
0.14 -0.73 -0.43 -0.15 0.50
3.14 2.27 2.57 2.85 3.50
1.18 1.33 1.17 1.49 0.87
37.58 58.59 45.53 52.28 24.86
Experience Below 1 yr 1-3 yrs 3-5 yrs Above 5 yrs
31.11 63.33 26.32 10.26
22.22 13.33 42.11 43.59
7.69
46.67 16.67 15.79 34.62
6.67 15.79 3.85
106.36**
-0.38 -0.10 -0.47 -0.32
2.62 1.90 2.53 2.78
1.34 1.37 1.43 1.14
51.15 72.11 56.52 41.01
Qualification Ph. D. Graduate Post Grad. Professional
13.64 27.06 48.72
43.18 30.59 23.08
66.67 4.55 2.35
33.33 36.36 37.65 20.51
2.27 2.35 7.69
148.14**
0.33 -0.30 -0.42 -0.85
3.33 2.70 2.58 2.15
0.47 1.16 1.30 1.41
14.11 42.96 50.39 65.58
Industry Average
26.67 31.11 4.44 33.33 4.44 0.42 2.58 1.31 50.78
* significant at 5% ** significant at 1%
Table 6.16 (b)
Significance of Difference of Proportions
Comparison p1 p2 t-values
1 Vs. 2
1 Vs. 3
2 Vs. 3
0.32
0.32
0.40
0.40
0.42
0.42
1.35
1.61
0.26

Design of Experience Base Model for Software Process Improvement
224
6.6.4 KM and Software engineers’ work-load and stress
Though KM provides certain benefits, it also has its dark side. Software engineers were asked
‘to what extent KM causes extra work-load and stress among them? Organisation group-wise,
in Type I organisations, 45% software engineers disagreed that KM causes any extra work-
load or stress among the software engineers. On the other hand, 46.67% respondents of Type
II Organisations and 76.67% respondents of Type III Organisations agree that KM causes
extra load and stress among the software engineers. Age-wise, majority of the respondents do
agree that KM causes extra work-load and stress among the software engineers. 55%
respondents of 46-55 years of age donot agree with the above statement. On the basis of work
experience and qualifications, majority of the respondents agree to the statement but 56.67%
respondents of 1-3 years experience disagree to the same. 31.76% post graduate respondents
also disagree with the above statement. Overall, only 55% respondents feel that KM causes
extra work-load and stress among software engineers.
Statistically, co-efficient of variation reveals that there is more variability in the opinion of
software engineers of Type II Organisations’ respondents and more consistency in Type I and
Type III Organisations’ respondents. Overall, WAS of three organisation groups is
insignificant because it is less than 1. The chi square test shows that the difference in the
opinions of organisation group respondents is significant at 1% LOS. The t-test shows
significant difference in organisation group I and III, and in organisation group II and III at
1% LOS.

Design of Experience Base Model for Software Process Improvement
225
Table 6.17 (a)
KM and Software engineers’ Extra work-load and stress
(Percent)
Group /Sub Group
Not at All
Very Little
Cant Say
Some Extent
Large Extent
χ2 WAS Mean S.D. CV
Type Type I Type II Type III
3.33 20.00 3.33
41.67 23.33 10.00
13.33 10.00 10.00
41.67 36.67 56.67
10.00 20.00
79.84**
-0.07 -0.07 0.80
2.93 2.93 3.80
0.98 1.34 0.98
33.45 45.73 25.79
Age Below 25 25-35 36-45 46-55 Above 55
14.93 4.48 15.00
27.27 28.36 17.91 40.00
13.43 10.45 20.00
36.36 40.30 58.21 25.00 50.00
36.36 2.99 8.96
50.00
97.35**
0.82 -0.12 0.49 -0.45 1.50
3.82 2.88 3.49 2.55 4.50
1.19 1.18 1.03 1.02 0.50
31.15 40.97 29.51 40.00 11.11
Experience Below 1 yr 1-3 yrs 3-5 yrs Above 5 yrs
17.78
15.79 3.85
22.22 56.67 26.32 16.67
8.89 13.33 10.53 12.82
33.33 30.00 47.37 58.97
17.78
7.69
80.14**
0.11 -0.27 -0.11 0.50
3.11 2.73 2.89 3.50
1.40 0.89 1.17 0.98
45.02 32.60 40.48 28.00
Qualification Ph. D. Graduate Post Grad. Professional
6.82 9.41 12.82
22.73 22.35 41.02
9.09 12.94 12.82
66.67 43.18 50.59 28.20
33.33 18.18 4.71 5.13
44.13**
1.33 0.43 0.19 -0.28
1.33 3.43 3.19 2.72
0.47 1.21 1.12 1.15
10.85 35.28 35.11 42.28
Industry Average
8.89 25.00 11.11 45.00 10.00 0.22 3.22 1.19 36.96
* significant at 5% ** significant at 1%
Table 6.17 (b)
Significance of Difference of Proportions
Comparison p1 p2 t-values
1 Vs. 2
1 Vs. 3
2 Vs. 3
0.42
0.42
0.47
0.47
0.77
0.77
0.78
5.52 **
4.78 **
** significant at 1%

Design of Experience Base Model for Software Process Improvement
226
6.6.5 KM and Software Process Improvement
Organisation group-wise, in Type I, 96.66% respondents opine that with the induction of KM
in their organisations, the software processes have improved. Similarly, in Type II and Type
III organisations, majority of the respondents also agree that with the induction of KM
practices, the software processes have improved. Age-wise, majority of the highest and the
lowest aged respondents are also of the same opinion. All the respondents of more than 55
years of age think that KM has improved the software process to a large extent. Majority of
the software engineers, on the basis of experience and qualification, also feel the same way.
52.56% respondents having more than 5 years experience also feel that KM has improved the
software process to a large extent. Overall, majority of the respondents (91.11%) do believe
that KM has improved the software process in their organisations.
Co-efficient of variation reveals that there is more variability in the opinion of software
engineers of Type III Organisations’ respondents and more consistency in Type I and Type II
Organisations’ respondents. Overall, WAS among three organisation groups is greater than 1.
It means majority of the respondents affirm that KM has improved software process in their
organisations. The chi square test shows that the difference in the opinions of organisation
group respondents is significant at 1% LOS. The t-test shows significant difference in
organisation group I and III and in organisation group II and III at 1 % and 5% LOS
respectively.

Design of Experience Base Model for Software Process Improvement
227
Table: 6.18 (a)
KM and Software Process Improvement
(Percent)
Group /Sub Group
Not at All
Very Little
Cant Say
Some Extent
Large Extent
χ2 WAS Mean S.D. CV
Type Type I Type II Type III
3.33 3.33
3.33
6.67
3.33 6.67
53.33 66.67 38.33
43.33 26.67 45.00
35.57**
1.37 1.13 1.15
4.37 4.13 4.15
0.66 0.76 1.03
15.10 18.40 24.82
Age Below 25 25-35 36-45 46-55 Above 55
5.97
4.55
7.46
2.99 2.99 10.00
68.18 65.67 44.78 30.00
27.27 25.37 44.78 60.00 100.0
71.31**
1.18 1.04 1.27 1.50 2.00
4.18 4.04 4.27 4.50 5.00
0.65 0.90 0.84 0.67 0.00
15.55 22.28 19.67 14.89 0.00
Experience Below 1 yr 1-3 yrs 3-5 yrs Above 5 yrs
13.33
2.22
10.53 3.85
7.69
71.11 66.67 57.89 35.90
26.67 20.00 31.58 52.56
94.15**
1.22 0.80 1.11 1.37
4.22 3.80 4.11 4.37
0.55 1.17 0.85 0.79
13.03 30.79 20.68 18.08
Qualification Ph. D. Graduate Post Grad. Professional
10.26
6.82 2.35 2.56
66.67 4.55
56.82 55.29 53.85
33.33 31.82 42.35 33.33
188.67**
0.67 1.14 1.38 0.97
3.67 4.14 4.38 3.97
0.94 0.79 0.61 1.17
25.61 19.08 13.93 29.47
Industry Average
2.22 3.33 3.33 52.78 38.33 1.22 4.22 0.84 19.91
** significant at 1%
Table: 6.18 (b)
Significance of Difference of Proportions
Comparison p1 p2 t-values
1 Vs. 2
1 Vs. 3
2 Vs. 3
0.97
0.97
0.97
0.93
0.83
0.83
1.18
3.44 **
2.41 *
* significant at 5% ** significant at 1%

Design of Experience Base Model for Software Process Improvement
228
6.6.6 Atmosphere for sharing knowledge in organisations
Organisation group-wise, 61.67% software engineers of Type I organisations disagree that
their organisations promote and provide atmosphere for sharing knowledge and experience
among its employees. On the other hand, less than 50% respondents of Type II and Type III
organisations feel that there is a culture of knowledge sharing in their organisations. Age-
wise, majority of the respondents feel that their organisations support knowledge sharing to
very little extent and 50% respondents of above 55 years of age say that organisations
promote knowledge sharing to a large extent. On the basis of experience, majority of the
highly experienced respondents disagree to this. According to qualifications, less than 50%
respondents feel very little organisational support and 64% professional respondents disagree
with the statement. Overall, 46.66% respondents are against the belief that there is knowledge
sharing support systems in their organisations and 36.67% respondents agree to the above
statement.
Statistically, co-efficient of variation reveals that there is more variability in the opinion of
software engineers of Type II organisations’ respondents and more consistency in Type I and
Type III organisations’ respondents. Overall, WAS of three organisation groups is
insignificant because it is less than 1. The chi-square test shows that the difference in the
opinions of organisation group respondents is significant at 1% LOS. The t-test shows
significant difference in organisation group I and II, and in organisation group I and III at 1%
and 5 % LOS respectively.

Design of Experience Base Model for Software Process Improvement
229
Table 6.19 (a)
Atmosphere for sharing knowledge in organisations
(Percent)
Group /Sub Group
Not at All
Very Little
Cant Say
Some Extent
Large Extent
χ2 WAS Mean S.D. CV
Type Type I Type II Type III
10.00
61.67 36.67 31.67
13.33 6.67 30.00
16.67 16.67 35.00
8.33 30.00 3.33
105.63**
-0.28 0.20 0.10
2.72 3.20 3.10
1.02 1.45 0.89
37.50 45.31 28.71
Age Below 25 25-35 36-45 46-55 Above 55
5.97 2.99
18.18 43.28 52.24 40.00 50.00
9.09 11.94 13.43 55.00
45.45 20.90 25.37
27.27 17.91 5.97 5.00 50.00
100.27**
0.82 0.01 -0.21 -0.30 0.50
3.82 3.01 2.79 2.70 3.50
1.03 1.26 1.04 0.71 1.50
26.96 41.86 37.28 26.30 42.86
Experience Below 1 yr 1-3 yrs 3-5 yrs Above 5 yrs
4.44 6.67
10.53
28.89 53.33 52.63 47.44
11.11 3.33 5.26 29.49
28.89 16.67 31.58 14.10
26.67 20.00
8.97
72.98**
0.44 -0.10 -0.42 -0.15
3.44 2.90 2.58 2.85
1.27 1.33 1.04 0.98
36.92 45.86 40.31 34.39
Qualification Ph. D. Graduate Post Grad. Professional
2.35 10.26
45.45 43.53 53.85
66.67 20.45 9.41 17.94
33.33 29.55 22.35 7.69
4.55 22.35 10.26
72.99**
0.33 -0.07 0.19 -0.46
3.33 2.93 3.19 2.54
0.47 0.96 1.27 1.11
14.11 32.76 39.81 43.70
Industry Average
3.33 43.33 16.67 22.78 13.89 0.01 3.01 1.16 38.54
* significant at 5% ** significant at 1%
Table 6.19 (b)
Significance of Difference of Proportions
Comparison p1 p2 t-values
1 Vs. 2
1 Vs. 3
2 Vs. 3
0.25
0.25
0.47
0.47
0.38
0.38
3.50 **
2.22 *
1.31
* significant at 5% ** significant at 1%

Design of Experience Base Model for Software Process Improvement
230
6.6.7 KMS and ease of knowledge capturing and sharing
It is assumed that KMS reduces manual labour and thus makes the capturing and sharing of
knowledge among the members of an organisation easy. Software engineers, the actual users
of the KMS, were asked ‘to what extent KMS in your organisation has made the capturing
and sharing of knowledge easy?’ Organisation group-wise, in Group I, all the respondents
agreed that KMS provides ease of knowledge capturing and sharing to the software
engineers. 71.67% of Group I respondents say that KMS provides ease ‘to some extent’ and
28.33% of respondents say that KMS provides ease of knowledge sharing to a large extent.
Similarly, in Type II and Type III Organisations, majority of the respondents have agreed to
the statement. Overall, majority of the respondents (97.78%) think that KM systems do
provide comfort and ease for capturing as well as sharing knowledge among software
engineers in SE organisations.
All the respondents of higher age (more than 46 years of age) feel that KMS has made the
capturing and sharing of knowledge easy. It is worth mentioning here that respondents of
higher age group as compared to lower age group have probably seen all times from no KM
systems at all to KM systems working in their organisations. Therefore, their responses have
more significance.
Co-efficient of variation reveals that there is more variability in the opinion of software
engineers of Type III organisations’ respondents and more consistency in Type I and Type II
organisations’ respondents. Overall, WAS of three organisation groups is greater than 1. It
means majority of the respondents affirm that KMS in their organisations has made the
capture and sharing of knowledge easy. The chi-square test shows that the difference in the
opinions of organisation group respondents is significant at 1% LOS. The t-test shows
significant difference in organisation group I and II, and in organisation group I and III at 5%
LOS.

Design of Experience Base Model for Software Process Improvement
231
Table 6.20 (a)
KMS and ease of knowledge capturing and sharing
(Percent)
Group /Sub Group
Not at All
Very Little
Cant Say
Some Extent
Large Extent
χ2 WAS Mean S.D. CV
Type Type I Type II Type III
3.33
3.33
71.67 53.33 58.33
28.33 43.33 38.33
23.35**
1.28 1.40 1.32
4.28 4.40 4.32
0.45 0.55 0.65
10.51 12.50 15.05
Age Below 25 25-35 36-45 46-55 Above 55
2.99
2.99
40.91 59.70 70.15 65.00 25.00
59.09 37.31 26.87 35.00 75.00
32.87**
1.59 1.34 1.21 1.35 1.75
4.59 4.34 4.21 4.35 4.75
0.49 0.53 0.59 0.48 0.43
10.68 12.21 14.01 11.03 9.05
Experience Below 1 yr 1-3 yrs 3-5yrs Above 5 yrs
10.53
10.53
62.22 56.67 36.84 69.23
37.78 43.33 42.11 30.77
72.47**
1.38 1.43 1.11 1.31
4.38 4.43 4.11 4.31
0.48 0.50 0.97 0.46
10.96 11.29 23.60 10.67
Qualification Ph. D. Graduate Post Grad. Professional
4.55
2.35
100.0 65.91 64.71 46.15
29.55 32.94 53.85
35.17**
1.00 1.20 1.31 1.54
4.00 4.20 4.31 4.54
0.00 0.66 0.51 0.50
0.00 15.71 11.83 11.01
Industry Average
1.11 1.11 61.11 36.67 1.33 4.33 0.56 12.93
* significant at 5% ** significant at 1%
Table 6.20 (b)
Significance of Difference of Proportions
Comparison p1 p2 t-values
1 Vs. 2
1 Vs. 3
2 Vs. 3
1.00
1.00
0.97
0.97
0.97
0.97
2.02 *
2.02 *
0.00
* significant at 5%
Design of Experience Base Model for Software Process Improvement
232
6.6.8 Rewards for Knowledge Sharing
It is a common fact that to promote knowledge sharing in an organisation, it has to be
rewarded in some form or the other. Software engineers in the survey were asked as to what
extent knowledge sharing in their organisations is rewarded? 56.67% software engineers of
Type I organisations responded that knowledge sharing activity is rewarded in their
organisations to a very little extent. Similarly, respondents of Type II as well as Type III
organisations responded that knowledge sharing is very poorly rewarded. Age-wise, majority
of the lowest and the highest aged software engineers responded the same answer ‘very little’
and ‘not at all’. On the basis of experience and qualifications, majority of the respondents
also favoured ‘very little and not at all’ responses. Overall, 63.33% software engineers claim
that knowledge sharing in SE organisations is rewarded to a very little extent.
Co-efficient of variation reveals that there is more variability in the opinion of software
engineers of Type III organisations’ respondents and more consistency in Type I and Type II
organisations’ respondents. Overall, WAS of three organisation groups is significant because
it is greater than 1. The chi-square test shows that the difference in the opinions of
organisation group respondents is significant at 1% LOS. The t-test shows insignificant
difference in various organisation groups, i.e., difference exists due to some fluctuations.

Design of Experience Base Model for Software Process Improvement
233
Table 6.21 (a)
Knowledge Sharing is Rewarded
(Percent)
Group /Sub Group
Not at All
Very Little
Cant Say
Some Extent
Large Extent
χ2 WAS Mean S.D. CV
Type Type I Type II Type III
36.67 13.33 33.33
56.67 80.00 53.33
3.33 6.67 6.67
3.33
3.33
3.33
35.36**
1.47 1.73 1.30
4.47 4.73 4.30
0.72 0.57 0.97
16.11 12.05 22.56
Age Below 25 25-35 36-45 46-55 Above 55
40.91 31.34 23.88 10.00 50.00
54.55 62.69 68.66 60.00 50.00
4.55 5.97 2.99 15.00
10.00
4.48 5.00
60.66**
1.50 1.57 1.57 1.05 1.50
4.50 4.57 4.57 4.05 4.50
0.58 0.60 0.76 1.36 0.50
12.89 13.13 16.63 33.58 11.11
Experience Below 1 yr 1-3 yrs 3-5 yrs Above 5 yrs
33.33 60.00 15.79 15.38
60.00 40.00 78.95 69.23
6.67
8.97
2.56
5.26 3.85
61.30**
1.53 1.40 1.68 1.45
4.53 4.40 4.68 4.45
0.62 0.49 0.73 0.98
13.69 11.14 15.60 22.02
Qualification Ph. D. Graduate Post Grad. Professional
36.36 21.18 35.90
33.33 61.36 70.59 53.85
66.67
5.88 2.56
5.13
2.27 2.35 2.56
112.62**
0.67 1.57 1.60 1.31
3.67 4.57 4.60 4.31
0.94 0.62 0.71 1.02
25.61 13.57 15.43 23.67
Industry Average
27.78 63.33 5.56 1.11 2.22 1.50 4.50 0.79 17.56
* significant at 5% ** significant at 1%
Table 6.21 (b)
Significance of Difference of Proportions
Comparison p1 p2 t-values
1 Vs. 2
1 Vs. 3
2 Vs. 3
0.93
0.93
0.93
0.93
0.87
0.87
0.00
1.72
1.72

Design of Experience Base Model for Software Process Improvement
234
6.6.9 Training related to KM Practices
The software engineers were asked to answer the question ‘To what extent they are provided
formal or informal training related to KM practices in their organisations?’ Organisation
group-wise, 63.33% of Type I organisations’ respondents feel that no training, whether
formal or informal, related to KM practices is provided in their organisations. Similarly,
majority of the Type III organisations’ respondents feel that there in no training on KM by
their respective organisations. On the other hand, more than half of the Type II organisations’
respondents claim that their organisations provide some training related to KM process and
practices. Age-wise, 63.64% respondents of below 25 years age feel the absence of any
training on KM. 70% respondents of 46-55 age also agree that there is either no training or
the training is very little on KM practices in their organisations. On the basis of experience,
majority of the respondents having 3 to 5 years experience also feel that training on KM is to
some extent. 55.13% respondents of above 5 years experience think that there is no KM
training provided in their organisations. However, 30.77% respondents having more than 5
years of experience state that the training provided by their organisations on KM practices is
very little. Qualification-wise, 66.67% Ph.D. respondents choose the option ‘not at all’. On
the other hand, 67.06% respondents of postgraduate and 53.84% professional respondents
feel that their organisations provide either no training or very little training on KM. Overall,
the majority of respondents (66.67%) do feel the absence of formal or informal training
related to KM practices in their organisations.
Co-efficient of variation reveals that there is more variability in the opinion of software
engineers of Type III organisations’ respondents and more consistency in Type I and Type II
Organisations’ respondents. Overall, WAS of three organisation groups is insignificant
because it is less than 1. The chi-square test shows that the difference in the opinions of
organisation group respondents is significant at 1% LOS. The t-test shows the significant
difference in organisation group I and III at 5% LOS.

Design of Experience Base Model for Software Process Improvement
235
Table 6.22 (a)
Training related to KM Practices
(Percent)
Group /Sub Group
Not at All
Very Little
CantSay
Some Extent
Large Extent
χ2 WAS Mean S.D. CV
Type Type I Type II Type III
63.33 20.00 51.67
20.00 16.67 28.33
6.67 3.33
16.67 53.33 10.00
3.33 6.67
95.81**
1.23 0.70 0.72
4.23 3.70 3.72
1.17 1.07 1.48
27.66 28.92 39.78
Age Below 25 25-35 36-45 46-55 Above 55
63.64 31.34 43.28 65.00 100.0
13.64 19.40 32.84 5.00
5.97 2.99
22.73 34.33 20.90 30.00
8.96 67.50**
1.36 0.60 0.75 1.55 2.00
4.36 3.60 3.75 4.55 2.00
1.02 1.34 1.31 0.74 0.00
23.39 37.22 34.93 16.26 0.00
Experience Below 1 yr 1-3 yrs 3-5 yrs Above 5 yrs
40.00 40.00 31.58 55.13
24.44 13.33
30.77
4.44
26.67 33.33 68.42 14.10
4.44 13.33 91.22**
0.73 0.73 1.32 0.94
3.73 3.73 4.32 3.94
1.32 1.44 0.46 1.33
35.39 38.61 10.65 33.76
Qualification Ph. D. Graduate Post Grad. Professional
66.67 61.36 38.82 38.46
15.91 28.24 15.38
4.71 5.13
33.33 22.73 28.24 25.64
15.38
64.78**
1.67 1.30 0.78 0.56
4.67 4.30 3.78 3.56
0.47 1.08 1.23 1.50
10.06 25.12 32.5442.13
Industry Average
45.00 21.67 3.33 26.67 3.33 0.88 3.88 1.28 32.99
* significant at 5% ** significant at 1%
Table 6.22 (b)
Significance of Difference of Proportions
Comparison p1 p2 t-values
1 Vs. 2
1 Vs. 3
2 Vs. 3
0.80
0.80
0.73
0.73
0.62
0.62
1.22
3.12 *
1.93
* significant at 5%

Design of Experience Base Model for Software Process Improvement
236
6.6.10 KMS and linking of organisational members
The software engineers were asked as to what extent IT enabled KMS has been able to link
all members of the organisation to one another. 68% of Type I organisations’ respondents,
53% of Type II organisations’ and 82% of Type III organisations’ software engineers said
that IT driven KMS could link the organisational members to some extent. On the basis of
experience, 64.45% respondents of less than one year experience and 94.87% respondents of
above 5 years of experience agreed that KMS links the members to one another within an
organisation.
However, 21.05% respondents of 3 to 5 years of experience disagree that KMS could provide
the link among the members within their organisations. According to qualification, majority
of the respondents of each level of qualification do feel that IT infrastructure in KMS in
organisations is helping its employees in linking to one another. Overall, majority of the
respondents (81.11%) are of the view that IT enabled KMS has been able to link the software
engineers within the organisational setup.
Co-efficient of variation reveals that there is more variability in the opinion of software
engineers of Type II organisations and more consistency in Type I and Type III
organisations’ respondents. Overall, WAS of the three organisation groups is insignificant
because it is less than 1. The chi square test shows that the difference in the opinions of
organisation group respondents is significant at 1% LOS. The t-test shows the significant
difference in organisation group I and II, and in organisation group II and III at 1% LOS.

Design of Experience Base Model for Software Process Improvement
237
Table 6.23 (a)
KMS and Linking of organisational members
(Percent)
Group /Sub Group
Not at All
Very Little
Cant Say
Some Extent
Large Extent
χ2 WAS Mean S.D. CV
Type Type I Type II Type III
1.67
10.00 16.67 8.33
3.33 13.33 3.33
68.33 53.33 81.67
16.67 16.67 6.67
33.11**
0.88 0.70 0.87
3.88 3.70 3.87
0.86 0.94 0.64
22.16 25.14 16.54
Age Below 25 25-35 36-45 46-55 Above 55
5.00
9.09 20.90 2.99 15.00
14.92 2.99
77.27 50.75 79.10 70.00 100.0
13.64 13.43 14.92 10.00
70.34**
0.95 0.57 1.06 0.65 1.00
3.95 3.57 4.06 3.65 4.00
0.71 0.97 0.54 1.01 0.00
17.97 27.17 13.30 27.67 0.00
Experience Below 1 yr 1-3 yrs 3-5 yrs Above 5 yrs
1.28
22.22 6.67 21.05 3.85
13.33 13.33 10.53
48.89 60.00 68.42 83.33
15.56 20.00 11.54
63.36**
0.58 0.93 0.47 1.00
3.58 3.93 3.47 4.00
1.00 0.77 0.82 0.62
27.93 19.59 23.63 15.50
Qualification Ph. D. Graduate Post Grad. Professional
1.18
6.82 12.94 17.95
4.71 15.38
100.0 81.82 62.35 58.97
11.36 18.82 7.69
39.85**
1.00 0.98 0.85 0.56
4.00 3.98 3.85 3.56
0.00 0.62 0.91 0.87
0.00 15.58 23.64 24.44
Industry Average
0.56 11.67 6.67 67.78 13.33 0.82 3.82 0.83 21.73
* significant at 5% ** significant at 1%
Table 6.23 (b)
Significance of Difference of Proportions
Comparison p1 p2 t-values
1 Vs. 2
1 Vs. 3
2 Vs. 3
0.85
0.85
0.70
0.70
0.88
0.88
2.78 **
0.76
3.50 **
** significant at 1%

Design of Experience Base Model for Software Process Improvement
238
6.6.11 Documentation of Tacit knowledge
The software engineers were asked as to what extent KMS in their organisations had been
able to document the tacit knowledge. Majority of all the organisation groups’ respondents
agreed that KMS has not succeeded in documenting the tacit part of the knowledge, i.e., what
one knows how to do but can not express in words. Overall, the majority of the respondents
(91.11%) feel that KMS has failed in documenting the tacit knowledge.
Statistically, co-efficient of variation reveals that there is more variability in the opinion of
software engineers of Type II and Type III organisations and more consistency in Type I
organisations’ respondents. Overall, WAS of three organisation groups is greater than 1. It
means majority of the respondents understand that the tacit knowledge has not been
documented in their KM systems in their organisations. The chi-square test shows that the
difference in the opinions of organisation group respondents is significant at 1% LOS. The t-
test shows significant difference in organisation group I and III, and in organisation group II
and III at 1 % and 5% LOS respectively.

Design of Experience Base Model for Software Process Improvement
239
Table 6.24 (a)
Documentation of Tacit knowledge
(Percent)
Group /Sub Group
Not at All
Very Little
Cant Say
Some Extent
Large Extent
χ2 WAS Mean S.D. CV
Type Type I Type II Type III
65.00 56.67 68.33
31.67 36.67 15.00
3.33 3.33 10.00
3.33
6.67
42.89**
1.28 1.23 0.92
4.28 4.23 3.92
0.52 0.80 0.71
12.15 18.91 18.11
Age Below 25 25-35 36-45 46-55 Above 55
90.91 46.27 74.63 50.00 75.00
9.09 46.27 14.93 30.00 25.00
7.46 4.48 10.00
2.99
2.99 10.00
73.11**
1.09 1.39 0.96 1.00 1.25
4.09 4.39 3.96 4.00 4.25
0.29 0.62 0.76 0.89 0.43
7.09 14.12 19.19 22.25 10.12
Experience Below 1 yr 1-3 yrs 3-5 yrs Above 5 yrs
64.44 60.00 52.63 65.38
35.56 40.00 31.58 17.95
5.26 11.54
10.53
5.13
71.05**
1.36 1.40 0.95 0.96
4.36 4.40 3.95 3.96
0.48 0.49 1.15 0.71
11.01 11.14 29.11 17.93
Qualification Ph. D. Graduate Post Grad. Professional
33.33 75.00 60.00 56.41
18.18 31.76 38.46
66.67 6.82 1.18 5.13
2.35
4.71 110.92**
0.33 1.11 1.14 1.33
3.33 4.11 4.14 4.33
0.47 0.49 0.84 0.57
14.11 11.92 20.29 13.16
Industry Average
63.33 27.78 5.56 1.11 2.22 1.14 4.14 0.71 17.15
* significant at 5% ** significant at 1%
Table 6.24 (b)
Significance of Difference of Proportions
Comparison p1 p2 t-values
1 Vs. 2
1 Vs. 3
2 Vs. 3
0.97
0.97
0.93
0.93
0.83
0.83
1.18
3.44 **
2.41 *
* significant at 5% ** significant at 1%

Design of Experience Base Model for Software Process Improvement
240
6.6.12 KMS and Ease of collaborative work of projects/teams
Of Type I organisations, 65% software engineers feel that KMS has increased the
collaborative work of projects or teams that are physically separated to some extent and
26.67% feel that KMS has eased the collaborative work in organisations to a large extent.
Similarly, 86.66% software engineers of Type III organisations and 80% of Type II
organisations’ respondents think that organisations’ collaborative capacity has increased
because of KMS. Overall, more than 86% respondents of all the organisations feel that KMS
helped their organisations in collaboration of physically separated teams or projects.
Co-efficient of variation reveals that there is more variability in the opinion of software
engineers of Type II organisations and more consistency in Type I and Type III
organisations’ respondents. Overall, WAS of three organisation groups is significant because
it is greater than 1. The chi-square test shows that the difference in the opinions of
organisation group respondents is significant at 1% LOS. The t-test shows significant
difference in organisation group I and II at 1% LOS.

Design of Experience Base Model for Software Process Improvement
241
Table 6.25 (a)
KM and Ease of collaborative work of projects/teams
(Percent)
Group /Sub Group
Not at All
Very Little
Cant Say
Some Extent
Large Extent
χ2 WAS Mean S.D. CV
Type Type I Type II Type III
8.33 3.33 6.67
16.67 6.67
65.00 23.33 78.33
26.67 56.67 8.33
106.58**
1.10 1.33 0.88
4.10 4.33 3.88
0.77 0.87 0.63
18.78 20.09 16.24
Age Below 25 25-35 36-45 46-55 Above 55
4.55 2.99 5.97 15.00 25.00
9.09 11.94 5.97
40.91 47.76 68.66 55.00 50.00
45.45 37.31 19.40 30.00 25.00
37.63**
1.27 1.19 1.01 1.00 0.75
4.27 4.19 4.01 4.00 3.75
0.81 0.76 0.70 0.95 1.09
18.97 18.14 17.46 23.75 29.07
Experience Below 1 yr 1-3 yrs 3-5 yrs Above 5 yrs
2.22
10.53 7.69
4.44 20.00 10.53 5.13
44.44 46.67 31.58 71.79
48.89 33.33 47.37 15.38
61.64**
1.40 1.13 1.16 0.95
4.40 4.13 4.16 3.95
0.68 0.72 0.99 0.71
15.45 17.43 23.80 17.97
Qualification Ph. D. Graduate Post Grad. Professional
6.82 8.24 2.56
66.67 9.09 2.35 10.26
33.33 63.64 55.29 48.72
20.45 34.12 38.46
73.91**
0.33 0.98 1.15 1.23
3.33 3.98 4.15 4.23
0.47 0.75 0.82 0.73
14.11 18.84 19.76 17.26
Industry Average
6.11 7.78 55.56 30.56 1.11 4.11 0.79 19.22
* significant at 5% ** significant at 1%
Table 6.25 (b)
Significance of Difference of Proportions
Comparison p1 p2 t-values
1 Vs. 2
1 Vs. 3
2 Vs. 3
0.92
0.92
0.80
0.80
0.87
0.87
2.59 **
1.25
1.39
** significant at 1%

Design of Experience Base Model for Software Process Improvement
242
6.6.13 Encouragement to participate in teams with external experts
Organisation group-wise, in Type I organisations, 93.33% respondents agree that their
organisations encourage software engineers to participate in project teams with external
experts. 90% respondents in Type II organisations and 96.67% respondents of Type III
organisations also agree that their organisations allow them to participate and collaborate
with experts from outside their organisations. 75% respondents of more than 55 years of age
agree that their organisational support for external experts and projects is to a large extent.
Overall, majority of the respondents (93.33%) believe that their organisations encourage
them to participate in project teams with external experts.
Statistically, co-efficient of variation reveals that there is more variability in the opinion of
software engineers of Type I organisations and more consistency in Type II and Type III
organisations’ respondents. Overall, WAS among three organisation groups is greater than 1.
It means majority of the respondents are satisfied that the encouragement for participation in
projects with external experts is quite high. The chi-square test shows that the difference in
the opinions of organisation group respondents is significant at 1% LOS. The t-test shows
significant difference in organisation group II and III at 5% LOS.

Design of Experience Base Model for Software Process Improvement
243
Table 6.26 (a)
Encouragement to participate in teams with external experts
(Percent)
Group /Sub Group
Not at All
Very Little
Cant Say
Some Extent
Large Extent
χ2 WAS Mean S.D. CV
Type Type I Type II Type III
6.67
10.00 3.33
50.00 76.67 50.00
43.33 13.33 46.67
63.14**
1.30 1.03 1.43
4.30 4.03 4.43
0.78 0.48 0.56
18.14 11.91 12.64
Age Below 25 25-35 36-45 46-55 Above 55
9.09
1.49 5.00
9.09 8.96
54.55 74.63 50.75 45.00 25.00
27.27 16.42 47.76 50.00 75.00
67.55**
1.00 1.07 1.45 1.40 1.75
4.00 4.07 4.45 4.40 4.75
0.85 0.50 0.58 0.73 0.43
21.25 12.29 13.03 16.59 9.05
Experience Below 1 yr 1-3 yrs 3-5 yrs Above 5 yrs
4.44
2.56
17.78
64.44 86.67 68.42 41.03
13.33 13.33 31.58 56.41
107.59**
0.87 1.13 1.32 1.51
3.87 4.13 4.32 4.51
0.69 0.34 0.46 0.64
17.83 8.23 10.65 14.19
Qualification Ph. D. Graduate Post Grad. Professional
2.27 1.18 5.13
4.55 7.06
66.67 56.82 57.65 66.67
33.33 36.36 31.58 28.21
12.16**
1.33 1.27 1.25 1.18
4.33 4.27 4.25 4.18
0.47 0.65 0.63 0.67
10.85 15.22 14.82 16.03
Industry Average
2.22 4.44 58.89 34.44 1.26 4.26 0.64 15.02
** significant at 1%
Table 6.26 (b)
Significance of Difference of Proportions
Comparison p1 p2 t-values
1 Vs. 2
1 Vs. 3
2 Vs. 3
0.93
0.93
0.90
0.90
0.97
0.97
0.93
1.18
2.07 *
* significant at 5%

Design of Experience Base Model for Software Process Improvement
244
6.6.14 Transfer of knowledge from experienced software engineers to new or less-
experienced software engineers
Organisation group-wise, Type I Organisations’ 58.34% respondents are of the opinion that
experienced Software engineers are encouraged in their organisations to share their
knowledge and experience with less-experienced and/or new Software engineers. However,
28.33% respondents of the same class do not agree to this. Similarly, in Type II as well as in
Type III organisations, majority of the respondents claim that their organisations encourage
experienced employees to transfer their knowledge to new employees. Age-wise 77.27%
respondents of below 25 years of age and 59.70% respondents of 25 to 35 years of age agree
that the socialisation among organisational software engineers is encouraged. On the basis of
experience, 78.95% respondents of 3 to 5 years experience also feel the same. According to
qualifications, all the Ph.Ds state that to a large extent the experienced Software engineers in
their organisations are encouraged to transfer their knowledge to new or less-experienced
Software engineers. Majority of graduate, post-graduate and professional respondents also
agree to the statement. Only a few respondents do not feel that their organisations encourage
their Software engineers to share their knowledge and experience among its members.
Overall, majority of the respondents (68.34%) feel that organisations encourage their
experienced employees to share and transfer their knowledge and experience to less-
experienced employees.
Statistically, co-efficient of variation reveals that there is more variability in the opinion of
software engineers of Type I organisations’ respondents and more consistency in Type II and
Type III organisations’ respondents. Overall, WAS of three organisation groups is
insignificant because it is less than 1. It means that there is diversion in the opinion of
organisation software engineers. The chi-square test shows that the difference in the opinions
of organisation group respondents is significant at 1% LOS. The t-test shows significant
difference in organisation group I and III, and in organisation group II and III at 1% and 5%
LOS respectively.

Design of Experience Base Model for Software Process Improvement
245
Table 6.27 (a)
Transfer of knowledge from experienced software engineers to new or less-experienced software
engineers
(Percent)
Group /Sub Group
Not at All
Very Little
Cant Say
Some Extent
Large Extent
χ2 WAS Mean S.D. CV
Type Type I Type II Type III
3.33 3.33
28.33 10.00 16.67
13.33 20.00
41.67 46.67 51.67
16.67 20.00 28.33
63.14**
0.47 0.70 0.85
3.47 3.70 3.85
1.07 1.00 1.11
30.84 27.03 28.83
Age Below 25 25-35 36-45 46-55 Above 55
5.97
9.09 20.90 14.93 30.00 25.00
13.64 13.43 5.97 15.00 25.00
50.00 43.28 47.76 50.00 50.00
27.27 16.42 31.34 5.00
67.55**
0.95 0.43 0.96 0.30 0.25
3.95 3.43 3.96 3.30 3.25
0.88 1.16 0.98 0.95 0.93
22.28 33.82 24.75 28.79 25.54
Experience Below 1 yr 1-3 yrs 3-5 yrs Above 5 yrs
13.33
17.78 10.00 21.05 20.51
15.56 20.00
8.97
46.67 43.33 68.42 44.87
20.00 13.33 10.53 25.64
107.59**
0.69 0.33 0.68 0.76
3.69 3.33 3.68 3.76
0.98 1.22 0.92 1.05
26.56 36.64 25.00 27.93
Qualification Ph. D. Graduate Post Grad. Professional
10.26
20.45 16.47 25.64
4.55 14.12 15.38
61.36 45.88 35.90
100.0 13.64 23.53 12.82
12.16
2.00 0.68 0.76 0.15
2.00 3.68 3.76 3.15
0.00 0.95 0.99 1.23
0.00 25.82 26.33 39.05
Industry Average
2.22 18.33 11.11 46.67 21.67 0.67 3.67 1.07 29.16
* significant at 5% ** significant at 1%
Table 6.27 (b)
Significance of Difference of Proportions
Comparison p1 p2 t-values
1 Vs. 2
1 Vs. 3
2 Vs. 3
0.58
0.58
0.67
0.67
0.80
0.80
1.33
3.63 **
2.34 *
* significant at 5% ** significant at 1%

Design of Experience Base Model for Software Process Improvement
246
6.6.15 Transfer of best practices
It is commonly said that knowledge sharing is best promoted by the provision of processes
for transferring best practices that include documentation of all the aspects of the projects as
well as lessons learned. Software engineers were asked to give their opinion on this.
Organisation group-wise, 63.33% of Type I organisations’ respondents and 70% respondents
of Type III organisations agree that their organisations have well defined processes for
transfer of best practices and lessons learnt. On the other hand, in Type II organisations, one-
third respondents disagree to this. Age-wise, all the respondents of more than 55 years of age
agreed and majority of respondents of below 25 years and 36 to 45 years age agreed that their
organisations have systems and processes in place that allow the Software engineers to share
best practices. 37.31% respondents of 25 to 35 years disagree to the statement. On the basis
of experience, 47.37% respondents of 3 to 5 years and 74.36% respondents of above 5 years
experience also testify the presence of processes for transfer of best practices in their work
environment. Qualification-wise, majority of graduate and post-graduate respondents agree
and 38.46% professional respondents disagree. Overall, 56.67% respondents feel that
documentation and lessons learnt are shared and transferred among the members of their
organisations.
Statistically, co-efficient of variation reveals that there is more variability in the opinion of
software engineers of Type II organisations and more consistency in Type I and Type III
organisations’ respondents. Overall, WAS of three organisation groups is insignificant
because it is less than 1. The chi-square test shows that the difference in the opinions of
organisation group respondents is significant at 1% LOS. The t-test shows significant
difference in organisation group I and II, and in organisation group II and III at 1% LOS.
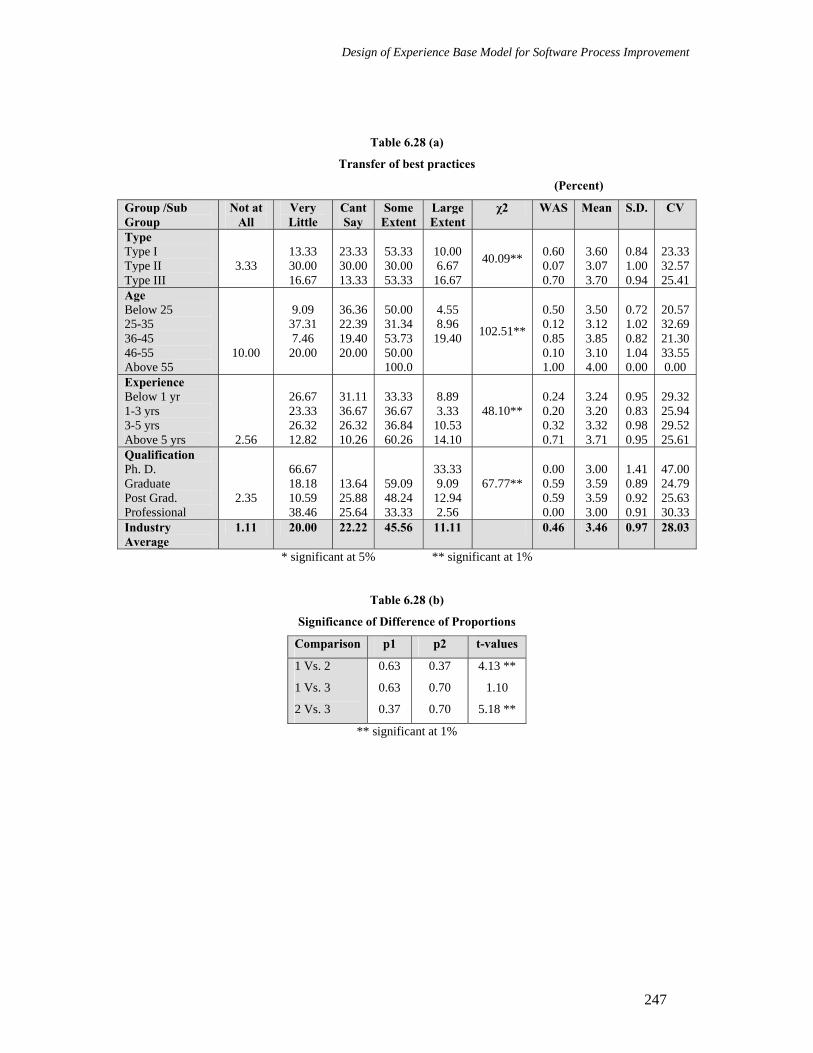
Design of Experience Base Model for Software Process Improvement
247
Table 6.28 (a)
Transfer of best practices
(Percent)
Group /Sub Group
Not at All
Very Little
Cant Say
Some Extent
Large Extent
χ2 WAS Mean S.D. CV
Type Type I Type II Type III
3.33
13.33 30.00 16.67
23.33 30.00 13.33
53.33 30.00 53.33
10.00 6.67 16.67
40.09**
0.60 0.07 0.70
3.60 3.07 3.70
0.84 1.00 0.94
23.33 32.57 25.41
Age Below 25 25-35 36-45 46-55 Above 55
10.00
9.09 37.31 7.46 20.00
36.36 22.39 19.40 20.00
50.00 31.34 53.73 50.00 100.0
4.55 8.96 19.40 102.51**
0.50 0.12 0.85 0.10 1.00
3.50 3.12 3.85 3.10 4.00
0.72 1.02 0.82 1.04 0.00
20.57 32.69 21.30 33.55 0.00
Experience Below 1 yr 1-3 yrs 3-5 yrs Above 5 yrs
2.56
26.67 23.33 26.32 12.82
31.11 36.67 26.32 10.26
33.33 36.67 36.84 60.26
8.89 3.33 10.53 14.10
48.10**
0.24 0.20 0.32 0.71
3.24 3.20 3.32 3.71
0.95 0.83 0.98 0.95
29.32 25.94 29.52 25.61
Qualification Ph. D. Graduate Post Grad. Professional
2.35
66.67 18.18 10.59 38.46
13.64 25.88 25.64
59.09 48.24 33.33
33.33 9.09 12.94 2.56
67.77**
0.00 0.59 0.59 0.00
3.00 3.59 3.59 3.00
1.41 0.89 0.92 0.91
47.00 24.79 25.63 30.33
Industry Average
1.11 20.00 22.22 45.56 11.11 0.46 3.46 0.97 28.03
* significant at 5% ** significant at 1%
Table 6.28 (b)
Significance of Difference of Proportions
Comparison p1 p2 t-values
1 Vs. 2
1 Vs. 3
2 Vs. 3
0.63
0.63
0.37
0.37
0.70
0.70
4.13 **
1.10
5.18 **
** significant at 1%

Design of Experience Base Model for Software Process Improvement
248
6.7 KM Technologies
The software engineers were asked about the technology support tools existing in their
organisations for knowledge management. The respondents were asked to rate the various
KM technologies in terms of their frequency of use as well as their effectiveness in helping
them manage their knowledge. As it is clear from Table 6.29, the majority of the respondents
(83%) reported the Internet Browsers and Search Engines as the most frequently used KM
tools in their organisations, followed by Email and Groupware systems (76.5%). Corporate
Intranet/ Extranet and Communities of Practice are the other frequently used IT tools for
managing the knowledge by employees in software organisations. 74% of the respondents
stated Multimedia Repositories to be the least frequently used tool, followed by
Teleconferencing/ Videoconferencing reported by 69% respondents to be either used with
very low frequency or not used at all by them in managing their knowledge. Also half the
respondents reported that they never use Agents/ Filters for KM in their organisations.
External Server Services also find very low usage (8.7%). Workflow Management Systems
and Data mining and knowledge discovery tools are other technology components which find
deplorable use by software engineers in their routine knowledge management activity.
Majority of the respondents (78.8%) feel that Best Practices Repositories are the most
effective technology support tool for knowledge management (cf. Table 6.30). E-mail and
Groupware Systems are the next technology perceived to be very effective in managing
knowledge by 77.8% of the respondents. 74% of the software engineers surveyed stated
Communities of Practice to be another effective KM technology support tool. On the other
hand, majority of the respondents (79.4%) feel that External Server Services are less effective
in managing knowledge in organisations, followed by WWW Server/ Communication
Software which is perceived to be less effective KM tool by 67.7% respondents.

Design of Experience Base Model for Software Process Improvement
249
Table 6.29
Frequency Distribution of Technology Support Tools Used for KM Frequency (%age)
Technology Support Tools for KM Very High Fairly High Moderate Fairly Low Very Low Not At All Can’t Say
Corporate Intranet/ Extranet 97 (31.3) 90 (29.0) 47 (15.2) 23 (7.4) 10 (3.2) 28 (9.0) 15 (4.8)
Browsers/ Search engines 190 (61.3) 67 (21.6) 20 (6.5) 15 (4.8) 3 (1.0) 0 15 (4.8)
Search and retrieval tools 93 (30.0) 3 (1.0) 75 (24.2) 15 (4.8) 2 (0.7) 115 (37.1) 7 (2.3)
Agents/ Filters 53 (17.1) 20 (6.5) 50 (16.1) 10 (3.2) 10 (3.2) 155 (50.0) 12 (3.9)
E-mail and groupware systems 186 (60.0) 51 (16.5) 10 (3.2) 30 (9.7) 3 (1.0) 0 30 (9.7)
WWW server/ Communication software 20 (6.5) 47 (15.2) 27 (8.7) 29 (9.4) 47 (15.2) 128 (41.3) 12 (3.9)
Data repositories 112 (36.1) 8 (2.6) 77 (24.8) 20 (6.5) 2 (0.7) 85 (27.4) 6 (1.9)
Multimedia repositories 13 (4.2) 10 (3.2) 23 (7.4) 8 (2.6) 215 (69.4) 15 (4.8) 26 (8.4)
Best practices repositories 30 (9.7) 25 (8.1) 38 (12.3) 30 (9.7) 165 (53.2) 12 (3.9) 10 (3.2)
Data mining and knowledge discovery tools 32 (10.3) 67 (21.6) 47 (15.2) 27 (8.7) 32 (10.3) 95 (30.6) 10 (3.2)
External server services 17 (5.5) 10 (3.2) 47 (15.2) 27 (8.7) 62 (20.0) 132 (42.6) 15 (4.8)
Document management systems 8 (2.6) 110 (35.5) 62 (20.0) 20 (6.5) 8 (2.6) 100 (32.3) 2 (0.7)
Workflow management systems 8 (2.6) 7 (2.3) 12 (3.9) 128 (41.3) 82 (26.5) 67 (21.6) 6 (1.9)
Teleconferencing/ Videoconferencing 15 (4.8) 15 (4.8) 43 (13.9) 12 (3.9) 9 (2.9) 205 (66.1) 11 (3.5)
Communities of Practice (CoP) 105 (33.9) 60 (19.4) 56 (18.1) 15 (4.8) 15 (4.8) 52 (16.8) 7 (2.3)

Design of Experience Base Model for Software Process Improvement
250
Table 6.30
Frequency Distribution of Effectiveness of KM Technology Tools
Frequency (%age) Technology Support Tools for KM Highly
Effective
Fairly
Effective
Moderately
Effective
Less
Effective
Very Less
Effective
Not At
All
Effective
Can’t
Say
Corporate Intranet/ Extranet 136 (43.9) 84 (27.1) 34 (11.0) 29 (9.4) 27 (8.7) 0 0
Browsers/ Search engines 162 (52.3) 60 (19.4) 35 (11.3) 5 (1.6) 15 (4.8) 0 33 (10.6)
Search and retrieval tools 100 (32.3) 13 (4.2) 52 (16.8) 11 (3.5) 4 (1.3) 113 (36.5) 17 (5.5)
Agents/ Filters 46 (14.8) 38 (12.3) 41 (13.2) 61 (19.7) 16 (5.2) 102 (32.9) 6 (1.9)
E-mail and groupware systems 201 (64.8) 40 (13.0) 12 (3.9) 8 (2.6) 8 (2.6) 30 (9.7) 11 (3.5)
WWW server/ Communication software 32 (10.3) 40 (12.9) 16 (5.2) 45 (14.5) 65 (20.9) 100 (32.3) 12 (3.9)
Data repositories 140 (45.2) 86 (27.7) 27 (8.7) 30 (9.7) 6 (1.9) 15 (4.8) 6 (1.9)
Multimedia repositories 31 (10.0) 74 (23.9) 109 (35.2) 58 (18.7) 18 (5.8) 10 (3.2) 10 (3.2)
Best practices repositories 131 (42.3) 113 (36.5) 46 (14.8) 16 (5.2) 4 (1.3) 0 0
Data mining and knowledge discovery
tools
6 (1.9) 99 (31.9) 67 (21.6) 36 (11.6) 76 (24.5) 16 (5.2) 10 (3.2)
External server services 11 (3.5) 15 (4.8) 20 (6.5) 74 (23.9) 81 (26.1) 91 (29.4) 18 (5.8)
Document management systems 146 (47.1) 14 (4.5) 48 (15.5) 17 (5.5) 30 (9.7) 38 (12.3) 17 (5.5)
Workflow management systems 104 (33.5) 16 (5.2) 62 (20.0) 18 (5.8) 15 (4.8) 60 (19.4) 35 (11.3)
Teleconferencing/ Videoconferencing 23 (7.4) 69 (22.3) 90 (29.0) 68 (21.9) 39 (12.6) 6 (1.9) 15 (4.8)
Communities of Practice (CoP) 119 (38.4) 110 (35.5) 33 (10.6) 23 (7.4) 17 (5.5) 0 8 (2.6)