chapter 6 research results: exploratory analysis...
TRANSCRIPT

169
CHAPTER 6
RESEARCH RESULTS: EXPLORATORY ANALYSIS
6.1 INTRODUCTION
This chapter discusses the preliminary data analysis using Statistical Package for the Social
Sciences (SPSS 16.0). The rest of the chapter is organised as follows. Section 6.2 discusses
the instrument data validation process. Section 6.3 reports the respondent characteristics.
Section 6.4 presents the exploratory measurement assessments which included exploratory
factor analyses, scale reliabilities and corrected item-total correlations. Section 6.5
examines the test of assumptions for multivariate analysis including, normality, linearity,
multicollinearity and homoscedasticity. Section 6.6 examines the descriptive statistics
which comprised independent sample t-tests and one-way ANOVA. Section 6.7 describes
the justification for using SEM in this study. The chapter ends with Section 6.8 – summary
and conclusion.
6.2 INSTRUMENT DATA VALIDATION PROCESS
Before testing the hypotheses, the utilised instruments should be subject to a scale
purification process which includes examinations of Cronbach‘s Coefficient Alpha and
item-to-total correlations (Churchill, 1979). Furthermore, the purification of scales should
be conducted based on an evaluation of exploratory factor analysis (EFA) results, the
assessment of the Cronbach‘s Coefficient Alpha and item-to-total correlations (Lu et al.,
2007). Table 6.1 shows instrument development and validation process.

170
Table 6.1: Instrument Development and Validation Process
Chapter Analysis Description
Chapter 5 Instrument
Development
Items generations – scale from previous studies
Judge the items for content validity and Pilot test
Chapter 6
Exploratory
Measurement
Assessment
Descriptive statistics:
Corrected item-total correlation >0.5
Exploratory factor analyses (EFA)
Reliability =Cronbach's alpha >0.6
Chapter 7
Measurement
Model Validity
Assessment
Convergent validity
AVE 0.5 or greater
t-value for each loading, significance
Squared correlation
Fit Indices and Unidimensionality assessment:
Normed χ² ≤3
GFI, CFI, TLI >0.9
RMSEA < 0.08
Discriminant validity
AVE vs. squared correlation between factors
Construct reliability
Composite reliability > 0.6
AVE >0.5
Chapter 7 Specify Structural
Model
Convert measurement model to structural model
Chapter 7 Structural Model
Validity assessment
Assess χ² goodness-of-fit (GOF) and significance,
direction, and size of structural parameter estimates
Sources: Adapted from Lu et al. (2007) and Hair, Black, Babin, Anderson and Tatham,
(2006)

171
Item-to-total correlations refer to the correlations of indicators with their variables (factors)
while Cronbach‘s Coefficient Alpha is a measure that determines the degree to which an
internal consistency exists among the indicators within the same variable or factor (Lu et
al., 2007; Malhotra, 2004). Exploratory factor analysis (EFA) is a type of factor analysis
that is utilised to identify the number of latent variables that underlies an entire set of items
(Coakes and Steed, 2003). This analytic method needs to be considered exploratory
because the links between the indicators and variables (factors) are uncertain. Since in this
study, most of the items have been developed from prior studies, it is very important to
make sure that they are properly connected to their basic factors (variables). To achieve
this purpose, the utilisation of exploratory factor analysis is deemed necessary in this
study. Finally, a measurement model (i.e., confirmatory factor analysis) is conducted prior
to hypotheses testing in chapter 7.
6.3 RESPONDENT CHARACTERISTICS
In this section, a general profile of the respondents is discussed. Table 6.2 presents the
demographic characteristics of respondents. The respondents of the study consisted of 79%
male and 21% female. From the 658 completed questionnaires, a high proportion (38%) of
the respondents was in the age range of 30 to 39. Most of the respondents were quite well
educated (over 70 percent), and the average years of managerial experience were high with
nearly three-fourth of respondents having over five years of experience. Table 6.2 shows
the profile of the respondents.

172
Table 6.2: Profile of the Respondents
Demographic
Variables
Description Frequency Percentage
Gender Male 521 79.2
Female 137 20.8
Respondent age 20-29 years 161 24.5
30-39 250 38
40-49 172 26.1
50-59 65 9.9
60-69 10 1.5
Educational
background
High school or lower 5 0.8
Diploma 49 7.4
Technical college ―College Diploma‖ 136 20.7
Bachelor 410 62.3
Master 51 7.8
PhD 7 1.1
Experience less than 5 years 149 22.6
5 -10 years 185 28.1
11-15 years 161 24.5
16-20 years 73 11.1
More than 20 90 13.7

173
Table 6.2 (continued)
Demographic
Variables
Description Frequency Percentage
Firm age 2 years 28 4.3
3-5 years 128 19.5
6-10 years 174 26.4
11-15 years 105 16
16-20 years 60 9.1
More than 20 163 24.8
Firm size Less than 20 employees 148 22.5
20-30 employees 174 26.4
31-50 employees 131 19.9
51-100 employees 77 11.7
More than 100 employees 128 19.5
Type of
manufacturing
Food and Beverages 105 16
Textiles except clothing 45 6.8
Garment 85 12.9
Leather, Bag, Suitcase & Shoe 75 11.4
Wood & Wood Products, Furniture 50 7.6
Paper & Paper Products 40 6.1
Chemical products 75 11.4
Rubber & Plastic 35 5.3
Machinery & Equipment 60 9.1
Radio, TV & Communication Tools 39 5.9
Optical and Medical Instrument &
Watch
25 3.8
Motor Vehicles 24 3.6

174
Most of the respondents (16%) are from the Food and Beverages manufacturing sector.
Almost 75 percent of the SMEs in the survey employed more than 20 employees and
approximately 50 percent of these firms have been in business for the last 11 – 20 years.
6.4 EXPLORATORY MEASUREMENT ASSESSMENTS
Before testing the hypothesised model, there is a need to verify on the validity and
reliability of the measures. For example, reliability and validity of the measures are the
tools utilised to appraise the characteristics of a sound measurement and these tools
comprised a measurement of accuracy and applicability (Lee, 2001). Indeed, the main
concern for conducting reliability and validity of the measures is to reduce measurement
errors which make the most of the model testing in the hypotheses (Churchill and
Iacobucci, 2002). The measurements in this study (i.e. firm performance, outsourcing
intensity, asset specificity, environmental uncertainty, behavioral uncertainty, frequency,
trust, technical competence and degree of competition) were measured with multi-item
scales, hence there is necessary to check the degree to which a specific measurement
represents a certain variable.
The exploratory measurement assessment includes exploratory factor analyses, item
analysis, corrected item-total correlations and reliability. Content validity of the survey
instrument (questionnaire survey) was produced via the adoption of validated instruments
by other scholars in the literature and the pretest using outsourcing of accounting practices
in the accounting field (Lee, 2001). Since each factor (variable) was measured by the multi
item constructs, item analysis and factor analysis were performed to validate the scales
(Lee, 2001). Internal consistency (Cronbach's alpha) was calculated in order to assess the

175
reliability of all variables (Lee, 2001). Convergent validity is the degree to which multiple
attempts to measure the same concept in agreement by item-to-total correlation (e.g., the
correlation of each item to the sum of the remaining items) (Lee, 2001). Discriminant
validity is the degree to which measures of different concepts are distinct (Lee, 2001). To
test discriminant validity, a principal component factor analysis with varimax rotation is
conducted for each domain of the proposed model (Lee, 2001). Each of the measurement
assessment result was presented in the following sub-sections.
6.4.1 Exploratory Factor Analysis
Exploratory factor analysis (EFA) is a procedure for data examination, and it determines
the structure of factors to be investigated (Abdul-Halim and Che-Ha, 2009). It is utilised to
determine convergent validity and dimensionality of the relationship between items and
variables (Abdul-Halim and Che-Ha, 2009). Therefore, exploratory factor analysis is
performed on performance, outsourcing intensity, asset specificity, environmental and
behavioral uncertainty, frequency, trust in accountant, and degree of competition in order
to determine whether all the scales applied in this study have construct validity (Abdul-
Halim and Che-Ha, 2009).
To justify the application of Exploratory Factor Analysis in this study, according to Hair et
al. (2006) the measure of sampling adequacy, a statistical test to quantify the extent of
inter-correlations among the variables was utilised. Hence, the Bartlett‘s Test of Sphericity
(Bartlett‘s Test) and Kaiser-Mayer-Olkin (KMO) indicate the measure of sampling
adequacy (Hair et al., 2006). The Bartlett‘s Test of Sphericity (Bartlett‘s Test) is significant
at p<0.05 for the exploratory factor analysis to be considered appropriate and KMO is

176
lower than 0.5 is not suitable, and exploratory factor analysis should not be performed
(Pallant, 2007). Consistent with Pallant (2007), KMO with a value between 0.5 and 0.7 is
mediocre, 0.7 and 0.8 is good, 0.8 and 0.9 is great and above 0.9 is excellent.
Factor analysis under the extraction method of principal component analysis with the
rotation method of varimax with Kaiser Normalization is employed to examine the scales
of performance, outsourcing intensity, asset specificity, environmental uncertainty,
behavioral uncertainty, frequency, trust in accountant and degree of competition. Varimax
rotation is favored since it minimises the correlation across factors and maximises within
the factors (Nunnally, 1978). Factor loading specifies the strength of the relationship
between the item and the latent variable and thus, is utilised to determine the convergent
and discriminant validity of the scales (Hair et al., 2006). The dimensions of the scale were
examined by factor analysing the items using the principal components analysis with
Varimax rotation. Minimum eigenvalues of 1.0 helped determine the number of factors or
dimensions for each scale (Hair et al., 2006). Factor loadings greater than 0.50 are
generally needed for practical significance (Fen and Sabaruddin, 2008; Hair et al., 2006),
the items for a factor are retained only when the absolute size of their factor loading is
above 0.50 (Fen and Sabaruddin, 2008). Table 6.3 shows the results factor analysis of the
variables.

177
Table 6.3: Factor Loading For Multiple Items
Items Factor
loading
Firm performance
1. Profitability (P1)
2. Growth in Sales(p2)
3. Return on Assets(p3)
4. Cash Flow (p4)
5. Lifestyle (p5)
6. Independence(p6)
7. Job Security (p7)
.953
.948
.945
.925
.906
.909
.908
Outsourcing intensity
8. Bookkeeping work (ou1)
9. Preparation of financial statements (ou2)
10. Payroll accounting(ou3)
11. Budgeting / forecasting (ou4)
12. Customer profitability analysis (ou5)
13. Product costing(ou6)
14. Financial planning (ou7)
15. Financial management services (ou8)
16. Design/review internal control systems (ou9)
.948
.920
.921
.903
.914
.879
.901
.922
.938
Asset specificity
17. To perform(process) the routine accounting functions (e.g.
bookkeeping work and preparation of financial statements ) the
accountant needs to obtain firm specific information(as1)
18. To perform the non-routine accounting functions (i.e. product
costing and financial planning) the accountant needs to obtain firm-
specific information(as2)
19. The way we perform the accounting functions is unique to our
firm(as3)
20. It would be costly in terms of time and resources to switch to an
external accountant (accounting firm or professional accountant) at
the end of the financial year (as4)
21. The accounting software is custom-tailored to our firm(as5)
.964
.967
.964
.950
.964

178
Table 6.3 (continued)
Items Factor
loading
Environmental uncertainty
22. During the previous year, there was a lot of variation in the
workload related to routine accounting functions (e.g. bookkeeping
works related unstable number of purchase and sales invoices
because of seasonal trends)(env1)
23. During the previous year, there was a lot of variation in the
workload related to non-routine accounting functions (i.e. financial
planning as a result of changes in tax law )(env2)
24. During the previous year, there were relevant changes in the
business organization of the firm (e.g., acquisitions, changes in
corporate structure)(en3)
.888
.882
.869
Behavioral uncertainty
25. Bookkeeping work (be1)
26. Preparation of financial statements (be2)
27. Payroll accounting(be3)
28. Budgeting / forecasting (b4)
29. Customer profitability analysis (be5)
30. Product costing (be6)
31. Financial planning (be7)
32. Financial management services (be8)
33. Design/review internal control systems (be9)
.876
.911
.852
.920
.906
.883
.904
.904
.881
Frequency
34. Bookkeeping work (fe1)
35. Preparation of financial statements (fe2)
36. Payroll accounting (fe3)
37. Budgeting / forecasting (fe4)
38. Customer profitability analysis (fe5)
39. Product costing (fe6)
40. Financial planning (fe7)
41. Financial management services (fe8)
42. Design/review internal control systems (fe9)
43. Total amount of invoices (sales and purchases) that the accountant
has processed during the previous year(fe10)
.933
.944
.935
.934
.948
.936
.927
.913
.925
.932

179
Table 6.3 (continued)
Items Factor
loading
Trust in Accountant
44. The firm owner/manager has confidence that the professional
accountant will treat fairly, this means to correctly charge for the
performed duties(tru1)
45. The firm owner/manager has confidence that the professional
accountant will inform correctly(tru2)
46. The firm owner/manager has confidence that the professional
accountant will accurately perform the duties(tru3)
47. The relationship between the firm owner-manager and the
professional accountant is based on trust (tru4)
.912
.908
.916
.907
Technical competence
48. Specialized industry wide knowledge (tec1)
49. Expertise in internal control (tec2)
50. Experience and qualifications (tec3)
51. Depth of understanding of your firm (tec4)
52. Expertise in computerized information systems (CIS) accounting
and auditing (tec5)
53. Expertise in risk management (tec6)
.907
.924
.913
.894
.855
.792
Degree of competition
54. Product characteristics (co1)
55. Promotional strategies among rivals (co2)
56. Access to distribution channels (co3)
57. Service strategies to customers (co4)
58. Product variety (co5)
.788
.791
.854
.803
.759
A principal component factor analysis was utilised to determine each variable as seen in
Table 6.3. The Bartlett's test of sphericity was significant p = 0.000) for all variables, and
the KMO measure of sampling adequacy was adequate (0.921) for firm performance.
Table 6.3 shows seven items of firm performance load significantly into one factor higher

180
than the value of 0.5, explaining 86 percent of the items' variance with eigenvalues of 6.21.
Minimum eigenvalues of 1.0 helped to ascertain the number of factors, and a solution of
about 60% (variance) as satisfactory in social sciences research (Hair et al., 2006). Factor
analysis of the nine differenced outsourcing items shows that all items loaded significantly
on a single, one-dimensional factor that explains 84 percent of the items variance with
eigenvalues 7.55 (KMO 0.972). Factor analysis for asset specificity also found with KMO
value of 0.921 that all five items load into a single, one-dimensional factor higher than the
value of 0.5, explaining 92% of the total variance and eigenvalues 4.62. The KMO value of
0.732 indicated that factor analysis was appropriate to use for analysing the environmental
uncertainty factors. Accordingly, this study found that the three differenced environmental
uncertainty items load significantly on a single factor that explains 77 percent of the items'
variance with an eigenvalue of 2.323.
KMO value of 0.90 indicated that factor analysis was appropriate to utilise for analysing
the behavioral uncertainty items. This study demonstrated that differenced behavioral
uncertainty items load significantly on a single factor that explains 80 percent of the items'
variance with an eigenvalue of 7.18. The KMO measure of sampling adequacy was
adequate (0.962) for ten items of frequency variable. The principal components analysis
with Varimax rotation extracted only one factor with eigenvalues of 8.70 that explains 87
percent of items variance and is one-dimensional. Principal components factor analysis
was performed for trust in accountant (KMO value was 0.865). All the four items loaded
into a single variable with one factor were having loading higher than the value of 0.5,
explaining 83% of the total variance with eigenvalues of 3.321.
A factor analysis was also conducted to determine the dimensionality of technical
competence. Therefore, the KMO measure of sampling adequacy was adequate (0.915) for

181
technical competence variable, and all six items of this variable loaded on one factor
higher than the value of 0.5 with eigenvalues of 4.66, accounting for 77% of the total
variance. Finally, exploratory factor analysis shows that five items load into a single
variable as degree of competition that explains 64 percent of the items' variance with
eigenvalues of 3.19, explaining 64% of the total variance ( KMO= 0.849).
6.4.2 Reliability
Internal reliability of a measurement is utilised in multi-item scales, and it turns to its
consistency (Hair et al., 2006). Internal reliability refers to whether those items are
internally consistent or whether the items that constitute the scale are measuring a single
concept (Hair et al., 2006; Lee, 2001). Estimates of reliability based on the average
correlation among items within test, concern internal consistency (Lee, 2001). The internal
consistency will be high if the correlation offers a high result (Lee, 2001). Cronbach‘s
Coefficient Alpha is the most popular indicator of internal consistency was utilised in this
study to evaluate the reliabilities of measurement scales adopted (Hair et al, 2006; Lee,
2001). Nunnally (1978) suggested that an acceptable level of coefficient alpha to retain an
item in a scale is at least 0.70 score. The reliability analysis and descriptive statistics for
for firm performance, outsourcing intensity, asset specificity, environmental uncertainty,
behavioral uncertainty, frequency, trust in accountant, technical competence and degree of
competition are presented in Table 6.4.

182
Table 6.4: Mean, Standard Deviation, Corrected Item-To-Total Correlation (CITC)
and Cronbach’s Alpha
Items Mean SD CITC Cronbach‘s
alpha
Firm performance
P1
P2
P3
P4
P5
P6
P7
4.20
4.19
4.12
4.01
3.84
3.87
3.93
1.80
1.74
1.79
1.78
1.74
1.75
1.75
.934
.929
.924
.897
.872
.875
.874
.973
Outsourcing intensity
Ou1
Ou2
Ou3
Ou4
Ou5
Ou6
Ou7
Ou8
Ou9
4.49
4.40
4.41
4.38
4.33
4.37
4.37
4.45
4.46
1.791
1.778
1.824
1.833
1.894
1.902
1.813
1.787
1.794
.932
.897
.899
.877
.890
.848
.874
.900
.920
.976
Asset specificity
As1
As2
As3
As4
As5
3.34
3.38
3.40
3.28
3.30
1.693
1.696
1.717
1.611
1.675
.944
.948
.944
.921
.944
.980

183
Table 6.4 (continued)
Items Mean SD CITC Cronbach‘s
alpha
Environmental uncertainty
Env1
Env2
Env3
3.93
3.56
3.61
2.055
1.970
2.107
.740
.729
.708
.854
Behavioural uncertainty
Be1
Be2
Be3
Be4
Be5
Be6
Be7
Be8
Be9
4.05
4.60
4.18
4.65
4.49
4.42
4.49
4.33
4.53
1.927
1.945
1.809
2.044
1.945
1.812
1.962
1.854
1.955
.841
.886
.813
.897
.879
.852
.877
.877
.848
.968
Frequency
Fe1
Fe2
Fe3
Fe4
Fe5
Fe6
Fe7
Fe8
Fe9
Fe10
2.92
2.74
2.75
2.78
2.79
2.82
2.90
2.81
2.92
2.82
1.830
1.837
1.855
1.825
1.888
1.813
1.868
1.899
1.817
1.864
.917
.930
.919
.918
.935
.921
.910
.892
.908
.916
.983

184
Table 6.4 (continued)
Items Mean SD CITC Cronbach‘s
alpha
Trust in accountant
Tru1
Tru2
Tru3
Tru4
4.60
4.51
4.73
4.96
2.109
2.064
2.095
2.219
.841
.835
.848
.834
.932
Technical competence
Tec1
Tec2
Tec3
Tec4
Tec5
Tec6
5.056
5.102
5.190
5.108
5.103
4.444
1.9401
1.8857
1.8926
1.8462
1.9267
2.1069
.860
.882
.865
.840
.789
.714
.941
Degree of competition
Co1
Co2
Co3
Co4
Co5
4.81
4.60
4.64
4.94
4.67
1.898
1.833
1.776
1.725
1.923
.662
.659
.747
.677
.624
.857
Item-to-total Correlation (CITC) will be acceptable in above 0.50 score (Lu et al., 2007).
Hence, this study found acceptable item-to-total correlation scores which range from 0.624
to 0.948. Consequently, convergent validity was obtained by high tem-to-total correlation
(Lee, 2001). Furthermore, based on satisfactory standard (α≥0.70) suggested by Nunnally
(1978), the present study found a very high internal consistency reliability (alpha range =

185
0.854 to 0.983) for the all variables. Among the main variables, frequency (α = 0.983)
scored the highest Cronbach‘s alpha value and the environmental uncertainty lowest
reliability of the (α = 0.854). The Cronbach‘s alpha coefficient for the environmental
uncertainty and frequency measures was higher than the study of Widener and Selto
(1999), but Cronbach‘s alpha coefficient was same to their research regarding asset
specificity. For example, Widener and Selto (1999) achieved a Cronbach‘s alpha
coefficient α = 0.98 for asset specificity. In addition, the Cronbach‘s alpha for the
behavioral uncertainty, trust measures was higher than the prior studies (Everaert et al.,
2010) which obtained an internal reliability of 0.82 for behavioral uncertainty and 0.89 for
trust in accountant. Besides, this study also found a higher Cronbach‘s alpha for technical
competence, degree of competition and performance than prior studies (see, Carey et al.,
2006; Lamminmaki, 2008; Espino-Rodríguez et al., 2008).
6.5 TESTING THE ASSUMPTIONS OF MULTIVARIATE ANALYSIS
The test of assumptions should be done because the violations of the assumptions affect
consequent use of multivariate statistical methods (Hair et al., 2006). Therefore, Hair et al.,
(2006) suggested that several assumptions regarding the utilisation of multivariate
statistical tools, namely normality, homoscedasticity, linearity, and multicollinearity
should be applied before performing any multivariate analysis.
6.5.1 Test of Normality
Hair et al. (2006) noted that normality relates to the shape of the data distribution for an
individual metric variable and its relationship to the normal distribution. Assessment of the
variables‘ levels of skewness and kurtosis is one of the method will determine Normality

186
(Hair et al., 2006). In fact, Skewness provides an indication of the symmetry of the
distribution (Hair et al., 2006). Kurtosis turns to the peakedness or flatness of the
distribution relative to the normal distribution (Hair et al., 2006). For determining
skewness and kurtosis values, if the calculated z value for skewness and kurtosis goes
beyond the critical values of ±2.58 at 0.01 significance level or ±1.96 at 0.05 significance
level, the distribution of data is considered nonnormal (Hair et al., 2006). The result of the
analysis shows that none of the variables falls outside the ± 2.58 range of skewness and
kurtosis in this study. Thus, the data for this study is normal in relation to Skewness and
kurtosis (Hair et al., 2006). Table 6.5 summarises the skewness and kurtosis for the study‘s
variables.
Table 6.5: Skewness and Kurtosis of the Variables
Variables Skewness Kurtosis
Asset specificity -.322 -.850
Environmental uncertainty .060 -.826
Behavioral uncertainty -.458 -.773
Frequency .572 -1.027
Trust in accountant -.855 -.450
Technical competence -.925 .380
Degree of competition -.380 -.457
Outsourcing intensity -.229 -.749
Firm performance -.110 .826
Hair et al. (2006) also suggest that histogram is another method to use for comparing the
observed data values with a distribution approximating the normal distribution. It is argued
187
that the histogram of the research variables supports the expectation for the normal shape
distribution of data. Appendix 2 shows all histograms generated for study variables.
6.5.2 Test of Homoscedasticity
Hair et al. (2006) indicated that Homoscedasticity relates to the assumptions that
dependent variable explaining equal levels of variance across the range of independent
variables. Hair et al. (2006) argue the test of homoscedasticity is required because the
variance of the dependent variable being explained in the dependence relationship could
not be focus in simply a limited range of the independent values. Consistent with Hair et
al. (2006), this study tested the homoscedasticity for metric variables using scatterplot.
Scatter plots of standardised residual was conducted for all the variables and the outcomes
from the data were shown in Appendix 3. In effect, the scatterplot showed that the pattern
of data points does not contain any exact patterns and thus had not violated the
assumptions (e.g., no discernible patterns of residuals were indicated).
6.5.3 Test of Linearity
According to Hair et al. (2006), this study performed series of simple linear regression
analysis and the residuals using Normal Probability P-P Plot to examine linearity. The
results for linearity assumptions are shown in Appendix 4. It was indicated that the points
to be approximately a straight line surrounding the diagonal axis so as not to infringe the
assumptions on the randomness of the residuals.
6.5.4 Test of Multicollinearity
Multicollinearity occurs when two or more of the independent variables are highly
correlated that certain mathematical operations are impossible (Hair et al. 2006; Cooper

188
and Schindler, 2003). The correlation between independent variables was such that
multicollinearity is not a concern because multicollinearity will be created while results of
the correlation coefficients are above 0.80 and to be considered ―very high‖ (Burns and
Bush, 2000). However, there are two general procedures for assessing collinearity,
including tolerance and variance inflation factor (VIF) (Pallant, 2007). The data will be
absence of multicollinearity while VIF is less than ten, and tolerance value of greater than
0.10 but less than one (Kline, 2005). The tolerance values and VIF of this study pointed
out absence of multicollinearity problem as seen in table 6.6.
Table 6.6: Multicollinearity Test – Tolerance and VIF
Variables Tolerance VIF
Asset specificity .723 1.382
Environmental uncertainty .945 1.059
Behavioral uncertainty .964 1.037
Frequency .815 1.227
Trust in accountant .731 1.369
Technical competence .670 1.493
Degree of competition .607 1.647
6.6 DESCRIPTIVE STATISTICS
6.6.1 A Summary Statistics for variables
Table 6.7 shows mean scale scores and distributional statistics. It is noted that among all
the variables, the mean score was highest for technical competence and lowest for asset
specificity. The details are presented in Table 6.7.

189
Table 6.7: Descriptive Statistics
Variables N Max Min Mean Std. D
Statistic Std. Error
Asset specificity 658 1 7 3.33 .06295 1.614
Environmental uncertainty 658 1 7 3.69 .07011 1.798
Behavioral uncertainty 658 1 7 4.41 .06679 1.713
Frequency 658 1 6 2.82 .06725 1.725
Trust in accountant 658 1 7 4.69 .07537 1.933
Technical competence 658 1 7 5.00 .06628 1.700
Degree of competition 658 1 7 4.73 .05699 1.461
Outsourcing 658 1 7 4.40 .06512 1.670
Performance 658 1 7 4.03 .06453 1.655
6.6.2 Demographic Differences in main variables
This section reports an examination of demographic differences in the TCE and RBV
variables. Initial statistical methods were utilised to examine possible considerable group
differences in all the main variables based on gender, age and education. Independent
sample t-tests were adopted to examine the gender differences in main variables. Next,
one-way analysis of variance was utilised to verify the significant differences in terms of
age and education regarding their responses on the TCE and RBV variables measures. Post
Hoc Tests (e.g., Scheffe) were utilised to find out the specific groups which differed
significantly within a significant overall One-Way Analysis of Variance.

190
6.6.2 .1 Gender Differences in main variables
The relationships between gender (male and female), the variables were examined by
testing the significance of the mean differences between male and female. The results in
Table 6.8 showed that the mean differences between male and female were not significant
for the all measures.
Table 6.8: Gender Differences Regarding All Main Variables
Variables Mean t-value
Sig
Male Female
Asset specificity 3.37 3.21 1.057 .291
Behavioural uncertainty 3.66 3.80 -.812 .417
Environmental uncertainty 4.39 4.49 -.614 .539
Frequency 2.84 2.77 .416 .677
Trust in accountant 4.67 4.79 -.633 .527
Technical competence 4.99 5.03 -.295 .768
Degree of competition 4.72 4.76 -.323 .747
Outsourcing intensity 4.40 4.41 -.094 .925
Firm performance 4.00 4.15 -.957 .339
Note: Level of significance using t-tests; the mean difference is significant at p < .05
However, the researcher has not found any prior study that has examined gender
differences with TCE and RBV variables.

191
6.6.2 .2 Age Differences in main variables
A one-way ANOVA compares the mean differences among the five age groups in terms of
the TCE and RBV variables. Overall, the one-way ANOVA results showed insignificant
association between asset specificity, environmental uncertainty, behavioral uncertainty,
frequency, trust, technical competence, degree of competition, outsourcing intensity, firm
performance, and respondent age group. Consequently, there were no significant
differences between all variables and age group. Nevertheless, the present results found no
significant age differences for the TCE and RBV variables. Table 6.9 presents a summary
of the ANOVA results.
Table 6.9: Respondent Age Group Differences Regarding All Main Variables
Variables Respondent age group (Mean) F Sig
20-29
A1
30-39
A2
40-49
A3
50-59
A4
60-69
A5
Asset-spec 3.40 3.34 3.20 3.47 3.50 .482 .749
Environ-unce 3.72 3.72 3.64 3.65 3.93 .116 .977
Behavio-unce 4.38 4.40 4.40 4.55 4.54 .137 .968
Frequency 2.86 2.87 2.72 2.82 2.83 .201 .938
Trust 4.48 4.70 4.80 4.76 5.70 1.338 .254
Competence 4.93 5.02 4.94 5.21 5.01 .372 .829
Competition 4.79 4.62 4.86 4.53 5.40 1.532 .191
Outsourcing 4.32 4.39 4.40 4.62 4.60 .416 .797
Performance 3.91 4.02 4.06 4.28 4.22 .613 .654
**The mean difference is significant at p < .05
Note: environmental uncertainty=Environ-unce; behavioral uncertainty= Behavio-unce

192
6.6.2 .3 Education Level Differences regarding all main variables
A one-way ANOVA was used to examine the association between asset specificity,
environmental uncertainty, behavioral uncertainty, frequency, trust, technical competence,
degree of competition, outsourcing intensity, firm performance, and education level. Based
on the one-way ANOVA analysis, the results showed that the associations between
education level and most main variables were found to be not significant. Indeed, there was
only a significant association between degree of competition and education level group.
The details are presented in Table 6.10.
Table 6.10: Education Level Group Differences Regarding All Main Variables
Variables Education level group (Mean) F Sig.
HIS DEP TEC BAC MAS PhD
Asset-spec 1.80 3.20 3.44 3.38 3.16 2.64 1.792 .112
Environ-unce 2.72 3.49 3.51 3.76 4.04 3.07 1.474 .196
Behavio-unce 3.44 4.09 4.44 4.43 4.73 3.35 1.824 .106
Frequency 2.75 2.81 2.83 2.84 2.58 3.37 .413 .840
Trust 5.70 4.68 4.60 4.66 4.89 5.91 1.235 .291
Competence 5.13 4.64 5.00 4.99 5.26 5.59 .914 .471
Competition 5.90 4.47 4.82 4.65 5.07 5.57 2.660 .022**
Outsourcing 5.46 4.39 4.38 4.37 4.46 5.32 1.072 .375
Performance 3.63 4.03 4.04 4.03 3.96 5.04 .763 .577
The mean difference is significant at p < .05
Notes: HIS=High school; DEP=Diploma; TEC= Technical college; BAC= Bachelor; MAS= Master;
PhD=Philosophy of degree

193
Furthermore, none of the prior studies have examined the association between education
level group differences and such variables. Therefore, this study suggests for future
research to examine education level group with TCE and RBV variables to find more
support for this finding.
6.6.3 The Extent of the Accounting Outsourcing Usage (Frequency)
As the main objective of this study is to determine the extent to which accounting
functions are outsourced by Iranian SMEs. For satisfying this purpose, preliminary
descriptive statistics (frequency) was performed for each type of the accounting function
outsourcing measures. Therefore, the Table 6.11 provides the outsourcing frequency of
each items of the accounting outsourcing measures as included in the questionnaire on the
scale ranging from 1(not outsourced ) to 7 (totally outsourced ).
Table 6.11: Frequency of the Selected Outsourcing Measures (N=658)
Outsourcing measures Frequency
1 2 3 4 5 6 7
Bookkeeping works 48 50 84 151 120 83 122
Preparation of financial statements 49 67 75 138 136 95 98
Payroll accounting 58 66 67 129 128 115 95
Budgeting / forecasting 62 62 76 116 144 101 97
Customer profitability analysis 76 60 66 125 128 103 100
Product costing 69 63 82 99 142 91 112
Financial planning 59 63 74 136 128 104 94
Financial management services 47 68 74 127 134 108 100
Design/review internal control systems 46 65 74 143 135 77 118
194
Consequently, the results show the extent of accounting function outsourcing among SME
respondents range from 4 to 7 (totally outsourced). This means that most Iranian SME
outsource their accounting activities to professional accountants
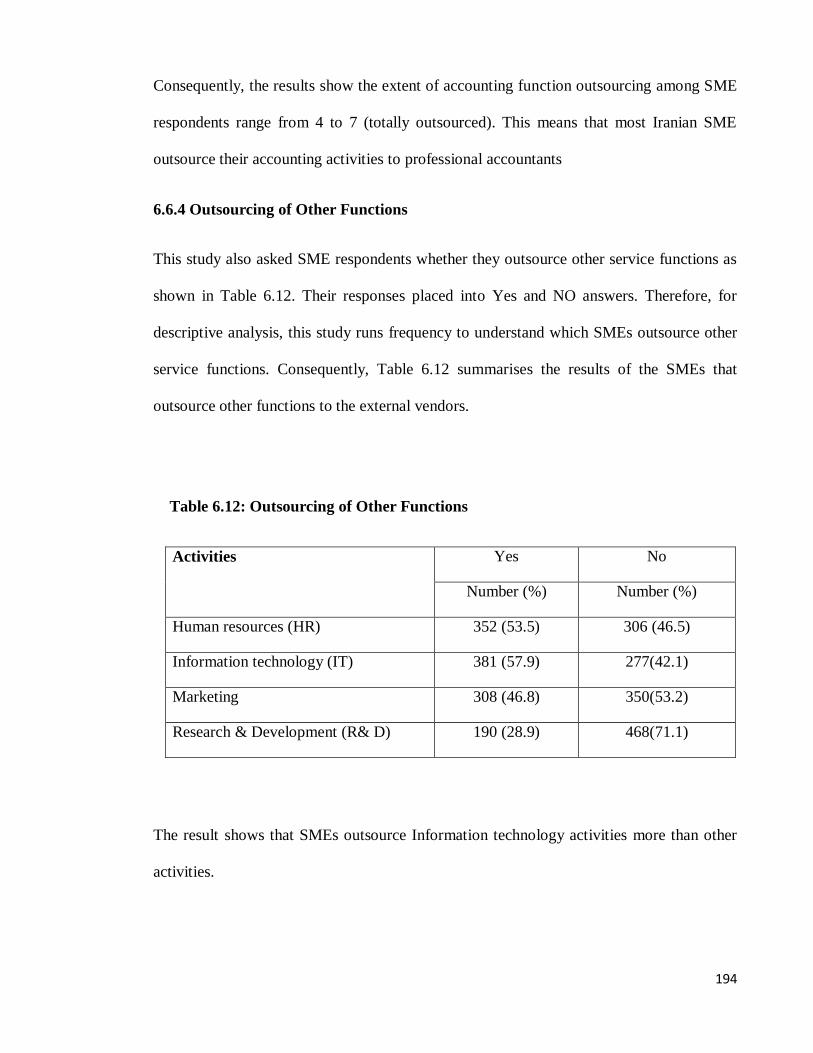
6.6.4 Outsourcing of Other Functions
This study also asked SME respondents whether they outsource other service functions as
shown in Table 6.12. Their responses placed into Yes and NO answers. Therefore, for
descriptive analysis, this study runs frequency to understand which SMEs outsource other
service functions. Consequently, Table 6.12 summarises the results of the SMEs that
outsource other functions to the external vendors.
Table 6.12: Outsourcing of Other Functions
Activities Yes No
Number (%) Number (%)
Human resources (HR) 352 (53.5) 306 (46.5)
Information technology (IT) 381 (57.9) 277(42.1)
Marketing 308 (46.8) 350(53.2)
Research & Development (R& D) 190 (28.9) 468(71.1)
The result shows that SMEs outsource Information technology activities more than other
activities.

195
6.7 JUSTIFICATION FOR USING STRUCTURAL EQUATION MODELLING
(SEM) IN THE PRESENT STUDY
Byrne (2001) states that traditional multivariate analysis (SPSS) has several limitations,
including (1) exploratory assessments (e.g., exploratory factor analyses) are descriptive by
nature, so they face difficulty for testing of the hypotheses, (2) when the traditional
multivariate techniques are utilised, the results of study may be biased because of
measurement error, (3) traditional regression analyses are ineffective due to absence of
model estimation and analyses of several equations simultaneously.
This study employed the SEM technique to overcome the limitations in the traditional
multivariate method (SPSS) as discussed earlier. The use of SEM technique is more
appropriate than the utilisation of traditional multivariate analysis for several reasons as
follows. (1) The assessments in SEM are based on information from the full covariance
matrix. (2) SEM technique offers comprehensible estimates of the measurement error
(Byrne, 2001). (3) Confirmatory factor analysis is used in SEM technique and it is more
comprehensive approach for testing construct validity, but in SPSS only exploratory
assessment is examined for analysing data (Byrne, 2001). (4) SEM technique is considered
a combination of both interdependence and dependence techniques such as exploratory
factor analysis and regression analysis (Hair et al., 2006). (5) SEM is an easily technique to
test direct and mediating effect (i.e., the direct and indirect effects) (Davison, Downs and
Birch, 2006). (6) Multiple structural relationships are examined in SEM approach
simultaneously while sustaining statistical efficiency (Hair et al., 2006). (7) SEM
technique can consider both observed and unobserved variables into a theoretical model
(Byrne, 2001). Therefore, this study examines mediating role of outsourcing intensity
using SEM technique. Although mediation effect can be conducted using SPSS through a
series of regression tests, it can be tested by two stages (direct and indirect effects)

196
simultaneously and easily in SEM model (Hair et al., 2006). More importantly, it is stated
that the use of multiple regression analysis to test mediation effect needs absence of
measurement error in the mediator (Baron and Kenny, 1986). This study used SEM to
reduce those problems as it provides explicit estimates of the measurement error (Byrne,
2001).
6.8 CHAPTER SUMMARY
This chapter discussed the validity and reliability assessment to guarantee the validity and
reliability, including exploratory factor analyses, scale reliabilities and corrected item-total
correlations. It also examined the test of assumptions for multivariate analysis which
included normality, linearity, multicollinearity and homoscedasticity. Finally, the
independent sample t-tests and one-way ANOVA were discussed in this chapter. Chapter 7
will test the measurement model using confirmatory factor analysis by SEM technique.
Chapter 7 also uses the SEM (AMOS) technique to specify, estimate and test a proposed
model effectively (Bentler, 1990).

197
CHAPTER 7
RESEARCH RESULTS: CONFIRMATORY FACTOR ANALYSIS &
HYPOTHESES TESTING
7.1 INTRODUCTION
Chapter 6 described corrected item-total correlation and exploratory factor analyses (EFA)
to purify the multi-item scale. The main purpose of this chapter is to report the findings of
this study. The rest of this chapter is organised as follows. Section 7.2 describes the
Structural Equation Modelling (SEM) using AMOS 18. Section 7.3 examines
measurement scale validation, including the assessment of fit, unidimensionality and
construct validity of the measurement model (convergent and discriminant validity).
Section 7.4 presents the structural model to establish the structural relationships between
exogenous and endogenous variables. Section 7.5 reports the results of hypotheses testing.
Section 7.6 evaluates the final hypothesized structural model. Section 7.7 discusses the
overall findings of the study. The chapter concludes with Section 7.8.
7.2 STRUCTURAL EQUATION MODELLING (SEM)
This study tested the proposed model fit to viewed data utilising SEM technique. The
proposed model consisted of seven exogenous variables (i.e., asset specificity,
environment uncertainty, behavioral uncertainty, frequency, trust in accountant, technical
competence, degree of competition) and two endogenous variables (i.e., outsourcing and
firm performance). The proposed research model analysis was performed through three
general approaches. First, the proposed model analysis was conducted using covariances

198
and the most widely utilised maximum-likelihood estimation method with AMOS 18
(Anderson and Gerbing, 1988). Second, the model development strategy was pursued
utilising a model re-specification method which aims to identify the source of misfit and
then generate a model that attain better fit of data (Byrne, 2001). Third, the proposed
model with different hypothetical structural relationships was tested in order to determine
the mediating role of outsourcing between independent variables and firm performance, the
ultimate dependent variable (Cooper and Schindler, 2003).
Based on suggestions by Bollen (1990) and Hair et al. (2006), this study examined
multiple indices of model fit because a model may attain good fit on a particular fit index
but inadequate on others. To achieve goodness of fit for the empirical data, both the
measurement and structural model should meet the requirements of selected indices (Hair
et al., 2006). The overall test of model fit selected was the chi-square test (McIntosh,
2007). As the chi-square test is extremely sensitive to sample size, and this study used the
chi-square normalized by degrees of freedom (χ²/df) (Bentler, 1990). According to
suggestion by Hair et al. (2006), an acceptable ratio for χ²/df value must be less than 3.0.
Hair et al. (2006) indicated that scholars have to state at least one incremental index and
one absolute index, as well as the chi-square value; at least one of the indices must be
badness-of-fit index. According to recommendation by Sugawara and MacCallum, (1993),
Root Mean Square Error of Approximation (RMSEA) was selected as it often provides
consistent results across different estimation approach for the badness-of-fit index.
Pursuing this guideline and suggestion by Hu and Bentler (1999), except chi-square and
normed χ²/df value, model fit for this study was analysed using multiple indices which
include Goodness-of-Fit Index (GFI), Tucker-Lewis Index (TLI), Comparative Fit Index
(CFI), and a badness-of-fit index, RMSEA. An acceptable model fit include a value

199
greater than 0.90 for GFI, CFI, TLI and a value of less than 0.08 for RMSEA as suggested
by Hu and Bentler (1999). Same as many other SEM scholars, the more stringent criteria
for approximate fit indices were utilised in the present study (Hu and Bentler, 1999). Table
7.1 provides a summary of the recommended benchmarks for model fit indices utilised in
the present study.
Table 7.1: Recommended Benchmark for Model Fit Indices
Fit Index Recommended value
Absolute Fit Measures
χ²
χ²/df
GFI
RMSEA
The lower, the better
≤ 3
≥ 0.90
≤ 0.08
Incremental Fit Measure
TLI
CFI
≥ 0.90
≥ 0.90
7.3 MEASUREMENT SCALE VALIDATION
The measurement scale was examined for reliability and validity following which; the path
model was assessed utilising SEM for hypotheses testing. To test the validity of
measurement used, other than exploratory factor analyses (EFA) which have been
discussed in previous Chapter, confirmatory factor analysis (CFA) was utilised to assess,
and modify the proposed research model.

200
7.3.1 Measure Validation Methods
This study utilised a method suggested by Anderson and Gerbing (1988). For example,
―Good measurement of the latent variables is prerequisite to the analysis of the causal
relations among the latent variables‖ (Anderson and Gerbing, 1988, p. 453). Accordingly,
confirmatory factor analysis is strongly needed to be performed because structural analyses
are frequently unreliable if the measurement model has low reliability and validity (Hair et
al., 2006). Based on data collected from 658 samples, the measurement model was
modified and verified utilising confirmatory factor analysis. All variables and its indicators
were shown in a measurement model in which all latent variables were permitted to
correlate with each other. In general, the validation process for ensuring construct validity
includes convergent and discriminant validity (Liao, Chen and Yen, 2007). Consequently,
convergent validity, discriminant validity in addition to construct reliability which
including composite reliability and average variance extracted was tested to ensure data
validity and reliability. After that, the structural model that best fitted the data was
identified. This was followed by hypotheses testing.
7.3.2 Confirmatory Factor Analysis (CFA)
Gerbing and Anderson (1988) argued that the traditional exploratory analyses such as
item-total correlation and factor analysis are not theory based analysis and therefore they
fail to evaluate unidimensionality directly. Hence, confirmatory factor analysis (CFA) was
used for the assessment of measurement model fit and unidimensionality to overcome this
limitation. This section covers key concerns with regard to CFA which includes
identification issues and model specification.

201
7.3.2.1 Identification Issues
In structural equation modelling, identification is about whether there are adequate pieces
of information to determine a solution for a set of structural equations (Hair et al., 2006). It
is very important to determine the identification status of a proposed model by checking
the number of degrees of freedom related to the model (Byrne, 2001). From the parameter
summary in AMOS output, the sample covariance matrix comprises a total of 1711 pieces
of information. Of the 219 parameters in the hypothesised model, only 152 parameters
were free to be estimated; the remaining 67 parameters were fixed in the model. The
present hypothesised model was over-identified with 1559 (1711 – 152) degrees of
freedom. As the sample size of the current study is adequately large, it is considered that
the proposed model will meet and create reliable results (Hair et al., 2006).
7.3.2.2 Model Specification
For specification of the latent variables or constructs, the loading for one of the indicator of
each variable was fixed to 1.0 in the model to generate a scale for the latent variable. This
process was conducted automatically with the features in AMOS 18 software.
7.3.3 Assessment of Fit and Unidimensionality of the Measurement Model
The initial measurement model incorporated nine (9) latent variables indicated by
respective items pertaining to each scale: asset specificity, environment uncertainty,
behavioral uncertainty, frequency, trust, technical competence, degree of competition,
outsourcing and firm performance (see Figure 7.1 for the initial measurement model).

202
Figure 7.1 Initial Hypothesised 58-Items Model of Factorial Structure (CFA1)

203
The absolute goodness-of-fit measures for the measurement models are displayed in Table
7.2.
Table 7.2: Goodness-of-fit Results for Initial Measurement Model
Model Goodness-of-Fit Results
χ²
χ²/df
P GFI
TLI CFI RMSEA
CFA1
6269.459 4.021 0.000 0.831 0.902 0.907 0.068
The measurement model should demonstrate good model fit and meet the requirements of
certain fit indices. Hence, the initial measurement model (CFA1) of the current study (χ² =
6269.459, χ²/df = 4.021, GFI = 0.831, TLI = 0.902, CFI = 0.907, RMSEA = 0.068) did not
yield an adequate model fit for the empirical data. The overall model chi-square was
6269.459 with 1559 degrees of freedom. The p-value associated with the chi-square was
0.000. According to Hair et al. (2006), this significant p-value did not show that the
observed covariance matrix matches the estimated covariance matrix in the empirical data.
However, other model fit indices need to be investigate closely given the sensitivity of chi-
square statistical test to sample size (Byrne, 2001).
7.3.3.1 Post Hoc Analyses
For CFA1 (see Table 7.2), the normed chi-square (χ²/df) showed a value of 4.021. This
value does not fall within the acceptable ratio of less than 3.0 for χ²/df value (Hair et al.
2006). The TLI and CFI were 0.902, 0.907, respectively. The TLI and CFI are incremental
fit indices and these values have exceeded the recommended level of 0.90. For the
badness-of-fit index, Root Mean Square Error of Approximation (RMSEA), the value of
0.068 was well below 0.08. However, the goodness-of-fit index (GFI) was 0.831,
204
indicating a poor fit of the model to the data (should be above 0.90). In summary, the
various index of overall goodness-of-fit for the model indicated good fit with the exception
of χ²/df and GFI indices. Clearly, it was noticeable that some model modifications were
needed to determine a model that would better fit the data (Byrne, 2001). Therefore, the
Modification indices (MIs) are presented in Appendix 5. Based on the initially CFA1model
(Figure 7.1), all factor loadings and error covariance terms that were fixed to a value of
0.000 are of considerable interest as they signifies the only meaningful sources of
misspecification in a CFA model. As such, large MIs make a case for error covariances.
However, consistent with other SEM programs, AMOS computes an MI for all parameters
absolutely presumed to be zero, in addition to for those that are clearly fixed to zero and
nonzero value or some other. In assessing the list of MIs in Appendix 5, for instance,
turning to the MIs related to the Covariances, it can be seen very apparent evidence of
misspecification the pairing of error terms related to Items (be1) and (b8) (e13↔e16; MI =
226.412) and so forth. Although, there are a few additionally quite large MI values shown,
these two stand apart in that they are significantly larger than the others; they reflect
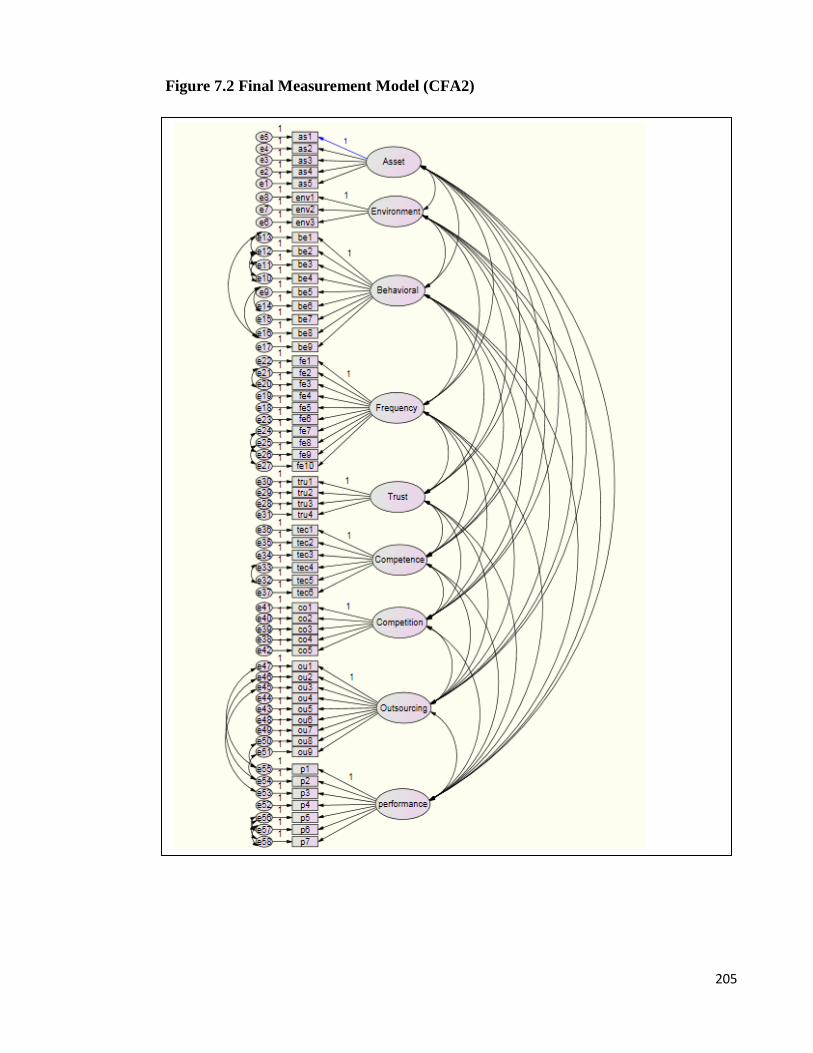
misspecified error covariances. Turning to AMOS Graphics, this study modifies the
initially CFA model by adding a covariance between these Item ( b1) and Item (be8) error
terms and other items by first clicking on the Covariance icon , for example on e13, and,
finally, on e16 and so forth as shown in Figure 7.2. The modified model structure for
Model 2 is presented in Figure 7.2.
205
Figure 7.2 Final Measurement Model (CFA2)

206
Model respecification that contains correlated errors need to be supported by a strong
empirical rationale (Jöreskog, 1993), and it is considered that this situation exists here.
Taking into consideration (a) obvious item content overlap, (b) the duplication of these
same error covariances in preceding studies (Byrne, 1991, 1993; Bentler and Chou, 1987),
this study considers respecification of this initial model to be justified. Testing of this
respecified model (Final Measurement Model) now falls within the framework of post hoc
analyses (Byrne, 2001). Therefore, Goodness-of-fit statistics related to Model 2 (Figure
7.2) exposeed that incorporation of the error covariance between some items made a
considerably large improvement to model fit. Particularly, the overall chi square value
reduced from 6269.459 to 3401.145 and the RMSEA from 0.068 to 0.043, while the CFI
value increased from 0.907 to 0.963, GFI 0.831 to 0.904 and TLI 0.0902 to 0.961. The
summary of Goodness-of-fit Results of CFA for Model2 is shown in Table 7.3.
Table 7.3: Goodness-Of-Fit Results for Final Measurement Model
Model Goodness-of-Fit Results
χ²
χ²/df
P GFI TLI CFI RMSEA
CFA2 3401.145
2.209 .000 0. 904 0.961 0.963 0.043
7.3.3.2 Unidimensionality
With 1540 degrees of freedoms, the model of this study yields a χ2 value of 3401.145.
According to Hair et al. (2006), a badness-of-fit, an SRMR index measures the average
difference between the hypothesised and observed variances and covariances in the model,
based on standardised residuals. Kline (2005) indicates that a model with an SRMR value
of 0.10 or lower is indicated as good fit. With SRMR value of 0.031, the model of this

207
study exceeds the given cutoff point. To sum up, the results of the GOF index indicate that
the measurement model fits the data relatively well (χ2=3401.145, df=1540,
χ2/df=2.209,p=0.000, CFI=0.963, RMSEA=0.043, SRMR=0.031).
Aside from the evaluation of the model‘s fit, the element of unidimensionality needs to be
verified by investigating the items‘ path directions and significant levels. This information
will be got from the regression weight output as seen by Table 7.4 below. The parameter‘s
variances compared across groups are demonstrated in the Estimate column. According to
the results, the value of each parameter estimate, which ranges from 0.762 (Firm
Performance to P6) to 1.137 (Behavioral to be 4) is all positive. When the estimates are
separated by their relevant standard error (S.E), they create values which are named critical
ratios (C.R) (Byrne, 2001). A critical ratios (C.R) score that is larger than 1.96 is
significant at 0.05 level (Byrne, 2001). All critical ratios (C.R) values as seen in the Table
7.4 are greater than 1.96, showing the achievement of significance level. The highest value
of C.R is 60.342 (Asset to as2) while the lowest is 16.477 (Competition to co5).
Table 7.4: Regression Weights
Estimate S.E. C.R. P
as1 <--- Asset 1
as2 <--- Asset 1.004 0.017 60.342 ***
as3 <--- Asset 1.013 0.017 59.247 ***
as4 <--- Asset 0.925 0.018 51.249 ***
as5 <--- Asset 0.985 0.017 57.848 ***
be1 <--- Behavioral 1
be2 <--- Behavioral 1.086 0.036 29.919 ***
be3 <--- Behavioral 0.94 0.031 30.029 ***

208
Table 7.4 (continued)
Estimate S.E. C.R. P
be4 <--- Behavioral 1.137 0.033 34.074 ***
be5 <--- Behavioral 1.057 0.032 33.115 ***
be6 <--- Behavioral 0.945 0.031 30.225 ***
be7 <--- Behavioral 1.051 0.033 31.904 ***
be8 <--- Behavioral 0.979 0.023 42.918 ***
be9 <--- Behavioral 1.032 0.033 30.953 ***
co1 <--- Competition 1.000
co2 <--- Competition 0.992 0.057 17.343 ***
co3 <--- Competition 1.087 0.057 19.119 ***
co4 <--- Competition 0.958 0.055 17.442 ***
co5 <--- Competition 0.985 0.06 16.477 ***
env1 <--- Environment 1.000
env2 <--- Environment 0.924 0.044 20.879 ***
env3 <--- Environment 0.953 0.047 20.327 ***
fe1 <--- Frequency 1.000
fe2 <--- Frequency 1.012 0.022 46.1 ***
fe3 <--- Frequency 1.011 0.023 44.374 ***
fe4 <--- Frequency 0.999 0.022 45.119 ***
fe5 <--- Frequency 1.048 0.022 47.635 ***
fe6 <--- Frequency 0.992 0.022 44.997 ***
fe7 <--- Frequency 1.006 0.024 42.552 ***
fe8 <--- Frequency 1.003 0.025 39.815 ***
fe9 <--- Frequency 0.973 0.023 41.933 ***
fe10 <--- Frequency 1.005 0.024 42.735 ***
tec1 <--- Competence 1.000
tec2 <--- Competence 1.008 0.025 39.818 ***
tec3 <--- Competence 0.98 0.027 36.242 ***
tec4 <--- Competence 0.892 0.029 30.812 ***
tec5 <--- Competence 0.865 0.032 26.634 ***
tec6 <--- Competence 0.89 0.037 24.143 ***
tru1 <--- Trust 1.000
tru2 <--- Trust 0.969 0.031 31.278 ***

209
Table 7.4 (continued)
Estimate S.E. C.R. P
tru3 <--- Trust 0.999 0.031 32.044 ***
tru4 <--- Trust 1.047 0.033 31.393 ***
ou1 <--- Outsourcing 1.000
ou2 <--- Outsourcing 0.947 0.02 46.817 ***
ou3 <--- Outsourcing 0.982 0.02 48.456 ***
ou4 <--- Outsourcing 0.96 0.023 41.386 ***
ou5 <--- Outsourcing 1.003 0.023 42.897 ***
ou6 <--- Outsourcing 0.961 0.026 36.943 ***
ou7 <--- Outsourcing 0.947 0.023 40.939 ***
ou8 <--- Outsourcing 0.963 0.021 44.884 ***
ou9 <--- Outsourcing 0.982 0.019 50.818 ***
P1 <--- performance 1.000
P2 <--- performance 0.964 0.011 89.959 ***
P3 <--- performance 1.005 0.012 86.138 ***
P4 <--- performance 0.91 0.017 53.603 ***
P5 <--- performance 0.775 0.023 33.712 ***
P6 <--- performance 0.762 0.023 33.616 ***
P7 <--- performance 0.77 0.023 33.679 ***
To sum up, since the values of all parameters‘ estimates are all significant and positive,
this shows that all items have significant associations with their respective latent variables
as proposed in this study. Moreover the achievement of satisfactory model fit as discussed
earlier, the existence of unidimensionality in this model is also supported by the items
positive and significant path directions.
7.3.4 Construct Validity
This study tested convergent validity and discriminant validity by following measurement
validation procedures suggested by Straub (1989). Therefore, before structural model
testing, the construct validity and reliability were tested by verifying the convergent
validity, discriminant validity, and composite reliability of the data (Straub, 1989). As a

210
consequence, the whole process of scale validation is outlined in the following sub-
sections.
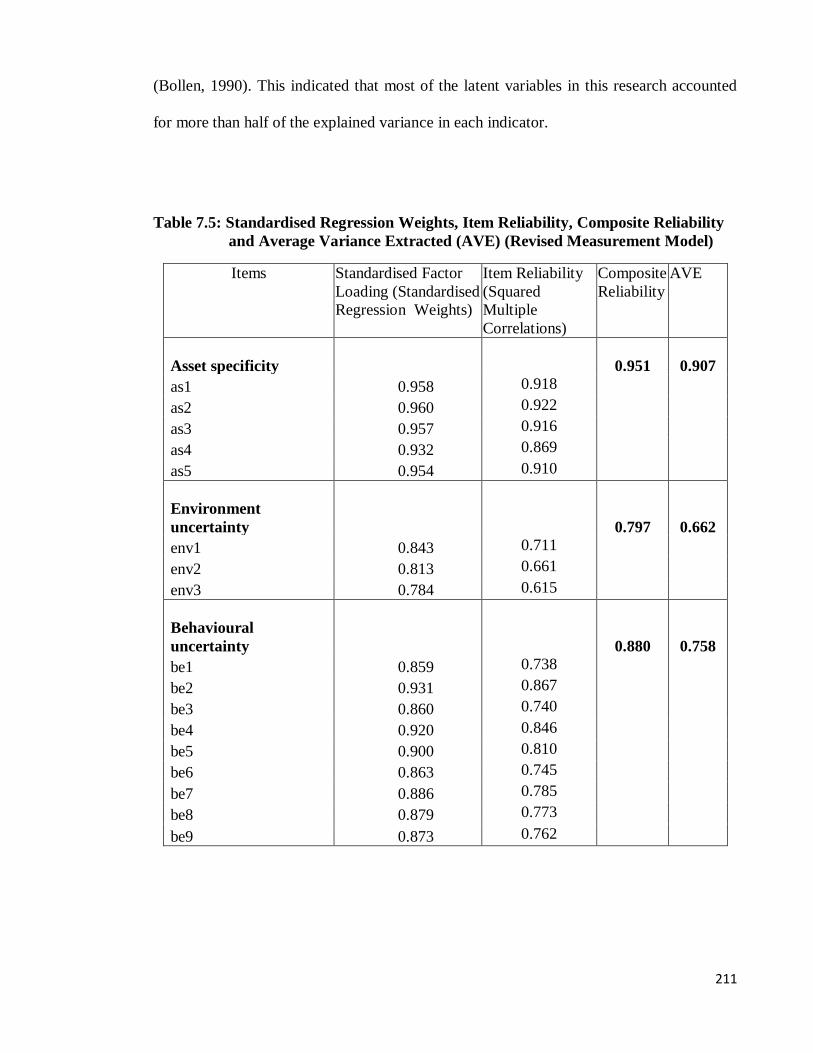
7.3.4.1 Convergent Validity
Kline (2005) indicated that the measurement model denotes how the observed indicators
relate to unobserved variables. Since the goodness-of-fit indices are statistically acceptable,
the next step was to test convergent validity of the data. The loading of each observed
indicators on their fundamental latent variable assessed the convergent validity (Anderson
and Gerbing, 1988). Table 7.5 presents the CFA results which include standardised factor
loadings and item reliability for each indicator (Observed Variables). Firstly, the factor
loadings (e.g., the standardised regression weight linking variable to indicator) were
investigated to identify potential problem with the CFA model. According to Hair et al.
(2006), the standardised factor loading must be significantly associated with the latent
variable and have at least loading estimate of 0.5. Therefore, any insignificant loadings
with low loading estimate point out a potential measurement problem. The CFA results
(see Table 7.5) pointed out that each factor loadings of the reflective indicators were
statistically significant at 0.001 level. Additionally, the factor loadings ranged from 0.691
(co5) to 0.979 (p1), and no loading was less than 0.50 suggested by Hair et al. (2006).
Next, the item reliability or squared multiple correlations in the CFA model was examined.
Item reliability or squared multiple correlations relates to the value that shows the extent to
which an observed indicator's variance is explained by the underlying construct or variable
(Hair et al., 2006). The majority of the squared multiple correlations of indicators (with the
exception for co5) in the measurement model were higher than the acceptable level of 0.50
211
(Bollen, 1990). This indicated that most of the latent variables in this research accounted
for more than half of the explained variance in each indicator.
Table 7.5: Standardised Regression Weights, Item Reliability, Composite Reliability
and Average Variance Extracted (AVE) (Revised Measurement Model)
Items
Standardised Factor
Loading (Standardised
Regression Weights)
Item Reliability
(Squared
Multiple
Correlations)
Composite
Reliability
AVE
Asset specificity
0.951
0.907
as1 0.958 0.918
as2 0.960 0.922
as3 0.957 0.916
as4 0.932 0.869
as5 0.954 0.910
Environment
uncertainty
0.797
0.662
env1 0.843 0.711
env2 0.813 0.661
env3 0.784 0.615
Behavioural
uncertainty
0.880
0.758
be1 0.859 0.738
be2 0.931 0.867
be3 0.860 0.740
be4 0.920 0.846
be5 0.900 0.810
be6 0.863 0.745
be7 0.886 0.785
be8 0.879 0.773
be9 0.873 0.762

212
Table 7.5 (continued)
Items
Standardised Factor
Loading (Standardised
Regression Weights)
Item Reliability
(Squared
Multiple
Correlations)
Composite
Reliability
AVE
Frequency
0.921
0.853
fe1 0.929 0.863
fe2 0.936 0.876
fe3 0.926 0.857
fe4 0.930 0.865
fe5 0.944 0.891
fe6 0.930 0.865
fe7 0.915 0.837
fe8 0.897 0.805
fe9 0.910 0.828
fe10 0.917 0.841
Trust in accountant
0.872
0.774
tru1 0.882 0.778
tru2 0.873 0.762
tru3 0.886 0.785
tru4 0.877 0.769
Technical
Competence
0.843
0.729
tec1 0.901 0.812
tec2 0.934 0.872
tec3 0.904 0.817
tec4 0.844 0.712
tec5 0.784 0.615
tec6 0.738 0.545
Degree of
Competition
0.711
0.551
co1 0.710 0.504
co2 0.730 0.533
co3 0.825 0.681
co4 0.749 0.561
co5 0.691 0.477

213
Table 7.5 (continued)
Items Standardised Factor
Loading (Standardised
Regression Weights)
Item Reliability
(Squared
Multiple
Correlations)
Composite
Reliability
AVE
Outsourcing intensity
0.901 0.820
ou1 0.946 0.895
ou2 0.910 0.828
ou3 0.913 0.834
ou4 0.890 0.792
ou5 0.899 0.808
ou6 0.858 0.736
ou7 0.887 0.787
ou8 0.912 0.832
ou9 0.933 0.870
Performance
0.893 0.807
P1 0.978 0.956
P2 0.975 0.951
P3 0.971 0.943
P4 0.919 0.845
P5 0.808 0.653
P6 0.807 0.651
P7 0.808 0.653
7.3.4.2 Construct Reliability and Variance Extracted Measures
If the composite reliability value (for standardised estimates) is 0.6 or higher the scale will
have a reasonable internal consistency(Lawson-Body and Limayem, 2004; Aubert et al.,
1996) According to the results reported in Table 7.5, all indicators found good composite
reliability values which range from 0.71 (degree of competition) to 0.95 (asset specificity).
Consequently, the results confirm that the variables in this study are extremely reliable as
they are very consistent in explaining the variances constituted in them.

214
The average of variances extracted (AVE) for each individual construct is another
important aspect of construct reliability. Average variance extracted (AVE) is an estimate
that determines the average amount of variances in indicators that are accounted for by the
underlying factor (Taylor and Hunter, 2003). When its AVE achieves 0.5 or greater the
variable should be reliable (Fornell and Larcker, 1981).
Table 7.5 shows that none of the variables have an AVE value below 50%. The lowest
AVE is generated by the degree of competition variable, with a percentage of 55 and the
highest AVE is scored by asset specificity variable with a percentage of 91. Therefore, it is
acceptable to conclude that the variables in the model are reliable because this cut-off
value confirms that at least 50% or more of the variances in the observed variables are
explained by the set of indicators.
7.3.4.3 Discriminant Validity
Two common methods of assessing discriminant validity are performed in this section.
First, a more conservative method for establishing discriminant validity was utilised (Hair
et al. 2006). Discriminant validity is identified by the variance extracted value, specifically
whether or not it exceeds the squared inter-construct correlations associated with that
construct (Fornell and Larcker, 1981). As it can be seen in Table 7.6, the variance
extracted of each variable is all above its squared correlation with other variables.
Consistent with Fornell and Larcker's (1981) guidelines, it evidenced that these results
explain adequate evidence for discriminant validity of the measurement model.

215
Table 7.6: Results of Average Variance Extracted and Squared Correlations of Each
Variable
AS EN BE FE TR TEC CO OU P
AS 0.907
EN 0.007 0.662
BE 0.000 0.005 0.758
FE 0.051 0.000 0.000 0.853
TR 0.145 0.000 0.002 0.076 0.774
TEC 0.208 0.006 0.002 0.090 0.241 0.729
CO 0.266 0.002 0.000 0.086 0.244 0.324 0.551
OU 0.330 0.000 0.000 0.192 0.385 0.358 0.417 0.820
P 0.219 0.002 0.001 0.119 0.239 0.250 0.274 0.632 0.807 Note: AS= asset specificity, EN=environmental uncertainty, BE= behavioral uncertainty, FE=
frequency, TR= trust, TEC= technical competency, CO= degree of competition, OU= outsourcing, and
P= performance
A second method to test the discriminant validity of measurement is also adopted in order
to create a more convincing discriminant validity results. According to Bagozzi and
Phillips (1982), the second method for evaluating discriminant validity is to compare the
chi-square difference between two models, namely, the unconstrained model and the
constrained model. In the unconstrained model, the covariance between particular two
variables was freely correlated (Bagozzi and Phillips, 1982). Nevertheless, in the
constrained model, the covariance of a certain two variables was fixed to 1.0. These chi-
square difference for these two model fit was then compared (Bagozzi and Phillips, 1982).
If the χ² difference between the two models is significant, two variables (constructs) are
claimed as having good discriminant validity (Hair et al., 2006). A series of chi-square
difference tests were performed and the results are shown in Table 7.7.

216
Table 7.7: Measurement Model Fit: Discriminant Validity
Links
Fixed correlation
Freely estimated correlation
Chi square
difference
d.f. Chi square Correlation d.f. Chi square
AS-ENV 20 105.189 0.08 19 71.379 33.81
AS-BE 70 592.651 0.02 69 531.466 61.185
AS-FE 87 429.234 0.64 86 420.939 8.295
AS-TRU 27 328.397 -0.38 26 74.470 253.927
AS-TEC 43 488.196 -0.46 42 132.271 355.925
AS-COM 35 533.009 -0.52 34 120.727 412.282
AS-OU 77 652.438 -0.58 76 171.913 480.525
AS-P 51 345.599 -0.47 50 162.579 183.02
ENV-BE 47 448.411 0.07 46 415.568 32.843
ENV-FE 62 363.908 -0.01 61 312.321 51.587
ENV-TRU 14 61.299 -0.02 13 14.263 47.036
ENV-TEC 26 118.300 0.08 25 80.951 37.349
ENV-OU 54 161.569 -0.01 53 126.240 35.329
ENV-P 32 107.607 -0.05 31 103.092 4.515
BE-FE 142 856.972 -0.01 141 801.741 55.231
BE-TRU 58 488.775 -0.05 57 426.072 62.703
BE-TEC 82 595.999 0.05 81 545.953 50.046
BE-OU 128 629.083 -0.03 127 562.741 66.342
BE-P 94 546.528 -0.02 93 540.652 5.876
FE-TRU 74 487.428 -0.28 73 320.935 166.493
FE-TEC 100 642.504 -0.30 99 431.747 210.757
FE-COM 90 736.385 -0.29 89 521.038 215.347
FE-OU 149 819.033 -0.44 148 506.491 312.542
FE-P 113 557.426 -0.34 112 458.769 98.657
TRU-TEC 35 168.230 0.49 34 158.192 10.038
TRU-COM 27 72.828 0.49 26 68.511 4.317
TRU-OU 65 183.053 0.52 64 124.005 59.048
TRU-P 41 233.885 0.49 40 96.292 137.593
TEC-COM 43 156.774 0.57 42 135.506 21.268
TEC-OU 89 235.727 0.60 88 212.255 23.472
TEC-P 61 339.038 0.50 60 195.480 143.558
COM-OU 77 190.209 0.65 76 174.584 15.625
COM-P 51 299.203 0.52 50 160.861 138.342
OU-P 96 937.111 0.80 95 384.453 552.658
Consequently, the chi-square value for unconstrained measurement model (freely
estimated correlation) was significantly lower than any constrained models (fixed

217
correlation) with the possible pair of constructs. The results showed that the differences in
chi-square between the fixed and free solutions were statistically significant. In other
words, the findings revealed good discriminant validity for all variables. On the whole, the
required reliability and validity assessment demonstrated strong support for satisfactory
convergent validity and discriminant validity. Hence, the subsequent process of identifying
the structural model that best fits the data were conducted to examine the research
hypotheses.
7.4 STRUCTURAL MODEL
The model can now be tested utilising SEM for hypotheses testing purposes when the
proposed model has been validated by the CFA. Having satisfied the measurement model
fit and necessary reliability and validity tests, this second part of the chapter focuses on the
hypothesised relations among the nine variables. Hence, this study utilised SEM technique
as the main statistical tool to test the hypotheses. Figure 7.3 shows the structural model to
be tested using SEM technique.

218
Figure 7.3: The Proposed Structural Model
The overall model fit for structural model was examined. The same set of fit indices
utilised to assess measurement model to test the full structural model. Several
modifications were made to the hypothesised model based on the modification index
(Byrne, 2001). The overall fit of the revised structural model shown in Table 7.8.
Outsourcing intensity:
Accounting functions
Frequency
Firm
performance
Technical competence
Degree of competition
Trust in accountant
Environmental uncertainty
Behavioural uncertainty
Asset specificity
Resource-Based Theory
Transaction Cost
Economics Theory
Resource-Based and
Transaction Cost
Economics Theories
Independent variables Mediating variable Dependent variable

219
Table 7.8: The Overall Fit of the Proposed Structural Model
Model χ²
χ²/df
P GFI TLI CFI RMSEA
Structural
Model
3875.157 2.475 0.000 0.892 0.952 0.955 0.047
The revised model demonstrated was used as the final model for hypothesis testing (χ² =
3875.157, χ²/df = 1566, GFI = 0.892, TLI = 0.952, CFI = .955, RMSEA = 0.042).
The chi-square was significant as expected, and the TLI and CFI index were substantially
above the preferred 0.90 threshold. The absolute fit measure of RMSEA was also well
below the recommended cut-off of 0.08 to be indicative of good model fit (Hu and Bentler,
1999). Although the GFI index did not meet the recommended cut-off, the value close to
the 0.90 threshold is acceptable (Byrne, 2000; Hu and Bentler, 1999). These overall fit
indices indicated acceptable fit of the model to the observed data (Hu and Bentler, 1999).
The analysis of SEM on the proposed model has generated results which are illustrated in
Figure7.4 and Table 7.9 on page 223.
7.5 HYPOTHESES TESTING
7.5.1 Direct Effects
In Table 7.9, outsourcing intensity was used as the dependent variable and independent
variables included asset specificity, environmental uncertainty, behavioural uncertainty,
frequency, trust in accountant, technical competence and degree of competition.
Accordingly, the results of structural coefficients exhibited in Figure 7.4 and Table 7.9 are

220
now used to examine hypotheses H1, H2, H3, H4, H5, H6 and H7 as follows. A summary
of hypothesis testing is presented in Table 7.9.
Table 7.9: Hypotheses Testing: The Effects of Independent Variables on Outsourcing
Intensity
Path Hypothesised Direction β SE Critical
Ratio
Supported
H1 - -0.295 0.032 -7.987 Yes
H2 - -0.008 0.027 -0.251 No
H3 - -0.022 0.024 -0.728 No
H4 - -0.240 0.026 -7.336 Yes
H5 + 0.354 0.029 9.252 Yes
H6 + 0.199 0.039 4.696 Yes
H7 + 0.292 0.049 6.403 Yes
7.5.1.1 The Association between Asset Specificity and Accounting Function Outsourcing
Intensity
The asset specificity is expected to have a negative relationship with accounting function
outsourcing intensity. Therefore, the research hyppothesis is presented as follows:
H1: The higher the level of the asset specificity of accounting functions, the lower
the accounting function outsourcing intensity
The path that connects asset specificity to outsourcing yields a significant coefficient value
of -0.295 (SE=0.032; C.R=-7.987). Hence, a significant negative coefficient for asset
specificity, suggesting that asset specificity is negatively associated with accounting
function outsourcing intensity, as predicted, thereby confirming H1. In other words, the
results support H1.

221
7.5.1.2 The Relationship between Environmental Uncertainty and Accounting Function
Outsourcing Intensity
It was noted earlier that environmental uncertainty is negatively associtated with
outsourcing of accounting functions. Therefore, the research hypothesis is presented as
follows:
H2: The higher the environmental uncertainty in accounting functions, the lower
the accounting function outsourcing intensity
The link between environment uncertainty and accounting function outsourcing intensity
as shown in Figure 7.4 (see Table 7.9) generated a coefficient value of -0.008 and this is
not significant at 0.001 (SE=0.027; C.R=-0.251; p=0.802). As a result, hypothesis 2, which
stated that environmental uncertainty is negatively related to outsourcing intensity of
accounting functions, was not supported. In other words, this means that environment
uncertainty is not related with accounting function outsourcing.
7.5.1.3 The Association between Behavioural Uncertainty and Accounting Function
Outsourcing Intensity
The behavioural uncertainty is predicted to have a negative relationship with accounting
function outsourcing intensity. Therefore, the research hypothesis is stated as follows:
H3: The higher the level of the behavioral uncertainty in accounting functions, the
lower the accounting function outsourcing intensity
As shown in Figure 7.4 and Table 7.9, the association between behavioural uncertainty
and accounting function outsourcing intensity is -0.022 and this is not significant at 0.001

222
(SE=0.024; C.R=-0.728; p=0.466). This means that behavioural uncertainty is not
associated with accounting function outsourcing. Hence, H3 is not supported in this study.
7.5.1.4 The Association between Frequency and Accounting Function Outsourcing
Intensity
The hypothesis below is examined in order to understand the relationship between
frequency and outsourcing intensity of accounting functions.
H4: The higher the frequency of accounting functions, the lower the accounting
function outsourcing intensity
The coefficient value for the route from frequency to accounting function outsourcing
intensity is -0.240 (SE=0.026; C.R=-7.336). Hence, support was found for hypothesis 4,
which stated that frequency is negatively associated with outsourcing intensity of
accounting functions. This finding is also consistent with TCE theory which indicates
frequent or recurrent accounting services are more likely to be produced internally.
7.5.1.5 The Relationship between Trust and Accounting Function Outsourcing Intensity
Below is the hypothesis to analyse the relationship between trust in the accountant and
outsourcing intensity of accounting functions.
H5: The higher the level of trust of the SME owner/manager in the professional
accountant, the higher the accounting function outsourcing intensity

223
With a coefficient value of 0.354, the association between trust and accounting function
outsourcing intensity is deemed to be significant (SE=0.029; C.R=9.252). Therefore, a
significant positive coefficient for trust of the SME owner/manager in the external
accountant, suggesting that the outsourcing of accounting functions is significantly
positively associated with the trust of the SME owner/manager in the professional
accountant, thereby confirming Hypothesis 5.
7.5.1.6 The Relationship between Technical Competence and Accounting Function
Outsourcing Intensity
Hypothesis below is stated in order to analyse the association between technical
competence and outsourcing intensity of accounting functions.
H6: The stronger the perception that external accountants are more technically
competent than the in-house accountants, the higher the accounting function
outsourcing intensity
As shown in Figure 7.4, the coefficient value that is produced between technical
competence and accounting function outsourcing intensity is 0.199. This is a significant
results (SE=0.039; C.R=4.696). In effect, this path is also considered that technical
competence is significantly positively associated with the degree of outsourcing of
accounting functions at a significance level of 0.001, which provides support for
Hypothesis 6.

224
7.5.1.7 The Relationship between Degree of Competition and Accounting Function
Outsourcing Intensity
Below is the hypothesis to analyze the relationship between degree of competition and
outsourcing intensity of accounting functions.
H7: The stronger the competitive pressures faced by the firm, the higher the
accounting function outsourcing intensity
The link between competition and outsourcing as shown in Figure 7.4 generated a
coefficient value of 0.292 and this is significant at 0.001 (SE=0.049; C.R=6.403). This
means that degree of competition has a significant relationship with accounting function
outsourcing intensity. Hence, H7 is supported in this study.
To sum up, except for environment uncertainty (H2) and behavioural uncertainty (H3), all
the paths to outsourcing are significant, indicating support to all the respective hypotheses
(H1, H4, H5, H6 and H7). Among these significant paths, the highest coefficient values is
scored by trust link (β=-0.354) and the lowest one is shown by technical competence link
(β=0.199). This result implies that among the variables, the strongest predictor of
outsourcing is trust in the professional accountants while the weakest is technical
competence.
7.5.1.8 The Association between Outsourcing Intensity and Firm Performance
Hypothesis below is proposed to examine the impact of accounting function outsourcing
intensity on SME performance.
H8: Accounting function outsourcing intensity is positively associated with firm
performance

225
Figure 7.4 shows the coefficient value for the route from accounting function outsourcing
intensity to firm performance is 0.732. Thus, H8 is supported, indicating a significant
positive relationship between accounting function outsourcing intensity and firm
performance. A summary of the results is presented in Table 7.10.
Table 7.10 Hypotheses Testing: The Effects of Outsourcing on Firm Performance
Path Hypothesised
Direction
β SE Critical
ratio
Supported
H8 + 0.732 0.245 25.268 Yes
7.5.2 Mediation Effect
Hypotheses 9, 10, 11, 12, 13, 14 and 15 are predictions that are concerned with
outsourcing as the mediating variable. Path modeling via AMOS is utilised to run the
analysis on the mediation effect of this study variables. For testing mediation effect in
SEM, full mediation model should be compared to a partial mediation model in which
direct paths from the independent variables are added to the dependent variable (Bagozzi
and Dholakia, 2006). For this purpose, the full mediation model is suggested to be taken as
baseline parameter (James, Mulaik and Brett, 2006). With this view, a partial mediation
model is considerd as an alternative model. When the chi-square difference between the
full mediation and partial mediation (alternative) model is not significant, a full mediation
will be confirmed (James et al., 2006; Wang, Law, Hackett, Wang and Chen, 2005). From
the non-significant change difference can conclude the change which is made on the full

226
mediation does not significantly add to the improvement of the model‘s overall fit (Wang
et al., 2005).
First, for testing the mediation effect, the χ² goodness-of-fit (GOF) measures of the
proposed full mediation model should be examined. Second, the χ² goodness-of-fit (GOF)
measures for partial mediation model should be conducted. After that, for comparison
purposes, direct lines that link the independent variables (asset specificity, environmental
uncertainty, behavioural uncertainty, frequency, trust, technical competence, and
competition) to the dependent variable (firm performance) are added in the existing model.
The new overall fit generated by the partial mediation model is subsequently compared
with the overall fit yielded earlier by the proposed model (full mediation model). The
results of this mediation test are presented in Table 7.11.
Table 7.11: The Overall Fit of the Full Mediation and Partial Mediation Model
χ2 df P<0.001 χ
2/df CFI RMSEA SRMR
Complete
Mediation
3875.157 1566 0.000 2.475 0.955 0.047 0.051
Partial Mediation 3870.195 1559 0.000 2.482 0.955 0.048 0.051
Difference (Δ)
between complete
and partial
mediation models
4.962 7 0.000 0.007 0.000 0.001 0.00
The difference in chi-square between both models is investigated to see if the change is
significant. For a chi square difference of 4.962, with 7 degrees of freedom, the associated
p-value is not significant (p=0.667). For example, difference between the fit of the partial
mediation model and the fit of the full mediation model is very little. Thus, the additional
paths generated in the full mediation model do not cause any significant change to the
overall fit of the original model. Hence, for parsimonious reason, the partial mediation

227
model is rejected and the full mediation model is accepted in this research (James et al.,
2006). Finally, Figure 7.4 shows the parameter estimates of the related paths (the full
mediation model) for hypotheses testing purposes.
Figure 7.4: Parameter Estimates of the Related Paths

228
Hypothesised mediating role of outsourcing is investigated in the following part. Based on
the parameters estimated in figure 7.4, direct, indirect and total effects are presented in
Table 7.12.
Table 7.12: Direct, Indirect, and Total Effects of Hypothesised Model
Independent
Variables
Endogenous variables
Findings-
mediation
effects Outsourcing
(R² =0.46 )
Firm Performance
(R² =0.54 )
Direct
effects
Indirect
effects
Total
effects
Direct
effects
Indirect
effects
Total
effects
Asset specificity
-0.295
.000
-0.295
.000 -0.216 -0.216
Yes
Environmental
uncertainty
-0.008 .000 -0.008 .000 -0.006 -0.006 No
Behavioral
uncertainty
-0.022 .000 -0.022 .000 -0.016 -0.016 No
Frequency
-0.240 .000 -0.240 .000
-0.176 -0.176
Yes
Trust
0.354 .000 0.354 .000
0.259 0.259
Yes
Competence
0.199 .000 0.199 .000
0.146 0.146
Yes
Competition
0.292 .000 0.292 .000
0.214 0.214
Yes
Outsourcing
.000 .000 .000 0.732 .000 0.732 -
H9: Accounting function outsourcing intensity mediates the relationship between
asset specificity and firm performance
As shown in Figure 7.4, both direct effects of asset specificity on outsourcing intensity
(β=-0.302) and outsourcing intensity on firm performance (β=0.732) are significant.
Referring to the results of indirect effects presented in the Appendix 6, it is indicated that
the indirect path which links asset specificity to firm performance through outsourcing

229
intensity is -0.216. Hence, with a significant extent of indirect coefficient value,
outsourcing intensity plays a significant medaiting role on the relationship between asset
specificity and firm performance, indicating a support to H9.
H10: Accounting function outsourcing intensity mediates the relationship between
environmental uncertainty and firm performance
For a variable to be recognised as a mediator, one of the conditions is that independent
variable should affect mediator variable (Baron and Kenny, 1986). In this study, the results
show that the environmental uncertainty is not associated with outsourcing intensity (β=-
0.008, SE=0.027; C.R=-0.251; p=0.802) while the path from outsourcing intensity to firm
performance is significant (β=0.732, SE=0.245; C.R=25.268, p<0.001). According to
condition suggested by Baron and Kenny (1986), since the path from environmental
uncertainty (independent variable) to outsourcing (mediator variable) is not significant,
therefore, outsourcing intensity as a mediator is not supported in this relationship.
H11: Accounting function outsourcing intensity mediates the relationship between
behavioural uncertainty and firm performance
According to condition suggested by Baron and Kenny (1986), independent variable
should be associated with mediator variable, it can be seen that the path from behavioural
uncertainty to outsourcing is not statistically significant (β=-0.022, SE=0.024; C.R=-0.728;
p=0.802). Although the relationship between outsourcing intensity and firm performance is
significant but outsourcing intensity as a mediator between behavioural uncertainty and
firm performance is not supported.

230
H12: Accounting function outsourcing intensity mediates the relationship between
frequency and firm performance
As indicated in Figure 7.4 earlier, the paths between frequency and outsourcing intensity
(β=-0.240) and between outsourcing intensity and firm performance (β=0.732) are both
significant. The product of those direct effects resulted in a significant indirect effect of -
0.176. Therefore, these findings confirm that outsourcing intensity plays a significant
mediating role on the the relationship between frequency and firm performance. Thus, H12
is supported.
H13: Accounting function outsourcing intensity mediates the relationship between
trust in professional accountant and firm performance
With a significant coefficient value of 0.372 that is seen by the relationship between trust
and outsourcing intensity and 0.731 between outsourcing intensity and firm performance, it
is concluded that outsourcing intensity plays a mediating role in the relationship between
trust and firm performance. The route from trust to firm performance via outsourcing
intensity is represented by a significant coefficient value of 0.354. As such, it is claimed
that outsourcing intensity is a significant mediator in the relationship between trust and
firm performance. This means that H13 is supported with a significant value of indirect
effect.
H14: Accounting function outsourcing intensity mediates the relationship between
technical competence and firm performance

231
As illustrated in Figure 7.4, the direction from technical competence to outsourcing
intensity (β=-0.199) and between outsourcing intensity and firm performance (β=0.732)
are both significant. The route from technical competence to firm performance via
outsourcing intensity is represented by a significant coefficient value of 0.146. Hence,
these findings confirm the significant role of outsourcing intensity in mediating the
relationship between technical competence and firm performance. Thus, H14 is supported.
H15: Accounting function outsourcing intensity mediates the relationship between
degree of competition and firm performance
Finally, since both links that tie the degree of competition to outsourcing intensity
(β=0.292) and outsourcing intensity to firm performance (β=0.732) are significant,
outsourcing intensity is again found to have a mediating role here. The significant indirect
effect of degree of competition on firm performance through outsourcing intensity is
0.214. All these results conclude that accounting function outsourcing intensity is a
significant mediator in the relationship between degree of competition and firm
performance. Otherwise stated, H15 is supported with a significant magnitude of indirect
effect.
7.6 EVALUATING THE FINAL HYPOTHESISED STRUCTURAL MODEL
The proportion of variance explained by the revised model was examined upon completing
hypotheses testing. While the non-significant path has no considerable meaningful
interpretation provided for the parameter estimates, several insignificant paths were

232
eliminated from the structure model. Consequently, the proposed model has been modified
and the final model of this study is introduced in Figure 7.5.
Figure 7.5: Revised Model
This resulted in several of the path estimates from the previous mediation model changed
slightly, as would be expected. The final revised model is presented in Figure 7.6.
Outsourcing intensity:
Accounting functions
Frequency
Firm
Performance
Technical competence
Degree of competition
Trust in accountant
Asset specificity

233
Figure 7.6: Parameter Estimates of the Revised Model
The final revised model with only the significant paths still provided acceptable model fit
(χ² =2712.252, χ²/df =2.793, GFI =0.902, TLI =0.955, CFI =0.958, RMSEA =0.052).
Finally, the squared multiple correlations (R²) were investigated to ascertain the proportion
of variance that was described by the exogenous variables in the theoretical model.
Particularly, the total variance in outsourcing intensity explained by the remaining five

234
factors was 46% in the final model. The overall fit of the final revised structural model
shown in Table 7.13.
Table 7.13: The Overall Fit of the Revised Model
Chi-square Ratio
GFI TLI CFI RMSEA
2712.252. df=971 (p=.000)
2.7939 0.902 0.955 0.958 0.052
Squared Multiple Correlations : outsourcing= 0.46 ; firm Performance=0.54
** Significant at p < .001
The proposed model explained a significant amount of variance in firm performance in that
all direct and indirect effects contribute to 54% of the total variance, which was
considerably high given that numerous factors may affect firm performance. Selected
AMOS outputs for the final structural model are presented in Appendix 7.
7.7 SUMMARY OF FINDINGS
Out of the fifteen (15) hypotheses that have been tested in this study, eleven (11)
hypotheses were supported. This section summarises the results of the hypotheses testing
(see Table 7.10). Hypotheses 1,2,3,4 expected negative effects on outsourcing intensity.
The findings indicated that only asset specificity and frequency negatively and
significantly correlated with outsourcing intensity of accounting functions while the
hypothesised path between environmental uncertainty and behavioural uncertainty
(Hypotheses 2 and 3) and outsourcing intensity were not supported.

235
Table 7.14: Summary of the Tested Hypotheses
Hypotheses Supported
H1: The higher the level of the asset specificity of accounting
functions, the lower the accounting function outsourcing intensity
Yes
H2: The higher the environmental uncertainty in accounting functions,
the lower the accounting function outsourcing intensity
No
H3: The higher the level of the behavioral uncertainty in accounting
functions, the lower the accounting function outsourcing intensity
No
H4: The higher the frequency of accounting functions, the lower the
accounting function outsourcing intensity
Yes
H5: The higher the level of trust of the SME owner/manager in the
professional accountant, the higher the accounting function outsourcing
intensity
Yes
H6: The stronger the perception that external (professional)
accountants are more technically competent than the in-house
accountants, the higher the accounting function outsourcing intensity
Yes
H7: The stronger the competitive pressures faced by the firm, the
higher the accounting function outsourcing intensity
Yes
H8: Accounting function outsourcing intensity is positively associated
with firm performance
Yes
H9: Accounting function outsourcing intensity mediates the
relationship between asset specificity and firm performance
Yes
H10: Accounting function outsourcing intensity mediates the
relationship between environmental uncertainty and firm performance
No
H11: Accounting function outsourcing intensity mediates the
relationship between behavioural uncertainty and firm performance
No
H12: Accounting function outsourcing intensity mediates the
relationship between frequency and firm performance
Yes
H13: Accounting function outsourcing intensity mediates the
relationship between trust in professional accountant and firm
performance
Yes
H14: Accounting function outsourcing intensity mediates the
relationship between technical competence and firm performance
Yes
H15: Accounting function outsourcing intensity mediates the
relationship between degree of competition and firm performance
Yes

236
Hypotheses 5, 6 and 7 predict that trust, technical competence, and degree of competition
are positively and significantly correlated with outsourcing intensity. These three factors
were received support. In other words, all the three factors were positively and
significantly correlated with outsourcing intensity.
Hypotheses 8 examined the direct effects of outsourcing on firm performance. Therefore, it
was found that outsourcing intensity had a significant positive effect on firm performance.
In other words, outsourcing intensity was positively associated with firm performance.
Hypotheses 9, 10, 11, 12, 13, 14 and 15 proposed that outsourcing plays a mediating role
on the relationships between factors such as asset specificity, environmental uncertainty,
behavioural uncertainty, frequency, trust, technical competence, degree of competition, and
firm performance. According to suggestions by Baron and Kenny (1986), one of the
conditions for mediation effect is that the independent variable should have effect on the
mediating variable. In this case, this outsourcing has mediating role on the associations
between asset specificity, frequency, trust, technical competence, degree of competition,
and firm performance while the hypothesised path was not supported for mediating role of
outsourcing on the relationship between environmental uncertainty, behavioral uncertainty,
and firm performance.
7.8 CHAPTER SUMMARY
This chapter examined TCE and RBV factors on outsourcing. The profile of the SMEs and
the accounting outsourcing practices in Iran were forwarded. Moreover, hypotheses were
tested and results discussed in this chapter. Structural equation modeling was employed to
test the mediating effect of accounting functions outsourcing intensity on the relationships

237
between the selected factors and firm performance as well as the direct effect of TCE and
RBV factors on outsourcing intensity. Hence, this chapter concluded that the full mediated
model is appropriate to examine the overall relationship of the proposed model.

238
CHAPTER 8
DISCUSSION AND CONCLUSION
8.1 INTRODUCTION
This chapter provides a discussion of the study's main findings. It also outlines the study's
limitations and indicates potential avenues for further research. The study‘s broad objective
was to further our understanding of factors affecting outsourcing in the SME sector and
outsourcing effect on SME performance. As no theory is all-inclusive or comprehensive,
the study adopted a quantitative approach (questionnaire survey) to test more than one
theory. The main theory used was transaction cost economics (TCE), and the other theory
drawn upon was the resource-based view (RBV). This chapter discusses the findings from
the theoretical model of accounting function outsourcing intensity. Explanations on the
findings are presented followed by the contributions and managerial implications of the
study. Finally, the chapter concludes with limitations of the study and suggestions for
future research.
8.2 DISCUSSION: OVERVIEW OF THE FINDINGS
To ease the discussion and interpretation, the explanations on the findings are based on the
research objectives and the study hypotheses. This is argued as follows.

239
8.2.1 Research Objective 1: To Identify the Types of Accounting Functions that SMEs
Outsource to a Professional Accountant
This study focused on outsourcing of accounting functions in Iranian SMEs. The first
research objective is to identify which accounting functions are outsourced by SMEs.
Based on interview with ten (10) professional accountants and eight (8) SME owner-
managers (see Section 5.3.2 in chapter 5), this revealed that Iranian SMEs outsource
twelve types of the accounting functions to professional accountants. However, only nine
accounting functions were utilised in the final study because items such as tax returns,
property accounting and firm secretarial services had low correlations with the respective
factors in pilot test. Additionally, tax returns and firm secretarial services are mandatory
and regulated and do not affect the sourcing decisions (Everaert et al., 2006). This finding
is in line with prior studies (Everaert et al., 2006, 2007, 2010) which found many SMEs
outsourced six types of their accounting tasks to external accountants.
8.2.2 Research Objective 2: To Examine the Extent to Which Iranian SMEs
Outsource their Accounting Functions
A questionnaire survey was conducted to measure the extent to which nine accounting
functions are outsourced by Iranian SMEs. To address second research objective,
descriptive statistics for each item of the accounting outsourcing measures was performed
to examine its frequency of use. Descriptive statistics reveal that out of the 658 SME
respondents, the majority of Iranian SMEs outsourced their accounting functions to
external accountants. For example, it shows the extent of accounting outsourcing among
SME respondents range mostly from 4 (to some extent) to 7 (totally outsourcing or to a
greater extent), demonstrating high usage of outsourcing of accounting practices in Iranian

240
SME environment. This finding is similar to Everaert et al. (2007) who evidenced that only
thirty-five (35%) of the SMEs use total insourcing their accounting functions.
8.2.3 Research Objective 3: To Explore the Factors Affecting Accounting Function
Outsourcing Intensity in Iranian SMEs
This study provides empirical evidence on accounting outsourcing decisions by combining
transaction cost economics (TCE) and resource-based view (RBV) explanations. Main
objectives of this study are to identify the factors influencing outsourcing of accounting
functions and the impact of outsourcing intensity on SME performance. This study utilised
TCE model by extending trust in external service provider as critical factor in outsourcing
to TCE model. Furthermore, other critical factors such as technical competence and degree
of competition were included to in the theoretical model, as suggested by resource-based
theory. Accordingly, this section summarises the findings pertaining to the TCE and RBV
model next.
8.2.3.1 Asset specificity and outsourcing intensity
This study found that asset specificity was statistically associated with outsourcing of
accounting practices. This study provided support for the TCE premise, which indicates
when the accounting activities involve high levels of asset specificity; SMEs are less likely
to outsource their accounting practices. This finding also received support from the RBV
which indicates the accounting functions involving specific assets should be processed
inside the firm since the SMEs‘ governance choices will be directed by their attempts to
safeguard idiosyncratic capabilities (Espino-Rodríguez et al., 2008; Leiblein and Miller,
2003). This result is in line with prior research (Everaert et al., 2010; Spekle´ et al. 2007;
Widener and Selto 1999) which found that asset specificity was the most important

241
determinant of transaction cost and a significant driver for the outsourcing of internal audit
and accounting activities. This finding is also consistent with preceding studies of other
service functions (i.e., information technology) where asset specificity was involved as a
critical driver in outsourcing decision (Nelson et al., 1996; Poppo and Zenger, 1998;
Aubert et al., 2004; Barthelemy and Geyer, 2005; Alvarez-Suescun, 2010).
8.2.3.2 Environmental uncertainty and outsourcing intensity
Contrary to the TCE model, environmental uncertainty was not associated with accounting
function outsourcing. In fact, the evidence on the impact of environmental uncertainty
seems to contradict the insights of transaction cost economics theory. This result is similar
to previous research (Widener and Selto 1999; Everaert et al., 2010) which found that
environmental uncertainty was not associated with outsourcing of audit and accounting
activities. This finding contradicts a few studies (Wang, 2002; Lamminmaki, 2007;
Dibbern and Heinzl, 2006, 2009) which found a negative relationship between
environmental uncertainty and outsourcing of service functions (e.g., Information System,
food and beverage, general maintenance). However, those results may not be appropriate
for accounting function outsourcing because if the accounting practices are not too specific
to the SMEs, such functions might be processed (provided) by professional accountants,
with insignificant difference between spot and negotiated prices (e.g., without considering
the variation in the workload). If these accounting functions are too specific to the SMEs,
such functions should be provided by internal staff, without considering of the fact that the
context of the activity is uncertain or not (Lamminmaki, 2007). For example, ―when
knowledge regarding the specific context of the firm is important in making those
judgments, it becomes costly to transfer them to an external accountant; hence, firms
organise these accounting functions internally‖ (Everaert et al., 2010, p.108).

242
8.2.3.3 Behavioural uncertainty and outsourcing intensity
The results of the statistical analysis of survey data did not support the behavioural
uncertainty variable of the TCE model. In other words, contrary to the TCE model,
behavioral uncertainty appears not to play a crucial explanatory role in accounting
outsourcing decision. Hence, this finding is consistent with prior studies (Widener and
Selto 1999; Speklé et al., 2007; Everaert et al., 2006, 2010; Alvarez-Suescun, 2010)
indicated that behavioural uncertainty is not associated with accounting function
outsourcing intensity. Although Lamminmaki (2007), Wang (2002) and Dibbern and
Heinzl (2009) found that behavioural uncertainty is a significant factor in the outsourcing
intensity of other service functions (e.g., housekeeping and information systems), but it
may not be applicable for accounting practices. The reasons could be stated: firstly,
measurement problems can damage the performance of accounting sourcing modes, which
makes the choice inappropriate (Alvarez-Suescun, 2010). Secondly, it is not difficult to
evaluate whether the accounting practices were processed accurately by accountant
because there are several software tools to check the accurateness (correctness) of
accounting practices (i.e. input of data) (Everaert et al., 2006, 2010).
8.2.3.4 Frequency and outsourcing intensity
Regarding the frequency attribute, support for TCE has been provided with regard to the
decision to outsource accounting functions. In other words, the survey data has provided
support for TCE's frequency prediction, which indicates frequent (high frequency)
accounting practices are more likely to be performed inside the firm. This implies that
SMEs are able to produce economies of scale for the accounting practices that are recurrent
and sizeable, in order that they are likely to provide such accounting functions inside the

243
firm. This result is similar to finding of previous research in accounting (Everaert et al.,
2006; 2010) which found the outsourcing of routine and non-routine accounting tasks is
significantly negatively related the frequency of accounting tasks. Furthermore, this result
is similar to preceding studies on outsourcing of other service functions where frequency is
involved, such as for internal audit (Widener and Selto 1999; Spekle´ et al. 2007) and
different activities (e.g., housekeeping, food and beverage, etc) (Lamminmaki, 2007).
8.2.3.5 Trust and outsourcing intensity
The statistical analysis provided support for the trust dimension of the TCE model. In other
words, trust in accountant turns out to be significantly associated with the accounting
function outsourcing intensity. This finding is line with TCE presumption which argues
trust is developed via relationship between parties to assist in minimising potential
opportunism (Rousseau et al., 1998). This result provides empirical validation of previous
research obtained a positive association between outsourcing and the trust of the SME
executive in the external service provider (Everaert et al., 2010; Verwaal et al., 2008).
8.2.3.6 Technical competence and outsourcing intensity
This study found a statistically significant association between technical competence and
outsourcing intensity in the light of the RBV model dimension. In other words, the result
indicated that technical competence of the accountant is positively associated with
outsourcing intensity. This finding is consistent with resource-based theory, which says
demonstration of an accountant‘s competence is critical before SME owner-manager will
rely on professional accountant as source of competitive advantage. This finding
corroborates the previous research (Carey et al., 2006), which found the technical
competence of a professional accountant was key factor influencing outsourcing of internal

244
auditing activities. In addition, this result also provides empirical validation of previous
study obtained a positive association between accountant's competence and the utilisation
of professional accountants‘ advisory services (Gooderham et al. 2004).
8.2.3.7 Degree of Competition and outsourcing intensity
Clearly support was obtained for resource-based arguments, which indicated degree of
competition is positively associated with outsourcing accounting functions based on the
study‘s survey phase. However, this result is contradictory with a prior study conducted in
Australian hotels by Lamminmaki (2007), which failed to find a statistically significant
association between degree of competition and outsourcing of some other service functions
(e.g., housekeeping, food and beverage, etc). More importantly, this finding also
contradicts with a prior research conducted in Norway (Gooderham et al., 2004), which
indicated that the use of external accountants was not associated with the degree of
competition. It is believed this could be threefold: Firstly, the preceding research was
conducted in a more developed country, whereas present study was performed in lesser
developing country, Iran, hence emphasising the importance of the RBV theorization and
its applicability in an emerging economy context. For instance, resource- based theory
argues that professional accountants can assist SMEs operating in a competitive
environment, to integrate operational considerations within long-term plans to enhance
their sustainability, and to achieve their business objectives (Ismail and King, 2005; Devi
and Samujh, 2010; Blackburn et al., 2010). Secondly, the sample of this study included
small and medium sized enterprises whereas previous study (Gooderham et al., 2004)
focused on micro and small enterprises (20 employees), hence suggesting an impact of size
on the need for outsourcing of accounting activities. Finally, this study examined
accounting practices provided by professional accountant whereas preceding study tested
245
external accountants‘ advisory services, clearly, this indicates the importance of accounting
practices for an emerging economy.
8.2.4 Research Objective 4: To examine whether there is an Association between
Outsourcing Intensity and SME performance
The results of the statistical test have provided support for the firm performance of the
proposed TCE and RBV model, which indicating outsourcing is as a strategic option will
lead to greater resources becoming positional advantages, which in turn leads to improve
firm performance. The results showed that outsourcing accounting functions was
significantly positively associated with firm performance. This study‘s findings are in line
with prior studies which revealed a positive the association between outsourcing of other
service functions and firm performance (Kroes and Ghosh, 2010; Salimath etal., 2008;
Berry et al., 2006; Gilley et al., 2004a; Espino Rodríguez and Padrón-Robaina, 2004;
Görzig and Stephan, 2002; Bennett and Robson, 1999). However, this result is
contradictory with the a few studies (Benson and littler, 2002; Gilley and Rasheed, 2000;
Jiang et al., 2006) that evidenced that outsourcing was not associated with firm
performance. Therefore, it suggests that this is caused by the context of large firms of
developed economies where the firm entrepreneurs could be sufficiently literate on
financial and management issues. For example, in an emerging economy, most SMEs face
difficulty in attracting and retaining skilled employee or qualified accountants (Devi and
Samujh, 2010; Jayabalan et al., 2009).

246
8.2.4 Research Objective 5: To Investigate the Mediating Role of Outsourcing on the
Relationship between TCE and RBV variables, and Firm Performance
The mediation path for asset specificity -outsourcing-firm performance was significant. In
other words, in the full structural analysis, outsourcing was found to mediate the
relationship between asset specificity and firm performance. Regarding the relationship
between asset specificity and firm performance, it is confirmed that asset specificity has a
lower influence on the firm performance when an accounting function is outsourced than
when it is provided in-house. In addition, result shows that outsourcing does not mediate
the relationship between environmental uncertainty and firm performance. Furthermore,
the statistical analysis of survey data collected has failed to provide support for mediation
effect of outsourcing on the relationship between the behavioral uncertainty and firm
performance. However, finding of this study are similar to previous study in other service
function (Cho et al., 2008) which found that ―the logistics outsourcing variable is not a
mediating variable but an independent variable‖ (p.352). Besides, the results of the
statistical test finds support for the mediating influence of outsourcing on the relationship
between independent variables such as frequency, trust, technical competence, degree of
competition, and firm performance. Although these findings address the lack of empirical
research on the mediating role of outsourcing, but findings of this study are similar to other
service functions (Abdul-Halim, 2009) which found human resource function outsourcing
mediates the relationship between business strategy and firm performance.
8.3 CONTRIBUTION OF THE STUDY
The fact that transaction costs and resources are fundamental factors in the outsourcing
decision highlights the significant role for accounting functions in facilitating decisions
about whether to outsource or insource. This study on outsourcing accounting functions

247
has several important contributions for the accounting outsourcing literature from three
aspects, theoretical, practical and methodological. These are discussed next.
8.3.1 Theoretical Contributions
This study utilised a combination of the transaction cost economics (TCE) and resource-
based theories to explain outsourcing of accounting functions, hence, providing some
empirical evidence on the applicability of such theories in outsourcing of accounting
practices in an emerging economy context. In this regard, it has extended the accounting
literature and reinforced their basic tenets.
Previous studies used transaction attributes such as asset specificity, environmental and
behavioural uncertainty and frequency in describing outsourcing in TCE view
(Lamminmaki, 2007; Dibbern and Heinzl, 2009; Wang, 2002; Widener and Selto 1999).
However, this study extends the literature by incorporating ―trust in the accountant‖ as a
critical factor affecting transaction costs and outsourcing in TCE model. As a result, the
application of trust in accountant as independent variable into the TCE model is expected
to extend the extant accounting literature and suggests significant implications for the
profession as discussed in 8.3.
This study also adds to a relatively new body of accounting outsourcing literature that
explores variables such as technical competence and degree of competition as important
factors influencing outsourcing of accounting functions based on the RBV model. Whilst
prior research has investigated the association between those factors and outsourcing of
other activities (i.e., internal audit and advisory services, housekeeping, etc) (Gooderham
et al., 2004; Carey et al., 2006; Lamminmaki, 2007), evidence from this study contributes
to extending the limited accounting outsourcing literature from emerging economies.

248
Further, this study evidences the positive association between outsourcing and SME
performance. This is an impetus for academics to pursue further research in this accounting
outsourcing research agenda and extend the limited extant Literature. More importantly
this study is the first to evidence the mediating role of outsourcing on the relationship
between the various factors identified and firm performance. Therefore, this study enriches
the accounting literature evidencing the importance of accounting outsourcing.
Given that SMEs play a significant role in Iranian economy with influence over the
economic policymaking of the country, the findings from this study will go a long way to
encourage more scholarly interest in the role of the accounting profession in empowering
SMEs and enhancing their performance.
8.3.2 Managerial Implications
It is argued that TCE and RBV theories predict outsourcing. Combining these two theories,
it appears that what would really be useful from a managerial perspective is a theoretical
model that assists the owner-managers of SME determine what the optimal degree of
outsourcing of accounting functions is for their firms. The development of this theoretical
model also produces a motivating challenge for the academic community.
This work is the first to examine outsourcing of accounting practices and its impact on
SME performance in the context of emerging economy (Iran) and it also explicitly
demonstrates the services currently provided by professional accountants to SME sector.
Hence, by identifying the broader range of services currently provided by professional
accountants to SMEs and the benefit attached to these services brings into focus the
broader range of choices available to SME owner/managers.

249
SMEs in emerging economies are facing with internal resource gaps; they generally refer
to professional accountants to fill up these gaps. Clearly, professional accountants are in a
unique position to fulfill the needs of SMEs, but it is important that the services are
provided by professional accountants to SMEs are fit for purposes (e.g., relevant and high
quality).
Accounting outsourcing is a potentially strong instrument for SMEs attempting to fulfill
their internal resource gaps. Outsourcing of accounting practices allows SME owner-
managers to focus on strategic activities that add more value. Hence, it strengthens human
resource‘s potential to make a practical contribution to business success.
This work is the first to examine outsourcing of accounting functions in Iran, an emerging
economy, and enables SME executives to identify the current outsourcing tendency. The
results may encourage the development of market niches for some accounting activities
since the work analyses the SME managements‘ demand for outsourcing. The work
produces knowledge and will help SME owner-managers in their sourcing decisions
concerning the principal processes of the SME industry and specific assets.
Another important implication of this study for SME owner-managers is the need for a
skillful knowledge of their operations and to determine the needs of each their operation so
as to attain a better competitive advantage and choose suitable service providers in the case
of accounting practices. It would also be necessary to support interorganisational relations
and there should be suitable service provider able to provide quality services. SMEs will
only be able to cover the gaps in their internal resources if they obtain external service
providers that can provide quality services or if they can use internal accountant when
outsourcing does not provide the expected results.

250
The managerial implication of this study related to the effect of accounting function
outsourcing intensity on SME performance. While accounting outsourcing is broadly
realised to be an attractive choice, its effect on SME performance and value that is
outsourcing result have not yet been examined by previous studies. Thus, these findings
provide suitable information to SME owner-managers in which a higher extent on
accounting function outsourcing contributes positively to SME performance.
The findings of this research are also critical in making decision which accounting
functions are frequently outsourced by Iranian manufacturing SMEs. Based on this
information, SME executives should be considerate about potential accounting functions to
be outsourced with the intention that a positive effect on SME performance is achieved.
This study also identified several advantages of outsourcing of accounting activities.
Therefore, SME owner- managers are aware of the advantages of accounting outsourcing,
which include: accessing experts, reducing costs, and focusing on core business to improve
the quality in performing accounting functions and getting access to human capital for
advanced operation. Consequently, this information may provide additional knowledge for
SME owner-managers in deciding to outsource their accounting practices.
Another practical contribution is that published studies in English in the Iranian context are
limited. Hence, this research also explicitly discusses development and regulation of
accounting profession in Iran, and it links services currently provided by professional
accountants to SMEs and examines the role that professional accountants play in Iranian
context.
Understanding the notion of outsourcing can help SME executives in their assessment of
the suitability of an activity for outsourcing. Based on this discussion of the ability to

251
outsource, SME executives could use these categories to understand their portfolio of
activities and to rank these activities in terms of effectiveness in outsourcing. Nevertheless,
this research suggests the analysis can improve managerial decision-making in two
important respects in SME environment. First, SME owner-managers are often not aware
of the fact there is a most favorable degree of outsourcing for their entire portfolio. As an
alternative, they have a tendency to observe the good or wickedness of outsourcing. This
study suggests a concurrent concentration on the portfolio as a whole will facilitate to
make better outsourcing decisions. Second, SME owner-managers are in need of
guidelines as to where the most favorable point lies for their firm at a particular time.
From a theoretical point of view, the transaction cost theory appropriately explains the
outsourcing of accounting functions. This study draws on Coase‘s (1937) original work,
and contributes to TCE perspective and reinforces the TCE premise that high transaction
volumes are associated with accounting insourcing. Therefore, TCE supports that firms are
less likely to outsource their accounting functions when they cannot determine whether the
service provider will actually performs the activities according to the agreed contract.
Therefore, when firms outsource accounting activities, they acknowledge the risk and try
to reduce it. In these conditions, due to bounded rationality and opportunism, the SMEs
cannot realise the potential risk until a problem arises, such as an external service provider
treats them opportunistically or they are overcharged. In such cases, SMEs tend to respond
quickly to lessen current and future risk. Nonetheless, by looking at possible outsourcing
through the lens of TCE, these SMEs might be able to avoid risk by using the proper
governance structure and anticipating risk and for the situation.
Taken as a whole, the proposed theoretical model in this research provides the SME
owner- managers among a useful way of thinking on how SMEs use accounting function

252
outsourcing to strengthen their internal resources. These will help SME executives make
efficient decisions in their future choices of accounting function outsourcing engagement.
8.3.3 Implications for the Accounting Profession in Iran
The findings of this study have two key implications for the accounting profession in Iran.
Firstly, given that the outsourcing of accounting functions is associated positively with
SME performance; professional accountants can play a significant role to empower SMEs
in Iran. They should explore ways to encourage SMEs to outsource their accounting
functions. In order to achieve this and make this a viable option for SMEs, they must
ensure their competence and capabilities are sufficiently enhanced so as to perform their
functions effectively and gain the confidence of their SME clients. Therefore, the
accounting profession led by the Iranian Institute of CPAs should embark on awareness
creation programmes to advise their members to expand their services to SMEs. This can
be achieved by incorporating these elements in the appropriate Continuing Professional
Education (CPE) programmes aimed at enhancing their multidisciplinary and technical
expertise beyond traditional compliance work and move to become knowledge
professionals. Whether or not professional accountants are able to achieve this shift is
arguable but this is where efforts of the International Federation of Accountants
(Blackburn and Jarvis, 2010) are evidently critical. Whilst the evidence is from Iranian
SMEs, it may similarly apply to other emerging economies‘ professional accounting
associations.
Secondly, it is found that trust is an important element in the outsourcing equation. In order
to maintain and sustain the trust of their SME clients it is important that professional
accountants always perform their functions with utmost integrity and professional

253
competence and it is the duty of the profession to ensure its members strictly comply with
its code of ethics.
8.3.4 Methodological Contributions
The methodological contribution of this study is the development of measurement of the
SME performance as the outcome of accounting outsourcing. Previous studies examined
impact of outsourcing on several measures of financial (return on assets and return on
sales) and non-financial (innovation performance stakeholder performance) performance
(Gilley et al., 2004a; Gilley and Rasheed, 2000), but the evidence indicates the link
between outsourcing and financial and non-financial performance is not clearly established
(i.e., indicators of financial and non-financial performance were not specified) (Espino
Rodríguez and Padrón-Robaina; 2004). In this regard, firm performance was measured by
both financial (profitability, sales growth, return on assets, and cash flow) and non-
financial (Lifestyle, independence, and job security) goals in this study. Therefore, it
departs from past research, which examined the impact of outsourcing on firm
performance by incorporating both financial and non financial measures.
Another important methodological contribution of this study involves the identification of
the determinants of the outsourcing of accounting functions. Accounting is an extensive
concept including areas of financial accounting, management accounting and finance. This
study examined some critical factors on outsourcing of nine types of accounting functions
including areas of financial accounting, management accounting and finance whereas prior
study investigated only six types of financial accounting activities (Everaert et al., 2010).
In that respect, this research contributes to the methodology in accounting research.

254
A comprehensive model of the relationships among important factors, outsourcing and
firm performance was developed, justified and empirically tested simultaneously using
SEM. The use of SEM increases the statistical efficiency of results of this study in several
ways. Firstly, it allows the analyses of multiple structural relationships at the same time
that result in more exact modelling than the utilisation of SPSS method (Hair et al. 2006).
Secondly, the direct and indirect effects of all the independent variables on outsourcing and
firm performance can be assessed easily at once. Finally, the SEM technique reduces the
measurement error problem related to test of the mediating effects (Baron and Kenny,
1986). This is because SEM method provides explicit estimates of the measurement errors
and consequently considered to be a more superior method (Byrne, 2001).
While variables such as asset specificity, environmental uncertainty, behavioural
uncertainty, frequency, trust, technical competence, degree of competition, outsourcing and
SME performance were tested in a few prior studies, but none of them examined
confirmatory factor analysis (i.e., convergent validity and discriminant validity) for
variables measurement (Everaert et al., 2006, 2010; Dyer and Ross, 2008; Lamminmaki,
2007; Carey et al., 2006; Sarapaivanich and Kotey, 2006). Consequently, satisfactory
convergent validity and discriminant validity for all variables and measurement scale
contributes to the methodology in accounting research.
8.4. LIMITATIONS AND SUGGESTIONS FOR FUTURE RESEARCH
The study has a number of limitations that should be taken into account. These limitations
together with the suggestions for future research are discussed next.

255
Generalisability of this study‘s findings may be limited to the size of the firms. This study
only focused on small and medium enterprises (SMEs) and established SMEs that engaged
with outsourcing of accounting practices. Accordingly, future research should attempt to
collect data from the firms without consideration of the size of firms. As such, comparison
between large, SMEs on practices of outsourcing accounting activities can be obtained
whether or not deviations in outsourcing accounting activities exist with reference to large
firms.
The respondents of this study are from the manufacturing SME sector, so generalisation to
other sectors may be made with caution. For example, it is possible that the pattern of
accounting function outsourcing will be different for SMEs in service sector than it is for
SME in manufacturing sector, because SMEs in service sector are characterised by human
resources (e.g., less tangible outputs and production). Therefore, it might be interesting to
expand the research to SME in service sector to get obtain more generalisable findings.
This study adopts a quantitative approach using a sample of respondents at one point of
time (a single cross-sectional descriptive). Future study should be focused on longitudinal
data, which can provide detailed explanations on accounting function outsourcing, which
usually takes in a long time period to obtain the results. Furthermore, a qualitative
approach could be adopted in future studies to obtain insights from SMEs as to why they
outsource their accounting functions.
While there are many facets of accounting functions specified in the literature, this
research merely concentrates on nine most important accounting functions namely
bookkeeping work, preparation of financial statements, payroll accounting, budgeting /
forecasting, customer profitability analysis, product costing, financial planning, financial
management services, and design/review internal control systems. Consequently, it will be

256
interesting if future research examines the importance of other accounting service
functions such as advisory services in the context of emerging economies.
For accounting practices, many SMEs use a combination of outsourcing and insourcing; it
is still unclear as to whether transaction characteristics can exclusively explain outsourcing
and insourcing of accounting practices. Another plausible explanation is that most SMEs
are lacking knowledge and resources and they need to outsource their accounting practices
to fulfill their internal gaps, so transaction costs only cannot be the main reason in
outsourcing decision in the SME environment.
This study did not analyse the data for each accounting functions separately. For instance,
the division of accounting functions into nine functions ignores the fact that accounting
functions may be divided into sub-functions. For example, financial planning or financial
management services have many sub-functions that this study could not examine
separately, so future research can consider each sub-function separately.
Results of this research indicate that trust in service provider plays an important role in
outsourcing of accounting practices based on TCE model whereas prior empirical studies
on outsourcing largely ignored the independent role of the trust in outsourcing decision. In
fact, the role of trust may be relatively unique for the accounting function outsourcing in
SME environment. Before SMEs outsource accounting activities, they should be confident
that the professional accountant is competent and trustworthy in view of the confidentiality
of the accounting information. As a result, future research could examine whether trust in
the accountant is a critical factor in outsourcing of accounting practices to confirm this
finding in SME environment, where confidentiality is of importance.

257
There are many motivating and exciting areas of research opportunity in the accounting
function outsourcing. This study provides an extensive viewpoint of outsourcing of
accounting practices. Future research is needed to consider this phenomenon
comprehensively. Outsourcing of accounting practices is a developing phenomenon, not a
passing trend. The managements of SMEs need to be successful in their accounting
function outsourcing efforts to gain expertise, reduce costs and protect the firm from risk.
SME executives possess the capabilities and desire to learn and get experience in
outsourcing practices. Moreover, academic scholars also have the opportunity to be at the
fore-front of this emerging phenomenon and allowing their insights and experience to help
shift SMEs as significant global players.
8. 5 CONCLUSIONS
This chapter has summarised the study's main findings, overviewed its main implications
and limitations, and noted ways that subsequent research may usefully build on this work.
The study set out with 5 key objectives and as discussed above, all the objectives have
been met.
The findings reveal that Iranian SMEs outsource nine types of the accounting functions to
professional accountants. Furthermore, it is found that most Iranian SMEs outsourced their
accounting functions. More importantly, the combined TCE and RBV model provided a
useful framework for guiding this investigation into accounting function outsourcing in
SME context in the emerging econmomies. Environmental uncertainty and behavioral
uncertainty appear not to play a crucial explanatory role either in outsourcing the
accounting functions in an emerging economy, unlike the experience in developed

258
economies. The plausible reason maybe that SMEs may not have difficulties in verifying
whether compliance with established agreements has occurred during or after the
processing of accounting functions because SMEs have learned to reduce these
measurement problems throughout past experiences. Experience in outsourcing agreements
may have enhanced the managers‘ measurement skills (Alvarez-Suescun, 2010). Finally,
the cross-cultural literature suggests that firm perceives and deal with environmental
uncertainty differently across cultures. Given the dearth of research in emerging
economies, it is unclear whether the environmental factors such as culture and status of
profession may influence such uncertainty. However, the results indicate that these
variables do not affect the outsourcing decision either directly and through the
measurement difficulty or culture. From above discussion, it is suggested that being
efficient in an activity requires not only accumulating knowledge from past experiences
but rather developing a capability. Clearer support is provided for resource-based
arguments.
Interestingly, results suggest the outsourcing intensity is significantly positively associated
with SME performance. More importantly, whilst the fully mediated model shows
outsourcing to be a non-mediator in the links between environmental uncertainty and
behavioural uncertainty and firm performance, it is a strong mediator in the case of asset
specificity, frequency, trust, technical competence and degree of competition and firm
performance links.
As discussed the thesis provides several significant contributions in that, firstly, it has
demonstrated the appropriateness of combining TCE and RBV perspectives when
exploring outsourcing in the SMEs. Secondly, several extensions and contradictions to the
TCE model have been explicated thus strengthening one‘s appreciation of the relative

259
strengths of the TCE. Thirdly, significant insights have been gained with respect to the
nature of SMEs outsourcing, reasons for outsourcing, and the nature of accounting
functions to support outsourcing decision making. Fourthly, it is found that in the context
of emerging economy (Iran), SMEs‘ decision to outsource is associated with the technical
competence and trust placed on the accountant by the SME owner/managers. The role of
the professional accountant is mainly perceived by SME executives as helping them
beyond compliance services because they have a broad base of technical competence,
enabling them to contribute to the success of SMEs. Hence, this is more important for
emerging economies and Iran because they have limited number of qualified accountants
to work in-house. This also suggests the Iranian Association of Certified Public
Accountants (IACPA) has a significant role to ensure its members maintain high standards
in professional competence and integrity. Finally, most outsourcing studies have been
conducted in the context of advanced industrial economies and it is debatable whether such
evidence is applicable to emerging economies such as Iran due to differing institutional
contexts and levels of state intervention in economic activities. The findings obtained
support that in the context of outsourcing the accounting function, firms in emerging
countries do behave similarly to those in developed countries. However, the element of
trust emerges as a significant factor implying greater need for the profession to address
issues of technical competency and ethical behaviour of its members. Further, efforts to
raise the trust amongst the SME sector are seen as important initiatives going forward. This
augurs well with recent calls by IFAC to its member bodies to focus of rebuilding
confidence and trust in the profession.