chapter 6 outline systems of linear inequalities...
TRANSCRIPT

Chapter 6 Outline Systems of Linear Inequalities
This is a tentative schedule. Dates of quizzes and tests may change.
Homework Completion Date Topic Homework Complete In Progress Not Done
Lesson 1: Exploring Linear Inequalities
Feb. 4th Lesson 2: Graphing Systems of Linear Inequalities
Feb. 5th Lesson 3: Solving Systems of Linear Inequalities
Feb. 6th Quiz #1: Graphing & Solving Inequalities
Lesson 4: Linear Programming Models
Lesson 5: Solving Optimization Problems Part 1
Feb. 7th Lesson 6: Solving Optimization Problems Part 2
Feb. 13th
Review
Feb. 14th
Ch. 6 Test
Fun with Functions Prerequisite Skills
SOLVES AN INEQUALITY
FORGETS TO FLIP THE SYMBOL

Ch.6- Systems of Linear Inequalities 6.1
Name: __________________________ Math 11 F
Exploring Linear Inequalities
Let’s start with a little review…
An “inequality” is a statement that involves a “greater than” or “less than” symbol.
A mathematical inequality must contain one of the following symbols:
€
>
€
<
€
≥
€
≤
€
≠
The following are examples of linear inequalities in a single variable:
€
4x −1 > 7
€
1− 2a ≤ 5
The solution to a single variable inequality can be shown on a number line (you did this last year).
A linear inequality in two variables is an inequality statement that describes the relationship between one variable and another.

Ch.6- Systems of Linear Inequalities 6.1
There is a lot of background knowledge that we assume you already know in this chapter:
• How to plot points on a graph
• How to recognize, use, graph and write the equation of a line
• How to use and read
€
≤ and
€
≥ symbols properly
• Associated terminology
If you are unsure about your understanding of any of these topics, you should talk to me, talk to a tutor or look up these topics online.
Reading Set Notation
€
x,y x + 2y > 6,x ∈{ ℝ
€
,y ∈ ℝ
€
}
{ } :
| :
€
∈ :
ℝ :
ℕ :
ℤ :
Ch.6- Systems of Linear Inequalities 6.1
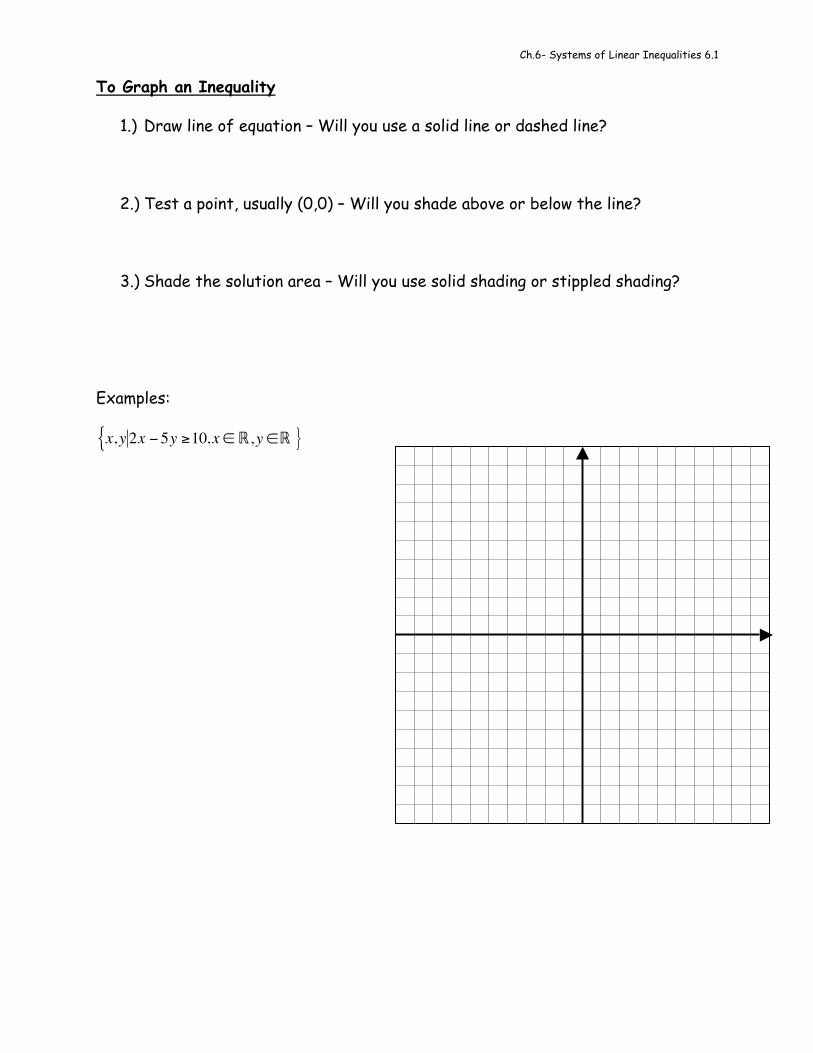
To Graph an Inequality
1.) Draw line of equation – Will you use a solid line or dashed line?
2.) Test a point, usually (0,0) – Will you shade above or below the line?
3.) Shade the solution area – Will you use solid shading or stippled shading?
Examples:
€
x,y 2x − 5y ≥10,x ∈{ ℝ
€
,y ∈ ℝ
€
}
Ch.6- Systems of Linear Inequalities 6.1
€
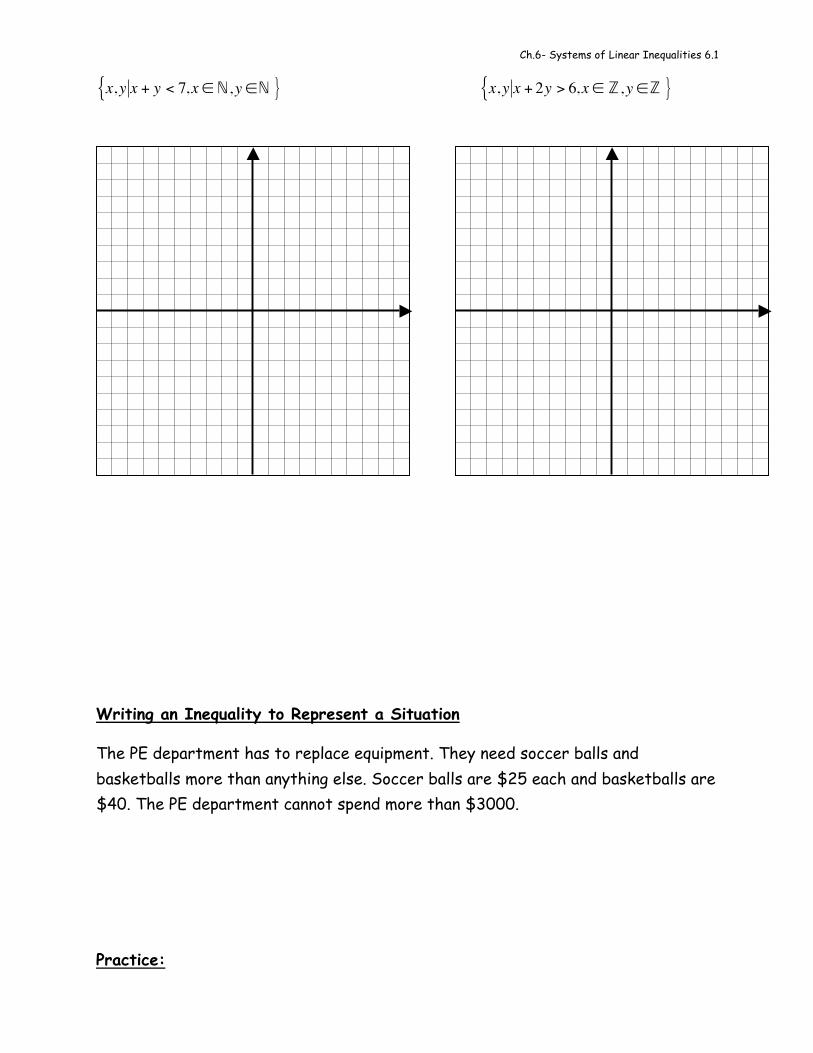
x,y x + y < 7,x ∈{ ℕ
€
,y ∈ ℕ
€
}
€
x,y x + 2y > 6,x ∈{ ℤ
€
,y ∈ ℤ
€
}
Writing an Inequality to Represent a Situation
The PE department has to replace equipment. They need soccer balls and basketballs more than anything else. Soccer balls are $25 each and basketballs are $40. The PE department cannot spend more than $3000.
Practice:
Ch.6- Systems of Linear Inequalities 6.2
Name: __________________________ Math 11 F
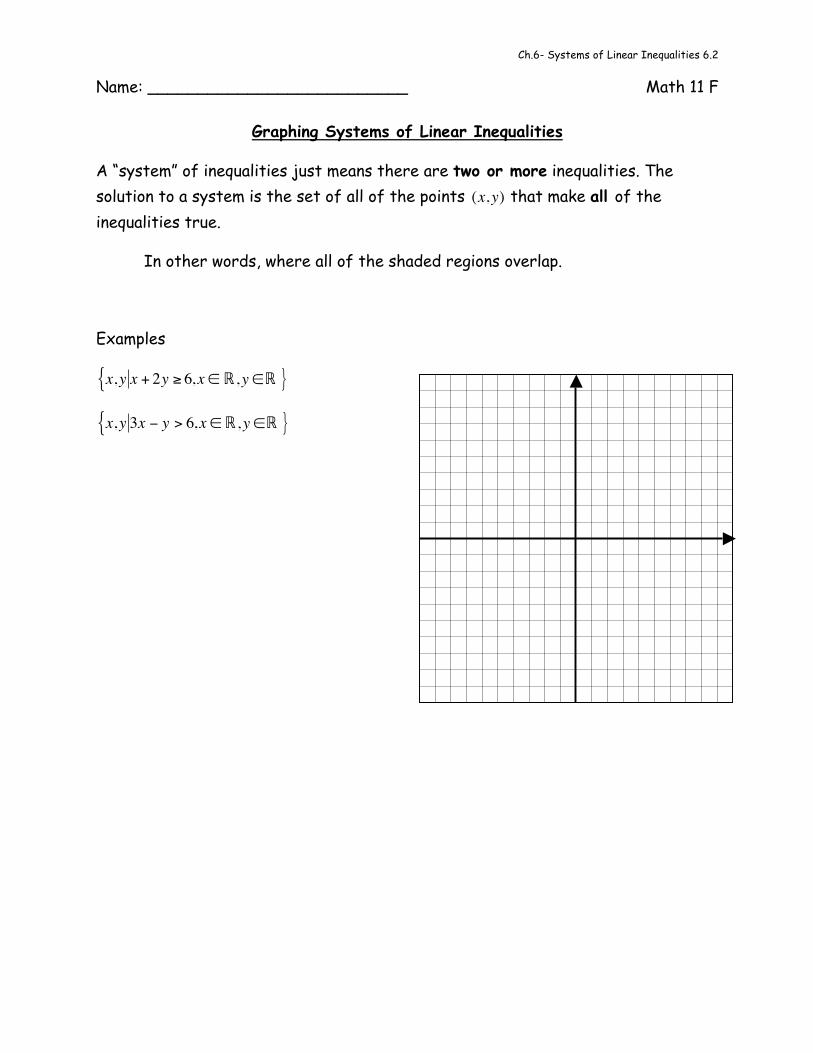
Graphing Systems of Linear Inequalities
A “system” of inequalities just means there are two or more inequalities. The solution to a system is the set of all of the points
€
(x,y) that make all of the inequalities true.
In other words, where all of the shaded regions overlap.
Examples
€
x,y x + 2y ≥ 6,x ∈{ ℝ
€
,y ∈ ℝ
€
}
€
x,y 3x − y > 6,x ∈{ ℝ
€
,y ∈ ℝ
€
}
Ch.6- Systems of Linear Inequalities 6.2
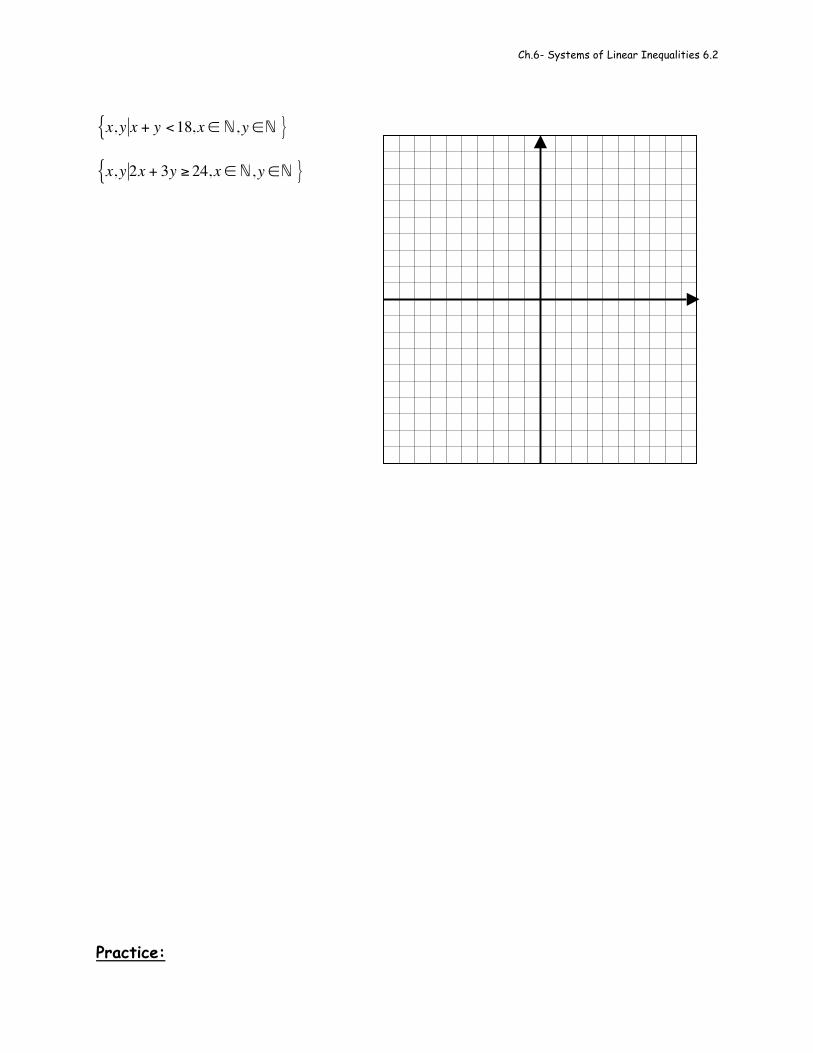
€
x,y x + y <18,x ∈{ ℕ
€
,y ∈ ℕ
€
}
€
x,y 2x + 3y ≥ 24,x ∈{ ℕ
€
,y ∈ ℕ
€
}
Practice:
Ch.6- Systems of Linear Inequalities 6.3
Name: __________________________ Math 11 F
Solving Systems of Linear Inequalities
A quick review:
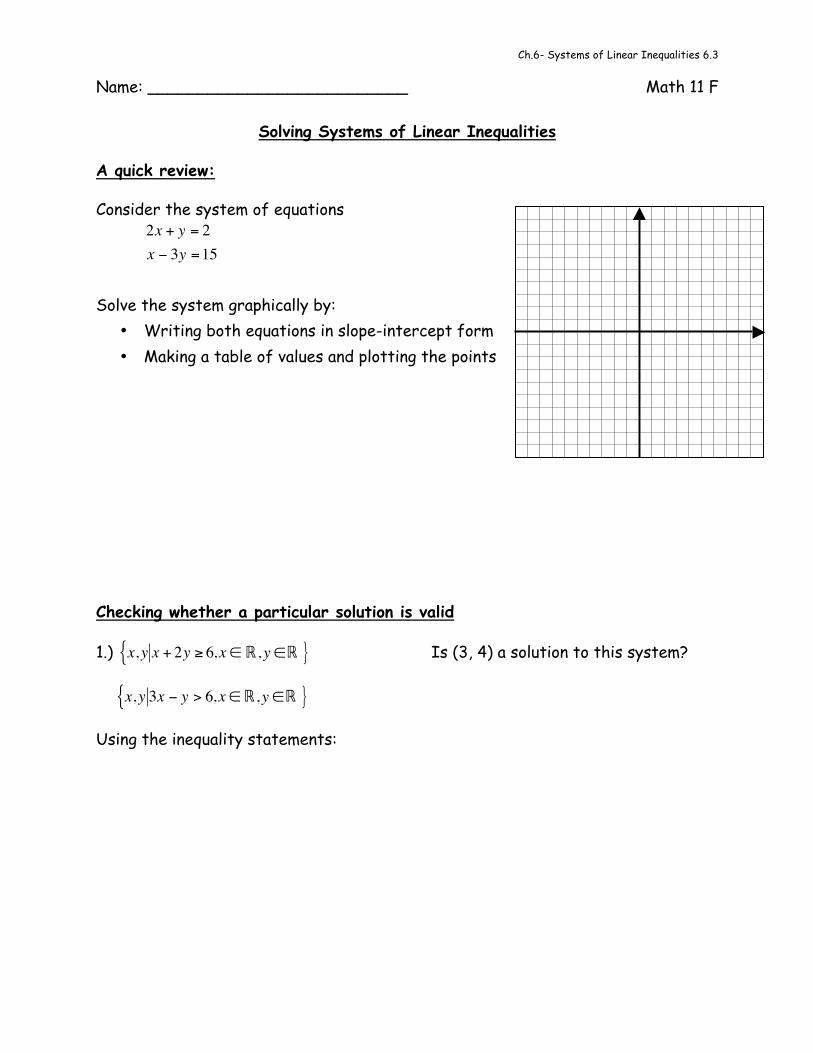
Consider the system of equations
€
2x + y = 2x − 3y =15
Solve the system graphically by:
• Writing both equations in slope-intercept form • Making a table of values and plotting the points
Checking whether a particular solution is valid
1.)
€
x,y x + 2y ≥ 6,x ∈{ ℝ
€
,y ∈ ℝ
€
} Is (3, 4) a solution to this system?
€
x,y 3x − y > 6,x ∈{ ℝ
€
,y ∈ ℝ
€
}
Using the inequality statements:

Ch.6- Systems of Linear Inequalities 6.3
Using the graph:
€
x,y x + 2y ≥ 6,x ∈{ ℝ
€
,y ∈ ℝ
€
}
€
x,y 3x − y > 6,x ∈{ ℝ
€
,y ∈ ℝ
€
}
Ch.6- Systems of Linear Inequalities 6.3
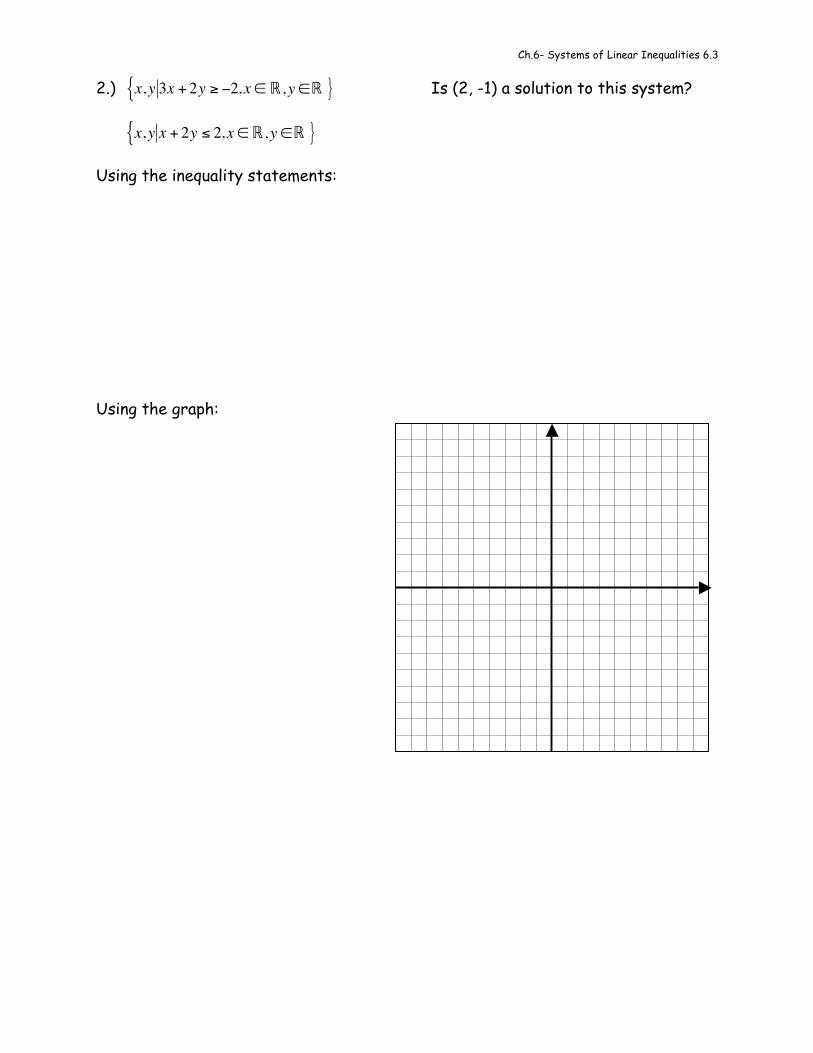
2.)
€
x,y 3x + 2y ≥ −2,x ∈{ ℝ
€
,y ∈ ℝ
€
} Is (2, -1) a solution to this system?
€
x,y x + 2y ≤ 2,x ∈{ ℝ
€
,y ∈ ℝ
€
}
Using the inequality statements:
Using the graph:

Ch.6- Systems of Linear Inequalities 6.3
3.)
Practice:

Ch.6- Systems of Linear Inequalities 6.4
Name: __________________________ Math 11 F
Linear Programming Models
The point of learning to use systems of inequalities is to determine the “optimal” solution given a number of constraints. This is called “linear programming” or “linear optimization.”
In order to translate a story or situation into a system, you must:
• Decide what restrictions there are on the values for each variable
• Assign values and write a system of inequalities based on the constraints
• Write an equation for the quantity that you are trying to maximize or minimize. This equation is called the _______________________.
Some necessary vocabulary:
• Optimization Problem:
• Constraint:
• Objective Function:
• Feasible Region:

Ch.6- Systems of Linear Inequalities 6.4
Example 1
Three teams are travelling to a basketball tournament in cars and minivans.
• Each team has no more than 2 coaches and 4 athletes. • Each car can take 4 team members, and each minivan can take 6 team
members. • No more than 4 minivans and 12 cars are available.
The school wants to know the combinations or cars and minivans that will require the minimum and maximum number of vehicles.
Create a model to represent this situation.
Ch.6- Systems of Linear Inequalities 6.4
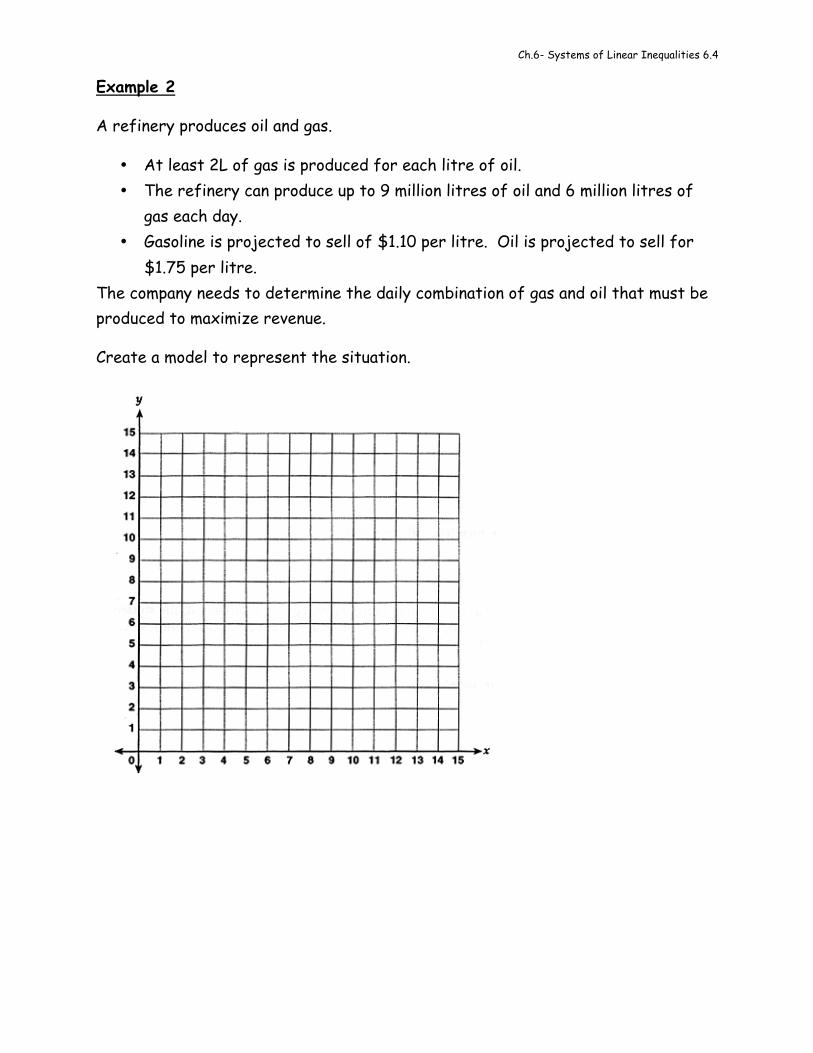
Example 2
A refinery produces oil and gas.
• At least 2L of gas is produced for each litre of oil. • The refinery can produce up to 9 million litres of oil and 6 million litres of
gas each day. • Gasoline is projected to sell of $1.10 per litre. Oil is projected to sell for
$1.75 per litre. The company needs to determine the daily combination of gas and oil that must be produced to maximize revenue.
Create a model to represent the situation.
Ch.6- Systems of Linear Inequalities 6.4
Example 3 YOUR TURN!
A toy company manufactures two types of toy vehicles: racing cars and sport-utility vehicles.
• Because the supply of materials is limited, no more than 40 racing cars and 60 sport-utility vehicles can be made each day.
• However, the company can make 70 or more vehicles, in total, each day. • It costs $8 to make a racing car and $12 to make a sport-utility vehicle.
The company wants to know what combinations will result in the minimum and maximum costs.
Create a model to represent the situation.
Practice:

Ch.6- Systems of Linear Inequalities 6.5
Name: __________________________ Math 11 F
Solving Optimization Problems- Part 1
After you have modeled the problem with a system of inequalities and an objective function, you can graph the solution region. However, drawing the graph alone doesn’t tell you which of all off the points is the best solution.
For example:
€
x + y ≥ 2y ≤ 4x ≤ 3
⎧
⎨ ⎪
⎩ ⎪
⎫
⎬ ⎪
⎭ ⎪
€
M = 2x + 3y
The best solution is the point
€
(x,y) that gives you the highest possible value when you plug
€
x and
€
y into the objective function (or possibly the lowest value, depending on what the story asks you to do).
You won’t need to check every single point. The optimal solution will always be on (or very near) one of the intersection points of the boundary lines.

Ch.6- Systems of Linear Inequalities 6.5
Example 1
Consider the situation: Restrictions: !∈ℝ,"""∈ℝ
Constraints: !+3"≤9,"!−"≤3,"!≥−3
Objective function: #=2!+"
a.) Draw a graph to model the situation. b.) What point in the feasible region would result in the maximum value of the
objective function? c.) What point in the feasible region would result in the minimum value of the
objective function?
Practice:
Ch.6- Systems of Linear Inequalities 6.5
Name: __________________________ Math 11 F
Solving Optimization Problems- Part 2
Example 1
The following model represents an optimization problem. Determine the maximum solution.
Optimization Model
Restrictions: !∈ℝ!"#$!%∈ℝ
Constraints: %≤1,!!!2%≥−3!+2,!!!!!%≥3!−8
Objective function: &=−4!+3%

Ch.6- Systems of Linear Inequalities 6.5
Example 2
Larry and Tony are baking cupcakes and banana mini-loaves to sell at a school fundraiser.
• No more than 60 cupcakes and 35 mini-loaves can be made each day • Larry and Tony can make more than 80 baked goods, in total, each day. • It costs $0.50 to make a cupcake and $0.75 to make a mini-loaf.
They want to know the minimum costs to produce the baked goods.

Ch.6- Systems of Linear Inequalities 6.5
Example 3
L&G Construction is competing for a contract to build a fence.
• The fence will be no longer than 50yd and will consist of narrow boards that are 6in wide and wide boards that are 8in wide.
• There must be no fewer than 100 wide boards and no more than 80 narrow boards.
• The narrow boards cost $3.56 each, and the wide boards cost $4.36 each.
Determine the maximum and minimum costs for the lumber to build the fence.
Practice: