chapter - 6 development and evaluation of …shodhganga.inflibnet.ac.in/bitstream/10603/13006/12/12_...
TRANSCRIPT

107
CHAPTER - 6
DEVELOPMENT AND EVALUATION OF CITICOLINE
CONTROLLED RELEASE TABLETS
6.1 MATERIALS AND EQUIPMENTS
Table 6.1: List of Materials used in research work
Name of the Material Manufacturer
Citicoline Sodium IH Micro Labs, Bangalore, India.
Microcrystalline Cellulose
( Avicel PH-101) USP/NF
FMC Bio Polymer, Ireland.
Hypromellose (Methocel K100M) USP/NF
Dow Chemicals, Germany.
Hydroxy propyl cellulose (HF) USP/NF
Ashland Inc. SA
Ammonio Methacrylate co-polymers (Eudragit RLPO) USP/NF
Evonik industries, Germany.
Ammonio Methacrylate co-polymers
(Eudragit RSPO) USP/NF
Evonik industries, Germany.
Acetone (AR Grade) Rankem, Mumbai.
Isopropyl alcohol (AR Grade) Rankem,Mumbai.
Colloidal Silicon Dioxide USP/NF Evonik industries, Germany.
Magnesium Stearate USP/NF Ferro corporation, Cleveland
Talc USP/NF Luzenca Pharma,Italy
Titanium Dioxide USP/NF Kronos,Germany
Triacetin (AR Grade) Merck Specialties Pvt. Ltd, Mumbai.
Potassium dihydrogen Orthophosphate (AR Grade)
Merck Specialties Pvt. Ltd, Mumbai.
Sodium Hydroxide (AR Grade) Merck Specialties Pvt. Ltd, Mumbai.
Tetra butyl ammonium hydrogen sulphate (AR Grade)
Merck Specialties Pvt. Ltd, Mumbai.
Tri ethyl amine (AR Grade) Merck Specialties Pvt. Ltd, Mumbai.
Acetic acid (AR Grade) Merck Specialties Pvt. Ltd, Mumbai.
Methanol (AR Grade) Merck Specialties Pvt. Ltd, Mumbai.
Hydrochloric acid (AR Grade) Merck Specialties Pvt. Ltd, Mumbai.

108
Table 6.2: List of Equipments Used in the Research Work
Equipment Name Manufactured By
Electronic Weighing Balance Mettler Toledo (AB104), Germany.
Hot air oven Innovative instruments, New
Delhi
Sieves Jayant Scientific Ind.,Bombay
Compression Machine (8 Station) Cadmach,Ahemadabad
Conentional coating Pan Innovative instruments, New
Delhi
Digital Vernier Calipers Mitutoyo (CD-8CSX), China.
Friability Apparatus Electrolab EF – 2W, Mumbai.
Hardness Tester Dr. Schleuniger (6D), Germany.
Dissolution Apparatus TDT-08L, Electrolab, Mumbai.
Sonicator Power sonic 505, India.
HPLC Waters, USA.
FT-IR Perkin Elmer,Japan.
Vortex Mixer Spinex, India.
Stability Chamber Mack, Mumbai.
DSC Mettler Toledo,star DSC21, USA.
UV visible spectrophotometer Analytikjena Specord 210
Overhead 3-blade medium duty
stirrer Remi stirrer, Mumbai, India.
Cyclomixer Remi Instruments, Mumbai,
India.
Multifuge Centrifuger Heraus,Germany.
109
6.2 ANALYTICAL METHODS
There are several reported methods for the estimation of
Citicoline available in the literature; those are UV, Colorimetry, HPLC
&LC-MS methods.
In the present investigation we have develop a modified
Ultraviolet spectroscopic method for the estimation of citicoline for
dissolution samples*.HPLC method was developed for estimation of
drug content (Assay)*.The analytical methods (i.e dissolution and
assay)of citicoline controlled release tablets not published in official
pharmacopeia.(i.e IP,BP&USP)
* The methods was developed on the basis of development and
validation of spectrophotometric determination of citicoline by Sanjay
Surani, V et al.,58 for dissolution samples and HPLC method for the
determination of citicoline by K.Tulasi, et al.,56 for assay samples.
A modified high pressure liquid chromatographic method was
developed and validated for the quantification of uridine in rabbit
plasma by Keguang Chen et al.,59.
6.2.1 Method Development
The solubility of the Citicoline was tested in different dissolution
medias like 0.1N HCl, pH 4.5 Acetate buffer, pH 6.8 phosphate buffers
and purified water. Based on the solubility data dissolution media pH
6.8 phosphate buffers was selected as media with 900mL of volume,
maintained at 37 ± 0.5°C.Study was conducted for selection of
dissolution apparatus (Basket or Paddle) with stirring rate (75 rpm
and 100 rpm) and found USP Apparatus-I (Basket) with 100 rpm is
110
suitable for this formulation. Samples were collected at appropriate
time intervals from dissolution vessels and diluted the samples and
measured the absorbance at 270nm using UV-Visible
spectrophotometer (Analytikjena Specord 210,) and calculated using
standard calibration curve.
6.2.1.1 Standard calibration curve of Citicoline
6.2.1.1.1 Preparation of pH 6.8 Phosphate buffer
Dissolve about 6.8gm of Potassium dihydrogen phosphate in
1000 mL of water. Adjust pH to 6.8 ± 0.05 with dilute sodium
hydroxide.
6.2.1.1.2 Preparation of standard stock solution
65.3 mg of Citicoline monosodium (equivalent to 62.5mg of
Citicoline) weighed in to 50mL volumetric flask and made up the
volume with pH 6.8 Phosphate buffer. 2mL of this solution further
diluted to 50mL with pH 6.8 Phosphate buffer. Filtered the solution
through 0.45µ nylon filter.
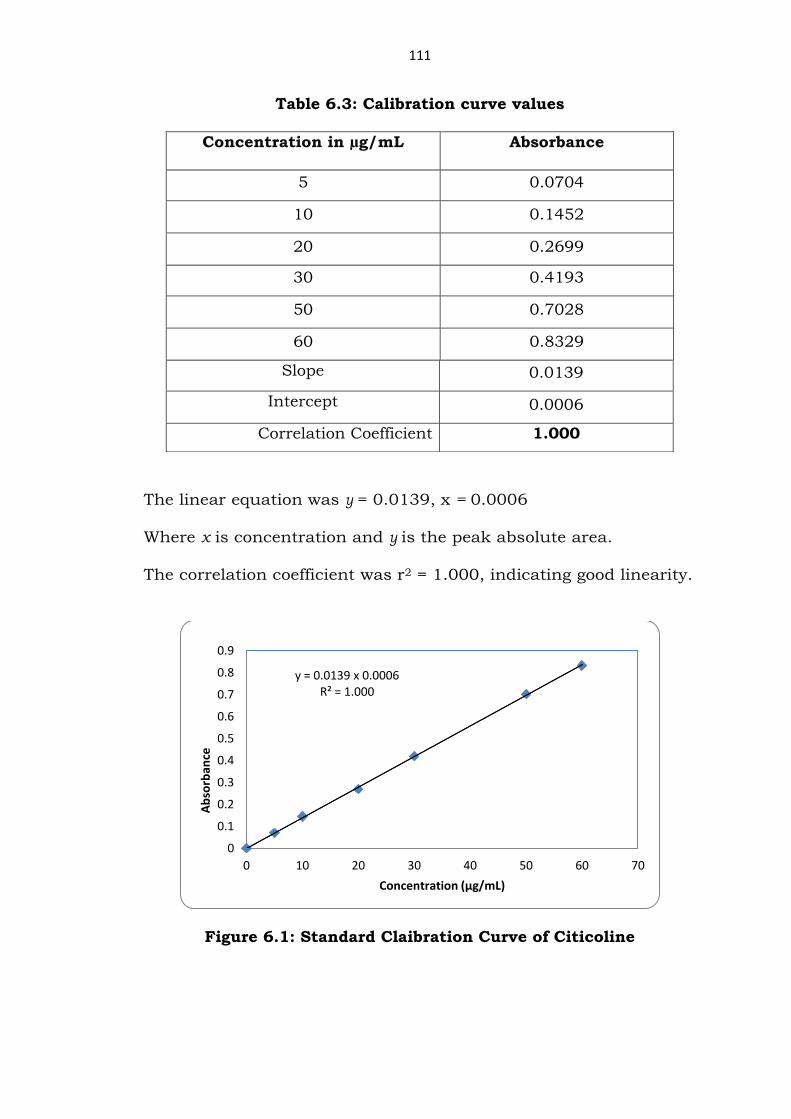
6.2.1.1.3 Preparation of Standard Calibration Curve
From the standard stock solution serial dilution were done to
obtain solutions ranging from 5.0µg/mL to 60µg/mL, i.e. from 10% to
120% with respect to sample concentration. The absorbance of above
solutions was measured at wavelength of 270nm using UV-Visible
spectrophotometer (Analytik jena), against dissolution media as blank.
The absorbance values of standard curve was represented in table
6.3and a graph was plotted of concentration v/s absorbance which
was shown in Fig. 6.1
111
Table 6.3: Calibration curve values
The linear equation was y = 0.0139, x = 0.0006
Where x is concentration and y is the peak absolute area.
The correlation coefficient was r2 = 1.000, indicating good linearity.
Figure 6.1: Standard Claibration Curve of Citicoline
y = 0.0139 x 0.0006 R² = 1.000
0
0.1
0.2
0.3
0.4
0.5
0.6
0.7
0.8
0.9
0 10 20 30 40 50 60 70
Ab
sorb
ance
Concentration (µg/mL)
Concentration in µg/mL Absorbance
5 0.0704
10 0.1452
20 0.2699
30 0.4193
50 0.7028
60 0.8329
Slope 0.0139
Intercept 0.0006
Correlation Coefficient 1.000
112
6.2.2 Assay by HPLC
6.2.2.1 Method development
Different columns, mobile phases, flow and column
temperatures were tested in the development of the analytical method.
C-8 and C-18 columns of the same length, different lengths and
diameters were also tested and pH of buffer variations from 4.0 to 6.5
were also tested by keeping all parameters and conditions were
constant (0.8 mL/min., injection volume of 20µL, temperature at
25°C). Then the mobile phases with different buffer concentrations
and organic content were also tested by keeping the all parameters
and conditions were constant. Finally we got the good
chromatographic peak with more than 5000 theoretical plates, tailing
factor of less than 2.0 and Relative standard deviation of less than
2.0% for six replicate standard injections.
6.2.2.1.1 Preparation of dilute acetic acid
12.0 mL of acetic acid was diluted to 100mL with purified water.
6.2.2.1.2 Preparation of Buffer
1.697g of Tetra butyl ammonium hydrogen sulphate was
dissolved in 100 mL of purified water; 2mL of Triethyl amine added
and adjusted the pH to 6.0 with diluted acetic acid.
6.2.2.1.3 Preparation of mobile phase
Prepared and degassed mixture of buffer and acetonitrile in the
ratio of 75:25%v/v.
Diluent: Mobile phase used as diluent

113
6.2.2.1.4 Chromatographic conditions
Column : C18, 250×4.6mm 5µ or equivalent
Flow rate : 0.8mL/min
Detection : 270nm
Injection volume : 20µL
Column Temperature : 25°C
Run time : 10min
6.2.2.1.5 Standard preparation
52.25mg of Citicoline sodium (equivalent to 50mg of Citicoline)
weighed accurately in to 100 ml volumetric flask, dissolved and made
up the volume with 100mL with diluent. 5mL of this solution was
diluted to 50mL of diluent and mixed well.
6.2.2.2 Method validation76
The system suitability linearity, accuracy and precision of the
method were validated.
The specificity of test method by HPLC was demonstrated that
the excipients from tablets do not interfere with the analytic peak. The
linearity of the method was tested in the concentration range
5.04µg/mL to 60.48µg/mL (10.0% to 120.0%).For accuracy of the
method, standard drug was spiked from 70% to 130.0% and recovery
was found to be 99.3% to 100.3% and RSD 0.5%. The precision of the
method was checked were found to be relative standard deviation
1.1%.

114
Table 6.4: Linearity
Figure 6.2: Citicoline Assay Linearity graph
Table 6.5: Accuracy/recovery
Level Actual weight of
Citicoline added in mg % in mg recovery
% recovery
70% 35.30 35.4 100.3
100% 50.20 50.0 99.7
130% 65.10 64.6 99.3
Mean 99.7
SD 0.50
%RSD 0.50
y = 25434 x -16967.4 R² = 1.000
0
200000
400000
600000
800000
1000000
1200000
1400000
1600000
1800000
0 10 20 30 40 50 60 70
Ab
sorb
ance
Concentration (µg/mL)
Concentration in µg/mL Peak Area
5.05 126981
10.1 250963
20.2 513926
30.3 754889
50.5 1259816
60.6 1532579
Slope 25434.0
Intercept -6967.4
Correlation Coefficient 1.000

115
Table 6.6: Precision
S.No. % Assay
1 100.9
2 99.1
3 99.8
4 101.0
5 98.2
6 99.2
Average 99.7
SD 1.10
% RSD 1.1
Figure 6.3: Citicoline Assay Standard
6.3 PRE-FORMULATION
6.3.1 Solubility Analysis
The solubility of Citicoline was determined in different media as
follows.
1. 0.1N HCl,
2. pH 4.5 Acetate buffer
3. pH 6.8 phosphate buffer
4. Purified water

116
1.0gm of Citicoline was weighed and transferred to separate 100
mL volumetric flasks. To each of the volumetric flasks above
mentioned media were added and shaken well. The volume was made
up to volume with same media the samples were kept in constant
water bath shaker for 24 hours at temperature of 37 °C. After 24
hours the samples were removed from bath, equilibrated for 1 hr. then
the samples were filtered through 0.45 μm filter.
The dissolved citicoline was measured using UV-Visible
spectrophotometer at 270 nm after suitable dilutions.
6.3.2 Compatibility Studies
6.3.2.1 Differential Scanning Calorimetry
Compatibility study of Citicoline with polymers was checked by
Differential Scanning Calorimetry at a heating rate 20°C/min over a
temperature range of 25-400°C under nitrogen flow of 25 mL min-1 for
maintaining inert atmospheres. The sample was hermetically sealed in
an aluminium crucible. Compatibility of the both materials will be
identified by observing any changes occur in melting points of the
drug.
6.3.2.2 Fourier Transform Infra-Red (FT-IR) spectral analysis
Compatibility of Citicoline with polymers was checked by
Fourier–Transformed Infrared (FT–IR) spectrums. spectrums were
taken individually and in combinations at range of 400 to 4000 cm-1
and the resolution was 1 cm-1 using Perkin Elmer, spectrum-100,
Japan with the KBr disk method (2 mg sample in 200 mg KBr).
117
6.4 PREPARATION OF MATRIX TABLETS
6.4.1 Preparation of matrix tablets containing Citicoline
The matrix tablets were prepared by wet granulation method by
using non-aqueous solvent. The composition of the tablet
formulations studies are represented in the Table 6.7.the procedure
as follows,
Step-1: The required amount of drug, polymers and diluents were
mixed in a SS container.
Step-2: Polymer was added to require amount of acetone under
continues stirring till dissolve or suspended.
Step-3: Step-1 material granulated using step-2 binder solution by
mixing thoroughly till wet mass forms and the wet mass was passed
through 14# mesh to obtain wet granules.
Step-4: The wet granules were transferred into a tray and dried in
hot air oven at 60 ± 5°C as inlet temperature until the LOD reaches
below 3.0 %.
Step-5: The dried granules were sifted through 20# mesh.
Step-6: The dried granules were mixed with colloidal silicone dioxide
(previously sifted through 40# mesh) and Magnesium stearate
(previously sifted through 60# mesh) for 5 min.
Step-7: Lubricated granules were compressed into tablets on
compression machine by using 22 x 10 mm oval shape punch for the
tablet size of 1580mg and 20 x 10 mm oval shape punch for the
tablet size of 1280 to 1420 mg.

118
Step-8: Preparation of coating solution
Eudragit RLPO was weighed, passed through 40# mesh and
dispersed into required amount of acetone and isopropyl alcohol (1:1)
mixture under continuous stirring. Talc and titanium dioxide was
weighed, mixed in mortar and festal, sifted through 80# mesh and
added to above mixture under stirring. Triacetin was weighed and
added to above solution under stirring. The solution was stirred for
45 minutes after addition of all ingredients.
Step-9: Tablets were coated using above prepared coating solution
using Conventional coating pan at drying temperature 55°C.

119
Table 6.7: Composition of matrix tablet containing Citicoline
S.No
Ingredients
mg/tablet
CTC/01 CTC/02 CTC/03 CTC/04 CTC/05 CTC/06 CTC/07 CTC/08 CTC/09 CTC/10 CTC/11 CTC/12 CTC/13 CTC/14 CTC/15 CTC/16
1 Citicoline Sodium
1045.00 1045.00 1045.00 1045.00 1045.00 1045.00 1045.00 1045.00 1045.00 1045.00 1045.00 1045.00 1045.00 1045.00 1045.00 1045.00
2 MCC Avicel PH101
102.00 42.00 42.00 52.00 102.00 42.00 42.00 52.00 102.00 42.00 42.00 52.00 102.00 42.00 42.00 52.00
3 HPMC K 100 M 100.00 160.00 300.00 450.00 --- --- --- --- --- --- --- --- --- --- --- ---
4 HPC HF --- --- --- --- 100.00 160.00 300.00 450.00 --- --- --- --- --- --- --- ---
5 Eudrogit RLPO --- --- --- --- --- --- --- --- 100.00 160.00 300.00 450.00 --- --- --- ---
6 Eudrogit RSPO --- --- --- --- --- --- --- --- --- --- --- --- 100.00 160.00 300.00 450.00
7 Acetone QS QS QS QS QS QS QS QS QS QS QS QS QS QS QS QS
8 CSD 15.00 15.00 15.00 15.00 15.00 15.00 15.00 15.00 15.00 15.00 15.00 15.00 15.00 15.00 15.00 15.00
9 Magnesium Stearate
18.00 18.00 18.00 18.00 18.00 18.00 18.00 18.00 18.00 18.00 18.00 18.00 18.00 18.00 18.00 18.00
Tablet Weight (Core) 1280.0 1280.0 1420.0 1580.0 1280.0 1280.0 1420.0 1580.0 1280.0 1280.0 1420.0 1580.0 1280.00 1280.0 1420.0 1580.0
10 Eudragit RLPO 12.25 12.25 12.25 12.25 12.25 12.25 12.25 12.25 12.25 12.25 12.25 12.25 12.25 12.25 12.25 12.25
11 Talc 5.10 5.10 5.10 5.10 5.10 5.10 5.10 5.10 5.10 5.10 5.10 5.10 5.10 5.10 5.10 5.10
12 Titanium Dioxide 1.50 1.50 1.50 1.50 1.50 1.50 1.50 1.50 1.50 1.50 1.50 1.50 1.50 1.50 1.50 1.50
13 Triacetin 1.15 1.15 1.15 1.15 1.15 1.15 1.15 1.15 1.15 1.15 1.15 1.15 1.15 1.15 1.15 1.15
14 Acetone : Isopropyl Alcohol (50:50 %)
QS QS QS QS QS QS QS QS QS QS QS QS QS QS QS QS
Tablet Weight (Coated) 1300.00 1300.00 1440.0 1600.0 1300.00 1300.0 1440.00 1600.0 1300.00 1300.0 1440.00 1600.0 1300.00 1300.0 1440.00 1600.0
MCC-Microcrystalline Cellulose, HPMC- Hydroxypropyl Methylcellulose, HPC- Hydroxypropyl cellulose, CSD-
Colloidal silicone dioxide

120
6.5 EVALUATION OF TABLETS
6.5.1 Evaluation of physical parameters for granules
6.5.1.1 Flowability78,79
Flowablility of lubricated granule were tested by using Bulk
density, Tap density, Compressibility, Hausner’s ratio and Angle of
repose.
The bulk density of prepared granules were determined by three-tap
method. Weighed quantity (15gm of granules) was carefully introduced
in to a 100mL graduated cylinder. The cylinder was dropped on to a
hard wood surface 3 times from a height of 2.5cm at an interval of
2sec. The bulk density was obtained by dividing weight of the sample
by volume of the sample.
The tap density is the ratio of weigth of the dry its tapped
volume. The above weighed quantity of granules was placed on tapped
density tester (Electrolab Model:ETD-1020) and subjected to USP –
Type II method i.e, 250 drops per minute and drop height is 3 mm ±
10%. The volume of the powdered weight is measured after increment
of 250 drops until the difference of last two values mean is zero.
Bulk Density =
Tapped Density =
Compressibility Index (%) and Hausner’s Ratio Can calculated by
using the following formulas.
=
×100
Hausner’s Ratio =
121
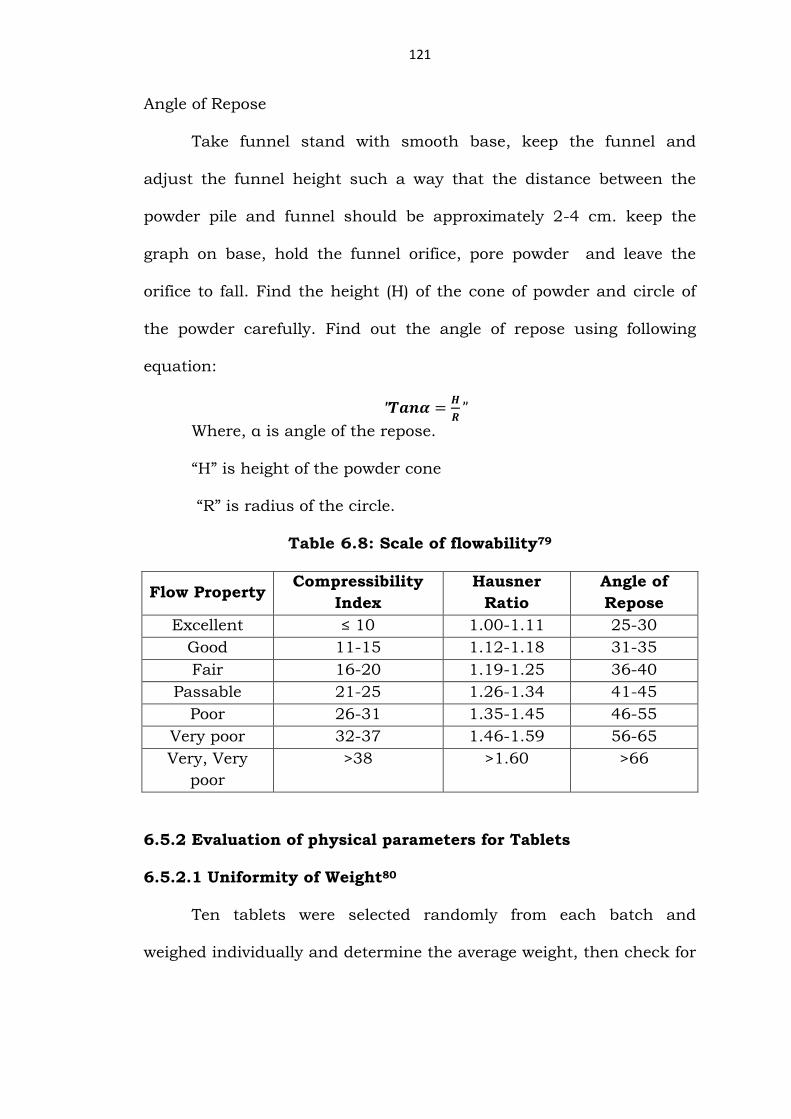
Angle of Repose
Take funnel stand with smooth base, keep the funnel and
adjust the funnel height such a way that the distance between the
powder pile and funnel should be approximately 2-4 cm. keep the
graph on base, hold the funnel orifice, pore powder and leave the
orifice to fall. Find the height (H) of the cone of powder and circle of
the powder carefully. Find out the angle of repose using following
equation:
"
Where, α is angle of the repose.
“H” is height of the powder cone
“R” is radius of the circle.
Table 6.8: Scale of flowability79
Flow Property Compressibility
Index
Hausner
Ratio
Angle of
Repose
Excellent ≤ 10 1.00-1.11 25-30
Good 11-15 1.12-1.18 31-35
Fair 16-20 1.19-1.25 36-40
Passable 21-25 1.26-1.34 41-45
Poor 26-31 1.35-1.45 46-55
Very poor 32-37 1.46-1.59 56-65
Very, Very
poor
>38 >1.60 >66
6.5.2 Evaluation of physical parameters for Tablets
6.5.2.1 Uniformity of Weight80
Ten tablets were selected randomly from each batch and
weighed individually and determine the average weight, then check for
122
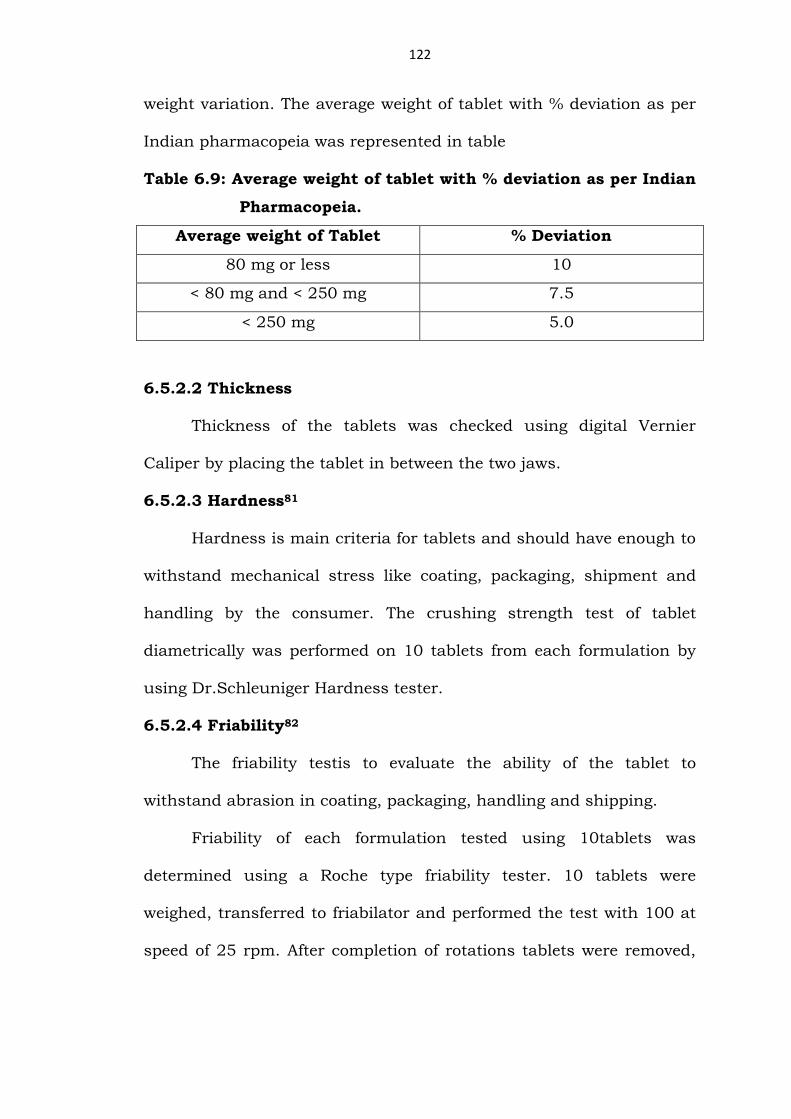
weight variation. The average weight of tablet with % deviation as per
Indian pharmacopeia was represented in table
Table 6.9: Average weight of tablet with % deviation as per Indian
Pharmacopeia.
Average weight of Tablet % Deviation
80 mg or less 10
< 80 mg and < 250 mg 7.5
< 250 mg 5.0
6.5.2.2 Thickness
Thickness of the tablets was checked using digital Vernier
Caliper by placing the tablet in between the two jaws.
6.5.2.3 Hardness81
Hardness is main criteria for tablets and should have enough to
withstand mechanical stress like coating, packaging, shipment and
handling by the consumer. The crushing strength test of tablet
diametrically was performed on 10 tablets from each formulation by
using Dr.Schleuniger Hardness tester.
6.5.2.4 Friability82
The friability testis to evaluate the ability of the tablet to
withstand abrasion in coating, packaging, handling and shipping.
Friability of each formulation tested using 10tablets was
determined using a Roche type friability tester. 10 tablets were
weighed, transferred to friabilator and performed the test with 100 at
speed of 25 rpm. After completion of rotations tablets were removed,

123
dedusted and weighed. Friability of tablet should not be more than
1.0%.
Friability percentage was calculated using the following equation:
× 100
6.5.3 Drug content by HPLC
20 tablets were weighed accurately and determined average
tablet weight in mg. Tablets were crushed into fine powder. Powder
weighed equivalents to 50 mg of Citicoline in to 100mL volumetric
flask, add 60 mL of diluent and sonicated for 10 min. to dissolve.
Cooled the solution to room temperature and made up the
volume with diluent. 5 mL of the above solution was diluted to 50 mL
volumetric flask, made up the volume with diluent and mixed well.
Solution was filtered through 0.45µm nylon filter. Citicoline was
estimated by HPLC using developed method step: 6.2.2.
6.5.4 In-vitro Dissolution Study: by UV
In-vitro drug release studies were carried out using below parameters
Apparatus : USP- I (Basket)
Medium : Phosphate Buffer pH 6.8
Volume (mL) : 900
Revolutions (RPM) : 100
Temperature (°C) : 37±0.5
Specified Time (Hours) : 1, 3, 6, 9 and 12

124
6.5.4.1 Test Solution
900mL of dissolution medium was filled in to each of the six
dissolution vessels. One tablet in to each dissolution vessel
transferred and started the dissolution test. 10ml of aliquots was
withdrawn at regular interval and replaced with equal volume of fresh
dissolution medium to maintain the volume constant. Solution was
filtered through 0.45µ nylon. First 3mL of the filtrate was discarded,
diluted and analysed for drug content. The amount of drug released
was determined by UV at 270 nm.
6.5.4.2 Statistical approach to difference and similar factor83
Statistical models such as Difference factor (f1) and similar
factor (f2) both were constructed for optimised batch and marketed
product dissolution profile by using following equations.
Difference Factor f1={[∑t=1n (Rt-Tt)]/[ ∑t=1
n Rt]} x 100
Similar Factor f2=50 x log{[1+(1/n)∑t=1n (Rt-Tt)2]-0.5 x 100
Where,
n is number of time points.
R(t) is the mean % drug dissolved of reference product at time t.
T(t) is the mean % drug dissolved of test product.
f1 value should be close to 0 (0 to 15) to prove the both the
formulations are not different.
f2 value should be between 50 to 100 to prove the both the
formulations are similar.
125
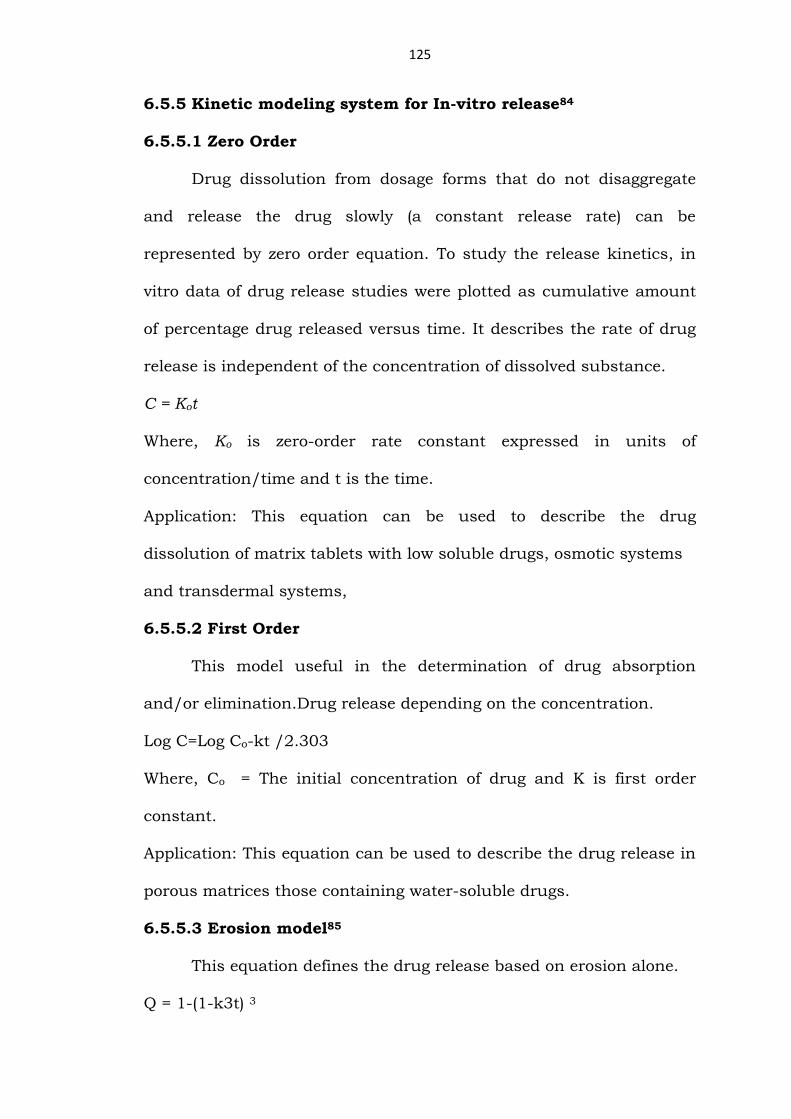
6.5.5 Kinetic modeling system for In-vitro release84
6.5.5.1 Zero Order
Drug dissolution from dosage forms that do not disaggregate
and release the drug slowly (a constant release rate) can be
represented by zero order equation. To study the release kinetics, in
vitro data of drug release studies were plotted as cumulative amount
of percentage drug released versus time. It describes the rate of drug
release is independent of the concentration of dissolved substance.
C = Kot
Where, Ko is zero-order rate constant expressed in units of
concentration/time and t is the time.
Application: This equation can be used to describe the drug
dissolution of matrix tablets with low soluble drugs, osmotic systems
and transdermal systems,
6.5.5.2 First Order
This model useful in the determination of drug absorption
and/or elimination.Drug release depending on the concentration.
Log C=Log Co-kt /2.303
Where, Co = The initial concentration of drug and K is first order
constant.
Application: This equation can be used to describe the drug release in
porous matrices those containing water-soluble drugs.
6.5.5.3 Erosion model85
This equation defines the drug release based on erosion alone.
Q = 1-(1-k3t) 3

126
Where, Q is the fraction of drug released at time t, k3 is the release
rate constant. Thus, a plot between [1-(1-Q) 1/3] against time will be
linear if the release obeys erosion equation.
6.5.5.4 Korsmeyer-Peppas model
To find the drug release mechanism first 60% drug release data
were fitted in Korsmeyer-Peppas model, which described drug release
from a polymeric system equation. To study release kinetics, in vitro
drug release data was plotted as log cumulative % drug release versus
log time.
Mt / M∞= Ktn
Where Mt / M∞ = a fraction of drug released at time t,
K = The release rate constant and n is the release exponent. The n
value is used to characterize different mechanism of drug release for
cylindrical shaped matrices.
6.5.5.5 Higuchi’s Model
The first mathematical model which describes drug release from
a matrix system proposed by Higuchi in 1961. It is applicable for
planar systems initially; it was then extended to different geometrics
and porous systems.
Q=KH x T1/2
KH = The Higuchi dissolution constant
The values of cumulative percentage drug release versus square root
of time.
Application: This can be used to describe the drug release from matrix
tablets with water soluble drugs and transdermal systems.

127
6.6 STABILITY STUDIES86
Stability study of selected formulation was tested according to
international conference of harmonization guidelines. The tablets was
stored in Alu-Alu blister for 3 months in stability chamber at 40°C±
2°C&75% ± 5 % RH. Stability samples were tested for Physical, drug
content and in vitro dissolution.
128
6.7 RESULTS
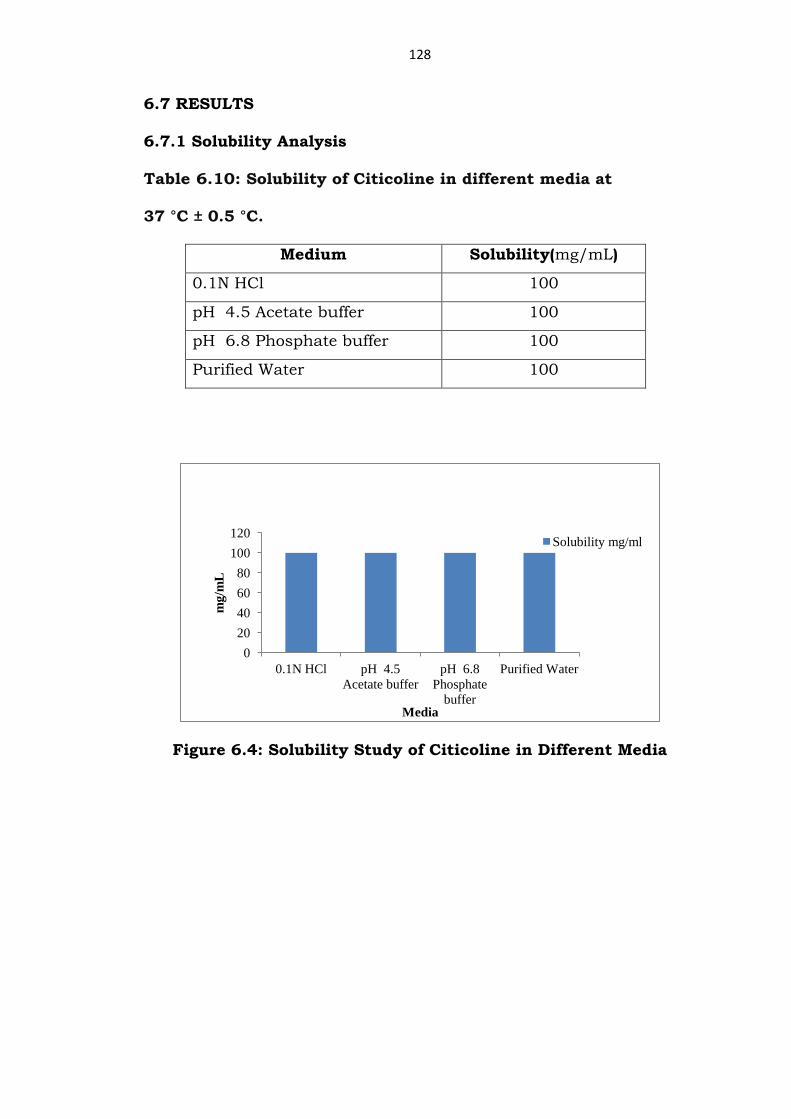
6.7.1 Solubility Analysis
Table 6.10: Solubility of Citicoline in different media at
37 °C ± 0.5 °C.
Medium Solubility(mg/mL)
0.1N HCl 100
pH 4.5 Acetate buffer 100
pH 6.8 Phosphate buffer 100
Purified Water 100
Figure 6.4: Solubility Study of Citicoline in Different Media
0
20
40
60
80
100
120
0.1N HCl pH 4.5
Acetate buffer
pH 6.8
Phosphate
buffer
Purified Water
mg
/mL
Media
Solubility mg/ml

129
6.7.2 Compatibility Studies
6.7.2.1 Differential Scanning calorimetry
100.00 200.00 300.00Temp [C]
-40.00
-20.00
0.00
20.00
40.00
mWDSC
122.52 x100COnset
132.46 x100CEndset
126.86 x100CPeak
-1.29 x100J
-322.55 x100J/g
Heat
264.92 x100COnset
271.63 x100CEndset
272.41 x100CPeak
1.62 x100J
403.97 x100J/g
Heat
Citocolin Sodium
Figure 6.5: DSC of Citicoline
100.00 200.00 300.00 400.00Temp [C]
-0.00
10.00
mWDSC
257.63 x100COnset
270.34 x100CEndset
266.28 x100CPeak
782.54 x100mJ
195.63 x100J/g
Heat
123.32 x100COnset
151.28 x100CEndset
134.17 x100CPeak
-534.36 x100mJ
-133.59 x100J/g
Heat
Citicoline +HPMCK100M
Figure 6.6: DSC of Citicoline with HPMC K100M
130
100.00 200.00 300.00Temp [C]
-5.00
0.00
5.00
mWDSC
128.50x100COnset
153.77x100CEndset
143.19x100CPeak
-937.58x100mJ
-234.40x100J/g
Heat
255.83x100COnset
271.06x100CEndset
261.13x100CPeak
452.35x100mJ
113.09x100J/g
Heat
Citicoline + HPC
Figure 6.7: DSC of Citicoline with Hydroxypropyl Cellulose HF
100.00 200.00 300.00Temp [C]
-10.00
0.00
10.00
mWDSC
125.43 x100COnset
151.81 x100CEndset
144.28 x100CPeak
-620.56 x100mJ
-155.14 x100J/g
Heat
256.50x100COnset
268.95x100CEndset
263.76x100CPeak
696.28x100mJ
174.07x100J/g
Heat
Citicoline + Eudragit RLPO
Figure 6.8: DSC of Citicoline with Eudragit RLPO
131
100.00 200.00 300.00Temp [C]
-6.00
-4.00
-2.00
0.00
mWDSC
116.79x100COnset
142.37x100CEndset
133.20x100CPeak
-898.67x100mJ
-224.67x100J/g
Heat
251.85x100COnset
265.06x100CEndset
257.73x100CPeak
226.92x100mJ
56.73x100J/g
Heat
Citicoline + Eudragit RSPO
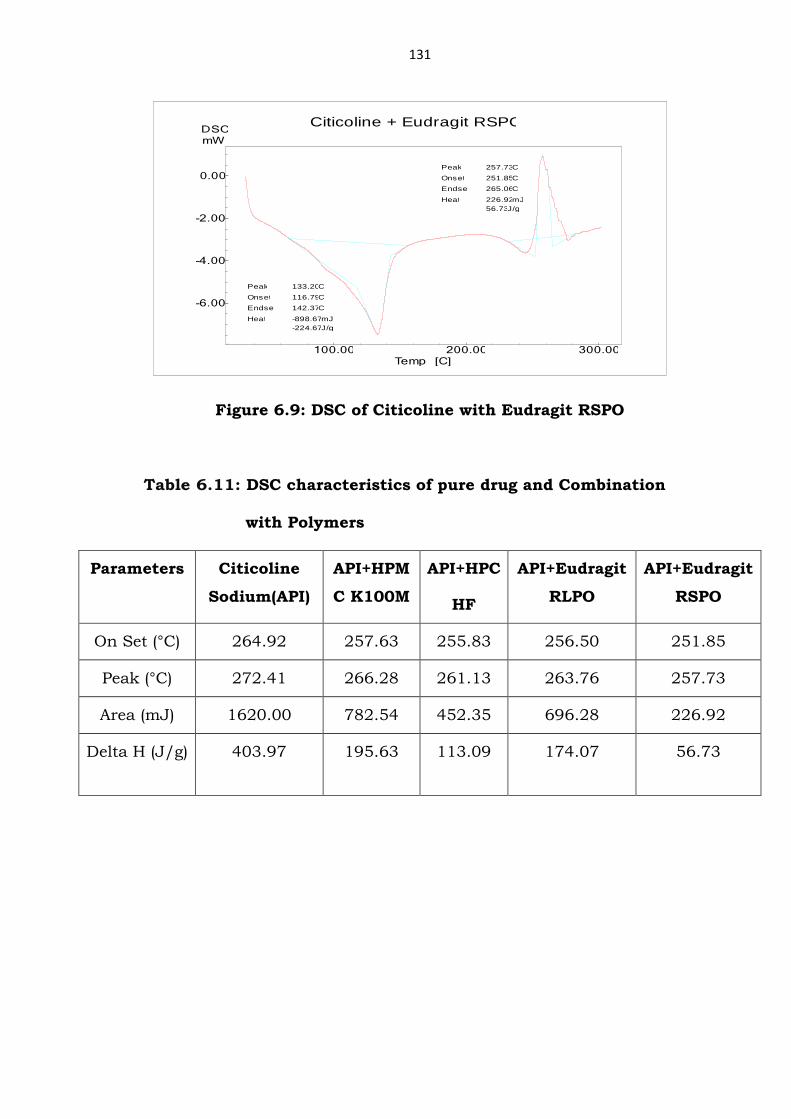
Figure 6.9: DSC of Citicoline with Eudragit RSPO
Table 6.11: DSC characteristics of pure drug and Combination
with Polymers
Parameters Citicoline
Sodium(API)
API+HPM
C K100M
API+HPC
HF
API+Eudragit
RLPO
API+Eudragit
RSPO
On Set (°C) 264.92 257.63 255.83 256.50 251.85
Peak (°C) 272.41 266.28 261.13 263.76 257.73
Area (mJ) 1620.00 782.54 452.35 696.28 226.92
Delta H (J/g) 403.97 195.63 113.09 174.07 56.73

132
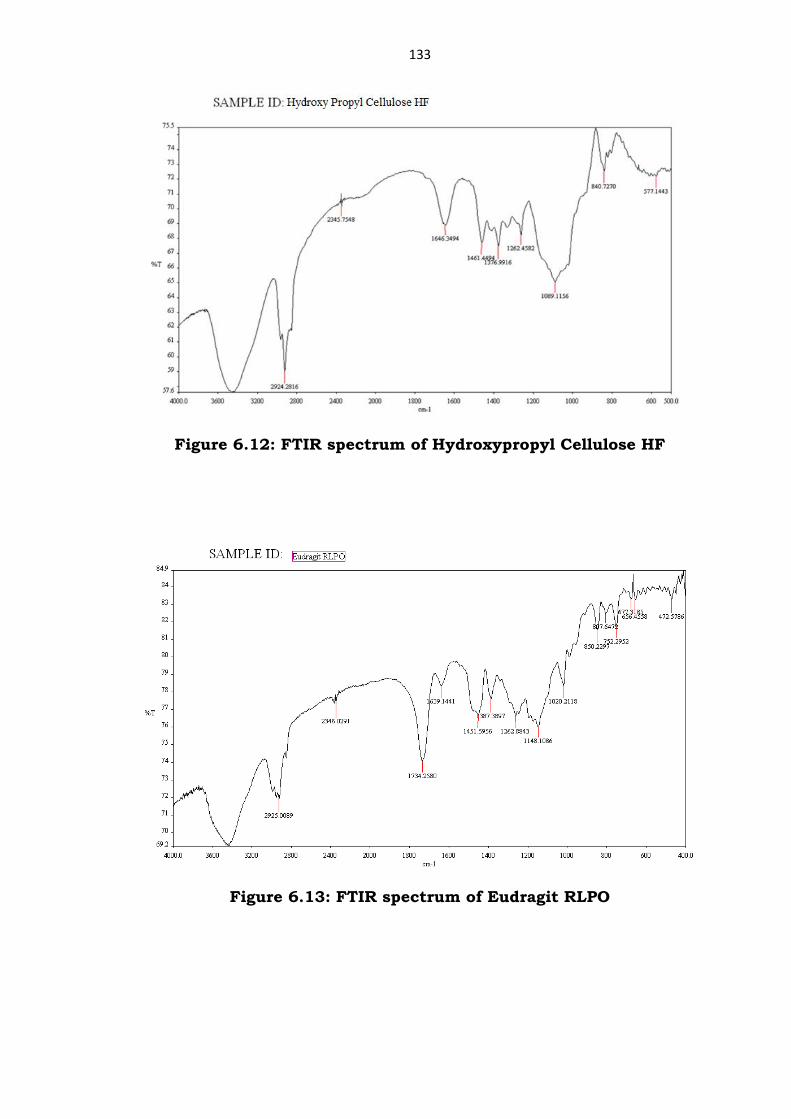
6.7.2.2 Fourier Transform Infra-Red (FT-IR) spectral analysis
Figure 6.10: FTIR spectrum of Citicoline
Figure 6.11: FTIR spectrum of HPMC K100M
133
Figure 6.12: FTIR spectrum of Hydroxypropyl Cellulose HF
Figure 6.13: FTIR spectrum of Eudragit RLPO

134
Figure 6.14: FTIR spectrum of Eudragit RSPO
Figure 6.15: FTIR Spectrum of Citicoline with HPMC K100M

135
Figure 6.16: FTIR Spectrum of Citicoline with HPC HF
Figure 6.17: FTIR Spectrum of Citicoline with Eudragit RLPO
136
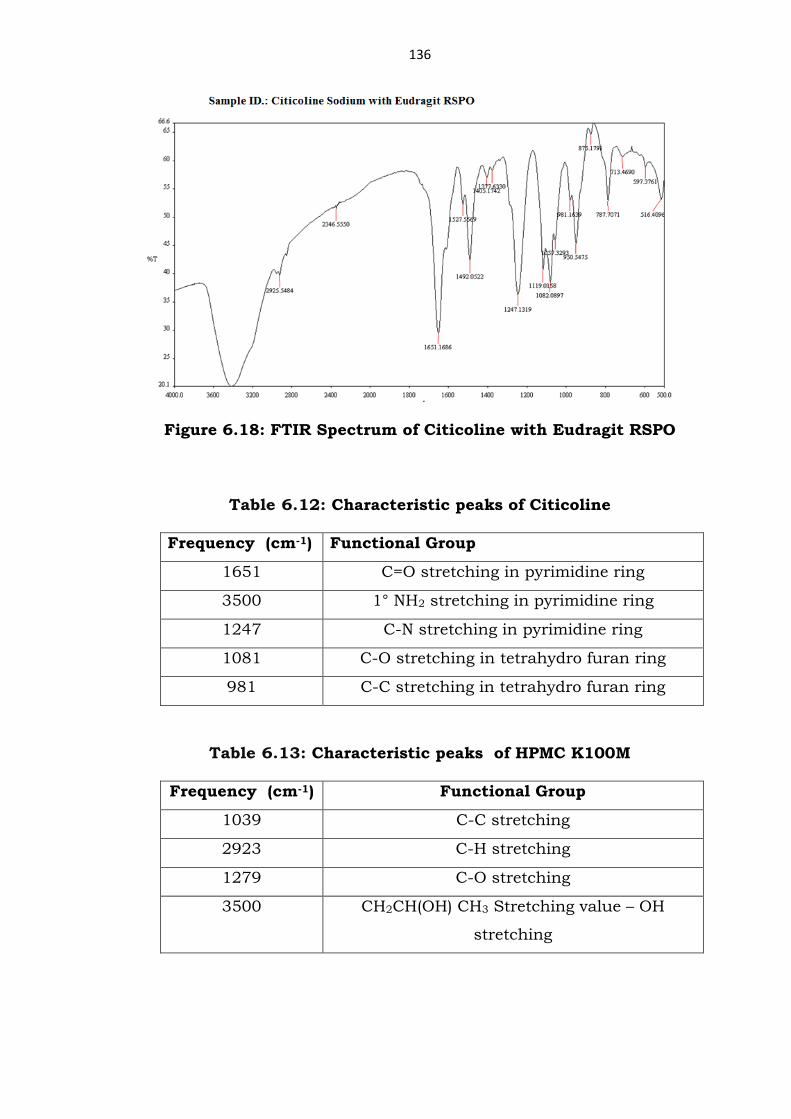
Figure 6.18: FTIR Spectrum of Citicoline with Eudragit RSPO
Table 6.12: Characteristic peaks of Citicoline
Frequency (cm-1) Functional Group
1651 C=O stretching in pyrimidine ring
3500 1° NH2 stretching in pyrimidine ring
1247 C-N stretching in pyrimidine ring
1081 C-O stretching in tetrahydro furan ring
981 C-C stretching in tetrahydro furan ring
Table 6.13: Characteristic peaks of HPMC K100M
Frequency (cm-1) Functional Group
1039 C-C stretching
2923 C-H stretching
1279 C-O stretching
3500 CH2CH(OH) CH3 Stretching value – OH
stretching
137
Table 6.14: Characteristic peaks of HPC HF
Frequency (cm-1) Functional Group
1089 C-C stretching
2924 C-H stretching
1262 C-O stretching
3500 CH2CH(OH) CH3 Stretching value – OH
stretching
Table 6.15: Characteristic peaks of Eudragit RLPO
Frequency (cm-1) Functional Group
1262 C-C stretching
2925 C-H stretching
1020 C-O stretching
1734 C=O stretching
Table 6.16: Characteristic peaks of Eudragit RSPO
Frequency (cm-1) Functional Group
1262 C-C stretching
2925 C-H stretching
1020 C-O stretching
1734 C=O stretching
Table 6.17: Characteric peaks of Citicoline + HPMC K100M
Frequency (cm-1) Functional Group
Citicoline
1651 C=O stretching
3500 -NH2 stretching in pyrimidine ring
HPMC K100 M
1081 C-C stretching
2924 C-H stretching
1243 C-O stretching
3500 CH2CH(OH) CH3 Stretching value – OH
stretching

138
Table 6.18: Characteristic peaks of Citicoline + HPC HF
Frequency (cm-1) Functional Group
Citicoline
1651 C=O stretching
3500 -NH2 stretching in pyrimidine ring
HPC HF
1081 C-C stretching
2924 C-H stretching
1243 C-O stretching
Table 6.19: Characteric peaks of Citicoline + Eudragit RLPO
Frequency (cm-1) Functional Group
Citicoline
1651 C=O stretching
3500 -NH2 stretching in pyrmidine ring
Eudragit RLPO
1082 C=O stretching
Table 6.20: Characteristic peaks of Citicoline + Eudragit RSPO
Frequency (cm-1) Functional Group
Citicoline
1655 C=O stretching
3500 -NH2 stretching in pyrmidine ring
Eudragit RSPO
1741 C=O stretching
1017 C-O stretching
2953 C-H stretching
1245 C-C stretching
139
6.7.3 Evaluation of Matrix Tablets
The tablets were evaluated for physical and chemical parameters.
6.7.3.1 Evaluation of physical parameters for granules
Table 6.21: Flowability
B.No.
Parameter
Bulk density
(gm/ml)
Tap density
(gm/ml)
Corr’s index
(%)
Hausners
ratio
Angle of
Repose(°)
CTC/01 0.435 0.607 28.3 1.39 48.2
CTC/02 0.327 0.422 22.5 1.29 43.5
CTC/03 0.347 0.448 22.5 1.29 42.8
CTC/04 0.366 0.578 36.6 1.57 56.5
CTC/05 0.380 0.500 24.0 1.31 43.2
CTC/06 0.318 0.406 21.7 1.28 42.3
CTC/07 0.348 0.429 18.9 1.23 36.4
CTC/08 0.366 0.440 16.8 1.202 37.1
CTC/09 0.348 0.445 21.79 1.27 42.8
CTC/10 0.487 0.634 23.2 1.30 41.9
CTC/11 0.568 0.679 16.3 1.20 36.7
CTC/12 0.458 0.589 22.24 1.28 42.7
CTC/13 0.361 0.425 15.05 1.17 36.4
CTC/14 0.495 0.625 20.8 1.26 37.2
CTC/15 0.521 0.659 21.1 1.27 41.4
CTC/16 0.500 0.571 12.4 1.14 31.6

140
6.7.3.2 Evaluation of physical parameters for Tablets
Table 6.22: Physical parameters of Core Tablets
B. No.
Parameters
Wt. of
individual
tablets(mg)
Hardness
(kp)
Thickness
(mm)
Friability
(%w/w)
CTC/01 1245-1315 36.7-39.8 6.75 - 6.83 0.14
CTC/02 1252-1313 38.7-40.7 6.74 - 6.82 0.21
CTC/03 1382-1440 37.0-40.0 6.82 - 6.93 0.19
CTC/04 1535-1625 35.2-40.5 6.86 - 6.94 0.15
CTC/05 1248-1314 35.4-40.9 6.73 - 6.81 0.13
CTC/06 1250-1310 36.2-41.0 6.74 - 6.81 0.1
CTC/07 1385-1442 35.6-41.3 6.81 - 6.92 0.1
CTC/08 1538-1623 36.6-39.4 6.85 - 6.94 0.1
CTC/09 1247-1313 36.5-39.3 6.71 - 6.84 0.14
CTC/10 1245-1316 37.7-39.5 6.72 - 6.80 0.21
CTC/11 1390-1437 37.2-39.7 6.81 - 6.94 0.19
CTC/12 1537-1627 35.5-40.3 6.87 - 6.94 0.15
CTC/13 1243-1310 35.0-37.9 6.72 - 6.80 0.14
CTC/14 1244-1314 35.1-38.4 6.74 - 6.82 0.16
CTC/15 1389-1438 34.9-38.0 6.82 - 6.94 0.12
CTC/16 1539-1623 34.7-39.4 6.85 - 6.93 0.11

141
Table 6.23: Physical evaluation of Coated tablets
B.No
Parameters
Wt. of
individual
tablets (mg)
Hardness
(kp)
Thickness
(mm)
CTC/01 1264-1336 36.7-39.8 6.78 - 6.85
CTC/02 1273-1334 38.7-40.7 6.73 - 6.84
CTC/03 1401-1461 37.0-40.0 6.85 - 6.95
CTC/04 1554-1663 35.2-40.5 6.89 - 6.97
CTC/05 1267-1336 35.4-40.9 6.77 - 6.84
CTC/06 1271-1332 36.2-41.0 6.78 - 6.84
CTC/07 1406-1461 35.6-41.3 6.85- 6.93
CTC/08 1559-1645 36.6-39.4 6.89 - 6.96
CTC/09 1266-1335 36.5-39.3 6.76 - 6.85
CTC/10 1266-1337 37.7-39.5 6.77 - 6.83
CTC/11 1411-1458 37.2-39.7 6.85 - 6.97
CTC/12 1556-1648 35.5-40.3 6.92 - 6.97
CTC/13 1264-1331 35.0-37.9 6.77 - 6.83
CTC/14 1263-1336 35.1-38.4 6.78 - 6.83
CTC/15 1410-1459 34.9-38.0 6.86 - 6.96
CTC/16 1560-1642 34.7-39.4 6.89 - 6.96

142
Figure 20: Photograph of prepared citicoline controlled release
Tablets (B. No: CTC/14)
6.7.3.3 Evaluation of Chemical parameters for Tablets
6.7.3.3.1 Drugu Content
Table 6.24: Drug Content
Parameter
BATCH NO
CTC/
01
CTC/
02
CTC/
03
CTC/
04
CTC/
05
CTC/
06
CTC/
07
CTC/
08
Drug
content (%)
99.6 99.9 99.6 99.1 99.5 99.2 99.8 99.6
CTC/
09
CTC/
10
CTC/
11
CTC/
12
CTC/
13
CTC/
14
CTC/
15
CTC/
16
99.2 99.7 99.3 100.7 100.1 100.8 100.6 100.8

143
6.7.3.3.2 In-vitro Dissolution Study
Table 6.25: Dissolution Study
B. No Cumulative % Drug Release
1hr 3hr 6hr 9hr 12hr
CTC/01 64.1 85.6 98.6 99.7 100.2
CTC/02 60.2 80.5 98.3 99.0 99.1
CTC/03 57.0 75.5 95.8 99.0 99.4
CTC/04 33.7 80.6 95.5 98.9 99.8
CTC/05 66.6 93.3 99.0 99.6 99.8
CTC/06 65.5 87.1 99.1 99.2 99.3
CTC/07 59.6 80.6 96.6 99.0 99.0
CTC/08 44.4 74.6 90.6 97.5 99.4
CTC/09 62.7 82.8 98.2 98.8 98.8
CTC/10 59.8 79.1 96.0 99.1 99.2
CTC/11 56.6 75.1 93.2 99.0 99.0
CTC/12 50.3 72.8 89.9 96.6 98.2
CTC/13 44.9 56.7 76.2 95.3 99.1
CTC/14 30.1 47.2 58.8 80.4 99.7
CTC/15 31.9 47.9 56.6 82.0 99.2
CTC/16 34.1 45.3 63.6 84.0 99.7
Figure 6.21: In-vitro release of formulations containing HPMC K100M retardant
0
20
40
60
80
100
120
0 1 2 3 4 5 6 7 8 9 10 11 12 13
% D
rug r
elea
se
Time in (hr.)
In-vitro release of formulations containg HPMC
K100M retardant
CTC/01
CTC/02
CTC/03
CTC/04
144
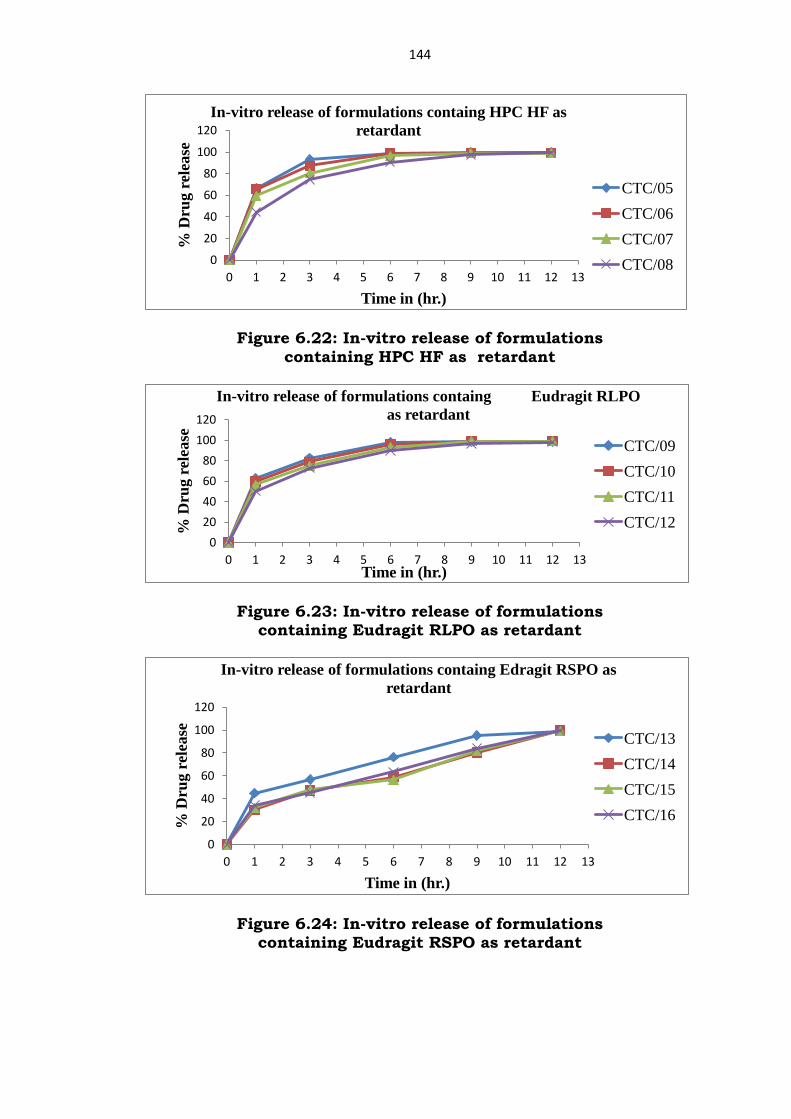
Figure 6.22: In-vitro release of formulations
containing HPC HF as retardant
Figure 6.23: In-vitro release of formulations containing Eudragit RLPO as retardant
Figure 6.24: In-vitro release of formulations containing Eudragit RSPO as retardant
0
20
40
60
80
100
120
0 1 2 3 4 5 6 7 8 9 10 11 12 13
% D
rug r
elea
se
Time in (hr.)
In-vitro release of formulations containg HPC HF as
retardant
CTC/05
CTC/06
CTC/07
CTC/08
0
20
40
60
80
100
120
0 1 2 3 4 5 6 7 8 9 10 11 12 13
% D
rug r
elea
se
Time in (hr.)
In-vitro release of formulations containg Eudragit RLPO
as retardant
CTC/09
CTC/10
CTC/11
CTC/12
0
20
40
60
80
100
120
0 1 2 3 4 5 6 7 8 9 10 11 12 13
% D
rug
rel
ease
Time in (hr.)
In-vitro release of formulations containg Edragit RSPO as
retardant
CTC/13
CTC/14
CTC/15
CTC/16

145
Table 6.26: Compilation of Dissolution Profile of optimized batch
with Market product
Time points Marketed Product CTC/14
1 hour 32.0 30.1
3 hour 53.1 47.3
6 hour 64.5 58.8
9 hour 84.7 80.4
12 hour 98.4 99.7
F2 value 67.91
F1 value 4.96
Table 6.27: Citicoline f1& f2 values
S.No B. No. Dissimilarity
factor ( f1)
Similarity
factor(f2 )
1. CTC/13 11.87 51.53
2. CTC/14 4.96 67.91
3. CTC/15 4.54 67.22
4. CTC/16 1.80 70.86
Figure 6.25: Comparison of in-vitro release of CTC/14 Marketed Product
0
20
40
60
80
100
120
0 1 2 3 4 5 6 7 8 9 10 11 12 13
% D
rug r
elea
se
Time (hr.)
Comparation of invitro release of CTC/14 with Marketed
Product
Marketed Product
CTC/014
146
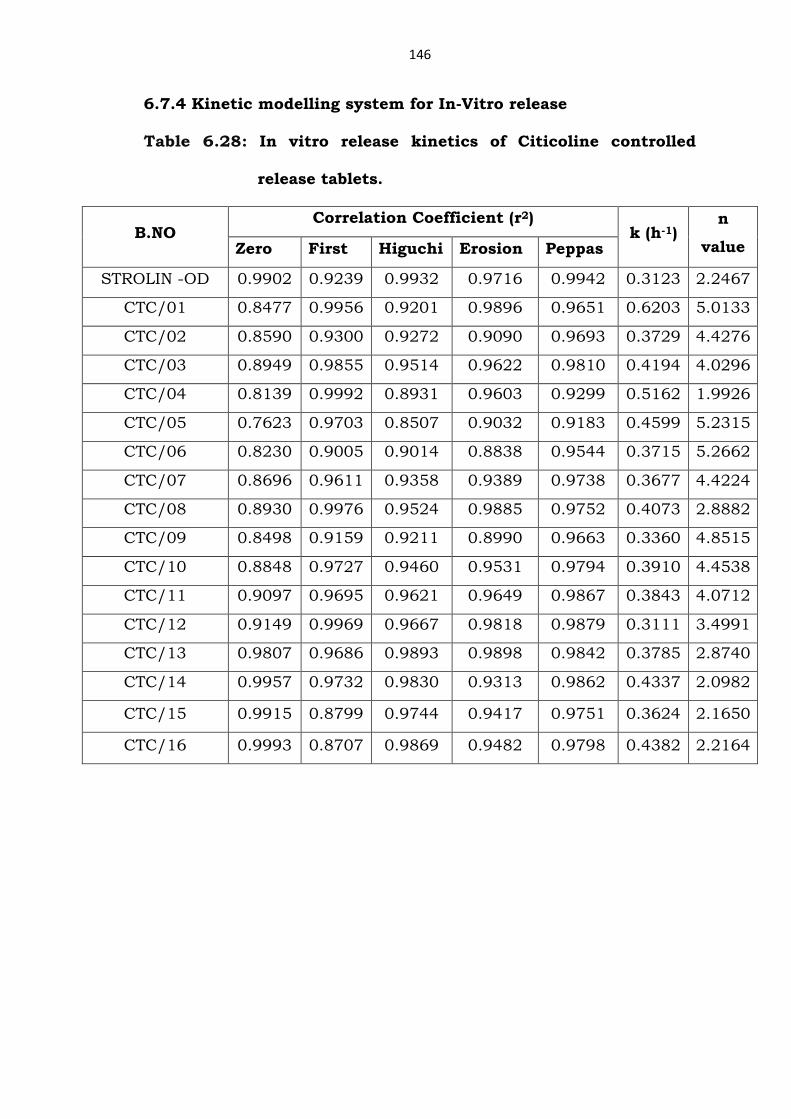
6.7.4 Kinetic modelling system for In-Vitro release
Table 6.28: In vitro release kinetics of Citicoline controlled
release tablets.
B.NO Correlation Coefficient (r2)
k (h-1) n
value Zero First Higuchi Erosion Peppas
STROLIN -OD 0.9902 0.9239 0.9932 0.9716 0.9942 0.3123 2.2467
CTC/01 0.8477 0.9956 0.9201 0.9896 0.9651 0.6203 5.0133
CTC/02 0.8590 0.9300 0.9272 0.9090 0.9693 0.3729 4.4276
CTC/03 0.8949 0.9855 0.9514 0.9622 0.9810 0.4194 4.0296
CTC/04 0.8139 0.9992 0.8931 0.9603 0.9299 0.5162 1.9926
CTC/05 0.7623 0.9703 0.8507 0.9032 0.9183 0.4599 5.2315
CTC/06 0.8230 0.9005 0.9014 0.8838 0.9544 0.3715 5.2662
CTC/07 0.8696 0.9611 0.9358 0.9389 0.9738 0.3677 4.4224
CTC/08 0.8930 0.9976 0.9524 0.9885 0.9752 0.4073 2.8882
CTC/09 0.8498 0.9159 0.9211 0.8990 0.9663 0.3360 4.8515
CTC/10 0.8848 0.9727 0.9460 0.9531 0.9794 0.3910 4.4538
CTC/11 0.9097 0.9695 0.9621 0.9649 0.9867 0.3843 4.0712
CTC/12 0.9149 0.9969 0.9667 0.9818 0.9879 0.3111 3.4991
CTC/13 0.9807 0.9686 0.9893 0.9898 0.9842 0.3785 2.8740
CTC/14 0.9957 0.9732 0.9830 0.9313 0.9862 0.4337 2.0982
CTC/15 0.9915 0.8799 0.9744 0.9417 0.9751 0.3624 2.1650
CTC/16 0.9993 0.8707 0.9869 0.9482 0.9798 0.4382 2.2164

147
Figure 6.26: Zero order plots for B. No: CTC/14
0
20
40
60
80
100
120
0 2 4 6 8 10 12 14
Co
mu
lati
ve p
erce
nt
dru
g re
leas
e (
%)
Time (hr)
STROLIN -OD
CTC/14
Linear (STROLIN -OD)
Linear (CTC/14)
148
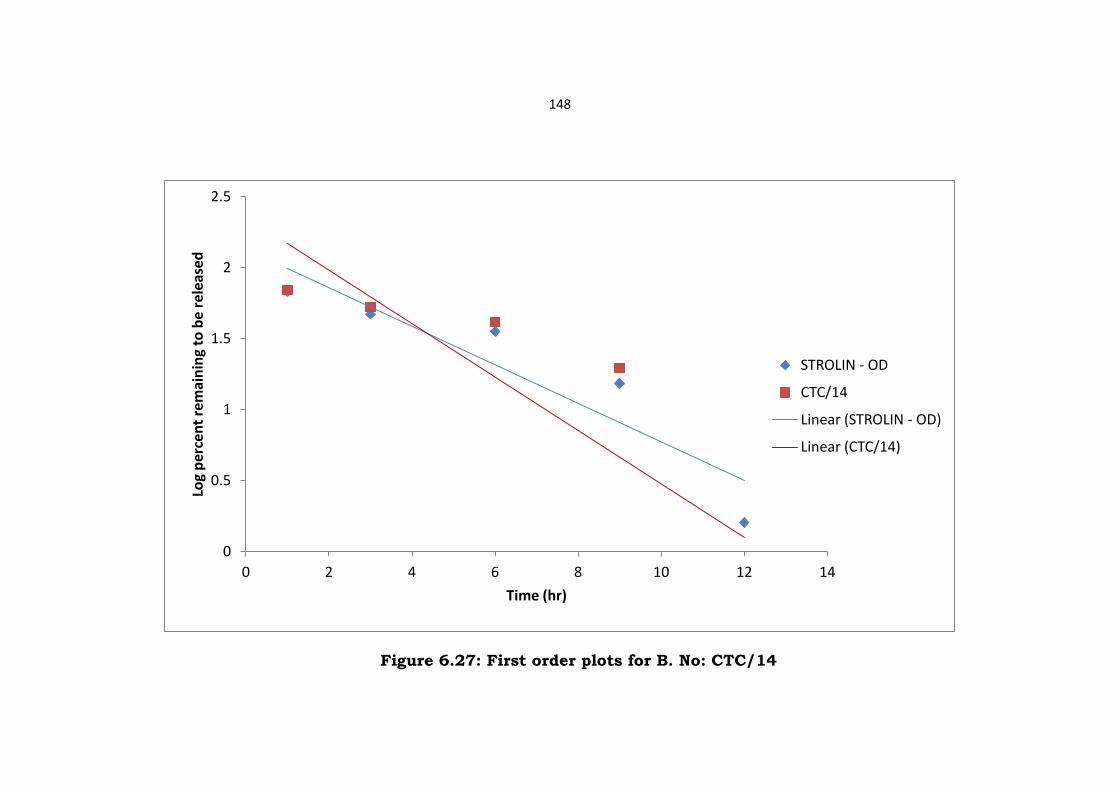
Figure 6.27: First order plots for B. No: CTC/14
0
0.5
1
1.5
2
2.5
0 2 4 6 8 10 12 14
Log
per
cen
t re
mai
nin
g to
be
rele
ase
d
Time (hr)
STROLIN - OD
CTC/14
Linear (STROLIN - OD)
Linear (CTC/14)

149
Figure 6.28: Higuchi plots for B. No: CTC/14
0
20
40
60
80
100
120
0.000 0.500 1.000 1.500 2.000 2.500 3.000 3.500 4.000
Co
mu
lati
ve p
erc
en
t d
rug
rele
ase
(%
)
Square root time (hr)
STROLIN - OD
CTC/14
150
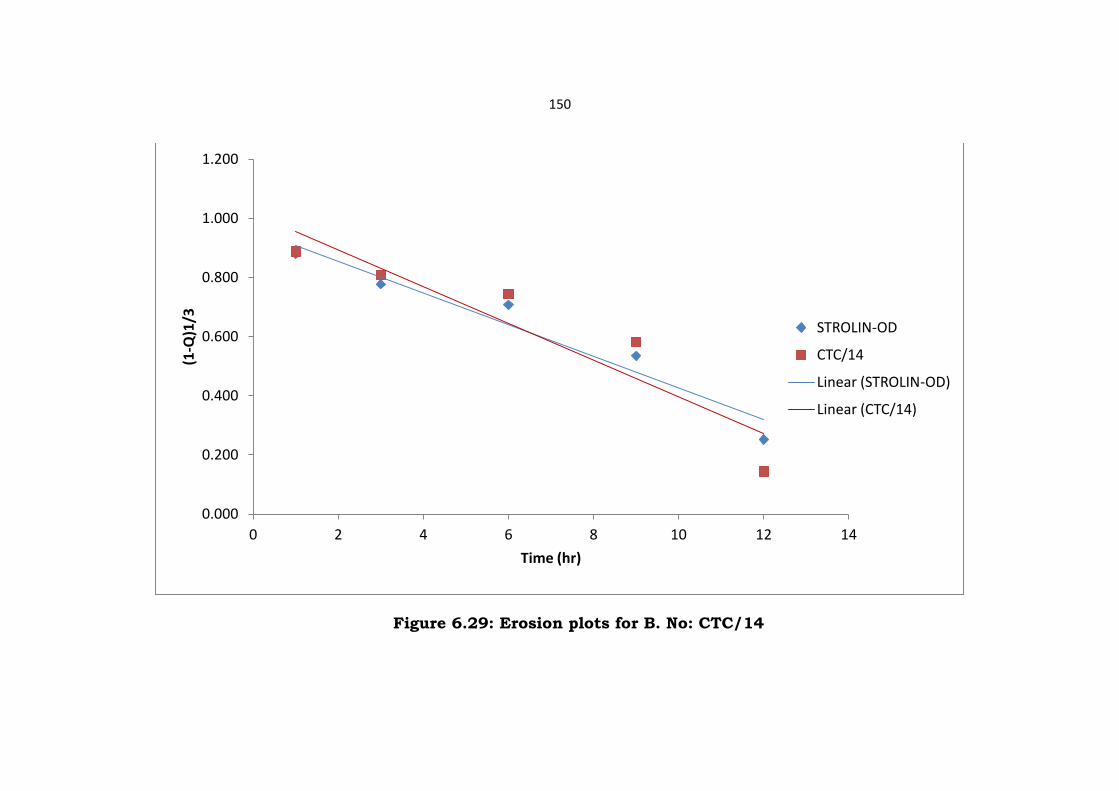
Figure 6.29: Erosion plots for B. No: CTC/14
0.000
0.200
0.400
0.600
0.800
1.000
1.200
0 2 4 6 8 10 12 14
(1-Q
)1/3
Time (hr)
STROLIN-OD
CTC/14
Linear (STROLIN-OD)
Linear (CTC/14)
151
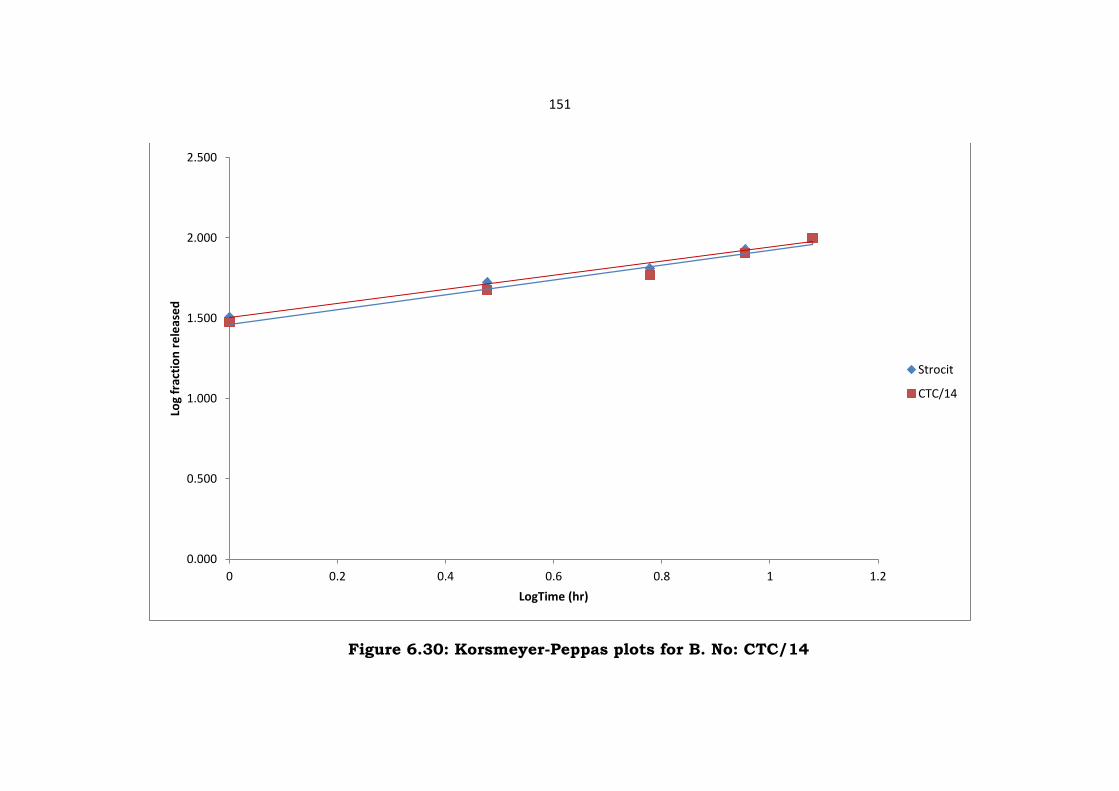
Figure 6.30: Korsmeyer-Peppas plots for B. No: CTC/14
0.000
0.500
1.000
1.500
2.000
2.500
0 0.2 0.4 0.6 0.8 1 1.2
Log
frac
tio
n r
ele
ase
d
LogTime (hr)
Strocit
CTC/14

152
6.7.5 Stability Studies
Stability studies for Formulation B.No:CTC/14 revealed that
there was no significant change in appearance, assay, and drug
release profile at 40°C± 2°&75% RH till 3 months.
Table 6.29: Stability study values
Parameters Time period
Initial 1 Month 2 Month 3 Month
Description Complies Complies Complies Complies
Drug content (%) 100.8 100.5 100.3 100.2
Dis
solu
tion
1Hr 30.1 29.9 31.0 30.5
3Hr 47.3 46.9 47.1 47.8
6Hr 58.8 58.2 58.4 59.2
9Hr 80.4 80.8 79.9 81.4
12Hr 99.7 99.3 99.9 99.3
6.8 DISCUSSION
6.8.1 Solubility results shown in Table6.10
Solubility test reveals that the Citicoline sodium is soluble in pH range
of 1 to 7.0.
6.8.2 Compatibility Studies:
6.8.2.1 Differential Scanning Calorimeter (DSC) results are shown in
Table6.11.
The DSC thermograph for Citicoline showed melting peak starts
at 264.92°C ending at 272.41°C and the mixer of the Citicoline+
HPMC K 100M, Citicoline + HPC HF, Citicoline + Eudragit RLPO,

153
Citicoline + Eudragit RSPO showed melting points starting at
257.63°C, 255.83°C , 256.50°C & 251.85°C ending at 266.28°C ,
261.13°C, 263.76°C & 257.73°C respectively. The exothermic energy
of Citicoline was 403.97 J/g and the mixer of the Citicoline+ HPMC K
100M, Citicoline + HPC HF, Citicoline + Eudragit RLPO, Citicoline +
Eudragit RSPO were 195.63J/g , 113.09J/g, 174.07J/g & 56.73 J/g
respectively. From the obtained results concluded that there is no
interaction between the selected polymers and drug substance.
6.8.3 Fourier Transform Infra-Red (FT-IR) spectral results are shown
in Table6.12-6.20.
The FT-IR spectra of pure drug showed characteristic peaks at
1651 cm-1,3500 cm-1,1247 cm-1, 1081 cm-1,1213 cm-1, & 981 cm-1.
The mixer of drug substance and polymers of the selected in the
formulations also showed same characteristic peaks with linear and
shift so these values supported that there is no interaction between
the selected polymers and the drug substance.
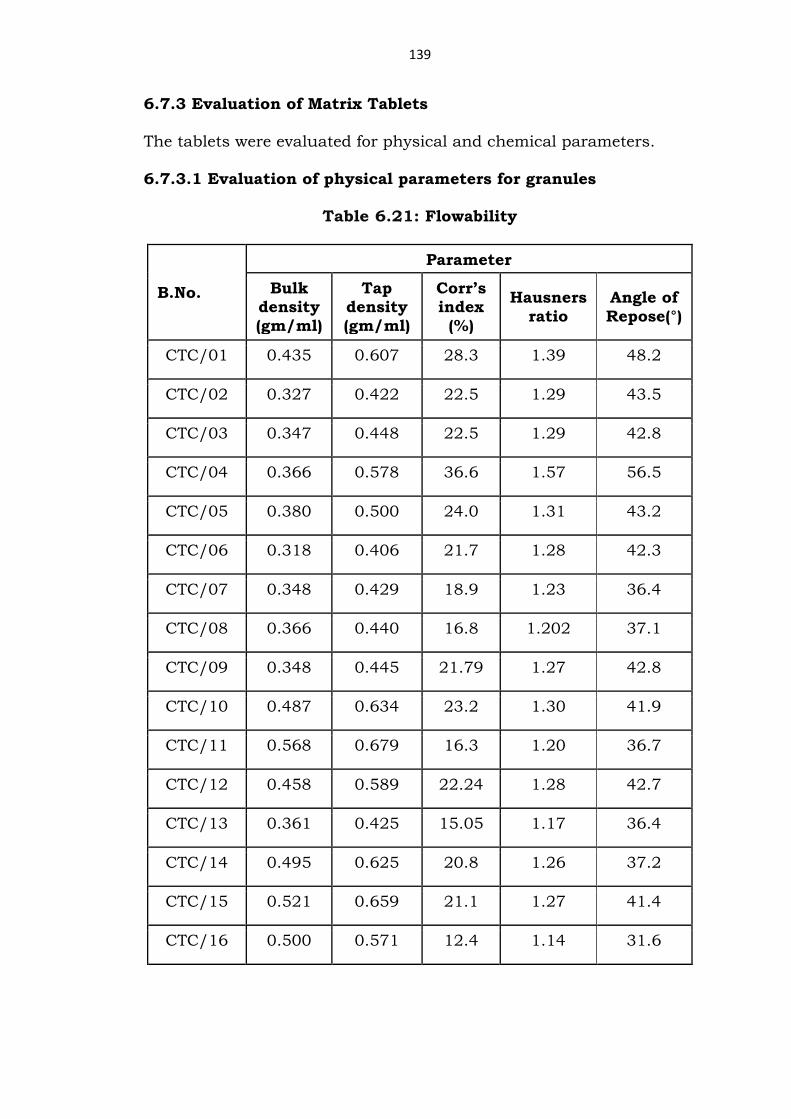
6.8.4 The results of bulk properties are shown in Table 6.21.
The bulk density of the prepared formulations had in the range
of 0.318g/mL to 0.568g/mL.
The tapped density was found to be in the range of 0.406g/mL to
0.679g/mL.
The Carr’s index and Hausner’s ratio varies in the range of
12.4%, 1.14 to 36.6%, 1.57 respectively and the angle of repose was
found to be in the range of 31.6° to 56.5°. The bulk properties of B.No:

154
CTC/14 was showed flow properties.(20.80 %,1.260 and 37.20º
respectively).
The results clearly indicate that the prepared blends have fair
flowability and compressibility.
6.8.5 Results of core tablet uniformity of weight are shown in
Table6.22 all batches were found within specified range ±5.0% as per
Indian Pharmacopeia.
6.8.6 Core Tablet Thickness results are shown in Table6.22.
Thickness of tablet containing total weight 1280 mg was found
in the range of 6.71 to 6.84 mm. Thickness of tablet containing total
weight 1420 mg was found in the range of 6.81 to 6.94 mm. Thickness
of tablet containing total weight 1580 mg was found in the range of
6.85 to 6.94 mm. Thickness of all batch tablets was found satisfactory
with respect to punches and tablet weight.
6.8.7Core Tablet Hardness results are show in Table6.22.
Hardness of tablets having 1280 mg weight contains 35.0 to
41.0 kp, 1420 mg weight contains 34.9 to 41.3Kp and 1580 mg
weight contains 34.7 to 40.5 kp. Selected batch (B.No:CTC/14) found
with 35.1 to 38.4kp.
6.8.8 Friability results are show in Table6.22.
Friability of all tablets was found in the range of 0.10 - 0.21%
w/w, which found within the specified limit. Friability of selected
batch (B.No: CTC/14) was 0.16%.

155
6.8.9 Results of coated tablet uniformity of weight are shown
inTable6.23. All batches were found within specified range ±5.0% as
per Indian Pharmacopeia.
6.8.10Coated Tablet Thickness results are shown in Table 6.23.
Thickness of tablet containing total weight 1300 mg was found
in the range of 6.73 to 6.85 mm. Thickness of tablet containing total
weight 1420 mg was found in the range of 6.85 to 6.97 mm. Thickness
of tablet containing total weight 1600 mg was found in the range of
6.89to 6.97 mm. Thickness of all batch tablets was found satisfactory
with respect to punches and tablet weight.
6.8.11 CoatedTablet Hardness results are show in Table 6.23.
Hardness of tablets having 1300 mg weight contains 35.0 to
41.0 kp, 1420 mg weight contains 34.9 to 41.3Kp and 1600 mg weight
contains 34.7 to 40.5 kp. selected batch (B.No:CTC/14) found with
35.1 to 38.4kp.
6.8.12 The results of the assay shown in Table 6.24.
The assay results are found within the pharmacopeial limits
which indicate uniformity in drug content for all the prepared
formulations.
6.8.13 The results of Dissolution studies are shown in Table 6.25.
Those formulations containing HPMC K100 M (B.No: CTC/01,
CTC/02, CTC/03 & CTC/04) varies in the concentrations
7.8,12.5,21.12& 28.48% w/w per tablet respectively. Obtained
results are shows that the high amount of HPMC K 100 M is required
to retard the release rate and also increase the tablet size respectively

156
which is difficult to swallow the patient. Concentrations varies from
7.8, 12.5, 21.12 & 28.48 %w/w of HPC HF per tablet in the
formulations B.No: CTC/05, CTC/06, CTC/07& CTC/08 respectively.
Since it is not shown the better performance than HPMC K 100 M but
it is shown the similar results with HPMC K100M. Finally high
amount of HPC HF required controlling the release rate and also
increasing the tablet size respectively which is difficult to swallow.
Formulations containing Eudragit RLPO are unable to control
the initial release of the drug even at maximum concentration of 450
mg. More than 50% of the drug released in 1 hour. Hence Eudragit
RLPO is considered to be failed in the design of controlled release
Citicoline. The release of Citicoline from tablets containing Eudragit
RSPO was well controlled. The release is extended for about 12 hours.
The formulation showed satisfactory in-vitro results at concentration
of 160 mg/tablet. There is not much variation in controlling of drug
release with increasing the concentration of Eudragit RSPO such as
300 mg, 450 mg per tablet. The optimum concentration is found to be
160 mg for formulation B.No: CTC/14. For comparison of marketed
Citicoline controlled release tablets were also evaluated for
dissolution. Marketed tablets could extend the release of the drug for
about 12 hours. The release of the drug from marketed formulation
was compared with all the prepared formulations and calculated
similarity factor and difference factor. The values indicated formula
B.No: CTC/14 containing Eudragit RSPO is best formula among all.
157
6.8.14 The similarity and dissimilarity factor values are shown in
Table 6.27.
The f1, f2 are calculated by using the equation proposed by More
et al, the results of formulation (Batch no: CTC/14) f1= 4.96, f2= 67.91
So, it indicates the proposed formulation is similar to that of the
marketed formulation.
6.8.15The results of drug release kinetics are shown in Table 6.28.
The release profile was studied for kinetics of the drug release
by zero order and first order kinetics. The correlation coefficient value
(r2) of zero order and first order for all formulation were found to be in
the range of 0.7623 -0.9993 and 0.8707-0.9992. These results
indicate that the release follows first order kinetics.
The mechanism of drug release was studied by using Higuchi’s,
Erosion and Peppas model. The correlation r2 values found to be
(0.8507 – 0.9932), (0.8838 – 0.9898) and (0.9183 – 0.9942)
respectively, this results indicates the release mechanism follows with
super case II transport (as n value more than 1) . From the observed
results indicate the drug release follows first order kinetics with
diffusion mechanism.
6.8.16 The results of stability studies are shown in Table 6.29.
The stability studies were conducted on the selected formulation
(B.No: CTC /14) at 40°C/75% RH for 3 months. The tablet was
evaluated for Description, Assay and Dissolution.
There is no significance difference between the initial and final
exposed samples with required physical stability and chemical

158
stability like assay and dissolution. So this indicates the selected
formulation is stable.