chapter 6: correlational research examine whether variables are related to one another (whether they...
TRANSCRIPT
Chapter 6: Correlational Research• Examine whether variables are related to one another
(whether they vary together).
Correlation coefficient: statistic indicating how well two variables are related to one another (how well they vary together) in a linear fashion.
• Must obtain a score on each variable for each participant.
• Pearson correlation coefficient (r): most common. Values range from -1.00 to +1.00
• The direction of the relationship is indicated by the sign of the correlation coefficient.
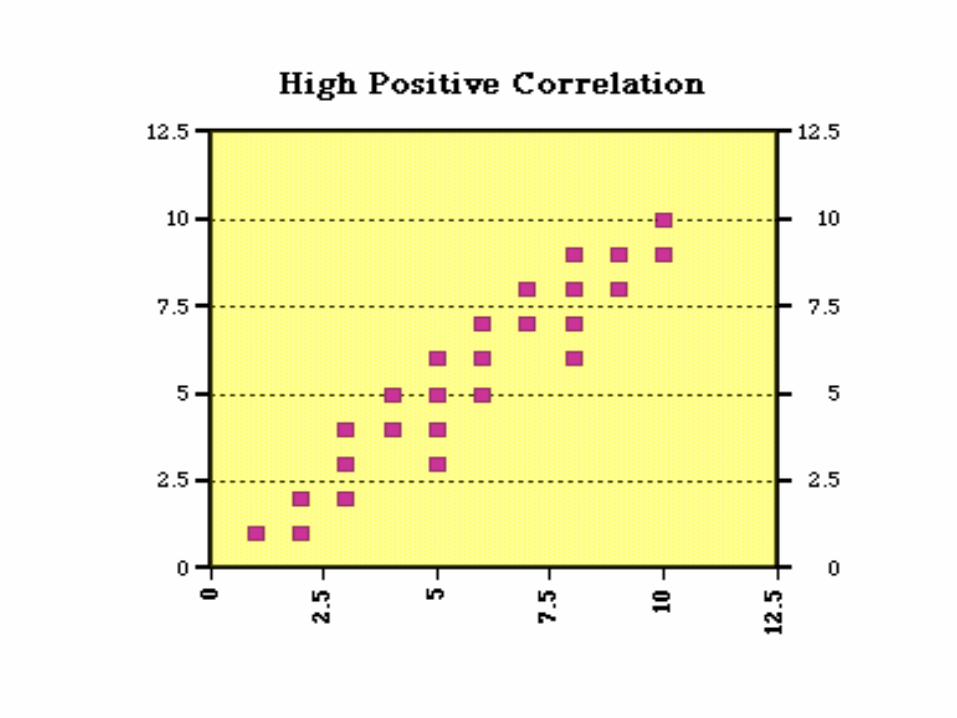
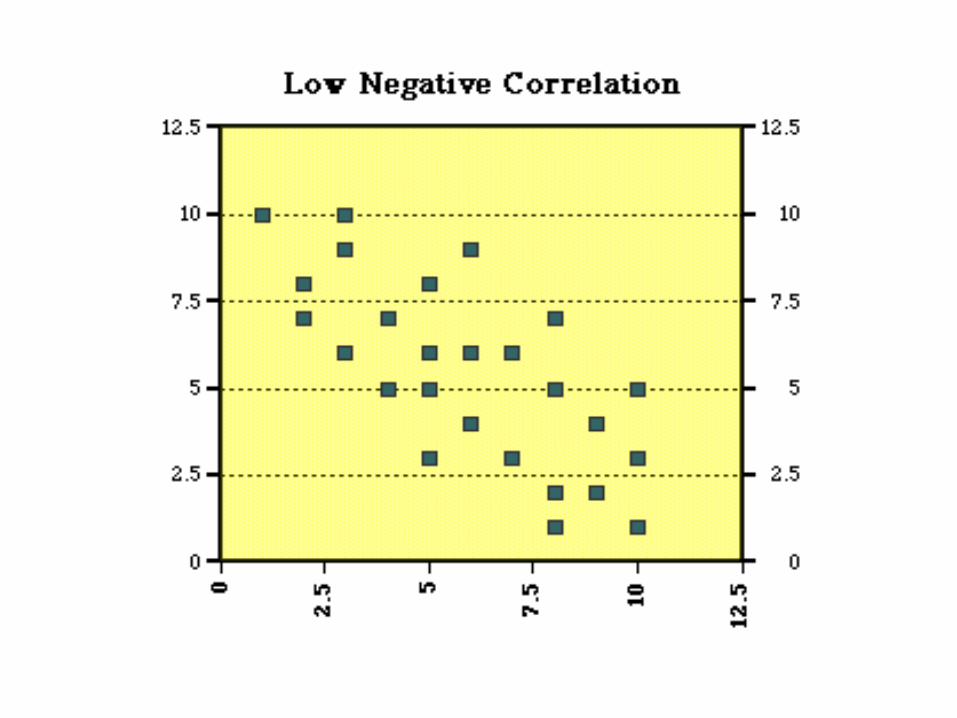
• Positive correlation: indicates a direct, linear, positive relationship (as one variable increases the other variable also increases).
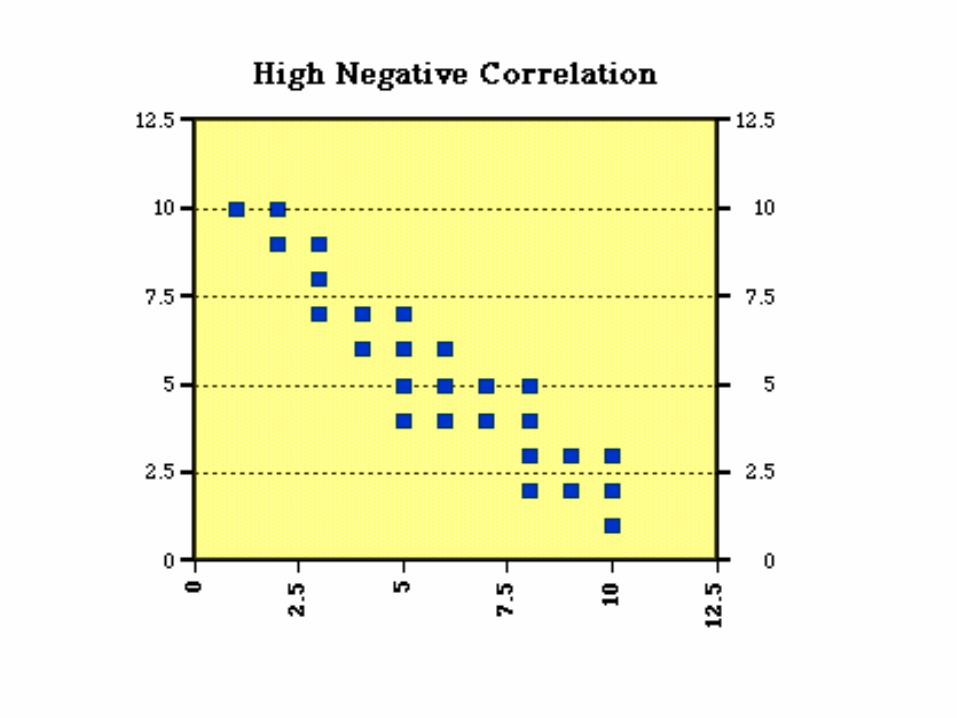
• Negative correlation: indicates a direct, linear, negative relationship (as one variable increases the other variable decreases)
• Magnitude of the correlation: the numerical value (ignoring the sign) which expresses the strength of the relation• Correlation of .33, indicates that the variables are not
a strongly related as variables with a correlation of .65
• The stronger the correlation the more tightly the data cluster around the mean


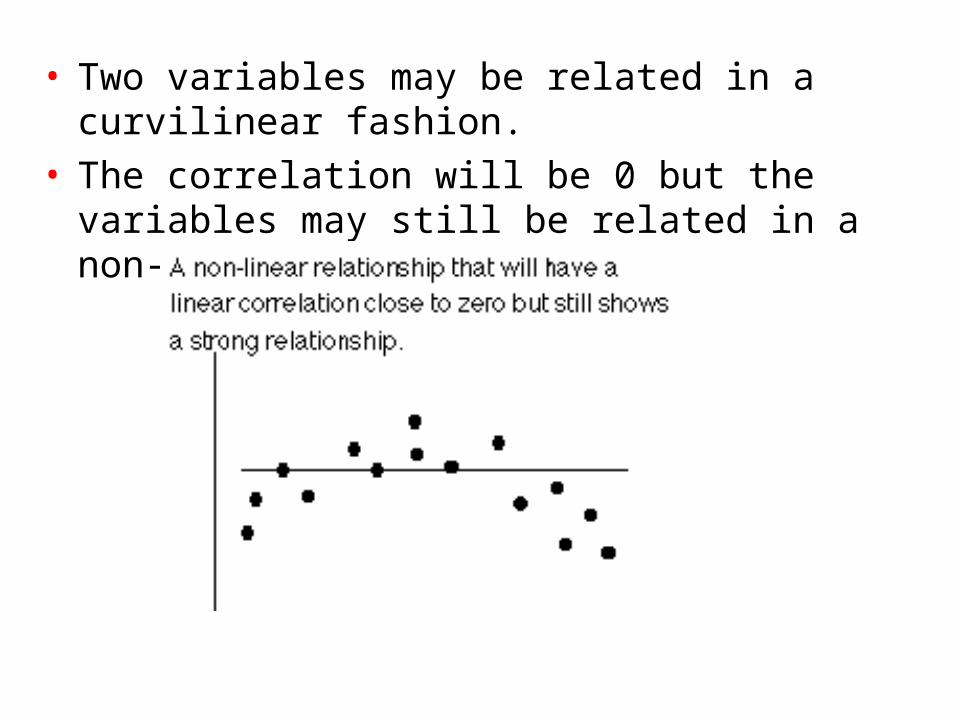
• Two variables may be related in a curvilinear fashion.
• The correlation will be 0 but the variables may still be related in a non-linear way.
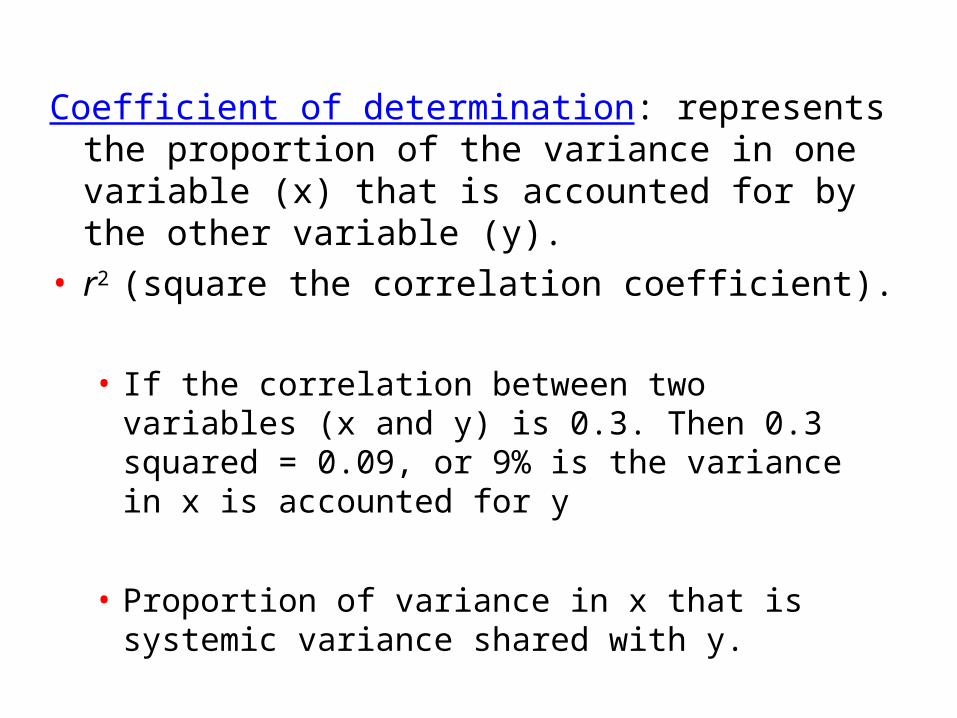
Coefficient of determination: represents the proportion of the variance in one variable (x) that is accounted for by the other variable (y).
• r2 (square the correlation coefficient).
• If the correlation between two variables (x and y) is 0.3. Then 0.3 squared = 0.09, or 9% is the variance in x is accounted for y
• Proportion of variance in x that is systemic variance shared with y.
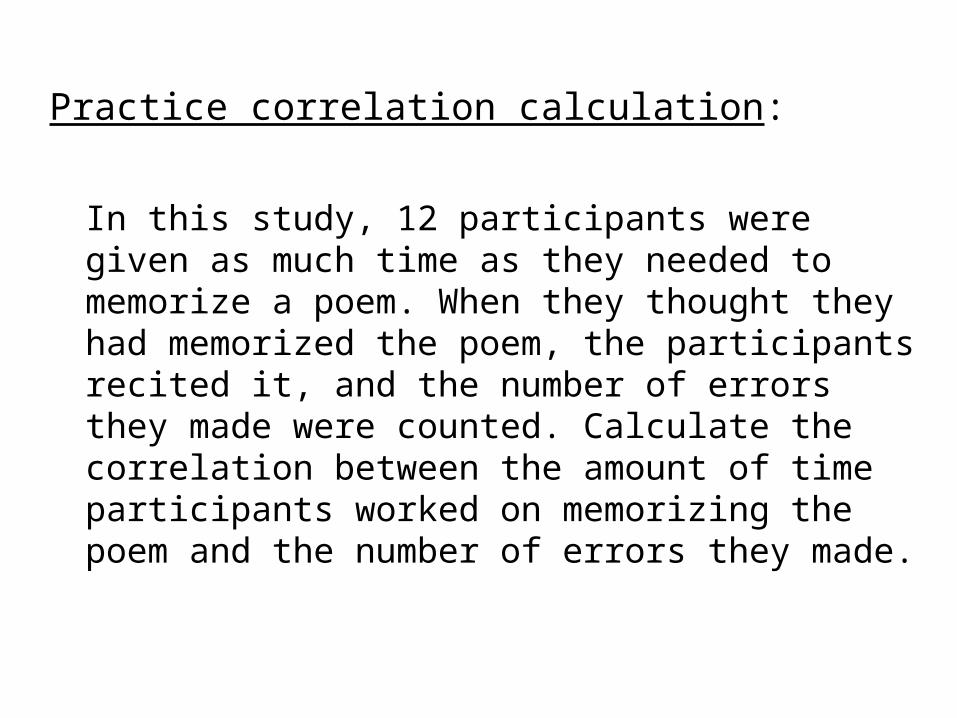
Practice correlation calculation:
In this study, 12 participants were given as much time as they needed to memorize a poem. When they thought they had memorized the poem, the participants recited it, and the number of errors they made were counted. Calculate the correlation between the amount of time participants worked on memorizing the poem and the number of errors they made.
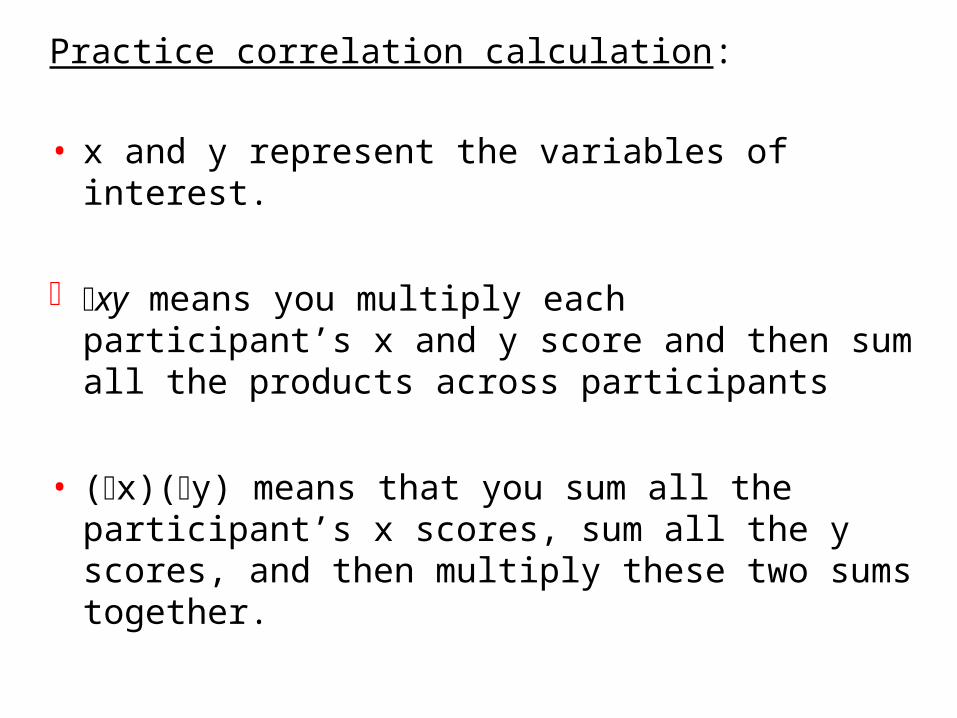
Practice correlation calculation:
• x and y represent the variables of interest.
xy means you multiply each participant’s x and y score and then sum all the products across participants
• (x)(y) means that you sum all the participant’s x scores, sum all the y scores, and then multiply these two sums together.
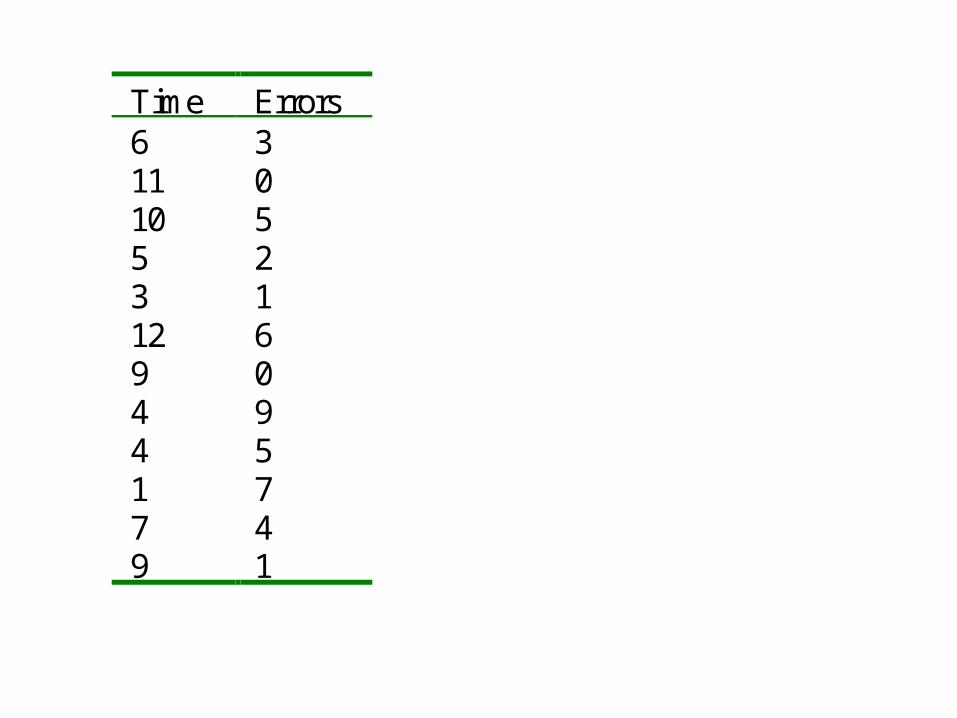
Time Errors6 311 010 55 23 112 69 04 94 51 77 49 1
Statistical significance of r
• exists when the correlation coefficient has a very low chance of being 0 in the population.
• Statistically significant: means the chance that our correlation is truly 0 in the population is very low (usually less than .05). Meaning there is a 5% probability that our result is not really significant but happened by chance.
Statistical significance can be influenced by:• sample size: the larger the sample size the more
likely you are to conclude that a correlation is statistically significant.
• The magnitude of the correlation: the larger the more confident you are in concluding that the correlation is statistically significant
• P value: the level of significance you set before you calculate the correlation.• Most common is .05
• Some researchers are more conservative and use .01 meaning there is only a 1% probability the correlation could be found significant even if it really is not significant (or due to chance).
• With a P value of .01 you must have a larger correlation than with a P value of .05 for it to be significant.
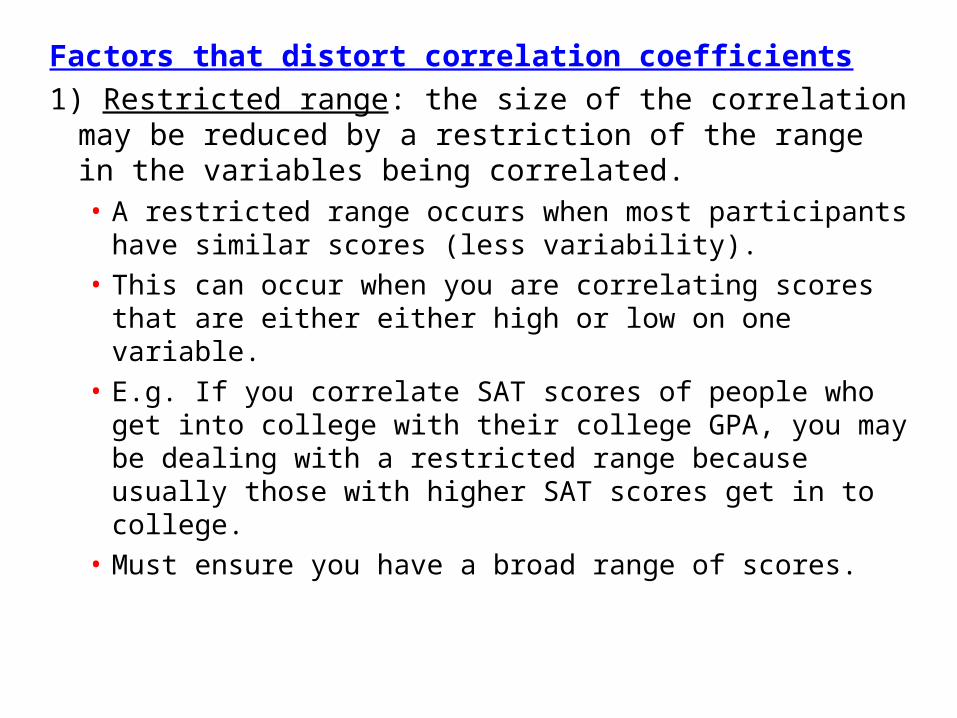
Factors that distort correlation coefficients
1) Restricted range: the size of the correlation may be reduced by a restriction of the range in the variables being correlated.• A restricted range occurs when most participants
have similar scores (less variability).
• This can occur when you are correlating scores that are either either high or low on one variable.
• E.g. If you correlate SAT scores of people who get into college with their college GPA, you may be dealing with a restricted range because usually those with higher SAT scores get in to college.
• Must ensure you have a broad range of scores.
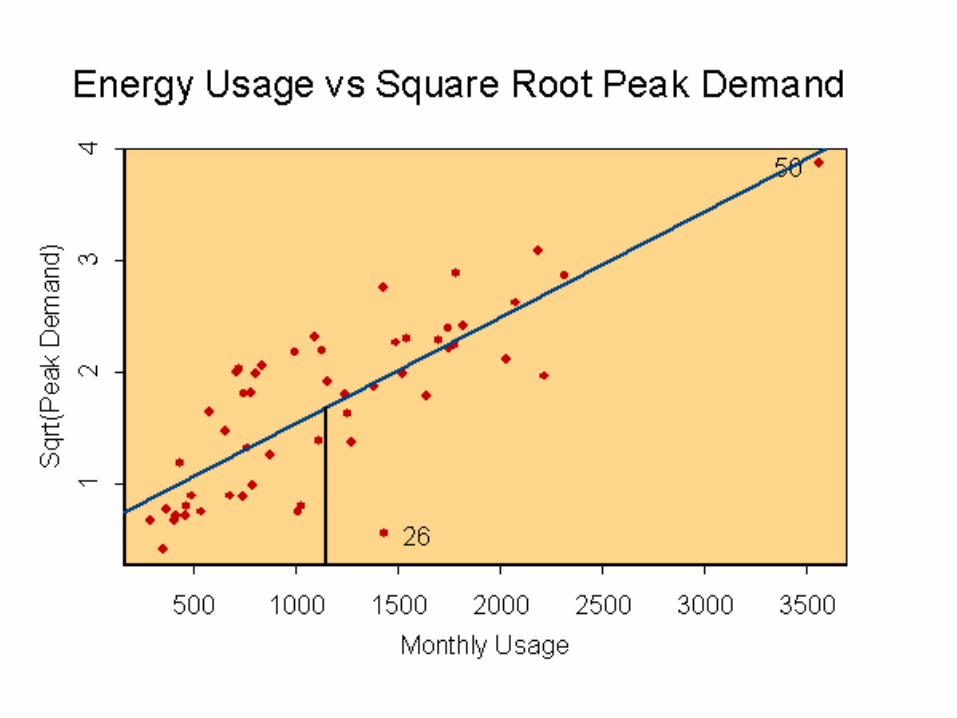
2) Outliers:
• Outliers that are far off the correlation line (high on x but lower on y) tend to deflate the value of r.
• Outliers that are on the correlation line but to the extreme on both x and y tend to inflate the value of r.
3) Reliability of measures: the less reliable the measures the lower the correlation coefficients.
Correlation and Casualty: you can not infer that one variable causes the other in a correlation.• The variables may be related: a correlation between
obesity and depression (more obese people are more depressed) does NOT mean that obesity causes depression, or that depression causes people to become obese.
Experimental studies must be conducted to infer causality in which there must be:
• Covariation: changes in the value of one variable are associated with changes in the value of another variable
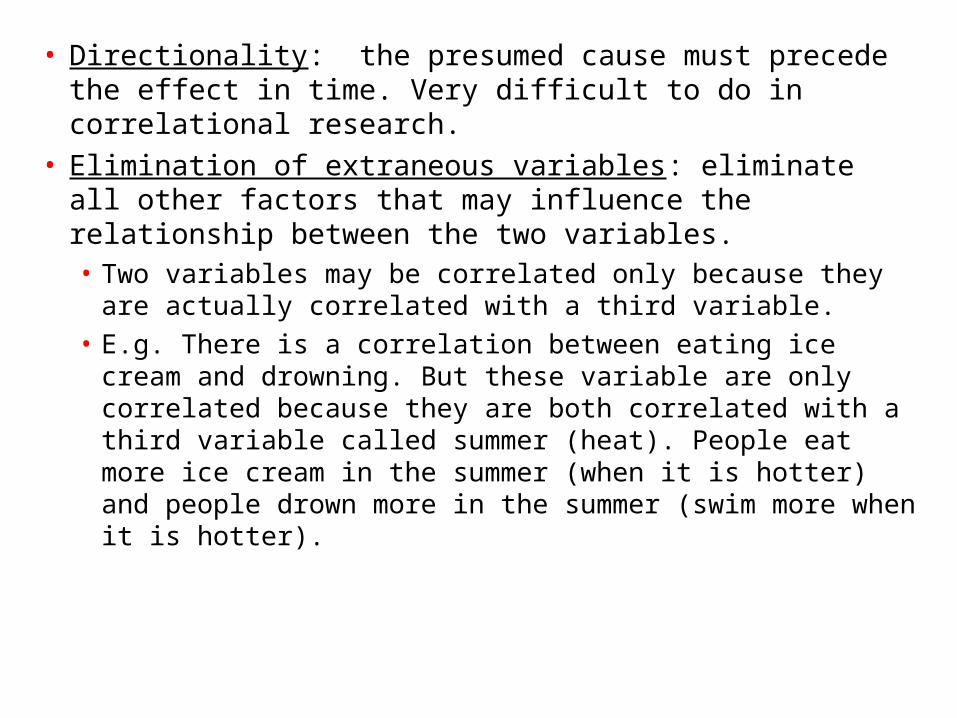
• Directionality: the presumed cause must precede the effect in time. Very difficult to do in correlational research.
• Elimination of extraneous variables: eliminate all other factors that may influence the relationship between the two variables.• Two variables may be correlated only because they are
actually correlated with a third variable.
• E.g. There is a correlation between eating ice cream and drowning. But these variable are only correlated because they are both correlated with a third variable called summer (heat). People eat more ice cream in the summer (when it is hotter) and people drown more in the summer (swim more when it is hotter).
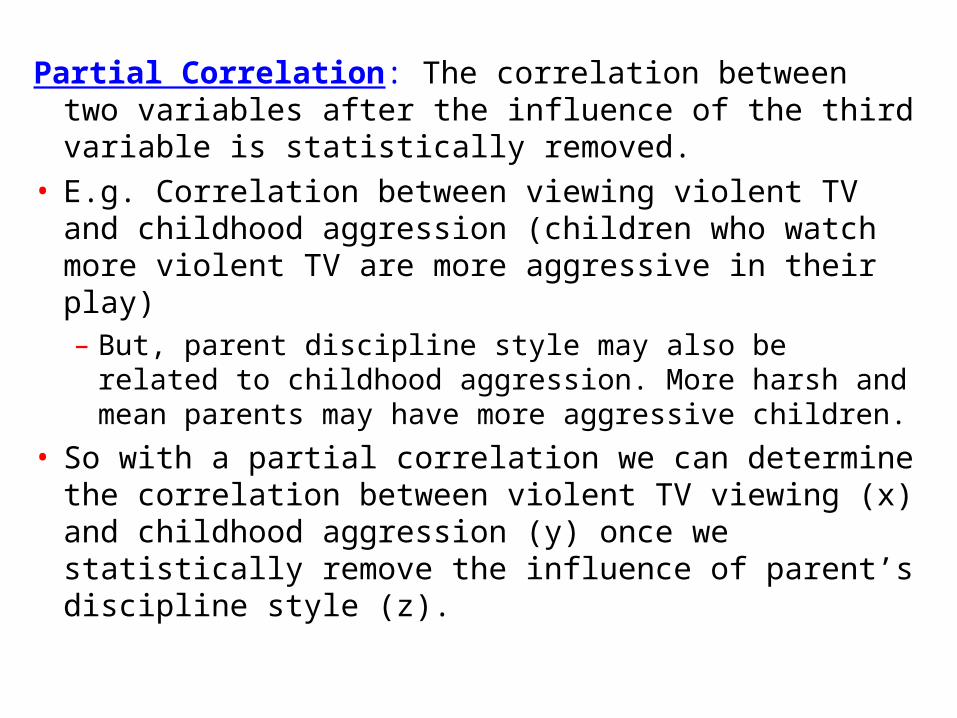
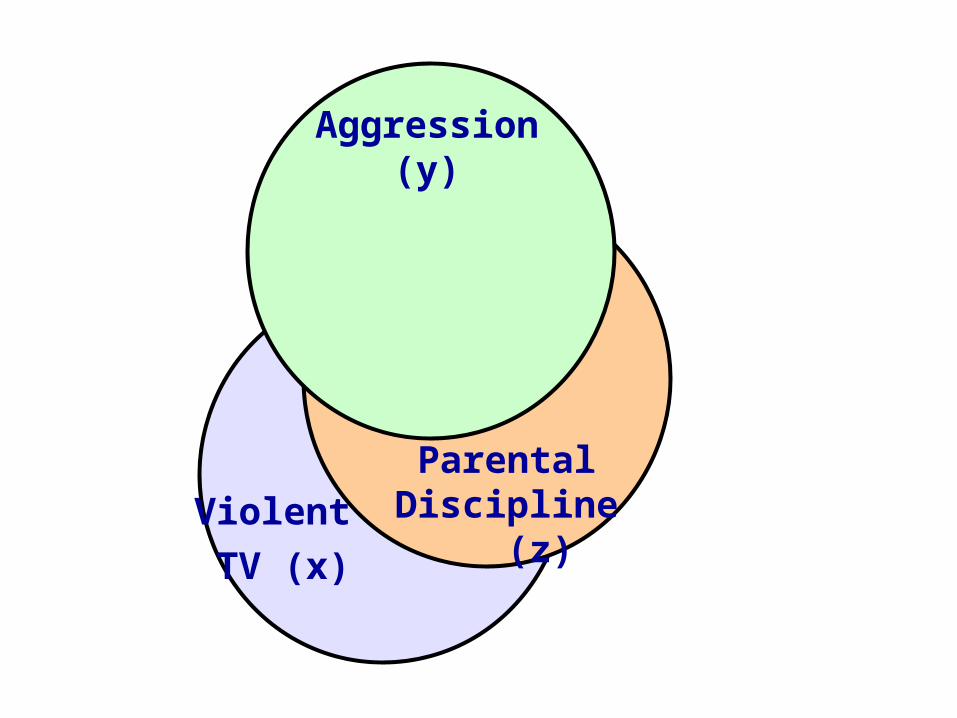
Partial Correlation: The correlation between two variables after the influence of the third variable is statistically removed.
• E.g. Correlation between viewing violent TV and childhood aggression (children who watch more violent TV are more aggressive in their play)– But, parent discipline style may also be related to
childhood aggression. More harsh and mean parents may have more aggressive children.
• So with a partial correlation we can determine the correlation between violent TV viewing (x) and childhood aggression (y) once we statistically remove the influence of parent’s discipline style (z).
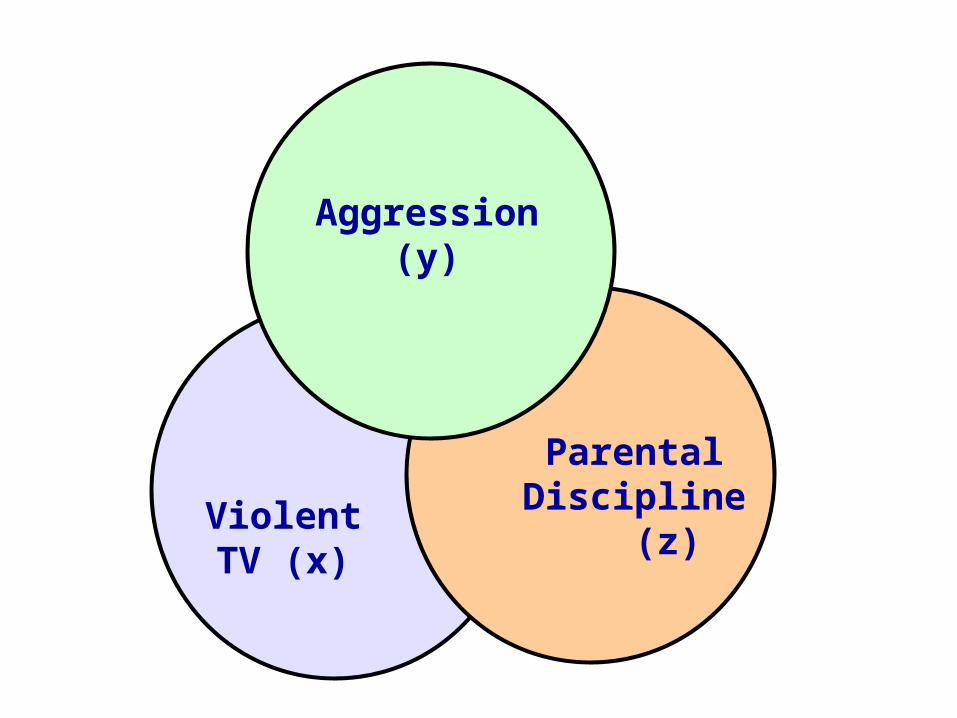
Aggression (y)
Parental Discipline
(z)Violent TV
(x)
If the correlation between x and y is still significant after removing z:
• we can conclude that x and y are correlated even after we account for parent discipline style (z)
• and the relationship between x and y is unlikely due to parent discipline style (z).
Aggression (y)
Parental Discipline
(z)Violent
TV (x)
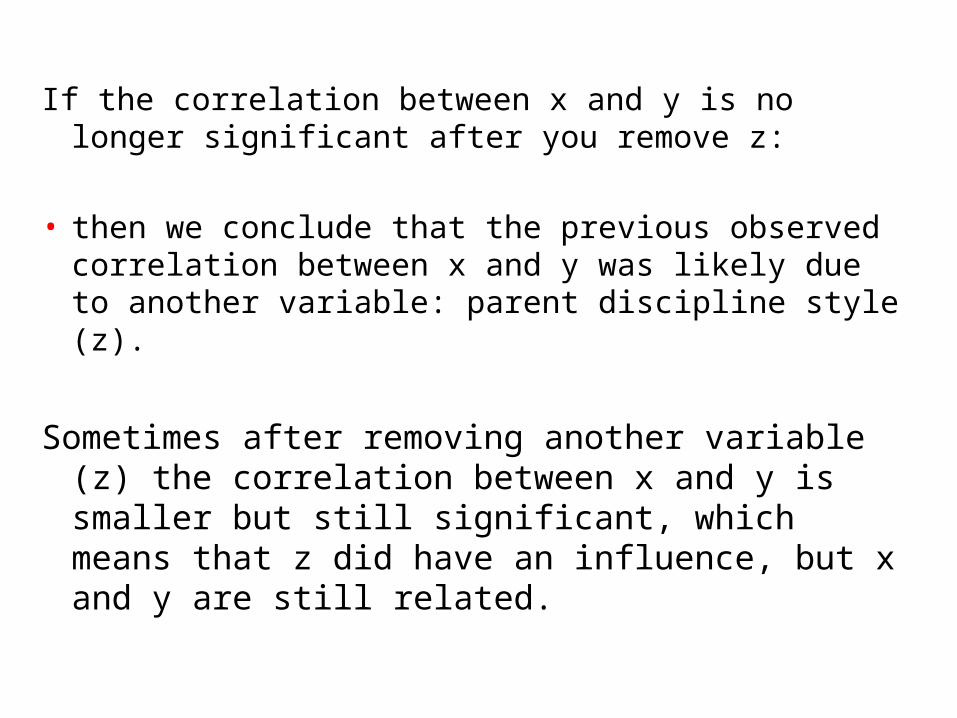
If the correlation between x and y is no longer significant after you remove z:
• then we conclude that the previous observed correlation between x and y was likely due to another variable: parent discipline style (z).
Sometimes after removing another variable (z) the correlation between x and y is smaller but still significant, which means that z did have an influence, but x and y are still related.

Aggression (y)
Parental Discipline
(z)Violent TV
(x)
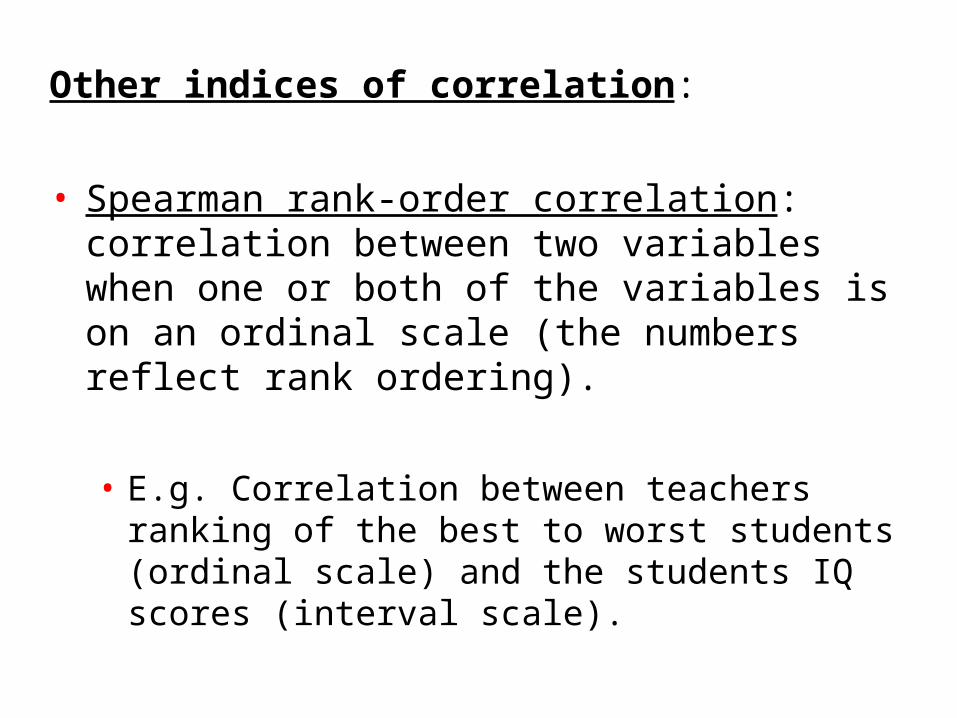
Other indices of correlation:
• Spearman rank-order correlation: correlation between two variables when one or both of the variables is on an ordinal scale (the numbers reflect rank ordering).
• E.g. Correlation between teachers ranking of the best to worst students (ordinal scale) and the students IQ scores (interval scale).
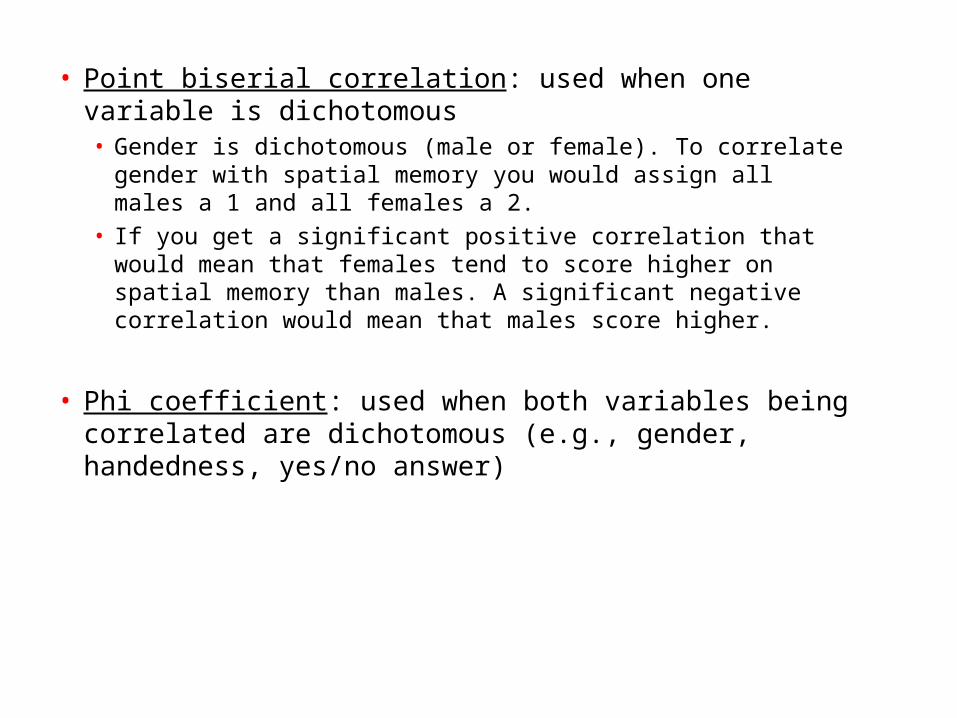
• Point biserial correlation: used when one variable is dichotomous• Gender is dichotomous (male or female). To correlate gender with
spatial memory you would assign all males a 1 and all females a 2. • If you get a significant positive correlation that would mean that
females tend to score higher on spatial memory than males. A significant negative correlation would mean that males score higher.
• Phi coefficient: used when both variables being correlated are dichotomous (e.g., gender, handedness, yes/no answer)
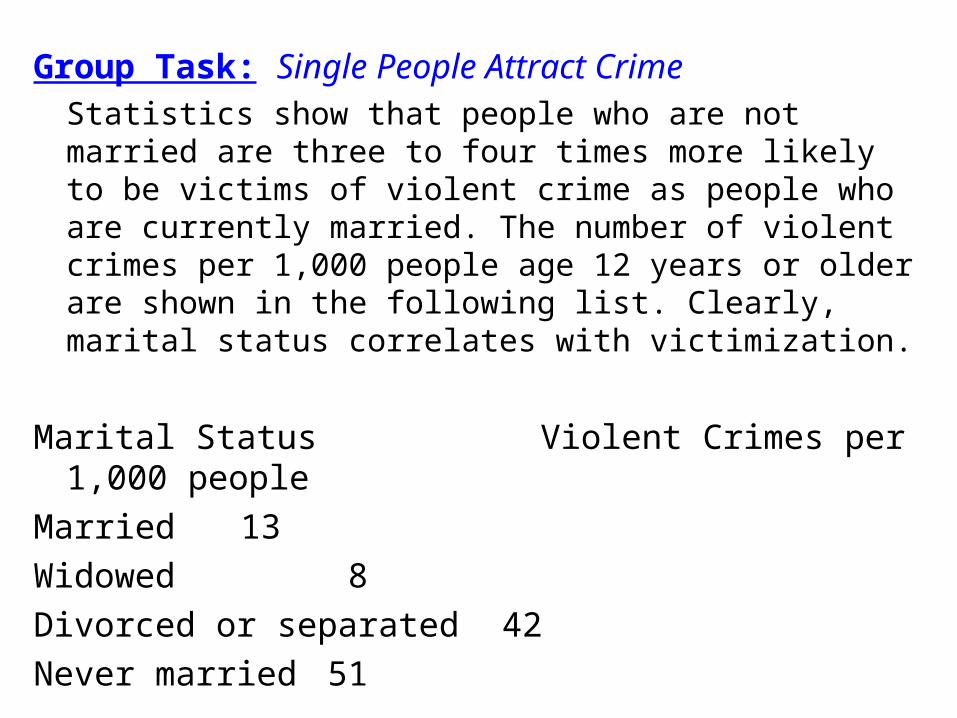
Group Task: Single People Attract CrimeStatistics show that people who are not married are three to four times more likely to be victims of violent crime as people who are currently married. The number of violent crimes per 1,000 people age 12 years or older are shown in the following list. Clearly, marital status correlates with victimization.
Marital Status Violent Crimes per 1,000 people
Married 13
Widowed 8
Divorced or separated 42
Never married 51
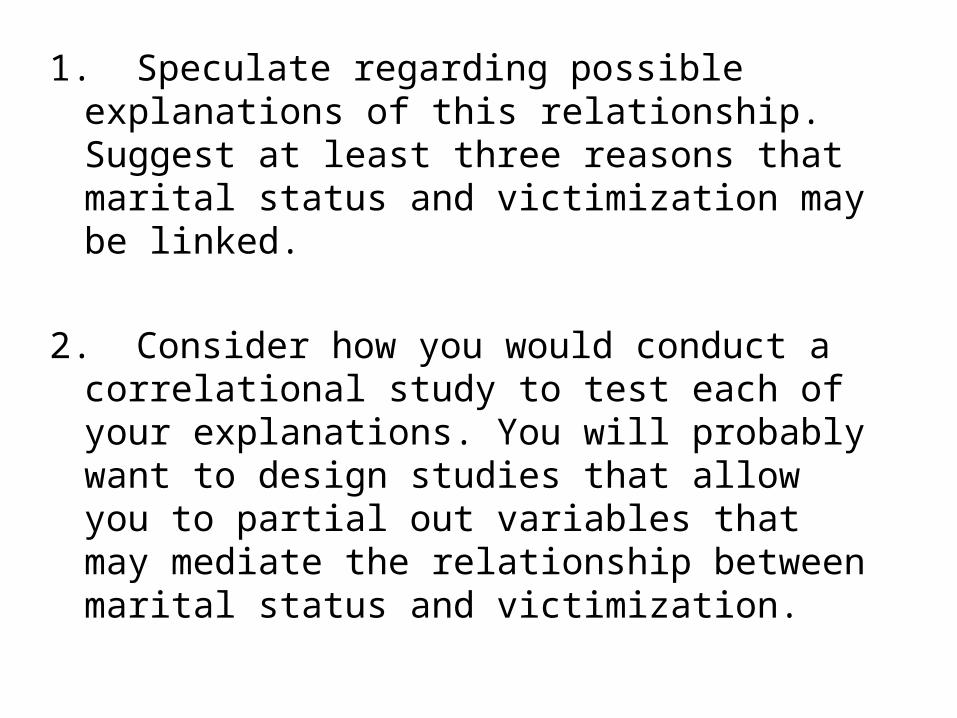
1. Speculate regarding possible explanations of this relationship. Suggest at least three reasons that marital status and victimization may be linked.
2. Consider how you would conduct a correlational study to test each of your explanations. You will probably want to design studies that allow you to partial out variables that may mediate the relationship between marital status and victimization.
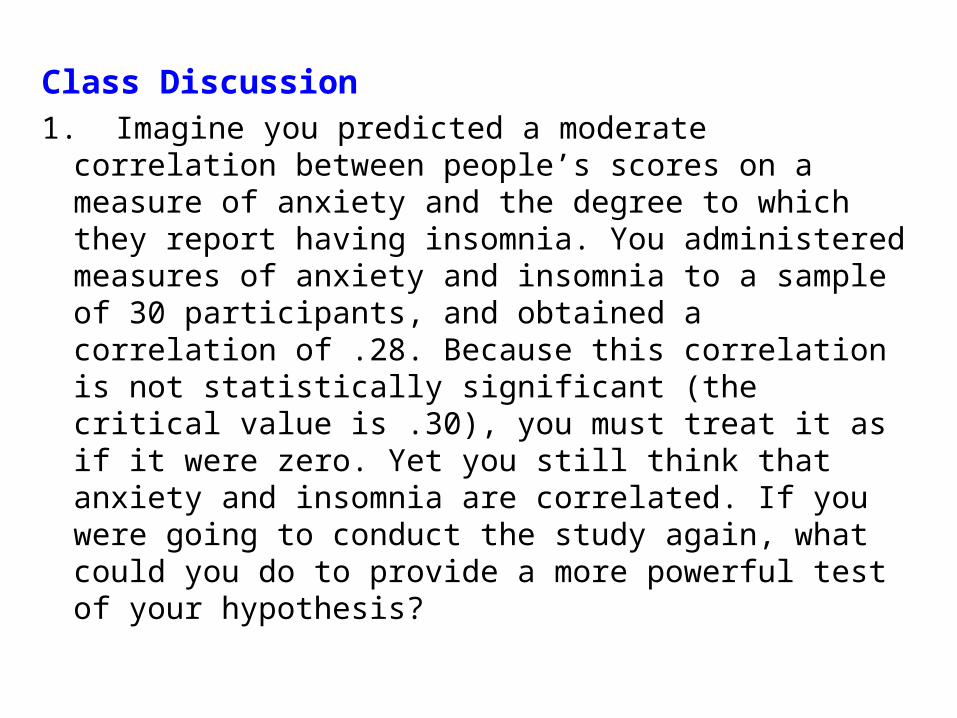
Class Discussion1. Imagine you predicted a moderate correlation
between people’s scores on a measure of anxiety and the degree to which they report having insomnia. You administered measures of anxiety and insomnia to a sample of 30 participants, and obtained a correlation of .28. Because this correlation is not statistically significant (the critical value is .30), you must treat it as if it were zero. Yet you still think that anxiety and insomnia are correlated. If you were going to conduct the study again, what could you do to provide a more powerful test of your hypothesis?
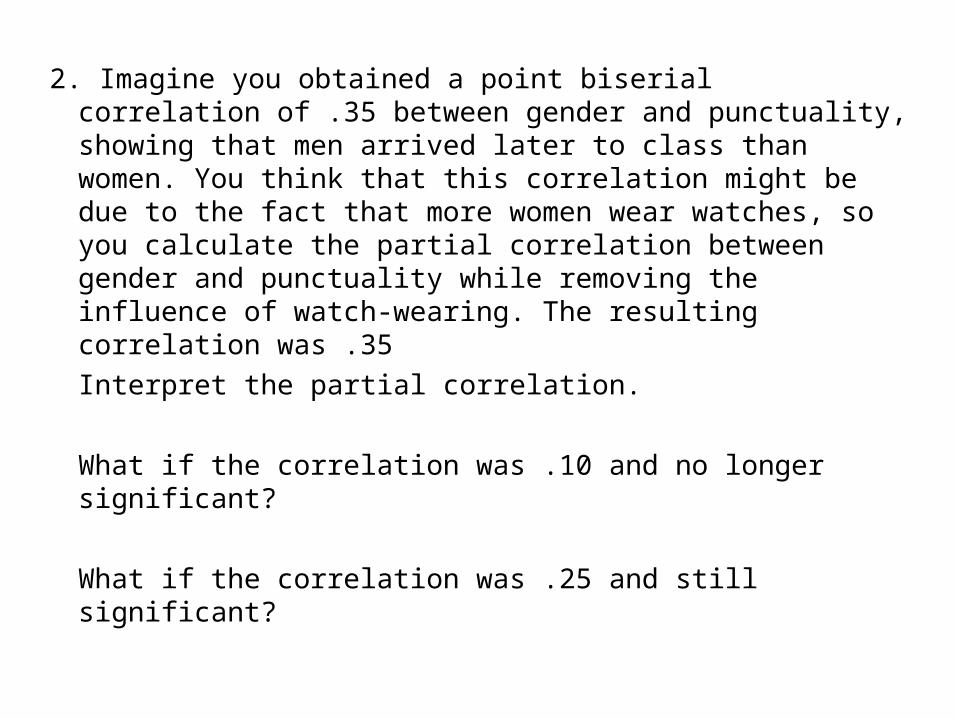
2. Imagine you obtained a point biserial correlation of .35 between gender and punctuality, showing that men arrived later to class than women. You think that this correlation might be due to the fact that more women wear watches, so you calculate the partial correlation between gender and punctuality while removing the influence of watch-wearing. The resulting correlation was .35
Interpret the partial correlation.
What if the correlation was .10 and no longer significant?
What if the correlation was .25 and still significant?
3. Following the rash of school shootings that occurred in the late 1990’s, some individuals suggested that violent video games were making children and adolescents more aggressive. Imagine that you obtained a sample of 150 15-years-old males and correlated their level of aggressiveness with the amount of time per week that they played violent video games. The correlation coefficient was .56 (highly significant). Does this finding support the idea that playing violent video games increases aggression?