chapter 5. water quality - u.s. geological survey ... 5_105-156.pdf · chapter 5. water quality 105...
TRANSCRIPT
Chapter 5 Water Quality 105
Chapter 5 Water Quality
By Gerold Morrison (AMEC-BCI) and Holly Greening (Tampa Bay Estuary Program)
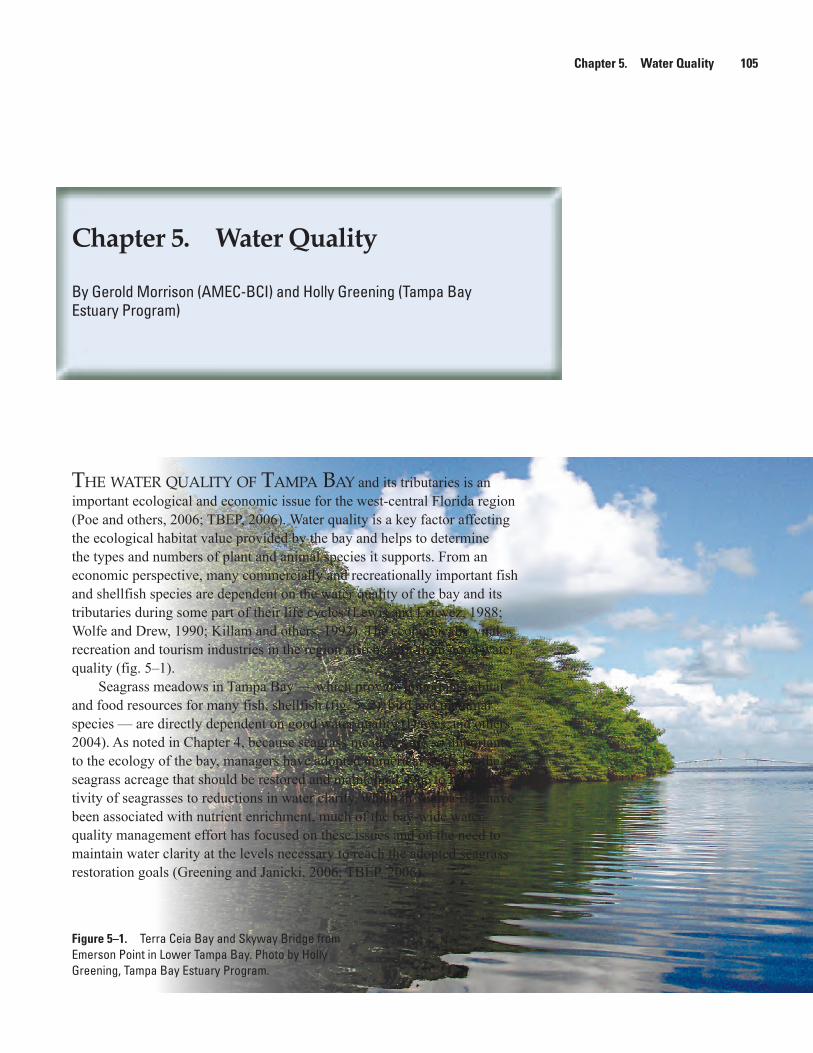
Figure 5ndash1 Terra Ceia Bay and Skyway Bridge from Emerson Point in Lower Tampa Bay Photo by Holly Greening Tampa Bay Estuary Program
The waTer qualiTy of Tampa Bay and its tributaries is an important ecological and economic issue for the west-central Florida region (Poe and others 2006 TBEP 2006) Water quality is a key factor affecting the ecological habitat value provided by the bay and helps to determine the types and numbers of plant and animal species it supports From an economic perspective many commercially and recreationally important fish and shellfish species are dependent on the water quality of the bay and its tributaries during some part of their life cycles (Lewis and Estevez 1988 Wolfe and Drew 1990 Killam and others 1992) The economically vital recreation and tourism industries in the region also benefit from good water quality (fig 5ndash1)
Seagrass meadows in Tampa Bay mdash which provide important habitat and food resources for many fish shellfish (fig 5ndash2) bird and mammal species mdash are directly dependent on good water quality (Dawes and others 2004) As noted in Chapter 4 because seagrass meadows are so important to the ecology of the bay managers have adopted numerical goals for the seagrass acreage that should be restored and maintained Due to the sensi-tivity of seagrasses to reductions in water clarity which in Tampa Bay have been associated with nutrient enrichment much of the bay-wide water-quality management effort has focused on these issues and on the need to maintain water clarity at the levels necessary to reach the adopted seagrass restoration goals (Greening and Janicki 2006 TBEP 2006)
106 Integrating Science and Resource Management in Tampa Bay Florida
In addition to excessive nutrient enrichment and its impacts on seagrasses other water-quality issues are also important in managing living resources of the bay region Red tide and other harmful algal blooms (Paerl 1988 Anderson and Garrison 1997 Alcock 2007) cause a variety of environmental impacts and potential human health effects Elevated levels of mercury in the tissues of fish and other aquatic organisms also have potential impacts on the health of humans and wildlife (USEPA 1997) Waterborne pathogens associated primarily with contamination of water by human or livestock fecal material but also (in some cases) by wildlife and other natural sources can affect the use of surface waterbodies for recreation and as sources of potable water supplies (World Health Organization 2003 2006) As water monitoring technology continues to improve allowing manmade chemicals to be detected in water samples at concentrations as low as the parts-per-billion (micrograms per liter) or parts-per-trillion (nanogram per liter) level a number of emerging contaminants have also been identi-fied mdash including several pharmaceutical and personal care products mdash whose potential environmental or human health impacts have not yet been thoroughly documented (Kolpin and others 2002)
Connectivity between the Bay and its Watershed and Airshed
As an estuary Tampa Bay can be defined very broadly as a ldquoportion of the Earthrsquos coastal zone where there is interaction of ocean water freshwater land and atmosphererdquo (Day and others 1989) This definition emphasizes the connectivity that exists between the bay its watershed (see Chapter 1 fig 1ndash3) and its airshed (shown in fig 5ndash3) The watershed is the land area that contributes flows of freshwater and waterborne contaminants to the bay whereas the airshed (Atkeson and others 2007) is the much larger geographic area that contributes airborne contaminants such as mercury and various N-containing compounds To maintain a successful water-quality management program managers will need to continue recognizing the connectivity that exists between these areas and addressing the sources and loadings of contaminants the bay receives from them
Figure 5ndash2 Bay scallop (Argopectin irradians) in seagrass meadow
Chapter 5 Water Quality 107
Eutrophication in Tampa BaymdashPast Problems Recent Successes and Ongoing Challenges
Like many estuaries throughout the world one of the primary water-quality challenges facing Tampa Bay is cultural eutrophication mdash a process whereby human activities in the watershed and airshed lead to increased nutrient influxes to the waterbody producing levels of over-fertilization that stimulate undesirable blooms of phytoplankton and macroalgae (Cloern 2001 Bricker and others 2007) Such blooms harm estuarine ecosystems in several ways They reduce water clarity and block sunlight reducing the size quality and viability of seagrass meadows and other aquatic habitats Several bloom-forming phytoplankton species also produce toxins that can negatively affect the structure and function of aquatic food webs (Anderson and others 2002) and pose health threats to wildlife and humans (World Health Organization 2003 2006 Burns 2008 Havens 2008) As phyto-plankton and macroalgae die and decompose dissolved oxygen (DO) is removed from the water column and bottom sediments Because an adequate supply of DO is essential to the survival of most aquatic organisms such
Gulf of Mexico
Atlantic Ocean
0 100 MILES
0 100 KILOMETERS
LakeOkeechobee
GEORGIA SOUTH CAROLINAALABAMA
FLORIDA
Tampa BayAirshed
Tampa BayWatershed
Tampa Bay
N
Figure 5ndash3 Principal oxidized nitrogen (N) airshed for Tampa Bay Estimates indicate that more than 35 percent of the atmospheric deposition of N to Tampa Bay originates outside of its watershed Black oval = Tampa Bay airshed green area = Tampa Bay watershed From R Dennis Atmospheric Sciences Modeling Division National Oceanic and Atmospheric Administration and US Environmental Protection Agency
108 Integrating Science and Resource Management in Tampa Bay Florida
reductions can have substantial impacts on the local fauna Fish and other highly mobile organisms can often disperse from areas with reduced DO levels but both they and the less mobile benthic infauna can be physiologi-cally stressed or killed by lengthy exposures to DO values that reach hypoxic (DO lt 20 milligrams per liter mgL) or anoxic (DO = 0 mgL) levels (Gray and others 2002 fig 5ndash4)
Although phytoplankton and macroalgae require about 20 different nutrients and minerals to survive and reproduce (Reynolds 2006) the macro-nutrients nitrogen (N) and phosphorus (P) tend to be the most impor-tant factors driving the eutrophication process in surface waterbodies (NRC 2000) In pristine environments the availability of N andor P is usually low enough to limit algal growth rates By adding large amounts of biologically available N or P to surface waters human activities can reduce or eliminate these nutrient limitations and stimulate bloom development
Manmade sources of N and P that are contributing to eutrophication in the Tampa Bay watershed and elsewhere include urban residential (fig 5ndash5) and agricultural stormwater runoff municipal sewage discharges malfunc-tioning or improperly sited septic systems and nutrient-enriched industrial discharges (for example from facilities involved in the manufacture or shipping of fertilizer products) (TBEP 2006) In addition the combus-tion of fossil fuels for transportation electric power generation and other human uses generates atmospheric N oxide emissions and residential and agricultural fertilizer applications and other agricultural activities generate atmospheric ammonia emissions These N oxide and ammonia emissions can contribute to the nutrient loads received by the bay and by many other surface waterbodies (for example Paerl 1997 Poor and others 2001 Pollman 2005 TBEP 2006)
Estuaries and other coastal waterbodies vary a great deal in their susceptibility to eutrophication The susceptibility depends largely on their flushing characteristics and hydraulic residence times which are influenced by tidal forces freshwater inflows and bathymetry (Bricker and others
Figure 5ndash4 Fish kill associated with a bloom of the microalgae Pyrodinium bahamense and very low dissolved oxygen readings in Old Tampa Bay 2008 Photo by Florida Fish and Wildlife Conservation Commission Fish and Wildlife Research Institute
Chapter 5 Water Quality 109
Figure 5ndash5 Residential lawn fertilization
Figure 5ndash6 Macroalgae (Ulva) mat in Hillsborough Bay Photo by Roger Johansson City of Tampa
2007) Estuaries in which water and nutrients are rapidly flushed allow insufficient time for algal blooms and other symptoms of eutrophication to develop and show relatively low susceptibility to nutrient influxes Those with longer residence times allow more time for nutrients to be taken up by phytoplankton and macroalgae providing opportunities for undesirable blooms to form and persist (Cloern 2001) Most parts of Tampa Bay appear to be flushed rela-tively quickly particularly during periods when adequate freshwater inflows and favorable winds occur (Goodwin 1989 Weisberg and Zheng 2006 Meyers and others 2007) This makes the bay as a whole less sensitive than it would otherwise be to increasing nutrient influxes
Despite its relatively rapid flushing characteristics however Tampa Bay exhibited symptoms of extreme nutrient enrichment during the late 1970s and early 1980s (Johansson 1991) a period when it was receiving much larger nutrient loading than it does today (Zarbock and others 1994 Janicki Environmental Inc 2008) Those symptoms included large and frequent blooms of phyto-plankton and macroalgae (fig 5ndash6) reduced water clarity reduc-tions in the areal extent and ecological quality of seagrass meadows increased variability in DO concentrations and increased frequency of stressfully low DO levels Eutrophication impacts were particu-larly severe in Hillsborough Bay the part of Tampa Bay that was receiving the largest contributions from municipal sewage effluent and industrial leaks and spills during that period (Santos and Simon 1980 Johansson and Squires 1989 Johansson 1991 Johansson and Lewis 1992)
110 Integrating Science and Resource Management in Tampa Bay Florida
Fortunately water quality in the bay is much better now than it was in the late 1970s and early 1980s making Tampa Bay one of the few estuaries in the US that has shown evidence of improving environmental conditions in recent decades (Johansson and Lewis 1992 Greening and Janicki 2006 Morrison and others 2006 Bricker and others 2007 Duarte and others 2009) These water-quality improvements have been due in large part to upgrades in wastewater-treatment practices at municipal wastewater-treatment plants in the region (fig 5ndash7) Since 1980 all wastewater-treatment plants that discharge to the bay or its tributaries have been required by State legislation (the Grizzle-Figg Act Section 403086 Florida Statutes) to meet advanced wastewater-treatment standards a step that has reduced annual nutrient loads from these sources by about 90 percent (Johansson 1991 Johansson and Lewis 1992 TBEP 2006) In addition to these infrastructure upgrades the bay has also benefited from
bull Reductionsindredge-and-fillactivitiesbull Reduced discharges from fertilizer manufacturing facilities and
port facilities during the shipping of fertilizer productsbull Reduced atmospheric N emissions from electric power
generating stationsbull Improvements in urban and industrial stormwater management
practices and bull Improved pollution control by agricultural operations (Greening
and Janicki 2006 TBEP 2006)
Figure 5ndash7 Aerial view of HF Curren wastewater-treatment plant Photo by Southwest Florida Water Management District Time-series plots of a number of important
water-quality indicators including water clarity chlorophyll a (an indicator of phytoplankton abundance) and DO concentrations show the water-quality impacts that occurred during the late 1970s and early 1980s and the improvements that have occurred since that time (figs 5ndash8 5ndash9 5ndash10) Additional information on the eutrophication issue and management of nutrient loadings is given below
Figure 5ndash9 Opposite page bottom Chlorophyll a annual average concentrations 1974ndash2008 for Hillsborough Bay Old Tampa Bay Middle Tampa Bay and Lower Tampa Bay Horizontal lines depict Tampa Bay Estuary Program target concentrations supporting seagrass growth All points below lines are meeting targets Data from Environmental Protection Commission of Hillsborough County
Figure 5ndash8 Opposite page top Water clarity as measured by average annual Secchi disk depth 1974ndash2008 for Hillsborough Bay Old Tampa Bay Middle Tampa Bay and Lower Tampa Bay Horizontal lines depict Tampa Bay Estuary Program water-quality targets All points above lines are meeting targets Data from Environmental Protection Commission of Hillsborough County
Chapter 5 Water Quality 111
Mea
n an
nual
chl
orop
hyll
conc
entra
tion
in m
icro
gram
s pe
r lite
ra
5
10
15
20
1970 75 80 85 90 95 2000 05 2010
0
10
15
20
1970 75 80 85 90 95 2000 05 2010
5
10
15
40
1970 75 80 85 90 95 2000 05 2010
2
3
4
5
8
1970 75 80 85 90 95 2000 05 2010
6
7
Old Tampa Bay Hillsborough Bay
Middle Tampa Bay Lower Tampa Bay
Year Year
Year Year
5
Targetconcentration
Targetconcentration Target
concentration
20
25
30
35
Targetconcentration
Mea
n an
nual
chl
orop
hyll
conc
entra
tion
in m
icro
gram
s pe
r lite
ra
Me
an
an
nu
al S
ec
ch
i dis
k d
ep
th i
n m
ete
rs
Me
an
an
nu
al S
ec
ch
i dis
k d
ep
th i
n m
ete
rs
05
10
15
20
25
1970 75 80 85 90 95 2000 05 2010
05
10
15
20
35
1970 75 80 85 90 95 2000 05 2010
25
30
05
10
15
20
1970 75 80 85 90 95 2000 05 2010
15
20
25
30
45
1970 75 80 85 90 95 2000 05 2010
35
40
Old Tampa Bay Hillsborough Bay
Middle Tampa Bay Lower Tampa Bay
Year Year
Year Year
Water quality target
Water quality target
Water qualitytarget
Water quality target
112 Integrating Science and Resource Management in Tampa Bay Florida
Despite the dramatic nutrient-related water-quality improvements that have occurred in Tampa Bay since the 1980s other water-quality issues still remain to be addressed Within the watershed the FDEP and the USEPA have identified a large number of freshwater bodies that are not currently meeting State or Federal water-quality standards and therefore are designated as ldquoimpairedrdquo (fig 5ndash11) The bay itself is also designated as impaired due to elevated levels of mercury that are found in several fish species inhabiting its waters Currently numerous rivers and all estuarine and marine waterbodies in Florida are listed as impaired for this reason Portions of the bay and watershed are also classified as impaired due to occasionally elevated levels of fecal indicator bacteria which prevent those areas from meeting their designated uses as swimming beaches or approved shellfish harvesting areas (FDEP 2001) Portions are also still classified as impaired because of excessive nutrient enrichment although all major bay segments have been meeting locally developed N load management and water clarity goals in recent years
The Tampa Bay estuary and its watershed are not unique in containing a large number of impaired waters The USEPA estimates that over 40 percent of surface waters in the United States do not currently meet
45
55
70
80
1970 75 80 85 90 95 2000 05 2010
1970 75 80 85 90 95 2000 05 2010
45
50
55
80
1970 75 80 85 90 95 2000 05 2010
1970 75 80 85 90 95 2000 05 2010
Old Tampa Bay Hillsborough Bay
Middle Tampa Bay Lower Tampa Bay
Year Year
Year Year
Target concentration
60
65
70
75
Mea
n an
nual
mid
-dep
th d
isso
lved
oxy
gen
conc
entra
tion
in m
illig
ram
s pe
r lite
r 50
60
65
75
Mea
n an
nual
mid
-dep
th d
isso
lved
oxy
gen
conc
entra
tion
in m
illig
ram
s pe
r lite
r
Target concentration45
55
70
80
50
60
65
75
Target concentration
Target concentration45
55
70
80
50
60
65
75
Figure 5ndash10 Average annual mid-depth dissolved oxygen concentrations 1974ndash2008 for Hillsborough Bay Old Tampa Bay Middle Tampa Bay and Lower Tampa Bay Horizontal lines depict State criteria for daily average dissolved oxygen concentrations Data from Environmental Protection Commission of Hillsborough County
Chapter 5 Water Quality 113
HARDEE
MANATEE
HILLSBOROUGHPINELLAS
PASCO
SARASOTA
POLK
SUMTER LAKE
Gulf
of
Mex
ico
HERNANDO
CITRUS
10 MILES0
10 KILOMETERS0
N
EXPLANATIONWater body considered impaired by the
Florida Department of Environmental
Protection from one or more of the
following nutrients dissolved oxygen
biological oxygen demand
fecal coliforms mercury or other
water-quality constituents
Figure 5ndash11 Impaired waterbodies within the Tampa Bay watershed 2009 Red areas are considered impaired for one or more of the following nutrients dissolved oxygen biological oxygen demand fecal coliforms mercury or other water-quality constituents From Florida Department of Environmental Protection
114 Integrating Science and Resource Management in Tampa Bay Florida
water-quality standards On a nationwide basis this amounts to over 20000 individual river segments lakes and estuaries These impaired waters include about 300000 mi of rivers and shorelines and about 5 million acres of lakes which are impacted primarily by excess nutrients sediments and potentially pathogenic microorganisms The USEPA estimates that a large majority of the US population mdash 218 million people mdashlives within 10 mi of an impaired waterbody (httpwwwepagovowowtmdl)
Under the Federal Clean Water Act States are required to identify the impaired waters within their jurisdiction and to develop total maximum daily loads (TMDLs) that estimate the reductions in pollutant loads that need to be achieved to eliminate those impairments For a given impaired waterbody a TMDL estimates the maximum amount of a particular impairment-causing pollutant that the waterbody can receive and still meet water-quality stan-dards A TMDL also allocates the allowable load among point and nonpoint pollutant sources (NRC 2008) Both the State of Florida and the USEPA are currently involved in developing TMDLs to address water-quality impair-ments in Tampa Bay and its contributing watershed
Water-Quality Monitoring
As figures 5ndash8 through 5ndash10 demonstrate Tampa Bay managers are fortunate to have a water-quality database that extends back to the early 1970s allowing them to track changes in water quality that have occurred over a period of more than three decades Much of the long-term monitoring has been done by EPCHC which began collecting water-quality data in 1974 and currently conducts monthly monitoring of more than 50 stations in Tampa Bay (fig 5ndash12) and a comparable number of stations in the Hillsborough County part of the watershed The EPCHC monitoring network has been a particularly valuable data source for tracking long-term changes in bay water quality because it includes most major bay segments extends over the longest time period and has striven to maintain consistent sampling and analytical methods throughout the period From 1978 through 2011 the City of Tampa has also maintained an active monitoring program focused primarily on Hillsborough Bay but extending into other bay segments In recent decades Manatee County Pinellas County FDEP and SWFWMD have also carried out moni-toring programs providing valuable water-quality information for the parts of the bay and watershed that fall within their jurisdictions
A Regional Ambient Monitoring Program organized by the TBEP in the early 1990s and continued by local governments and agencies through the present provides a coordinating forum that works to maintain consistency in the sample collection and analytical methods used by the various monitoring organizations Over time with support from the National Estuary Program offices in Sarasota Bay and Charlotte Harbor and other local and regional organizations the Regional Ambient Monitoring Program has expanded encouraging greater methodological consistency and data comparability among surface-water monitoring programs throughout the west-central and southwest Florida region
The availability of the consistent long-term water-quality data provided by the local monitoring programs in the Tampa Bay area has supported bay management efforts in a number of important ways allowing managers to document the negative impacts of the excessive pollutant loads that the bay
Chapter 5 Water Quality 115
136112
144
13710965
64
46
4762
6163
6640
41
505167
38
3668
33 13
3214 81
11 80 73
55
7
7044
2 58
54
52 7174
8
9
16
1928
2123
25
91
24
92
95
96
9394
90
84
6
60
82
Largo
Tampa
Bradenton
SafetyHarbor
StPetersburg
AnnaMaria
Ruskin
0 5 MILES
0 5 KILOMETERS
MANATEECOUNTY
HILLSBOROUGHCOUNTY
PINELLASCOUNTY
Hillsborough
Bay
Little
Manatee
River
Alafia River
Hillsborough River
Gu
lfof
Mex
ico
Manatee River
27deg45
82deg30
EXPLANATIONFreshwater monitoring stationMarine monitoring station
Tampa Bay
Figure 5ndash12 Environmental Protection Commission of Hillsborough County water-quality stations in Tampa Bay From Environmental Protection Commission of Hillsborough County
116 Integrating Science and Resource Management in Tampa Bay Florida
Box 5ndash1 Coastal Groundwater Exchange in Tampa Bay
By Kimberly K Yates (US Geological SurveyndashSt Petersburg Florida) and Peter W Swarzenski (US Geological SurveyndashSanta Cruz California)
Developing an accurate water budget for the Tampa Bay region is a critical component for monitoring the quantity and quality of freshwater available for human consumption and to ensure a healthy estuarine ecosystem today An accurate water budget is also needed to manage Tampa Bay wisely into the future under expected environmental stressors such as sea-level change and continued urbanization Surface-water runoff from principal rivers and creeks into the bay can be quantified using routine streamgauging techniques However the coastal rivers of Florida also contain an additional hydrologic component mdash base flow (Swarzenski and Yates 2005) The underlying geology of the Tampa Bay area is characterized by karstic limestone topography and porous sediment that provides conduits for significant groundwater flow toward Tampa
Bay (see Chapter 4) This persistent flow of coastal groundwater plays an important role in the transport of nutrients and some contaminants to the bay The quantity and quality of this submarine groundwater discharge has until recently been overlooked in water and constituent budgets for the bay
The USGS combined data on the structural geology of Tampa Bay with a variety of geochemical and modeling techniques to measure the quantity and quality of submarine groundwater discharge to Tampa Bay Seismic profile data (see Chapter 4) were used to identify geologic features such as sinkholes and collapse features that may act as conduits for submarine ground-water flow (box 5ndash1 fig 1) A technique called marine continuous resistivity profiling was used to identify whether or not specific geologic features were associated
Box 5ndash1 Coastal Groundwater Exchange in Tampa Bay 117
with freshwater masses located beneath the bay floor Continuous resistivity mapping is performed by towing a series of current-producing and potential electrodes behind a boat These sensors send an electrical pulse into the seafloor that bounces back to the sensors indicating whether the water or sediment below the seafloor is fresh or salty Box 5ndash1 Figure 2 shows a three-dimensional resistivity profile taken near the Little Manatee River in Tampa Bay which depicts a freshened water lens that extends out into the bay and beneath the bay floor (Swarzenski and Yates 2005 Swarzenski and others 2007a Kroeger and others 2007) Salinity was measured in pore water from sediment cores (see Chapter 4) that correspond to locations with freshened water masses to confirm their presence (Swarzenski and Baskaran 2007) Groundwater samples were also taken from about 70 locations throughout the bay area for groundwater-salinity and nutrient analyses (Kroeger and others 2007)
Three different methods were used to quantify submarine groundwater discharge into the bay
(1) Measurement of naturally occurring radionu-clides including radium and radon (Swarzenski and others 2007a)
(2) Calculation of a watershed water budget (Kroeger and others 2007) and
010125015802025103160398050106310794101261582025139863179410020010005000
Saltw
ater
Brac
kish
wat
erFr
esh-
wat
er
Resi
stiv
ity o
hm-m
EXPLANATION
1000
2000
3000
3500
0
2500
1500
500
0
1200
2400
3600
Dis
tance p
erpendic
ular to
the
Little
Manate
e Riv
er in
mete
rsDistance parallel to the
Little Manatee River in meters
0
5
10
15
20
25De
pth
in
me
ters
(3) Numerical modeling (Cliff Hearn ETI contractor personal comm 2005)
Submarine groundwater discharge rates calculated from the distribution of radium-223 224 226 and 228 ranged from 16 to 103 m3 d-1 per meter of shoreline length depending on the sampling season Based on the water-shed water-budget method the rate of submarine ground-water discharge to the bay is estimated at 29 m3 d-1 per meter of shoreline Estimates of these discharge rates based on continuous radon measurements were 56 m3 d-1 per meter of shoreline These radon-based measurements indicate that flow of brackish and saline groundwater to the bay also represents a significant component of submarine groundwater discharge Results indicate that the ratio of freshwater submarine groundwater discharge flux to streamflow into the bay is about 20 to 50 percent Based on these estimated discharge rates and measure-ment of nutrient concentrations in groundwater samples nutrient loads (N as TDN DIN or NO2+NO3 and phos-phate as PO43-) to the bay due to freshwater submarine groundwater discharge was estimated at 40 to 100 percent of the stream-discharge loads These results indicate that the transport of groundwater and nutrients to the bay via submarine groundwater discharge is significant compared to river and stream loads
118 Integrating Science and Resource Management in Tampa Bay Florida
Box 5ndash2 Bay Region Atmospheric Chemistry Experiment (BRACE) Study
By Holly Greening (Tampa Bay Estuary Program) Noreen Poor (University of South Florida) and Tom Atkeson (Florida Department of Environmental Protection)
The Bay Region Atmospheric Chemistry Experiment (BRACE) study was developed in response to the persistent increasing trend in N oxide emissions in Florida It assessed potential effects of these emissions on the air quality and ecological health of the Tampa Bay area to
bull Improve estimates of N deposition to the bay
bull Apportion atmospheric N between local regional and remote sources
bull Assess the impact of utility controls on N deposition and
bull Provide a technical basis for developing more effective community control strategies to reduce N deposition
In response to an initial estimate that direct deposition of atmospheric N contributed about 30 percent to the total N load to Tampa Bay the TBEP began monitoring rainfall and ambient air concentra-tions of N at an urban bayside location in 1996 Flux calculations from observational data supported the initial loading estimate and raised questions about contribu-tions from indirect atmospheric N deposition and the sources of N to the airshed Model predictions describe this region as centered over peninsular Florida roughly elliptical and roughly three times the size of the bay region (see fig 5ndash3)
The BRACE study began in 2000 and included both long-term and short-term intensive measure-ment campaigns as well as concurrent special studies BRACE planners sought experimental designs that balanced project resources between measurements that would support mesoscale modeling offered direct evidence of source contributions and N deposition rates took advantage of new technologies and explored new theoretical constructs BRACE participants included managers scientists engineers and technicians from the Argonne National Laboratory EPCHC FDEP NOAA Pinellas County Department of Environmental Management TBEP Texas Tech University USEPA University of Maryland University of Miami University of Michigan University of South Florida (USF) and URG The project was supported by the FDEP Tampa Electric Company and in-kind contributions from BRACE participants
Within the framework established by the project goals BRACE researchers improved N deposition estimates by expanding the air pollutant monitoring network (box 5ndash2 figs 1 and 2) by deploying state-of-the-art sensors and monitors and by analyzing and interpreting meteorological and air pollutant concentra-tion data with sophisticated atmospheric chemistry and physics models Coupled with the meteorological
Box 5ndash2 Bay Region Atmospheric Chemistry Experiment Study 119
and emissions data BRACE measurements enabled researchers to reconstruct a four-dimensional image of N emissions dispersion transport and transformation to analyze the role in N processing and transport of the land-sea breeze and regional wind convergence zones to identify deficiencies in N emissions inventories and to calculate total N deposition rates over the Tampa Bay watershed including the direct total N deposition rate to Tampa Bay The N species of interest were NO NO2 HNO3 HNO2 NOz (that is NOy-NOx) NH3 NH4+ and organic amines NO NO2 HNO3 HNO2 PAN and other organic nitrates NO3bull and N2O5 comprise NOy
The pollutants of interest the models and the modeling objectives dictated the temporal and spatial scales of the observations Measurements on shorter time scales for example allowed better resolution of regional air pollution plumes and improved agreement with equilibrium and kinetic assumptions inherent in many model algorithms New technologies made possible near real-time monitoring of solar radiation
actinic flux wind speed and direction temperature relative and specific humidity and con centrations of nitrogen oxide and nitrogen dioxide nitric acid total oxidized nitrogen species (NOy) nitrate ammonia ozone carbon monoxide sulfur dioxide mercury organic carbon (OC) black carbon (EC) volatile organic compounds (VOCs) metals and aerosol mass and number The measurements provided a better understanding of
bull The magnitude and composition of gaseous and aerosol N species
bull Nitrogen-depositionvelocitiesandfluxesboth to the watershed and directly to the bay surface
bull Source emissions and the contributions of those emissions to regional air quality and
bull The limitations on instrument and model performance Results from the BRACE study were summarized by Atkeson and others (2007)
120 Integrating Science and Resource Management in Tampa Bay Florida
received during the mid to late 1970s and to track the improvements in bay water quality that have occurred since that time It has also played a critical role in the development of the water-quality targets that are being used to guide the seagrass restoration program as discussed in Chapter 4 Similarly long-term monitoring data from bay tributaries have provided important information on water-quality patterns and trends in those river systems and the pollutant loads they deliver to the bay
Estimating Pollutant Loads and Bay Responses
In addition to monitoring data managers also rely on several other types of information to guide their efforts to protect and restore water quality Estimates of the quantities of different pollutants being discharged to the bay and its tributaries are developed and updated every few years by the TBEP and likely magnitudes of key pollutant discharges and the locations where they enter the bay are determined (for example Pribble and others 2001 Poe and others 2005 Janicki Environmental 2008) Computer models (for example Janicki and Wade 1996 Morrison and others 1997 Wang and others 1999) have been used to summarize managersrsquo current knowledge assumptions and hypotheses regarding bay responses to those pollutants and to predict how water-quality conditions will respond to changes in pollutant loadings
The methods used to estimate pollutant loadings are technically challenging and the results contain considerable uncertainty that must be taken into account when considering potential management actions Estimation methods have improved over time thanks to technological refinements that increase the sensitivity and accuracy of monitoring instru-ments and due to improvements in managersrsquo understanding of the transport and fate of different types of pollutants in the aquatic environment However certain categories of sources such as dry atmospheric deposition and subma-rine groundwater discharge remain difficult to measure and are continuing sources of uncertainty Recent USGS research (Kroeger and others 2007 Swarzenski and others 2007a box 5ndash1) has made important advances in the estimation of submarine groundwater discharges to the bay Similarly the Bay Region Atmospheric Chemistry Experiment (BRACE) study a collaborative multiagency research effort (Atkeson and others 2007 box 5ndash2) along with a recent NOAA atmospheric modeling study (Dennis and Arnold 2007) have provided updated estimates of dry and wet atmospheric deposition of N and other water-quality constituents to the bay and its watershed
The ability of computer models to simulate and forecast water-quality responses to changing pollutant loadings also tends to improve over time as advances in computer technology encourage the development and use of more detailed realistic and computationally demanding algorithms The ongoing management effort should also encourage improvements in the realism of the water-quality models that are applied to the bay as managers and modelers go through an iterative process of developing and testing model predictions against the water-quality changes that are observed over time
Chapter 5 Water Quality 121
Adaptive Management
The Tampa Bay water-quality management program is a collaborative flexible multidisciplinary effort that has evolved in response to changes in technology data availability and scientific understanding In order to address the inherent uncertainties and complexities of bay responses to changing pollutant loads and other environmental conditions the program has adopted an ldquoadaptive managementrdquo (Holling 1978 Lee 1993) approach Although adaptive management has been defined in a number of ways its goal is to improve managersrsquo understanding of mdash and ability to achieve mdash a set of well-defined ecological objectives using a combination of carefully designed management interventions and evaluations of moni-toring data Environmental responses to the interventions are monitored and the resulting information is used to update and refine management actions (for example NRC 2000 Greening and Elfring 2002 Gregory and others 2006) The adaptive nutrient management strategy used in Tampa Bay (fig 5ndash13) is based on this approach incorporating periodic evaluations of water-quality and seagrass-management goals as well as annual evaluations of water-quality monitoring data and the redirection of management actions on an as-needed basis
Current and Anticipated Water-Quality Management Issues
Monitoring and improving water quality remain top priorities for resource managers in Tampa Bay particularly in the face of increased stress to water resources as the bay area population continues to grow Nutrient input and cycling eutrophication and its effects on phytoplankton produc-tivity and seagrass growth are critical issues that scientists and resource managers are addressing in the context of current environmental conditions and the need for continued management of water quality in the future
Nutrient Inputs and Eutrophication
At the watershed scale management of estuarine eutrophication generally focuses on the control of both N and P inputs (Cloern 2001 Howarth and others 2002 Paerl 2008 2009) In the temperate-zone estuary systems where most eutrophication studies have been carried out P is usually the nutrient of greatest concern in the freshwater tributaries and tidal fresh zones (areas where salinities are typically less than 05 ppt) because excessive P loads to these areas often stimulate blooms of undesirable phytoplankton (Likens 1972 Schindler 1975 Reynolds 2006) particularly cyanobacteria (Chapman and Schelske 1997 Chorus and Bartram 1999 Paerl 2008) In contrast N is generally the nutrient of greatest concern in the brackish and marine areas where salinities typically vary from 05 to about 35 ppt This is because N is the nutrient that more frequently limits phytoplankton productivity in these higher-salinity nearshore locations (NRC 2000 Cloern 2001) Although this generalization is not true for all Florida estuaries or coastal waters mdash several of which are known to be P limited (Myers and Iverson 1981 Fourqurean and others 1992) or co-limited by N and P (Mortazavi and others 2000) mdash it does appear to be true of Tampa Bay (Johansson 1991 Vargo and others 1991 Wang and others 1999 Johansson 2005)
122 Integrating Science and Resource Management in Tampa Bay Florida
Is waterbody meetingstandards desired use
Preservation Restoration
Susceptible to nutrientover-enrichment
P1
R1Set goals forwaterbodyrestoration
Monitoringand periodic
reassessment
YES NO
YES
NO
Project futureloadings and impact
to waterbody
P2
R2Estimate existing loading
and develop nutrientand water budgets
R3Determine
nutrient loading andimpacts to waterbody
Identify most effectiveload maintenance
strategy
P3Implement
andmonitor
R4Determine load
reductions neededto meet goals
R5Implement
effective reductionstrategy
R6
Monitor results
Satisfactoryprogress toward
goals
Continuemanagement
strategy
NO
YES
Figure 5ndash13 Key decision points for developing and implementing an adaptive site-specific nutrient management strategy Modified from Greening and Elfring (2002)
Chapter 5 Water Quality 123
Because of the geological characteristics of its watershed Tampa Bay is somewhat unusual with respect to the P loadings it receives Each of the four largest rivers that discharge to the bay mdash the Hillsborough Alafia Little Manatee and Manatee Rivers mdash drains a part of the central Florida phosphate district which is located in parts of Hillsborough Manatee and Polk Counties (fig 5ndash14) The phosphate district also includes the areas of Manatee Polk and DeSoto Counties that lie in the adjacent Charlotte Harbor watershed As its name implies the district contains large deposits of a phosphate-rich geological matrix mdash the Bone Valley Member of the Peace River Formation (Spechler and Kroening 2007) mdash which is a mix of clay quartz sand dolomite and phosphate ore that is mined and processed to produce commercial fertilizer and livestock feed-supplement products (McClellan and Eades 1997)
The central Florida phosphate district along with a smaller mining area located in northern Florida produces the largest annual tonnage of phosphate ore (gt30 million tons in 1990) of any US State and accounts for about 30 percent of total world production (McClellan and Eades 1997) The rivers and streams that drain the phosphate district contain unusually high concen-trations of P in comparison to surface waters in other parts of Florida and the United States due to a combination of natural leaching and discharges from phosphate mining and processing operations (Odum 1953)
Because of the very large P loads that Tampa Bay receives from its watershed concentrations of soluble-reactive P mdash the water-quality indi-cator that is commonly used to estimate levels of the inorganic form of P that is directly taken up by phytoplankton mdash usually exceed phytoplankton requirements in most parts of the bay and in the tidal reaches of its major tributaries (Johansson 1991 Vargo and others 1991 Wang and others 1999) The Charlotte Harbor estuary and its Peace River Basin which also drains a part of the mining district exhibit similar elevated soluble-reactive P levels (McPherson and Miller 1994)
In the freshwater tributaries of the Tampa Bay and Charlotte Harbor watersheds these elevated soluble-reactive P levels contribute to a number of environmental and economic impacts Currently more than 80 freshwater lakes and stream segments in the Tampa Bay watershed and more than 50 lakes and stream segments in the Peace River watershed of Charlotte Harbor are classified as water-quality impaired by FDEP and USEPA due to elevated concentrations of nutrients and chlorophyll extreme diurnal fluctuations in DO concentrations and other symptoms of excessive eutrophication (FDEP 2003 2005 2006 2009) These impairments affect the quality of life of area residents and impact the environmental services provided by the impaired waterbodies Development of TMDLs for the impaired waterbodies and implementation of water-quality improvement and management programs to bring them into compliance with State and Federal standards are costly processes The tidal freshwater reaches of several rivers in the region which are similar to freshwater lakes in some of their hydrologic and water-quality characteristics also show evidence of excessive eutrophication and may require the development and implementation of nutrient TMDLs
At a more conjectural level recent research suggests that in some years the P and colored dissolved organic material discharged from the Tampa Bay and Charlotte Harbor watersheds may contribute to the development of blooms of N-fixing cyanobacteria (Trichodesmium spp) in nearshore waters of the Gulf of Mexico (Walsh and others 2003 2006) Under certain
124 Integrating Science and Resource Management in Tampa Bay Florida
Mines subject to reclamation
EXPLANATION
Mosaic
CF Industries Inc
US Agricultural
Chemicals
Estech Inc
Exxon Mobil
Agrifos LLC
Clear Springs Land
Development
Mineable limit
Gypsum stacks
Pending mines
Potential future mines
10 MILES0
10 KILOMETERS0
Hardee
Hillsborough
PascoPolk
Manatee
DeSotoSarasota
Piney Point
Four Corners
Ona Mine
Wingate East
Keys
Pine Level
Horse Creek
Hillsb
oro
ugh
Bay
TampaBay
Manatee
Myakka River
Manatee River
River
Pea
ce
Alafia
River
Little
Hil
lsb
oro
ug
h
Riv
er
275
75
4
N
75
Riv
er
Figure 5ndash14 Central FloridaBone Valley phosphate district From Bay Soundings (July 2005)
Chapter 5 Water Quality 125
conditions the Trichodesmium blooms may in turn provide nutrients that help support blooms of red tide (Karenia brevis) in the nearshore area located between the mouths of Tampa Bay and Charlotte Harbor (Walsh and others 2001 2003 2006) As noted below however relationships between land-based nutrient discharges and red tide blooms are not well understood and are an area of active research and debate (summarized by Alcock 2007)
Factors Affecting Phytoplankton Productivity in Tampa Bay
Within Tampa Bay itself phytoplankton productivity is influenced by a number of environmental factors Bioassay experiments conducted in Hillsborough Bay (Johansson 1991 2005) indicate that P is not a limiting nutrient in that part of the bay and that the availability of N is more likely to limit phytoplankton growth there Short-term bioassays conducted by Vargo and others (1991) in the Little Manatee and Alafia rivers and nearby parts of Tampa Bay produced varying responses to N and P additions The results indicated that at times inorganic N and P were both present at elevated (nonlimiting) concentrations in those areas Vargo and others (1991) concluded that phytoplankton populations in Tampa Bay can be considered ldquonutrient sufficient to borderline N limitedrdquo for short-term photosynthesis requirements
Using a mechanistic water-quality model Wang and others (1999) concluded that phytoplankton productivity in the bay during the period 1985 through 1994 was limited primarily by the availability of sunlight (due to light attenuation by phytoplankton other turbidity sources and water color) and secondarily by the availability of inorganic N Wang and others (1999) found that on average model-based phytoplankton growth rates were reduced to levels 60 to 80 percent below their potential maximum values because of limited light availability in the four major segments of Tampa Bay whereas limited N availability caused a smaller reduction (10 to 40 percent below potential maximum growth rates) and P availability caused essentially no reductions The model predicted that light limitation was more pronounced in the upper bay segments (Hillsborough Bay and Old Tampa Bay) than in Lower Tampa Bay
Although N appears to be less limiting than light the model-based simula-tions predicted that increases in N loadings from external sources would cause chlorophyll a concentrations to increase whereas load reductions would have the opposite effect (Wang and others 1999) Cases of limitation by physical factors such as light or temperature as well as by nutrient availability apparently occur in a number of aquatic systems (Falkowski and Raven 2007) Changes in external N loadings to Hillsborough Bay and Old Tampa Bay were predicted to have cascading effects throughout the estuary due to down-bay transport of nutrients and phytoplankton from those areas to other bay segments (Wang and others 1999) Similar results were found in TBEP-sponsored studies using empirical (statistically based) modeling approaches (Janicki and Wade 1996 Greening and Janicki 2006) The corroborative find-ings of the mechanistic and empirical models increased managersrsquo confidence in the guidance provided by the two approaches
Among the many factors that affect phytoplankton productivity in the open waters of the bay anthropogenic N loading appears to be the primary one that can be effectively controlled by management activities carried out in the watershed (Johansson 1991 Wang and others 1999 Greening and
126 Integrating Science and Resource Management in Tampa Bay Florida
Janicki 2006 TBEP 2006) As a result a principal focus of the Tampa Bay eutrophication management effort has been to cap the annual N loads that enter the bay at levels that appear necessary to achieve the bay-wide water clarity targets and seagrass restoration goals summarized in Chapter 4
External Nitrogen Sources and Estimated Annual Loadings
The N that is present in an estuary at any given time consists of two components ldquonewrdquo or exogenous N that has recently been discharged from the watershed or deposited from the airshed and ldquorecycledrdquo or endogenous N that has been present in the system for some time and has already been cycled through one or more portions of the estuarine food web (Nixon 1981 Paerl 1997 NRC 2000 Seitzinger and others 2002) For Tampa Bay the TBEP and its partners have conducted a series of projects to estimate the sources magni-tudes and pathways of both types of N and their effects on bay water quality
The assumptions and methods used to estimate annual loads of new N to the estuary have been summarized in a number of technical reports and publications (Pribble and others 2001 Poe and others 2005 Greening and Janicki 2006 Janicki Environmental 2008)
bull The sources of N loads to Tampa Bay are varied (for example fig5ndash15)andincludestormwaterrunoffatmosphericdepositiongroundwatersprings and fertilizer losses from port facilities as well as discharges from traditional point sources such as municipal sewage-treatment plants and industrial facilities
bull Freshwater inputs to the bay via rainfall are estimated using data from a number of National Weather Service and other rainfall-monitoring sites in the watershed Monthly rainfall records are used to develop estimates of direct wet deposition of N to the bay surface and to estimate N loads in runoff from ungaged parts of the watershed
Figure 5ndash15 Nutrient pollution sources include emissions from transportation and point sources such as stormwater pipes
Chapter 5 Water Quality 127
bull About57percentofthewatershedisgagedforbothflowandwaterquality allowing direct estimates of loads (Greening and Janicki 2006) For the remaining ungaged areas loads from stormwater runoff are estimated using statistical (regression-based) methods basedonrainfalllandusesoilsandseasonalland-use-specificwater-quality concentrations
bull To calculate load estimates for point sources values for all facilities with direct discharges to surface waters and all land application dischargeswithanannualaveragedailyflowofge01Mgaldarecalculated from records that are reported by the facilities to State and Federal regulatory agencies
bull Wet atmospheric deposition of N directly to open waters of Tampa Bay is calculated by multiplying the volume of precipitation onto the bay by N concentration in rainfall Dry deposition is estimated using a seasonal dry-to-wet deposition ratio derived from 5 years of concurrent wet and dry deposition measurements (Poor and others 2001)
bull GroundwaterflowsareestimatedforeachbaysegmentOnlygroundwaterinflowthatentersthebaydirectlyfromtheshorelineor bay bottom is considered Groundwater and septic tank leachate inflowstostreamsarealreadyaccountedforthroughmeasuredormodeledsurface-waterflowasnonpointsourceloadingandtherefore are not included in groundwater loading estimates Wet-anddry-seasongroundwaterflowestimatesarecalculatedusingaflownetanalysisandDarcyrsquosequationfollowingthemethods of Brooks and others (1993) Total N concentration data forsurficialintermediateandFloridanaquifersareobtainedfromthe SWFWMD ambient groundwater monitoring program
Estimates of average annual N loads generated using these methods for a number of different time periods extending from the late 1930s to 2003 are shown in fig 5ndash16 The estimated values illustrate the large increase in overall N loads and in N contributions from point sources that occurred between the late 1930s and the late 1970s as well as the gt90 percent reduction in annual point source N loads that occurred in the early 1980s The values also show the estimated increase and subsequent reduction in N loads due to fertilizer product losses at commercial shipping facilities and the increases and subsequent reduc-tions in N loads due to atmospheric deposition that have occurred in recent decades As a result although estimated N loads in the late 1970s were dominated by point source discharges stormwater runoff and atmospheric deposition have been the largest estimated source categories in more recent periods (fig 5ndash16) The atmospheric deposition source category depicted in fig 5ndash16 estimates only the amount of N that is deposited directly from the atmosphere to the bay surface From a broader perspective atmospheric deposition may contribute as much as 50 to 67 percent of the ldquonewrdquo N that is discharged to the bay each year because much of the N that is measured in stormwater runoff appears to originate as atmospheric deposition on the watershed (TBEP 2006 Dennis and Arnold 2007) Recent biogeochemical studies by USGS researchers (Kroeger and others 2007 Swarzenski and others 2007b) also suggest that submarine groundwater discharges may be a much larger source of N inputs than was suspected previ-ously perhaps as large as 40 to 100 percent of the loads carried by rivers and streams (Kroeger and others 2007 Swarzenski and others 2007b box 5ndash1)
128 Integrating Science and Resource Management in Tampa Bay Florida
Internal Nutrient Cycling and its Implications for Bay Management
Using a mechanistic water-quality model Wang and others (1999) simulated annual rates of N and P transport and recycling in the four major segments of the bay for the period 1985 through 1994 For both nutrients the model indicated that on an annual basis the magnitude of internal cycling equaled or exceeded external loads during the 10-year simulation period In the case of P phytoplankton and sediment release (combined) were estimated to be comparable to annual external loads (Wang and others 1999) In the case of N the estimated annual average loss of total N from the bay via advective and dispersive transport (-17000 tonsyr) was about 45 times larger than the estimated annual average load (+3600 tonsyr) from the watershed When all the modeled source and loss terms were summed the result was slightly negative (-1540 tonsyr) indicating that the total mass of N in the bay decreased over the 1985ndash1994 period
For inorganic forms of N benthic and microbial processes that trans-form organic N to inorganic N and release it to the water column represented the major source (+65000 tonsyr) Microbial mineralization of organic N to ammonia N and benthic release of ammonia N contributed the highest esti-mated annual flux rates Estimated fluxes due to denitrification were smaller than those due to nitrification by an order of magnitude This resulted in
Nitrogen from fertilizer handling losstmospheric depositionoint sourceon-point source
Total nitrogen
Nitrogen from aNitrogen from pNitrogen from n
EXPLANATION
Baseline(ca 1938)
Worst case(ca 1978)
1985-1991 1995-19981992-1994(index period)
1999-20030
1000
2000
3000
4000
5000
6000
7000
8000
9000
Estim
ated
annu
alni
troge
nlo
ad i
nto
ns
Figure 5ndash16 Estimated annual nitrogen loads to Tampa Bay during various time periods (1938ndash2003) Data from Janicki Environmental Inc (2008) and Greening and Janicki (2006)
Chapter 5 Water Quality 129
large predicted ratios of ammonia N to nitrate N (ratios on the order of 4 to 10) which were consistent with available field data (Wang and others 1999) Recently Carlson and Yarbro (2006) also measured large ammonia fluxes from sediments in several bay segments Phytoplankton uptake was the major loss term for inorganic N from the water column (-66500 tonsyr) whereas advective and dispersive transport were predicted to cause relatively minor losses (-2500 tonsyr)
Taken together the available modeling results and bioassay data indicate that relationships between N loading rates and chlorophyll a concentrations in the bay are relatively complex (Morrison and others 1997 Wang and others 1999) Only a small amount of the phytoplankton standing stock observed at any given time appears to be supported by loadings of ldquonewrdquo N recently delivered from the watershed A much larger amount is apparently supported by the regeneration of inorganic N within the bay through micro-bial and benthic pathways from pools of recycled organic N The modeled flux rates and bioassay results also imply that short-term changes in external N loads may not produce immediately detectable changes in chlorophyll a concentrations particularly if the changes are small relative to the size of the internal N pools and occur following a prolonged period of elevated load-ings An example of this situation likely occurred in the bay during the early 1980s Although the City of Tamparsquos municipal wastewater-treatment plant at Hookers Point was upgraded to advanced wastewater-treatment standards in 1979 resulting in a marked reduction in annual loadings of ldquonewrdquo N to Hillsborough Bay (Johansson 1991) reductions in chlorophyll a concentra-tions were not observed until 1983 in Hillsborough Bay and 1984 in other bay segments As noted by Johansson (1991) the observed lag between the load reductions and chlorophyll a response appeared to represent the time period necessary for internal processes within the bay to equilibrate to the new level of N loading following several decades of more elevated anthropogenic loads
Setting Water-Quality Goals and Nitrogen Loading Goals Based on the Light Requirements of Seagrasses
As noted in Chapter 4 water clarity is a critically important water-quality indicator because it affects the amount of sunlight that penetrates the water column which in turn affects the growth of aquatic plants such as phytoplankton macroalgae and seagrasses (Gallegos 1994 2001 2005 Gallegos and Kenworthy 1996 Kenworthy and Fonseca 1996) PAR which is light in the range of wavelengths from 400 to 700 nanometers (nm) provides the predominant source of energy for these autotrophic organisms Light striking the water surface is reflected absorbed and refracted by suspended particles and dissolved substances in the water column and by the water itself As a result sunlight that penetrates the water surface and enters the top of the water column (incident light denoted Io) becomes reduced or attenuated as it travels downward The amount of light (Iz ) present at any depth z can be described as a function of Io and z by using the Beer-Lambert exponential decay function
Iz = Io endashkz
where k is the ldquodiffuse downwelling irradiance attenuation coefficientrdquo a measure of water clarity (Day and others 1989 Gallegos 1994)
130 Integrating Science and Resource Management in Tampa Bay Florida
A traditional method for measuring water clarity in the field is through the use of a Secchi disk a circular disk that is lowered into the water column until it just disappears from sight The depth at which it disappears is the Secchi depth (Zs) Although they provide only an approximation (Scheffer 2004) Secchi depth readings can be used to estimate the attenuation coefficient k using an equation of the form
k = cZs
where the coefficient c usually varies between 14 and 18 in estuarine waters (Day and others 1989) Studies in the different segments of Tampa Bay based on monitoring data provided by the EPCHC and the City of Tampa have produced estimated c values ranging between 149 and 184 (Dixon 1999)
In most waterbodies the factors affecting the value of the coefficient k typically include attenuation due to water phytoplankton colored dissolved organic material and nonalgal particulate matter Each of these factors plays an important light-attenuating role in Tampa Bay although phytoplankton abundance (estimated using measured chlorophyll a concentrations) has proven to be the best bay-wide predictor of water clarity and the factor most amenable to watershed management actions (Janicki and Wade 1996 Greening and Janicki 2006)
Phytoplankton and macroalgae are adapted to relatively low light levels and are typically able to maintain a positive energy balance (photo-synthesis exceeding respiration) at Iz values as low as 1 to 5 percent of Io (Day and others 1989) Seagrasses require substantially more light than phytoplankton and macroalgae however with most species requiring on the order of 13 to 37 percent or more of Io (Dennison and others 1993 Duarte and others 2007)
Because of the importance of seagrasses as a biological resource in Tampa Bay the TBEP and its partners have adopted numerical targets for water clarity levels (expressed as annual mean Secchi depth) chlorophyll a concentrations and N loading rates to help meet seagrass acreage restoration goals that have also been adopted for the bay As noted in Chapter 4 devel-opment and implementation of these targets has followed a multistep process (Greening 2001 TBEP 2006)
Step 1 Set specific quantitative seagrass acreage goals for each bay segment
In 1996 the local management community adopted a minimum seagrass coverage goal of 38000 acres which represents 95 percent of the acreage that was estimated to have been present in the bay in the early 1950s (after subtracting areas that have been rendered nonrestorable by subsequent dredging filling and the construction of causeways and other infrastructure Wade and Janicki 1993) The early 1950s time period was selected as the baseline for seagrass coverage because it preceded the rapid population increases that have occurred in the watershed in more recent decades and because aerial photographs from that time period were available for the entire Tampa Bay shoreline and adjacent shallow water (Greening and Janicki 2006)
Chapter 5 Water Quality 131
Step 2 Determine the light requirements of the target seagrass species (Thalassia testudinum) in Tampa Bay
Field studies carried out in stable Thalassia meadows in Lower Tampa Bay indicated that the deep edges of those seagrass beds corresponded to the depth at which 205 percent of Io (the light that penetrates the water surface) reached the bottom on an annual average basis (Dixon 1999)
Step 3 Determine the water clarity levels necessary to provide adequate light to meet the seagrass acreage goals
Based on the 205 percent light requirement estimated in Step 2 the seagrass acreage restoration goal was restated as a light penetration and water clarity target to restore seagrass acreage to early 1950s levels in a given bay segment water clarity in that segment should be restored to a point that allows at least 205 percent of Io to reach the same depths that were reached in the early 1950s Those depths range from about 1 m in Hillsborough Bay to about 2 m in Lower Tampa Bay (Janicki and Wade 1996)
Step 4 Determine maximum chlorophyll a concentrations that allow water clarity to be maintained at appropriate levels
Water clarity and light penetration in Tampa Bay are affected by a number of factors including phytoplankton density (estimated using measured chlorophyll a concentrations) colored dissolved organic mate-rial (estimated using water color measurements) and nonphytoplankton turbidity Janicki and Wade (1996) used regression analyses applied to long-term EPCHC monitoring data to develop an empirical model describing water clarity variations in response to these factors in the four largest bay segments The model that provided the best fit (highest r2) to the observed water-clarity data took the form
ln Cts = αts + βts ln (Zts)
where Zts is the depth to which 205 percent of surface irradiance penetrates in month t and bay segment s Cts is the average chlorophyll a concentration in month t and bay segment s and αts and βts are regression parameters (Janicki and Wade 1996 Greening and Janicki 2006)
Least-squares methods were used to estimate the regression parameters (Janicki and Wade 1996) Results of the regressions indicated that variation in observed depths to which 205 percent of surface irradiance penetrates could be explained by variation in observed chlorophyll a concentrations Monthly specific regression intercept terms were used to avoid any poten-tially confounding effects of seasonality in independent and dependent variables The model fit was relatively good (r2 = 067) As noted turbidity and water color were also investigated as possible explanations for the unex-plained variation in light penetration however no improvement in the model fit was found (Janicki and Wade 1996 Greening and Janicki 2006)
132 Integrating Science and Resource Management in Tampa Bay Florida
The adopted segment-specific annual average chlorophyll a targets (rangingfrom46to132μgLinthefourlargestbaysegmentsfig5ndash11)are easily measured and tracked through time and are used as intermediate measures for assessing success in maintaining water-quality requirements necessary to meet the long-term seagrass coverage goal (Greening 2001 Greening and Janicki 2006)
Step 5 Determine maximum nutrient loadings that allow chlorophyll a concentration targets to be achieved
A multipronged weight-of-evidence approach was used to examine relations between annual mean chlorophyll a concentrations and external N loads As noted monitoring data (Johansson 1991 2005) and nutrient bioassays (Vargo and others 1991) had indicated that N limitation is a factor affecting chlorophyll a dynamics in the bay Empirical observations such as the dramatic decline in chlorophyll a concentrations (fig 5ndash11) and improvements in water clarity (fig 5ndash10) that followed the large reduc-tions in external N loads that occurred in the early 1980s indicated it was a meaningful factor
In an effort to quantify the relationship mechanistic (Wang and others 1999) and statistical (Janicki and Wade 1996) models were developed using external loading estimates provided by the TBEP (Pribble and others 2001) The researchers examined observed and model-predicted changes in annual average chlorophyll a concentrations in response to changing annual N loads during 1986ndash1994 Across the four major bay segments the two models predicted similar relations between annual average chlorophyll a concen-tration (expressed in micrograms per liter) and annual estimated N load (expressed in pounds) (Morrison and others 1997)Mechanistic model
[Chlorophyll a] = -6174 + 532 log10 (estimated N load) r2 = 061
Statistical model[Chlorophyll a] = -5167 + 449 log10 (estimated N load) r2 = 066
In both cases the model-estimated N loads to each of the bay segments incorporated estimates of the loads transported from other segments as well as estimates of loads discharged directly to a segment from the watershed and airshed to provide adequate simulations of chlorophyll a dynamics across the bay as a whole However neither model had the capability to predict future changes in internal fluxes of ldquorecycledrdquo N that might occur in response to long-term changes in external loads (Morrison and others 1997) Therefore an alternative empirical approach was used to develop N loading targets for the bay (Janicki and Wade 2006)
Examination of the EPCHC water-quality monitoring data indicated that the water clarity conditions that existed during 1992ndash1994 allowed an annual average of more than 205 percent of subsurface irradiance (Io) to reach target depths (the estimated depths to which seagrasses grew in the early 1950s) in three of the four largest bay segments (Janicki and Wade 1996) A N load management strategy based on ldquoholding the linerdquo at the annual loading levels estimated to have occurred during 1992ndash1994 was therefore adopted by the TBEP and its partners (Greening and Janicki 2006)
Chapter 5 Water Quality 133
Step 6 Implement the nitrogen (N) management strategy and assess its effectiveness
For consistency with the adaptive management approach the effec-tiveness of the adopted N management strategy is assessed annually by evaluating chlorophyll a concentrations and water clarity levels measured by the local monitoring programs in each bay segment during the previous calendar year and comparing those values to the segment-specific targets (Greening and Janicki 2006) A decision matrix approach (Janicki and others 2000 described in box 5ndash3) is used to determine the level of manage-ment response that is appropriate in years when water-quality targets are not met Changes in seagrass coverage are assessed and reported every 2 years by the SWFWMD
Box 5ndash3 Tracking Progress Toward Water-Quality GoalsmdashApplication of the Tampa Bay Decision Framework
By Edward Sherwood (Tampa Bay Estuary Program) and Holly Greening (Tampa Bay Estuary Program)
The continued monitoring of water quality and seagrasses in Tampa Bay will allow managers to assess progress toward meeting established goals An important component of this effort is the routine comparison of mean annual chlorophyll a concentrations and light attenuation to desired targets TBEP has developed a tracking process to determine if water-quality targets are being achieved The process to track status of chlorophyll a concentration and light attenuation involves two steps The first step utilizes a decision framework to evaluate differences in mean annual ambient conditions from established targets The second step incorporates results of the decision framework into a decision matrix leading to possible outcomes dependent upon magnitude and duration of events in excess of the established target (Janicki and others 2000 Greening and Janicki 2006)
The recommended management actions resulting from the decision matrix are classified by color (green yellow and red) into three categories for presentation to the Tampa Bay resource-management community (box 5ndash3 fig 1) When outcomes for chlorophyll a concentration and light attenuation indicate that both targets are being met (green) no manage-ment response is required When conditions are intermediate (yellow) with the monitoring data indicating relatively small andor short-lived failures to meet the targets further examination is needed to determine an appro-priate management response When conditions are problematic (red) with relatively large or longer-term exceedances of one or both targets stronger management responses are considered for implementation
Green
Yellow
Red
ldquoStay the courserdquo partners continue with planned projects to implement the CCMP Data summary and reporting viathe Baywide Environmental Monitoring Report and annual assessment and progress reports
TAC Management and Policy Boards on alert review and report by TAC to Management Board on recommendedtypes of responses Management and Policy Boards take appropriate actions to get the program back on track
TAC and Management Board on caution alert review monitoring data and loading estimates attempt to identifycauses of target exceedences TAC report to Management Board on findings and recommended responses needed
134 Integrating Science and Resource Management in Tampa Bay Florida
Box 5ndash3 Tracking Progress Toward Water-Quality Goals 135
Results of the decision matrix from 1974 through 2008 are shown in box 5ndash3 figure 2 (Sherwood 2009) The poor water conditions are clearly seen in early years of this time series followed by marked improvements since 1984
Since 1996 application of the decision framework has indicated two problematic (ldquoredrdquo) time periods in 1997 and 1998 in all bay segments (corresponding to high rainfall associated with a strong El Nintildeo event) and in 2003 and 2004 in one bay segment Old Tampa Bay Recommendations from the TBEP Technical Advisory Committee (TAC) for management response to the El Nintildeo-associated period were to support immediate actions toward repair of sewer transport and pumping systems and industrial treatment-water holding systems that had failed during high rainfall periods Actions were taken by municipalities and industrial facilities to address these failed systems In addition to these immediate actions the TAC recom-mendations were to continue monitoring to assess the need for further action following the El Nintildeo event
Recommendations for action in Old Tampa Bay in response to the decision matrix results in 2003ndash2004 were quite different than for the bay-wide El Nintildeo-associated event Following an extensive review of existing data and information the TAC recommended that an Old Tampa Bay seagrass recovery research program be implemented to examine factors potentially affecting seagrass recovery in that segment of Tampa Bay followed by development of a recovery and management plan Initial moni-toring results (summarized in Cross 2007) indicated that some shallow areas in Old Tampa Bay had poorer water quality (and thus less light available for seagrasses) than in three other study areas Epiphytes caused significant light reduction (25 to 32 percent) in all parts of Old Tampa Bay Transplanted seagrass survival was very low mdash 09 percent after two growing seasons compared with 21 percent in other areas of Tampa Bay Additional factors were examined including high wave energy and loads from submarine groundwater However neither of these appeared to be responsible for slower seagrass recovery rates (Griffen and Greening 2004)
Further evaluations examined additional potential causes of poor water quality and slower seagrass recovery in Old Tampa Bay including examina-tion of reduced circulation and slower flushing rates (possibly resulting in higher chlorophyll a concentrations) local sources of N loading increased epiphyte loads high rates of bioturbation (by stingrays and burrowing organ-isms) and the potential influence of hydrogen sulfide concentrations Results indicated that the lack of seagrass recovery in Feather Sound was probably due to multiple factors and that a multipronged management strategy would be required Ongoing efforts include plans to reduce runoff from adjacent land uses and restoration of fringing mangroves to promote sheet flow through the mangrove system (Cross 2007)
Year
1975 Red Red Red Green
1976 Red Red Red Yellow1977 Red Red Red Red1978 Red Red Red Yellow
1979 Red Red Red Red1980 Red Red Red Red1981 Red Red Red Red
1982 Red Red Red Red1983 Red Yellow Red Red1984 Red Green Red Yellow
1985 Red Red Red Yellow1986 Red Yellow Red Green1987 Red Yellow Red Green
1988 Yellow Green Yellow Green1989 Red Yellow Red Yellow1990 Red Green Red Yellow
1991 Green Yellow Yellow Yellow1992 Yellow Green Yellow Yellow1993 Yellow Green Yellow Yellow
1994 Yellow Yellow Red Red1995 Red Yellow Red Yellow1996 Yellow Green Yellow Green
1997 Yellow Green Red Yellow1998 Red Red Red Red1999 Yellow Green Yellow Yellow
2000 Green Green Yellow Yellow2001 Yellow Green Yellow Yellow2002 Yellow Green Green Green
2003 Red Yellow Green Yellow2004 Red Green Green Yellow2005 Green Green Yellow Yellow
2006 Green Green Green Green2007 Green Green Green Green2008 Yellow Green Green Yellow
2009 Yellow Yellow Green Green
OldTampa
Bay
Hillsbor-oughBay
MiddleTampa
Bay
LowerTampa
Bay
Historic Results
Box 5ndash4 Tampa Bay Nitrogen Management Consortium (TBNMC)mdash A Collaborative Approach to Meet Water-Quality Targets and Support Seagrass Recovery in Tampa Bay
By Holly Greening (Tampa Bay Estuary Program)
A landmark agreement between more than 40 area government and private industry representatives to limit N pollution in Tampa Bay was finalized in September 2009 The agreement spells out how much N can enter Tampa Bay through stormwater air pollution treated waste-water and industrial discharges through 2012 The limits will maintain N loadings to the bay at existing levels additional N associated with growth must be offset through additional pollution controls
In 1996 the TBEP local government and agency partners adopted numeric management targets to restore and protect seagrass beds and restore environmental conditions in Tampa Bay These resource-based targets include the goal of restoring seagrass acreage to the extent observed in 1950 and numeric targets for water clarity chlorophyll a concentrations and the total N loads necessary to meet and maintain water-quality targets that support seagrass recovery (detailed in Chapter 5) A multipronged management strategy implemented by the TBNMC was initiated in 1996 to meet these targets
In 1998 FDEP proposed and USEPA approved a TMDL for N for Tampa Bay required by Section 303(d) of the Federal Clean Water Act The TMDL total N loads were based on the resource-based manage-ment targets (water clarity chlorophyll a concentrations and the total N loads observed to meet these targets) developed by the TBEP partners to support the environmental recovery of Tampa Bay
Since 1998 FDEP chlorophyll a targets have been met in all four major bay segments with the exception of 1 year in Lower Tampa Bay and 3 years in Old Tampa Bay (box 5ndash4 fig 1) Seagrass acreage has increased by more than 4800 acres bay-wide over this same period and more than 6000 acres since the mid 1980s (fig 4ndash29)
In December 2007 the public and private participants in the TBNMC (box 5ndash4 table 1) committed to develop a process to allocate N loads among all sources to support continued attainment of bay management targets and to be consistent with the required TMDL The Consortium participants developed N load allocations that equi-tably distribute the burden of N management across the sectors and sources of N loading within the basin as well as the total maximum loading of N to each major bay segment Through this consensus-based process Consortium participants defined limits to the amount of N they
1975
1976
1977
1978
1979
1980
1981
1982
1983
1984
1985
1986
1987
1988
1989
1990
1991
1992
1993
1994
1995
1996
1997
1998
1999
2000
2001
2002
2003
2004
2005
2006
2007
2008
2009
YearHillsbor-
oughBay
No
No
No
No
No
No
No
No
No
Yes
No
No
Yes
Yes
Yes
Yes
Yes
Yes
Yes
Yes
Yes
Yes
Yes
Yes
Yes
Yes
Yes
Yes
Yes
Yes
Yes
Yes
No
No
No
OldTampa
Bay
MiddleTampa
Bay
LowerTampa
Bay
No No Yes
No No Yes
No No No
No No Yes
No No No
No No No
No No No
No No No
No No No
Yes No Yes
No No Yes
No Yes Yes
No No Yes
Yes Yes Yes
No
No
Yes Yes
Yes Yes
Yes Yes Yes
Yes Yes Yes
Yes Yes Yes
Yes Yes Yes
Yes Yes Yes
Yes Yes Yes
Yes Yes Yes
Yes Yes Yes
Yes Yes Yes
No Yes Yes
No Yes Yes
Yes Yes No
Yes Yes Yes
Yes Yes Yes
Yes Yes Yes
No Yes Yes
No No No
No No
No No No
Yes
136 Integrating Science and Resource Management in Tampa Bay Florida
Box 5ndash4 Tampa Bay Nitrogen Management Consortium 137
are permitted to discharge For example communities that hold permits to discharge more treated wastewater than they currently are must ldquohold the linerdquo at current levels mdash unless they can prove they have lowered N pollu-tion elsewhere in their communities Participating private sector partners must meet the same restrictions
In September 2009 the Consortium participants finalized and approved their technical process and proposed total N allocations to all 189 point and nonpoint sources within the Tampa Bay watershed (TBNMC 2009) In December 2009 FDEP provided their concurrence with the technical basis and allocations The TBNMCrsquos collaborative approach to meeting water-quality targets is unique in the country in that public and private N dischargers worked together to define the technical process and N load limits for each of the sources within the watershed FDEP and USEPA participated in the Consortium and provided concurrence at each major step
Box 5ndash4 Table 1 Parcipants of the Tampa Bay Nitrogen Management Consortium
Alafia Preserve (Mulberry) LLC Hillsborough County
CF Industries Janicki Environmental Inc (technical support)
City of Bradenton Kerry I amp F Contracting
City of Clearwater Kinder Morgan Bulk Terminals Inc
City of Gulfport LDC Donaldson Knoll Investments LLC
City of Lakeland MacDill Air Force Base
City of Largo Manatee County
City of Mulberry Mosaic Company
City of Oldsmar Pasco County
City of Palmetto Pinellas County
City of Plant City Polk County
City of Safety Harbor Southwest Florida Water Management District
City of St Petersburg Tampa Bay Estuary Program (coordinator and facilitator)
City of Tampa Tampa Bay Regional Planning Council
CSX Transportation Tampa Bay Water
Eagle Ridge (Mulberry) LLC Tampa Electric Company
Eastern Associated Terminals Tampa Port Authority
Environmental Protection Commission of Hillsborough County Trademark Nitrogen
Florida Department of Agriculture and Consumer Services Tropicana Products
Florida Department of Environmental Protection US Environmental Protection Agency
Florida Department of Transportation Yara North America
138 Integrating Science and Resource Management in Tampa Bay Florida
Tampa Bay Nitrogen Management Consortium (TBNMC)
Successful long-term achievement of the N loading strategy and chlorophyll a targets could be prevented as a result of ongoing popula-tion growth in the watershed which could potentially lead to increased N discharges to the bay as a result of increased wastewater and stormwater loads To maintain external N loads at or below the estimated 1992ndash1994 levels it appears that an average annual reduction of about 17 tonsyr of total N will be necessary to offset expected load increases generated as a result of population growth (Greening and Janicki 2006)
To meet the hold-the-line N loading management target a consortium of local governments phosphate companies electric utilities agricultural interests and regulatory agencies (the TBNMC) was established by the TBEP in 1998 (Greening 2001 box 5ndash4) Together TBNMC members developed a Nitrogen Management Action Plan and made voluntary commitments to implement projects that will help to achieve the adopted N management goals in each bay segment
Load reductions achieved by the TBNMC and other TBEP partners have generally been calculated on a 5-year basis (as 85 tons per 5-year period) rather than annually because of the long-term nature of many of the N reduction projects To ensure that each partner was using similar N load reduction assumptions for similar projects the TBNMC developed guide-lines for calculating N load reduction credits (Zarbock and Janicki 1997) which are used in developing action plans and estimating project-specific load reductions
The types of nutrient reduction activities included in the Nitrogen Management Action Plan range from traditional projects such as stormwater upgrades industrial retrofits and agricultural best management practices to actions not primarily associated with nutrient reduction such as land acquisition and habitat restoration projects During 1995ndash2007 more than 250 projects were submitted by local governments agencies and industries for inclusion in the plan (TBNMC 2008) During the planrsquos initial 5-year
period (1995ndash1999) completed projects produced an estimated load reduction of 175 tons of total N exceeding the 5-year reduction target by 90 tons The estimated load reduc-tions during this period were evenly divided between public and private sector projects (Greening and DeGrove 2001) Nitrogen-reduction projects for 2000ndash2004 totaled 228 tons and for 2005ndash2009 a reduction of 192 tons of total N are expected (TBNMC 2008 table 5ndash1)
Table 5ndash1 Total nitrogen load reductions 1995ndash2009
Drainage basin 5-year reduction target (tons) 1995ndash1999 2000ndash2004 2005ndash2009
Alafia River 1110 1115 4409 2834
Coastal Hillsborough Bay 1150 9725 8123 8344
Hillsborough River 855 1198 4094 1017
Coastal Middle Tampa Bay 545 507 161 232
Little Manatee River 1080 1166 385 116
Old Tampa Bay 1180 3332 888 4393
Coastal Lower Tampa Bay 970 096 188 171
Manatee RiverTerra Ceia Bay 1160 290 4268 834
Boca Ciega Bay 460 088 298 1230
Total reductions8510
(target) 17517 22814 19171
Chapter 5 Water Quality 139
Toxins and Harmful Algal Blooms
Although nutrients and eutrophication have been the primary water-quality issues facing resource managers in the Tampa Bay area in recent decades management attention has also focused on toxic chemicals some of which are associated with anthropogenic discharges and others of which are produced as a result of harmful algal blooms This section addresses known and potential toxins that are found in the water column or in animals associ-ated with the water column Toxic contaminants associated with bottom sediments and the benthic biota that is present in and on the sediments are discussed in Chapter 7
Mercury in Fish Tissue
Fish consumption advisories are currently in place for many Florida waters including Tampa Bay because of the elevated mercury levels that are often detected in certain species FDEP and USEPA plan to develop a statewide TMDL addressing this water-quality impairment in coming years
The global mercury cycle involves emissions from land and water surfaces to the atmosphere transport in the atmosphere on a global scale possible chemical conversion in the atmosphere and return to land and water by various depositional processes Part of the inorganic mercury that is emitted to the atmosphere becomes oxidized (to Hg++) and then methylated a reaction that is believed to involve a methylcobalamine compound (an analogue of vitamin B12) that is produced by bacteria This reaction takes place primarily in aquatic ecosystems The intestinal bacteria of various animal species including fish are also able to convert ionic mercury into methyl mercuric compounds (CH3Hg+) although to a much lower degree Methylmercury is accumulated by fish and marine mammals and reaches its highest concentrations in large predatory species at the top of the aquatic food web Consumption of these organisms is the primary route through which it enters the human diet (USGS 1995 USEPA 1997 2007)
From a human health perspective mercury is a toxic metal that persists in the body and impairs the functioning of the brain and central nervous system Its effects are particularly harmful to developing nervous system tissues so consumption advisories are directed particularly toward infants small children and women of child-bearing age who are or may become pregnant A 2006 summary of mercury-related fish consumption advisories for the Tampa Bay region which was developed by EPCHC and TBEP is shown in figure 5ndash17
HIGH RISK ndash ndash Do not eat
MODERATE RISK ndash ndash One per month
MODERATE TO LOW RISK ndash ndash One per week
King Mackerel Shark Blackfin Tuna Cobia Little Tunny
Atlantic Croaker Atlantic Spadefish Atlantic Thread Herring
Atlantic Weakfish Black Drum Bluntnose Stingray Dolphin
Fantail Mullet Florida Pompano Gray Snapper Hardhead
Catfish Hogfish Lookdown Pigfish Red Snapper Southern
Flounder Spot Striped Mullet Striped Mojarra Tarpon
Tripletail Vermilion Snapper White Mullet Yellowtail Snapper
Almaco Jack Atlantic Stingray Black Grouper Bluefish
Bonefish Crevalle Jack Gafftopsail Catfish Gag Grouper
Greater Amberjack Great Barracuda Gulf Flounder Ladyfish
Lane Snapper Mutton Snapper Pinfish Red Drum Red
Grouper Sand Seatrout Scamp Sheepshead Silver Perch
Skipjack Tuna Snook Snowy Grouper Spanish Mackerel
Spotted Seatrout Wahoo While Grunt Yellow-edge Grouper
Yellowfin Tuna
Fish located in
Hillsborough County coastal waters
Figure 5ndash17 Fish consumption advisories due to mercury contamination for Tampa Bay From Environmental Protection Commission of Hillsborough County and Tampa Bay Estuary Program
140 Integrating Science and Resource Management in Tampa Bay Florida
Sampling surveys across the United States have shown widespread mercury contamination in fish collected from wetlands lakes and streams As of 2006 mercury-related fish consumption advisories had been issued for waterbodies in 48 US States the exceptions being Alaska and Wyoming (USEPA 2007) Mercury contamination is also a global environmental issue and mercury that is emitted to the atmosphere can travel thousands of miles before it is deposited back to the Earth in rainfall or in dry gaseous forms (USGS 1995 USEPA 1997) Natural sources of mercury such as volcanic eruptions and emissions from the ocean have been estimated to contribute about a third of current worldwide mercury air emissions whereas anthropogenic emissions account for the remaining two-thirds These estimates however are highly uncertain Much of the mercury circulating in the modern environment is thought to have been released years ago when mercury was commonly used in many industrial commercial and residential products and processes
Within the United States the highest mercury deposition rates are predicted to occur in the southern Great Lakes and Ohio River valley the Northeast and scattered areas in the South (fig 5ndash18) with the most elevated deposition occurring ldquoin the Miami and Tampa areasrdquo (USEPA 1997) The location of sources the chemical species of mercury emitted and climate and meteorology are key factors in mercury deposition with humid locations often experiencing higher deposition rates than arid locations (USEPA 1997)
30
43
59
115
53
2970
28
48
52
12
64
37
162
90
115142
218
136170
87
95
78
76
12084
106
102
160167
83
59
62
6774
6868 7473
81
114
118
9076
83
108
73
56102
91
87
143
11192
53
939081
90
788476
779074
99
121
93 76
11660 8976
9661
63
88
98
7889
8562
153
gt 4 to 6gt 6 to 8gt 8 to 10gt 10 to 12gt 12 to 14gt 14 to 16gt 16 to 18gt 18
Data from National Atmospheric Deposition Program Mercury Deposition Network
Total wet mercurydeposition for 2007in micrograms per
square meter
EXPLANATION
lt 4
136 Sampling sitelocation and value
N
Figure 5ndash18 Mercury wet deposition in the United States 2007 From Mercury Deposition Network
Chapter 5 Water Quality 141
30 microns
Figure 5ndash19 Red tide (Karenia brevis) bloom along Floridarsquos west coast Photo by Fish and Wildlife Research Institute
Figure 5ndash20 Red tide organism Karenia brevis Photo by Fish and Wildlife Research Institute
Harmful Algal Blooms
Several types of harmful algal blooms have been documented in Tampa Bay and its watershed most frequently involving Florida red tide other toxin-producing dinoflagellates (primarily in estuarine and marine waters) and cyanobacteria (in eutrophic freshwater bodies)
Florida Red Tide
Generically a ldquored tiderdquo is a type of harmful algal bloom that occurs when a population of toxic planktonic algae grows to a sufficiently large size and density to cause visible discoloration of the water (fig 5ndash19) Severe blooms can cause a number of undesirable environmental economic and human health effects in coastal areas Although more than 40 species of toxic microalgae live in the Gulf of Mexico the type that causes red tides in the Tampa Bay area and elsewhere along the west-central and southwest Florida coast is the dinoflagellate Karenia brevis the Florida red tide organism (Walsh and others 2006) (fig 5ndash20) Most Karenia blooms last three to five months and may affect hundreds of square miles of coastal waters and bays (Tester and Steidinger 1997) Occasionally however as happened during 2005ndash2006 a bloom will continue for as long as 18 months and will affect thousands of square miles
The environmental impacts of large blooms include mass die-offs of fish birds and marine mammals (Fleming and others 2005) Such blooms impact the economies of affected coastal areas The blooms reduce levels of recreation and tourism due to aesthetic and odiferous impacts of accompa-nying fish kills and respiratory discomfort is experienced by people sensi-tive to the brevetoxin that is released into the water and air by the red tide organism (Hoagland and others 2002) In addition to their environmental impacts brevetoxins can also accumulate in filter-feeding shellfish such as oysters clams and coquinas sometimes reaching levels capable of causing neurotoxic shellfish poisoning when eaten by humans Neurotoxic shellfish
142 Integrating Science and Resource Management in Tampa Bay Florida
poisoning appears to be a temporary illness whose symptoms usually appear within a few hours of eating contaminated shellfish and include nausea and diarrhea dizziness muscular aches and tingling and numbness in the tongue lips throat and extremities (Kirkpatrick and others 2004)
The Florida red tide organism was identified in 1947 but anecdotal reports of red tides in the Gulf of Mexico were provided by Spanish explorers during the 16th century Small to moderate blooms occur in the gulf in most years usually in late summer or early fall and most commonly off the coast between Clearwater and Sanibel Island They can occur anywhere in the gulf however and occasionally develop along the southeastern Atlantic coast as far north as North Carolina (Tester and Steidinger 1997)
Florida red tides were once believed to originate in nearshore areas because discolored water fish kills and respiratory irritation were often observed first around passes and barrier islands However more recent infor-mation has shown that they begin 10 to 50 mi offshore on the West Florida Shelf where resting stages of Karenia are believed to persist in the water column or sediments (Tester and Steidinger 1997 Walsh and others 2006)
Blooms usually develop in four stages (Alcock 2007 Tester and Steidinger 1997) The initiation stage occurs when a Karenia population is introduced into an area that provides an appropriate combination of environ-mental conditions to support it The second stage is growth during which the population steadily increases Within a few weeks cell concentrations may reach sufficiently high levels to kill fish The third stage is maintenance during which the bloom may remain offshore or be moved inshore by wind and currents If the bloom moves inshore the increased nutrient levels often encountered in bays and estuaries may allow additional cell growth and physical factors such as currents may concentrate the cells in particular locations Such blooms can persist in coastal areas for days weeks or even months The fourth stage is dissipationtermination whereby winds and currents disperse the cells or move the bloom to a different area
Atmospheric deposition of dust from the Saharan Desert onto the waters of the West Florida Shelf may also play an important role in bloom initia-tion and growth Recent hypotheses that have been advanced to explain the high frequency of Karenia blooms in this part of the Gulf of Mexico have noted that Saharan dust contains iron which is deposited over the west coast of Florida during storm events (Walsh and Steidinger 2001) These dust deposition events frequently precede blooms of Trichodesmium a N-fixing cyanobacteria which in turn precede blooms of Karenia Trichodesmium blooms often occupy thousands of square kilometers of the gulf and can be very dense (Walsh and Steidinger 2001) The regenerated nutrients from these blooms particularly regenerated N could help fuel large red tides as could decomposing fish from fish kills (Walsh and others 2006) Because Trichodesmium requires abundant P as well as iron to carry out N fixation the relative importance of different P sources (from ocean upwelling events benthic releases on the West Florida Shelf or discharges from land via rivers and estuaries) in the initiation growth or maintenance of Florida red tide blooms is also a question of considerable recent research interest (Walsh and others 2006 Alcock 2007)
Because of the economic and environmental impacts caused by major red tide blooms coastal residents and policymakers have asked researchers and resource managers to determine whether the blooms are becoming more frequent or more severe over time and whether anthropogenic factors such
Box 5ndash5 Frequently asked questions about Florida red tide 143
as cultural eutrophication of bays and other coastal waters contribute to bloom severity or persistence (Hu and others 2006 Walsh and others 2006 Alcock 2007 Brand and Compton 2007 Stumpf and others 2008 Vargo and others 2008) Given the complexity of the Karenia life cycle and the large number of factors that affect the initiation persistence and severity of blooms these questions have proven very difficult to answer Alcock (2007) has provided an overview based on a review of recent research results which is summarized in box 5ndash5
Other Harmful Algal Blooms
On a worldwide basis the man-induced eutrophication that has occurred in recent decades has coincided with a higher frequency and severity of primarily dinoflagellate harmful algal blooms in estuarine and marine waters and of cyanobacteria (also known as blue-green algae) harmful algal blooms in nutrient-enriched freshwater bodies (Anderson and others 2002 Reynolds 2006)
Box 5ndash5 Frequently Asked Questions about Florida Red Tide
Excerpt from Alcock (2007)
Are Florida red tides getting worseldquoPossibly Harmful algal blooms appear to be getting worse throughout the world Some
of the forcing factors believed to play a role in the worldwide trend are increased nutrient enrich-ment resulting from population growth and land use practices and increased water temperatures due to global climate change Although the general trend appears to be worsening trends for specific harmful algal blooms can embody more uncertainty This is particularly true for offshore blooms such as Karenia brevis the organism that causes Florida red tides Southwest Florida has endured red tide blooms on a near-annual basis over the past two decades and the 2005 bloom was one of the most severe on record However Florida red tide blooms of similar intensity and duration have been confirmed as far back as 1948ndash1949 and anecdotal evidence suggests that severe blooms have scourged the region for hundreds if not thousands of years There is broad consensus that Florida red tides have been especially active in recent years but putting this decade into historical perspective is extremely difficult due to a lack of data suitable for determining historical trendsrdquo (Alcock 2007)
Can coastal pollution exacerbate Florida red tides ldquoProbably The recipe for Florida red tides is complex The relative importance of different
ingredients - nutrient sources and other environmental factors mdash varies over the different stages of a bloom and it is possible that the specific recipe responsible for red tides varies from bloom to bloom Terrestrial nutrient fluxes are one of many ingredients that can contribute to a red tide bloom and coastal pollution exacerbates these fluxes Most scientists agree that red tide blooms initiate offshore before being transported inshore by wind and ocean currents They believe coastal runoff is unlikely to affect the early stages of a bloom but when a bloom moves inshore they acknowledge that runoff can play a role in intensifying or prolonging a bloom Assessing the relative importance of terrestrial nutrient sources including coastal pollution remains a top research priorityrdquo (Alcock 2007)
144 Integrating Science and Resource Management in Tampa Bay Florida
In the Gulf of Mexico and nearby regions harmful algal blooms are associated with a number of human health impacts including ciguatera poisoning paralytic shellfish poisoning and neurotoxic shellfish poisoning Ciguatera poisoning is caused by ingestion of ciguatoxins mdash produced by the dinoflagellate Gambierdiscus toxicus mdash which can reach toxic concen-trations in tropical reef fish and their predators Consumption of affected barracuda grouper sea bass snapper and a number of other marine fish that commonly live between latitudes 35degN and 35degS causes the disease in humans Ciguatera poisoning is rarely fatal Common symptoms include nausea vomiting diarrhea cramps excessive sweating headache muscle aches burning sensations in the extremities weakness itching lowering of blood pressure and dizziness
Paralytic shellfish poisoning (PSP) is associated with several species of dinoflagellates that produce at least 12 known toxins of which the saxitoxins are best understood PSP toxins are typically found in bivalve mollusks (mussels clams oysters) and have also been detected in crabs and snails associated with coral reefs In humans symptoms of PSP begin from 15 minutes to 10 hours after eating contaminated shellfish Symptoms are generally mild and begin with numbness or tingling of the face arms and legs This is followed by headache dizziness nausea and muscular inco-ordination In cases of severe poisoning muscle paralysis and respiratory failure occur and in these cases death may occur in 2 to 25 hours (httpwwwwhoieduscienceBredtideillnesspsphtml) Although PSP is most prevalent in the relatively low-temperature coastal waters of the Pacific States and New England the syndrome has also been reported in Central America
A total of 28 cases of saxitoxin poisoning occurred in the eastern United States during 2002ndash2004 associated with the consumption of puffer fish from the Indian River Lagoon in eastern Florida (Landsberg and others 2006) The dinoflagellate Pyrodinium bahamense was identified as the likely source of the toxin (Landsberg and others 2006) Large blooms of Pyrodinium have occurred in Tampa Bay in recent years (Badylak and others 2007) Fish kills have occurred in conjunction with these blooms (for example fig 5ndash4) but appear to have been related to reduced DO levels rather than to algal toxicity
Pharmaceutical and Personal Care Products (PPCPs) and other Emerging Contaminants
Recent improvements in laboratory analytical methods now allow researchers to detect the presence of manmade chemicals mdash such as prescription drugs over-the-counter pharmaceuticals and personal care products (PPCPs) such as soaps shampoos and fragrance compounds mdash at very low concentrations in surface and groundwater samples These chemicals which are also referred to as emerging contaminants come from a variety of sources such as sewage-treatment plant effluent runoff from agricultural land uses and discharges from septic systems Conventional sewage-treatment practices vary greatly in their abilities to eliminate them from wastewater streams A recent report from the European Union (Ternes 2006) notes that several studies in Europe and North America have docu-mented the occurrence of pharmaceuticals and estrogens in wastewater
Chapter 5 Water Quality 145
effluents and ambient waters (Daughton and Ternes 1999 Kolpin and others 2002) In general the concentrations of PPCPs in wastewater-treatment plant effluents were quite low ranging from the ng L-1 to the low μgL-1 range (the parts-per-trillion to low parts-per-billion range) In surface waters the concentrations generally ranged between 10 and 500 ng L-1 In groundwater and drinking water PPCP residues were detected up to the μgL-1 level What is unclear is whether or in which cases these residues may pose risks for aquatic ecosystems or humans
Pathogen-Related Water-Quality Impairments
Pursuant to the Federal Clean Water Act the FDEP has adopted water-quality criteria for fecal coliform bacteria to protect human health in cases where waterborne pathogens could potentially be present in waters that are used for recreation shellfish harvesting or potable water supply These criteria are frequently exceeded in a number of waterbodies in the Tampa Bay watershed and in parts of the bay itself (fig 5ndash11) As a result these waterbodies and parts of the bay have been designated as impaired and FDEP and USEPA are developing TMDLs to address the impairments
From a water-quality management perspective however interpretation of the existing criteria is complicated by the fact that in most cases the fecal coliform bacteria that are detected in surface-water samples are not human pathogens Instead they are indicator organisms that are used to estimate the likelihood that water has come into contact with fecal material (from humans or other warm-blooded vertebrates) and may therefore contain disease-causing organisms that pose a risk to public health A considerable amount of research has shown that as a group fecal coliform bacteria are not particu-larly accurate indicators of the presence of these human pathogens in surface waters particularly in subtropical and tropical areas (for example Rose and others 2001 McLaughlin and Rose 2006)
Because the shortcomings of the existing fecal coliform indicators are well known within the public health and water-quality management commu-nities intensive work is being carried out by a number of organizations to develop cost-effective indicators that provide more accurate estimates of human health risks Currently however no single indicator or analytical method has been found that provides greater accuracy in estimating risk reasonable cost and feasibility for day-to-day use by laboratory personnel in local monitoring programs Until cost-effective alternatives are found and adopted local management programs will need to continue using the existing indicators and other available information as effectively as possible to minimize human health risks associated with waterborne pathogens
In the Hillsborough County part of the Tampa Bay watershed FDEP TBEP and local partners are using a basin management action plan approach in an effort to address bacteriological water-quality impairments in this way The approach seeks to identify the subgroup of impaired waterbodies that pose actual human health risks and to take steps to identify and correct the causes of those impairments as quickly and cost effectively as possible (Morrison and others 2010)
146 Integrating Science and Resource Management in Tampa Bay Florida
Anticipated Future Challenges from Ongoing Population Growth
As noted the human population in the three counties adjacent to Tampa Bay has more than quadrupled from less than 500000 in 1950 to more than 2 million in 2000 (see Chapter 1 fig 1ndash5) The population in these three counties reached 24 million in 2006 and is projected to reach 28 million by 2015 32 million by 2030 and more than 4 million by 2050 Without careful planning and appropriate action this population increase could have serious implications for the Tampa Bay water-quality management effort and its ability to continue meeting the water-quality targets that have been set to protect and restore the living resources of the bay
The TBEP partnership has estimated that projected levels of population growth could potentially cause annual N loadings to the bay to increase by about 17 tonsyr due to increasing wastewater discharges stormwater runoff and atmospheric deposition from additional vehicular traffic and electric power generation (TBEP 2006) In order to meet the hold-the-line total N management target management actions must be taken to achieve N load reductions equivalent to the anticipated increases As recently as 2008 (the most recent year for which data were available at the time this was written) these reductions were continuing to occur and chlorophyll a concentrations in the bay continued to meet targets However it is not clear how far into the future this level of success can be maintained
Much of the new N entering the bay each year arrives as a result of stormwater runoff (fig 5ndash21) Increasing urbanization mdash with its associ-ated construction of rooftops parking lots roadways and other impervious surfaces mdash can potentially affect these loading sources Although the impacts of increasing imperviousness can be ameliorated to some extent by environmentally sensitive development practices and rigorous stormwater management requirements (Schueler and Holland 2000 NRC 2008) it is clear that the large and increasing amounts of imperviousness in the water-shed will represent an ongoing challenge for water-quality managers
In addition to stormwater runoff the TBEP (2006) has noted a number of other sources of total N and toxic contaminants for which future load reductions will need to be achieved These include industrial and municipal point sources which contribute roughly 30 percent of the total bay loadings of arsenic cadmium chromium and copper as well as low levels of other contaminants Watershed residents sometimes contribute to this problem by improperly disposing of toxic cleaners or solvents in central sewer or stormwater management systems
Septic systems which are estimated to serve about 20 percent of the population in the Tampa Bay watershed are also an issue High densities of mostly older septic tanks can contribute to degraded water quality (nutrients and pathogens) in creeks where circulation is limited and the water table is near the ground surface Allenrsquos Creek in Pinellas County several creeks in Hillsborough County and some tributaries in the Tampa area that discharge to McKay Bay are among those thought to be most affected (Rose and others 2001)
Springs that feed into bay rivers and smaller tributaries can be impacted by septic tank leachate especially in areas with highly porous soils Preliminary estimates indicate that groundwater and springs contribute 5
Chapter 5 Water Quality 147
percent or more of the total N loadings to the bay (Janicki Environmental Inc 2008) Nitrogen (particularly nitrate) concentrations in several springs in the area are increasing in response to factors such as septic system discharges and historical agricultural fertilizer use (Jones and Upchurch 1993)
Disposal of sewage sludge and septage poses an additional management issue particularly in the Hillsborough and Manatee River Basins because of the number of permitted disposal sites Different agencies regulate sewage sludge and septage disposal sites and it is sometimes difficult to determine how much material is being spread and how it is handled Additionally some of the sludge disposed of in the Tampa Bay watershed is brought in from outside the region
Approximately 2 percent of the total N loadings to the bay is attributed to fertilizer products which are lost while in storage or during ship loading at local ports These ldquofugitive emissionsrdquo have declined substantially since 1991 however as a result of efforts to improve storage and handling prac-tices at port facilities (TBEP 2006)
In addition to these sources the effort to keep pace with continuing population growth will also strain the municipal wastewater collection and treat-ment systems operated by local governments in the watershed A 1994 survey conducted by the TBEP estimated the amount of money that is expended each year to manage and monitor bay quality and administer environmental programs (TBNEP 1995) That study based on fiscal year 1994ndash1995 budgets indicated that more than $250 million was spent annually by Federal State and local agencies and governments on the restoration and management of Tampa Bay By far the largest percentage of that overall amount mdash 68 percent or roughly $170 million mdash was attributed to construction maintenance and administration of wastewater collection treatment and reuse systems
AtmosphericDeposition21 percent
Groundwaterand Springs
3 percent
MunicipalWastewater
9 percent
Industrial Wastewater3 percent
Accidential Fertilizer Losses1 percent
IntensiveAgriculture12 percent
Pasture Range Lands15 percent
Residential20 percent
Stormwater Runof f63 percent Undeveloped
Land1 percent
CommercialIndustrial9 percent
Mining6 percent
Figure 5ndash21 Sources of total nitrogen to Tampa Bay 2003ndash2007 (Janicki Environmental Inc (2008)
148 Integrating Science and Resource Management in Tampa Bay Florida
Despite these expenditures however occasional leaks and spills from municipal wastewater collection and treatment systems remain a fact of life in many communities That issue was highlighted during the summer of 1995 when the City of St Petersburg was forced to discharge about 15 Mgal of untreated sewage into Boca Ciega Bay to minimize sewage backup into homes Excessive rainfall had infiltrated the wastewater collection system and caused the overflows Similar events have taken place in the City of Tampa in recent years and other communities around the bay and nationwide experience similar problems during periods of heavy rainfall To keep the bay safe for swimming and shellfish harvesting in the future local communi-ties will need to grapple with infrastructure improvements that will ensure that the significant investments made to upgrade sewage-treatment facilities are not diminished by chronic failures in collection networks (TBEP 2006) Continuation of the collaborative watershed management effort involving each of these source categories and residents of the region who contribute to them will clearly be needed for ongoing maintenance and restoration of water quality and the bayrsquos living resource
References Cited
Alcock F 2007 An assessment of Florida red tide mdash Causes consequences and management strategies Mote Marine Laboratory Technical Report 1190 Sarasota Fla 41 p
Anderson DM and Garrison DJ eds 1997 The ecology and oceanogra-phy of harmful algal blooms Limnology and Oceanography v 42 p1009ndash1305
Anderson DM Gilbert PM and Burkholder JM 2002 Harmful algal blooms and eutrophication mdash Nutrient sources composition and conse-quences Estuaries v 25 p704ndash726
Atkeson T Greening HS and Poor N eds 2007 Bay Region Atmospheric Chemistry Experiment (BRACE) Atmospheric Environment v 41 p 4163ndash4335
Badylak S Philips EJ Baker P and others 2007 Distributions of phyto-plankton in Tampa Bay Estuary USA 2002ndash2003 Bulletin of Marine Science v 80 p 295ndash317
Brand LE and Compton A 2007 Long term increase in Karenia brevis abundance along the southwest Florida coast Harmful Algae v 6 p 232ndash252
Bricker S Longstaff B Dennison W and others 2007 Effects of nutrient enrichment in the Nationrsquos estuaries mdash A decade of change Silver Spring Md National Centers for Coastal Ocean Science NOAA Coastal Ocean Program Decision Analysis Series 26 328 p
Brooks GR Dix TL and Doyle LJ 1993 Groundwatersurface water interactionsinTampaBayandimplicationsfornutrientfluxesStPetersburgTampa Bay National Estuary Program Technical Publication 06ndash93 43 p
Chapter 5 Water Quality 149
Burns J 2008 Toxic cyanobacteria in Florida waters in Hudnell HK ed Proceedings Interagency International Symposium on Cyanobacterial Harmful Algal Blooms Advances in Experimental Medicine amp Biology p117ndash126
CarlsonPandYarbroL2006BenthicoxygenandnutrientfluxesinTampaBay Tampa Bay Estuary Program Technical Publication 04ndash06 22 p
Chapman AD and Schelske CL 1997 Recent appearance of Cylindro-spermopsis(Cyanobacteria)infivehypereutrophicFloridalakesJournalofPhycology v 33 p191ndash195
Chorus I and Bartram J eds 1999 Toxic cyanobacteria in water mdash A guide to their public health consequences monitoring and management London World Health Organization 440 p
Cloern JE 2001 Our evolving conceptual model of the coastal eutrophica-tion problem Marine Ecology Progress Series v 210 p 223ndash253
Cross LM 2007 Feather Sound seagrass recovery project mdash Final report and management recommendations for Feather Sound Old Tampa Bay Florida Report to the Pinellas County Environmental Fund Tampa Bay Estuary Program Technical Publication 03ndash07 49 p
Daughton CG and Ternes TA 1999 Pharmaceuticals and personal care products in the environment mdash Agents of subtle change Environmental Health Perspectives v 107 suppl 6 p 907ndash938
Dawes CJ Phillips RC and Morrison G 2004 Seagrass communities of the Gulf Coast of Florida mdash Status and ecology St Petersburg Florida Fish and Wildlife Conservation Commission Fish and Wildlife Research Institute and the Tampa Bay Estuary Program 74 p
Day JW Hall CAS Kemp WM and Yaacutentildeez-Arancibia A 1989 Estuarine ecology New York Wiley-Interscience 558 p
Dennis RL and Arnold J 2007 CMAQ-UCD atmospheric deposition estimates to Tampa Bay watershed sub-basins and Tampa Bay waters St Petersburg Fla Report to Tampa Bay Estuary Program 32 p
Dennison WC Orth RJ Moore KA and others 1993 Assessing water quality with submersed aquatic vegetation BioScience v 43 p 86ndash94
Dixon LK 1999 Establishing light requirements for the seagrass Thalassia testudinum An example for Tampa Bay Florida in Bortone SA ed Sea-grasses mdash Monitoring ecology physiology and management Boca Raton Fla CRC Press p 9ndash31
Duarte CM Conley DJ Carstensen J and Sanchez-Camacho M 2009 Return to Neverland mdash Shifting baselines affect eutrophication restoration targets Estuaries and Coasts v 32 no 1 p 29ndash36
Duarte CM Marbagrave N Krause-Jensin D and Saacutenchez-Camacho M 2007 Testing the predictive power of seagrass depth limit models Estuaries and Coasts v 30 p 652ndash656
Environmental Protection Commission of Hillsborough County (EPCHC) 2006Floridafishconsumptionguideformercuryforchildrenandwomenof child-bearing age 2 p
150 Integrating Science and Resource Management in Tampa Bay Florida
Falkowski PG and Raven JA 2007 Aquatic photosynthesis New Jersey Princeton University Press 384 p
Fleming LE Backer LC and Baden DG 2005 Overview of aerosolized Florida red tide toxins mdash Exposures and effects Environ mental Health Perspectives v 113 p 618ndash620
Florida Department of Environmental Protection (FDEP) 2001 Tampa Bay Basin status report Tallahassee Fla 228 p
Florida Department of Environmental Protection (FDEP) 2003 Water quality assessment report Tampa Bay Tallahassee Fla 402 p
Florida Department of Environmental Protection (FDEP) 2005 Water quality assessment report Tampa Bay Tributaries Tallahassee Fla 584 p
Florida Department of Environmental Protection (FDEP) 2006 Water quality assessment report Sarasota Bay and Peace and Myakka Rivers Tallahassee Fla 413 p
Florida Department of Environmental Protection (FDEP) 2009 List of impaired waters accessed at httpwwwdepstatefluswatertmdl
Fourqurean JW Zieman JC and Powell GVN 1992 Phosphorus limita-tion of primary production in Florida Bay Evidence from CNP ratios of the dominant seagrass Thalassia testudinum Limnology and Oceanography v 37 p 162ndash171
GallegosCL1994Refininghabitatrequirementsofsubmersedaquaticvegetation mdash Role of optical models Estuaries v 17 p 198ndash219
Gallegos CL 2001 Calculating optical water quality targets to restore and protect submersed aquatic vegetation mdash Overcoming problems in partition-ingthediffuseattenuationcoefficientforphotosyntheticallyactiveradia-tion Estuaries v 24 p381
Gallegos CL 2005 Optical water quality of a blackwater river estuary the lower St Johns River Florida USA Estuarine Coastal and Shelf Science v 63 p 57ndash72
Gallegos CL and Kenworthy WJ 1996 Seagrass depth limits in the Indian River Lagoon Florida USA mdash Application of an optical water quality model Estuarine Coastal and Shelf Science v 42 p 267ndash288
Goodwin CR 1989 Circulation of Tampa and Sarasota Bays in E D Estevez eds Tampa and Sarasota Bays mdash Issues resources status and management Wash DC Proceedings of a seminar held December 10 1987 NOAA Estuary-of-the-Month Seminar Series No11 p 49ndash65
Gray JS Wu RS and Or YY 2002 Effects of hypoxia and organic enrichment on the coastal marine environment Marine Ecology Progress Series v 238 p 249ndash279
Greening HS 2001 Nutrient management and seagrass restoration in Tampa Bay Florida USA InterCoast Network v 40 p 6ndash7 38
Greening HS and DeGrove BD 2001 Implementing a voluntary nonreg-ulatory approach to nitrogen management in Tampa Bay Florida A publicprivatepartnershipTheScientificWorldv1p378ndash383
Chapter 5 Water Quality 151
Greening HS and Elfring C 2002 Local State regional and Federal roles in coastal nutrient management Estuaries v 25 p 838ndash847
Greening HS and Janicki A 2006 Toward reversal of eutrophic conditions in a subtropical estuary mdash Water quality and seagrass response to nitrogen loading reductions in Tampa Bay Florida USA Environmental Manage-ment v 38 p 163ndash178
Gregory R Ohlson D and Arvai J 2006 Deconstructing adaptive man-agement mdash Criteria for applications to environmental management Eco-logical Applications v 16 no 6 p 2411ndash2425
GriffenLCandGreeningHS2004Factorsinfluencingseagrassrecoveryin Feather Sound Tampa Bay Florida Report to the Pinellas County Envi-ronmental Fund Tampa Bay Estuary Program Technical Publication 07ndash04 34 p
Havens KE 2008 Cyanobacterial blooms Effects on aquatic ecosystems in Hudnell HK ed Proceedings interagency International Symposium on Cyanobacterial Harmful Algal Blooms Advances in Experimental Medi-cine amp Biology p 721ndash735
Hoagland P Anderson DM Kaoru Y and White AW 2002 The economic effects of harmful algal blooms in the United States mdash Estimates assessment issues and information needs Estuaries v 25 p 819ndash837
Holling CS ed 1978 Adaptive environmental assessment and manage-ment New York John Wiley 377 p
Howarth RW Sharpley A and Walker D 2002 Sources of nutri-ent pollution to coastal waters in the United States mdash Implications for achieving coastal water quality goals Estuaries v 25 p 656ndash676
Hu C Mueller-Karger FE and Swarzenski PW 2006 Hurricanes submarine groundwater discharge and Floridarsquos red tides Geophysical Research Letters v 33 p 11601
Janicki AJ and Wade DL 1996 Estimating critical nitrogen loads for the Tampa Bay estuary mdash An empirically based approach to setting management targets St Petersburg Tampa Bay National Estuary Program Technical Publication 06ndash96 60 p plus apps
Janicki AJ Wade DL and Pribble JR 2000 Developing and establish-ing a process to track the status of chlorophyll a concentrations and light attenuation to support seagrass restoration goals in Tampa Bay Tampa Bay Estuary Program Technical Publication 04ndash00 70 p
Janicki Environmental 2008 Estimates of total nitrogen total phosphorus total suspended solids and biochemical oxygen demand loadings to Tampa Bay Florida 2004ndash2007 Prepared for the Florida Department of Environmental Protection 86 p
Johansson JOR 1991 Long-term trends in nitrogen loading water quality and biological indicators in Hillsborough Bay Florida in Treat SF and ClarkPAedsProceedingsTampaBayAreaScientificInformationSymposium 2 St Petersburg Tampa Bay Regional Planning Council p 157ndash176
152 Integrating Science and Resource Management in Tampa Bay Florida
Johansson JOR 2005 Shifts in phytoplankton macroalgae and seagrass with changing nitrogen loading rates to Tampa Bay Florida in Treat SFedProceedingsTampaBayAreaScientificInformationSympo-sium BASIS 4 27ndash30 October 2003 St Petersburg Tampa Bay Regional Planning Council p 31ndash40
Johansson JOR and Lewis RR III 1992 Recent improvements of water quality and biological indicators in Hillsborough Bay a highly impacted subdivision of Tampa Bay Florida USA Science of the Total Environment Supplement p 1199ndash1215
Johansson JOR and Squires AP 1989 Surface sediments and their rela-tionship to water quality in Hillsborough Bay a highly impacted sub division of Tampa Bay in Estevez ED ed Tampa and Sarasota Bays mdash Issues resources status and management NOAA Estuary-of-the-Month Seminar Series No11 Proceedings of a seminar held December 10 1987 Wash DC p 129ndash143
Jones GW and Upchurch SB 1993 Origin of nutrients in ground water discharging from Lithia and Buckhorn springs Brooksville Southwest Florida Water Management District 159 p
Kenworthy WJ and Fonseca MS 1996 Light requirements of seagrasses Halodule wrightii and Syringodium filiforme derived from the relationship between diffuse light attenuation and maximum depth distribution Estuaries v 19 p 740ndash750
Killam KA Hochberg RJ and Rzemien EC 1992 Synthesis of basic life histories of Tampa Bay species St Petersburg Tampa Bay National Estuary Program Technical Publication 10ndash92 286 p
Kirkpatrick B Fleming LE Squicciarini D and others 2004 Literature review of Florida red tide mdash Implications for human health effects Harmful Algae v 3 p 99ndash115
Kolpin DW Furlong ET Meyer MT and others 2002 Pharmaceuticals hormones and other organic wastewater contaminants in US streams 1999ndash2000 mdash A national reconnaissance Environmental Science and Technology v 36 p 1202ndash1211
Kroeger KD Swarzenski PW Greenwood WJ and Reich C 2007 SubmarinegroundwaterdischargetoTampaBayNutrientfluxesandbiogeo-chemistry of the coastal aquifer Marine Chemistry v 104 p 85ndash97
Landsberg JH Hall S Johannessen JN and others 2006 Saxitoxin pufferfishpoisoningintheUnitedStateswiththefirstreportofPyrodinium bahamense as the putative toxin source Environmental Health Perspectives v 114 p1502ndash1507
Lee KN 1993 Compass and gyroscope Integrating Science and Politics for the Environment Wash DC Island Press 255 p
Lewis RR III and Estevez ED 1988 The ecology of Tampa Bay Florida AnestuarineprofileUSFishandWildlifeServiceBiologicalReport85132 p
Likens GE ed 1972 Nutrients and eutrophication American Society of Limnology and Oceanography Special Symposium 328 p
Chapter 5 Water Quality 153
McClellan GH and Eades JL 1997 The economic and industrial minerals of Florida in Randazzo AF and Jones DS eds The geology of Florida Gainesville University Press of Florida p 139ndash154
McLaughlin MR and Rose JB 2006 Application of bacteroides fragilis phage as an alternative indicator of sewage pollution in Tampa Bay Florida Estuaries and Coasts v 29 p 246ndash256
McPherson BF and Miller RL 1994 Causes of light attenuation in Tampa Bay and Charlotte Harbor southwestern Florida Water Resources Bulletin v 30 p 43ndash53
Meyers SD Luther ME Wilson M and others 2007 A numerical simulation of residual circulation in Tampa Bay Part I Low-frequency temporal variations Estuaries and Coasts v 30 p 679ndash697
MorrisonGJanickiAWadeDandothers1997Estimatednitrogenfluxesand nitrogen-chlorophyll relationships in Tampa Bay 1985ndash1994 in Treat SFedProceedingsTampaBayAreaScientificInformationSymposium3St Petersburg Tampa Bay Regional Planning Council and Tampa Bay Estu-ary Program p 249ndash268
Morrison G Sherwood ET Boler R and Barron J 2006 Variations in water clarity and chlorophyll a in Tampa Bay Florida in response to annual rainfall 1985ndash2004 Estuaries and Coasts v 29 p 926ndash931
Morrison G Swanson HN Harwood VH and others 2010 Using a ldquodecision matrixrdquo approach to develop a fecal coliform BMAP for impaired waters in the Hillsborough River watershed in Cooper S ed Proceed-ingsTampaBayAreaScientificInformationSymposium5StPetersburgTampa Bay Regional Planning Council and Tampa Bay Estuary Program p 401ndash419
Mortazavi B Iverson RL Landing WM and Huang W 2000 Phosphorus budget of Apalachicola Bay mdash A river-dominated estuary in the northeastern Gulf of Mexico Marine Ecology Progress Series v 198 p 33ndash42
Myers VB and Iverson RI 1981 Phosphorus and nitrogen limited phyto-plankton productivity in northeastern Gulf of Mexico coastal estuaries in Nielson BJ and Cronin LE eds Estuaries and nutrients Clifton New Jersey Humana Press p 569ndash582
National Research Council (NRC) 2000 Clean coastal waters mdash Understanding and reducing the effects of nutrient pollution Wash DC National Academy Press 405 p
National Research Council (NRC) 2008 Urban stormwater management in the United States Wash DC National Academy Press 610 p
Nixon SW 1981 Remineralization and nutrient cycling in coastal marine ecosystems in Nielson BJ and Cronin LE eds Estuaries and nutrients Clifton New Jersey Humana Press p111ndash138
Odum HT 1953 Dissolved phosphorus in Florida waters Tallahassee Florida Geological Survey Report of Investigations 9 40 p
Paerl HW 1988 Nuisance phytoplankton blooms in coastal estuarine and inland waters Limnology and Oceanography v 33 p 823ndash847
154 Integrating Science and Resource Management in Tampa Bay Florida
Paerl HW 1997 Coastal eutrophication and harmful algal blooms mdash Impor-tance of atmospheric deposition and groundwater as ldquonewrdquo nitrogen and other nutrient sources Limnology and Oceanography v 42 p 1154ndash1165
Paerl HW 2008 Nutrient and other environmental controls of harmful cyanobacterial blooms along the freshwater-marine continuum in Hudnell HK ed Proceedings Interagency International Symposium on Cyano-bacterial Harmful Algal Blooms Advances in Experimental Medicine amp Biology p 205ndash223
Paerl HW 2009 Controlling eutrophication along the freshwater-marine continuum mdash Duel nutrient (N and P) reductions are essential Estuaries and Coasts v 32 p 593ndash601
Poe A Hackett K Janicki S and others 2005 Estimates of total nitrogen total phosphorus total suspended solids and biochemical oxygen demand loadings to Tampa Bay Florida 1999ndash2003 St Petersburg Tampa Bay Estuary Program Technical Publication 07ndash04 374 p
Poe A Janicki AJ and Greening H eds 2006 Bay-wide environmental monitoring report 2002ndash2005 St Petersburg Tampa Bay Estuary Program Technical Publication 06ndash07 202 p
Pollman C 2005 Export of atmospherically derived nitrogen in the Tampa Bay watershed inTreatSFedProceedingsTampaBayAreaScientificInformation Symposium BASIS 4 27ndash30 October 2003 St Petersburg Tampa Bay Regional Planning Council p 127ndash136
Poor H Pribble R and Greening HS 2001 Direct wet and dry deposition of ammonia nitric acid ammonium and nitrate for the Tampa Bay Estuary FL USA Atmospheric Environment v 35 p 3947ndash3955
Pribble RJ Janicki AJ Zarbock H and others 2001 Estimates of total nitrogen total phosphorus total suspended solids and biochemical oxygen demand loadings to Tampa Bay Florida 1995ndash1998 St Petersburg Tampa Bay Estuary Program Technical Publication 05ndash01 227 p
Reynolds CS 2006 The ecology of phytoplankton Cambridge Cambridge University Press 1177 p
Rose JB Paul JH McLaughlin MR and others 2001 Healthy beaches Tampa Bay mdash Microbiological monitoring of water quality conditions and public health impacts St Petersburg Tampa Bay Estuary Program Technical Publication 03ndash01 192 p
Santos SL and Simon JL 1980 Marine soft-bottom community establishment following annual defaunation mdash Larval or adult recruitment Marine Ecology Progress Series v 2 p 235ndash241
Scheffer M 2004 The ecology of shallow lakes Boston Kluwer Academic Publishers 357 p
Schindler DW 1975 Whole-lake eutrophication experiments with phos-phorus nitrogen and carbon Verh Int Verein Theor Angew Limnol v19 p 3221ndash3231
Schueler T and Holland HK 2000 The practice of watershed protection Ellicot City Md Center for Watershed Protection 202 p
Chapter 5 Water Quality 155
Seitzinger SP Kroeze C Bouman AF and others 2002 Global patterns of dissolved inorganic and particulate nitrogen inputs to coastal systems mdash Recent conditions and future projections Estuaries v 25 p 640ndash655
Sherwood ET 2009 Tampa Bay water quality assessment 2008 St Peters-burg Tampa Bay Estuary Program Technical Publication 02ndash09 2 p
Spechler RM and Kroening SE 2007 Hydrology of Polk County Florida USGeologicalSurveyScientificInvestigationsReport2006ndash5320114p
Stumpf RP Litaker RW Lanerolle L and Tester PA 2008 Hydro-dynamic accumulation of Karenia off the west coast of Florida Continental Shelf Research v 28 no 1 p 189ndash213
Swarzenski PW and Baskaran M 2007 Uranium distribution in the coastal waters and pore waters of Tampa Bay Florida Marine Chemistry v 104 p 43ndash57
Swarzenski PW Reich C Kroeger KD and Baskaran M 2007a Ra and Rn isotopes as natural tracers of submarine groundwater discharge in Tampa Bay Florida Marine Chemistry v104 p 69ndash84
Swarzenski PW and Yates K 2005 Gulf of Mexico Integrated Science mdash Tampa Bay Study The impact of groundwater and contaminants on Tampa Bay US Geological Survey Open-File Report 2005ndash1015 2 p
Swarzenski PW Yates K Baskaran M and Henderson CS 2007b Tampa Bay as a model estuary for examining the impact of human activities on bio-geochemical processes mdash An introduction Marine Chemistry v 104 p 1ndash3
Tampa Bay National Estuary Program (TBNEP) 1995 Funding source inventory for CCMP action plans St Petersburg Tampa Bay National Estuary Program Technical Report 14ndash95 62 p
Tampa Bay Estuary Program (TBEP) 2006 Charting the course mdash The comprehensive conservation and management plan for Tampa Bay St Petersburg Tampa Bay Estuary Program 150 p
Tampa Bay Nitrogen Management Consortium (TBNMC) 2008 Tampa Bay nitrogen management strategy 2007 mdash Update to Reasonable Assurance Document 46 p accesssed at httpwwwtbeptechorgindexphpoption=com_contentampview=articleampid=612007-reasonable-assuranceampcatid=29ampItemid=54
Tampa Bay Nitrogen Management Consortium (TBNMC) 2009 2009 reason-able assurance addendum mdash Allocation and Assessment Report St Peters-burg Tampa Bay Estuary Program 158 p plus apps
Ternes TA 2006 Assessment of technologies for the removal of pharma-ceuticals and personal care products in sewage and drinking water facilities toimprovetheindirectpotablewaterreuseProjectPOSEIDONfinalreportGerman Federal Institute of Hydrology Koblenz 453 p
Tester PA and Steidinger KA 1997 Gymnodinium breve red tide blooms Initiation transport and consequences of surface circulation Limnology and Oceanography v 42 no 5 p 1039ndash1051
US Environmental Protection Agency (USEPA) 1997 Mercury Study Report to Congress EPA-452R-97ndash0031811 p
156 Integrating Science and Resource Management in Tampa Bay Florida
US Environmental Protection Agency (USEPA) 2007 Fact Sheet 2005ndash2006 National Listing of Fish Advisories EPA-823-F-07ndash003 7 p
US Geological Survey (USGS) 1995 Mercury Contamination of Aquatic Ecosystems US Geological Survey Fact Sheet FS-216ndash95
Vargo GA Heil CA Fanning KA and others 2008 Nutrient availability in support of Karenia brevis blooms on the central West Florida Shelf mdash What keeps Karenia blooming Continental Shelf Research v 28 no 9 p 73ndash98
Vargo GA Richardson WR Howard D and Paul JH 1991 Phyto-planktonproductioninTampaBayandtwotidalriverstheAlafiaandLittleManatee in Treat SF and Clark PA eds Proceedings Tampa Bay Area ScientificInformationSymposium2StPetersburgTampaBayRegionalPlanning Council p 317ndash340
Wade D L and Janicki AJ 1993 Physical impacts to habitats in Tampa Bay St Petersburg Tampa Bay National Estuary Program Technical Publication 03ndash93 134 p
Walsh JJ Joliff JK Darrow BP and others 2006 Red tides in the Gulf of Mexico mdash Where when and why Journal of Geophysical Research v 111 no C11 p C11003
Walsh J J and Steidinger KA 2001 Saharan dust and red tides The cyano-phyte connection Journal of Geophysical Research v 106 p 11597ndash11612
Walsh JJ Weisberg RH Dieterle DA and others 2003 Phytoplankton response to intrusions of slope water on the west Florida Shelf mdash Models and observations Journal of Geophysical Research v 108 no C6 p 3190
Wang PF Martin J and Morrison G 1999 Water quality and eutro-phication in Tampa Bay Florida Estuarine Coastal and Shelf Science v 49 p 1ndash20
Weisberg RH and Zheng L 2006 Circulation of Tampa Bay driven bybuoyancytidesandwindsassimulatedusingafinitevolumecoastal ocean model Journal of Geophysical Research v 111 C01005 doi1010292005JC003067
Wolfe SH and Drew RD 1990 An ecological characterization of the Tampa Bay watershed US Fish and Wildlife Service Biological Report v 90 no 20 334 p
World Health Organization 2003 Guidelines for safe recreational water environ-ments mdash Volume 1 Coastal and freshwaters Geneva Switzerland 29 p
World Health Organization 2006 Guidelines for drinking water quality Geneva Switzerland 78 p
Zarbock HW and Janicki AJ 1997 Guidelines for calculating nitrogen load reduction credits St Petersburg Tampa Bay National Estuary Program Technical Publication 02ndash97 16 p plus apps
Zarbock H Janicki A Wade D and others 1994 Estimates of total nitrogen total phosphorus and total suspended solids loadings to Tampa Bay Florida St Petersburg Tampa Bay National Estuary Program Technical Publication 04ndash94 388 p
- Chapter 5--Water Quality 105-156
-
- Connectivity - Bay Watershed and Airshed
- Eutrophication in Tampa Bay
- Box 5-1
- Box 5-2
- Box 5-3
- Box 5-4
- Table 5-1
- Toxins and Harmful Algal Blooms
- Box 5-5
- Pathogen-Related Water-Quality Impairments
- Future Challenges-Ongoing Population Growth
- References Cited
- Chap 5 Figures
-
- Figure 5-1
- Figure 5-2
- Figure 5-3
- Figure 5-4
- Figure 5-5
- Figure 5-6
- Figure 5-7
- Figure 5-8
- Figure 5-9
- Figure 5-10
- Figure 5-11
- Figure 5-12
- Figure 5-13
- Figure 5-14
- Figure 5-15
- Figure 5-16
- Figure 5-17
- Figure 5-18
- Figure 5-19
- Figure 5-20
- Figure 5-21
-
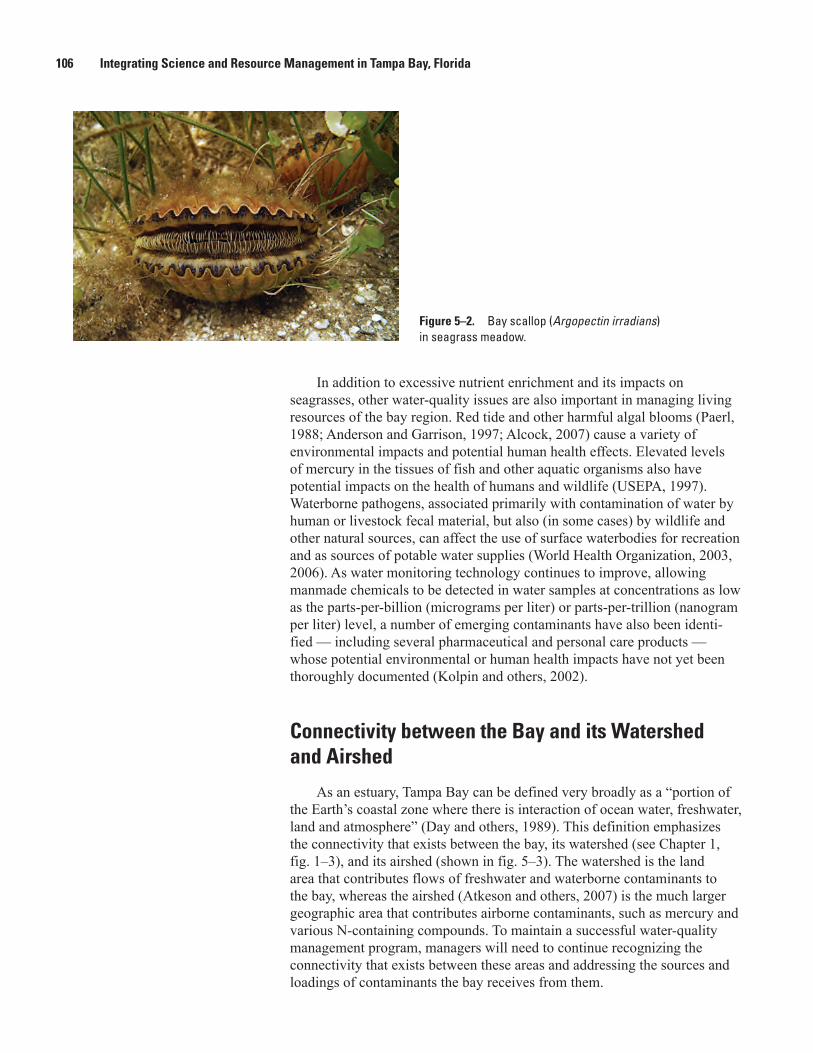
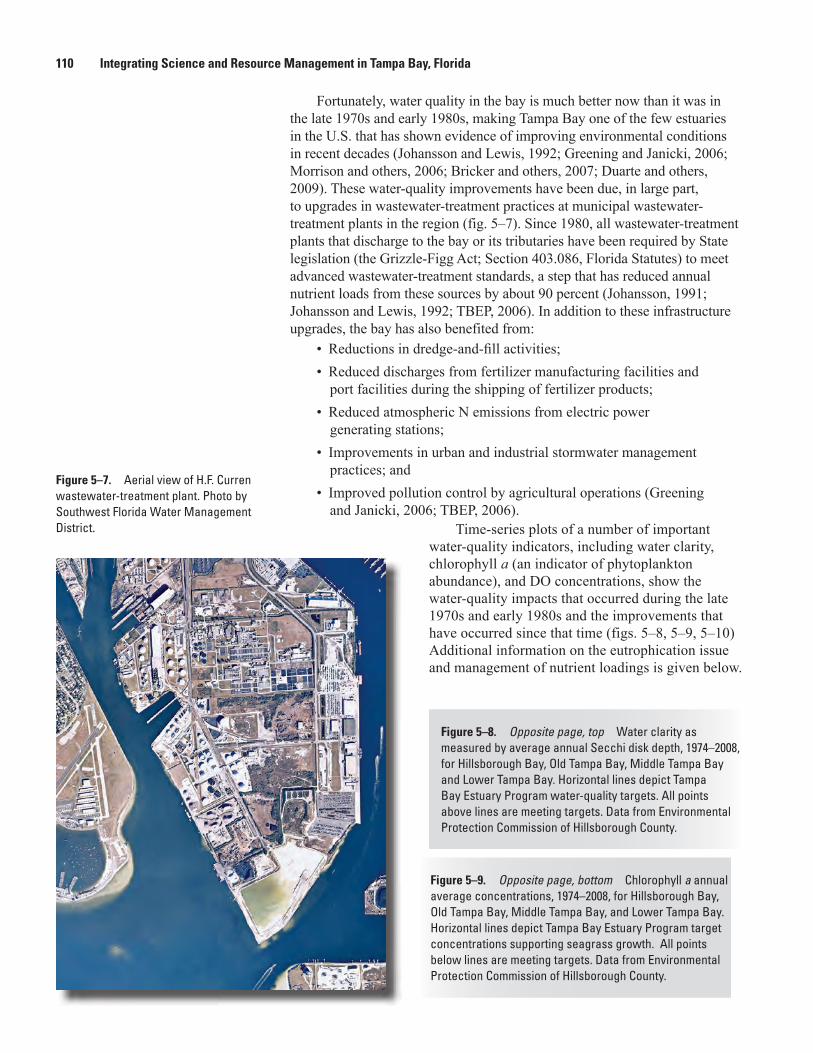
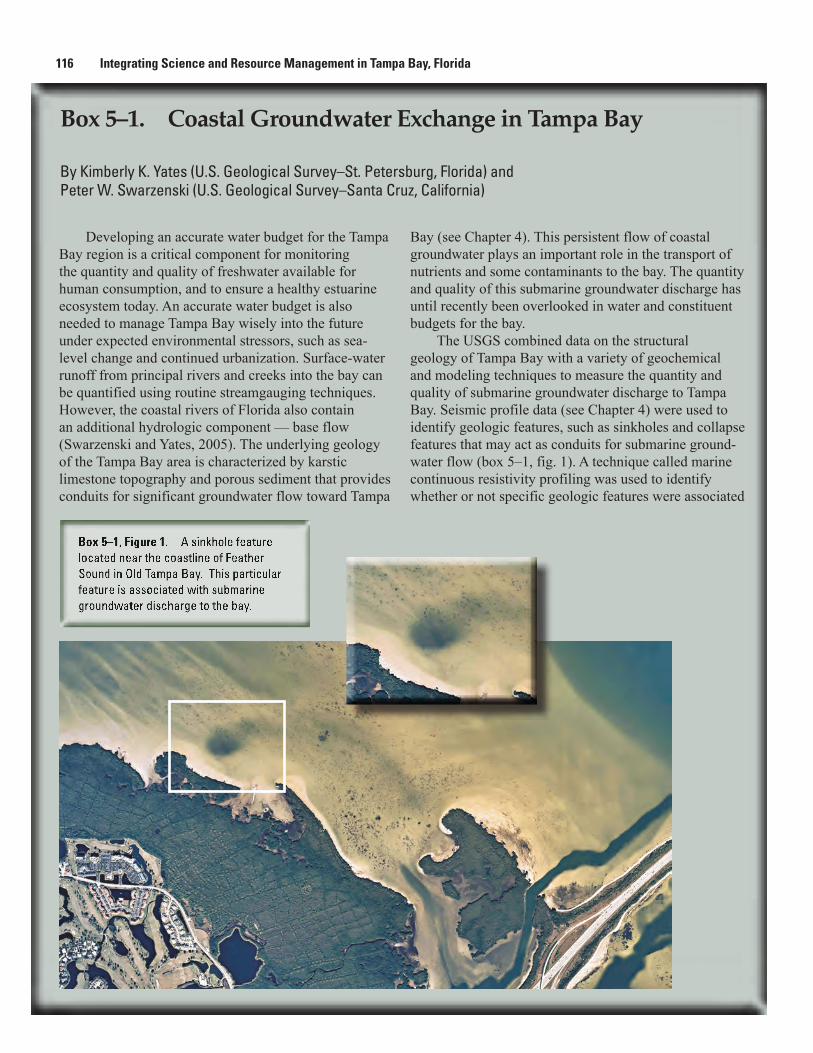
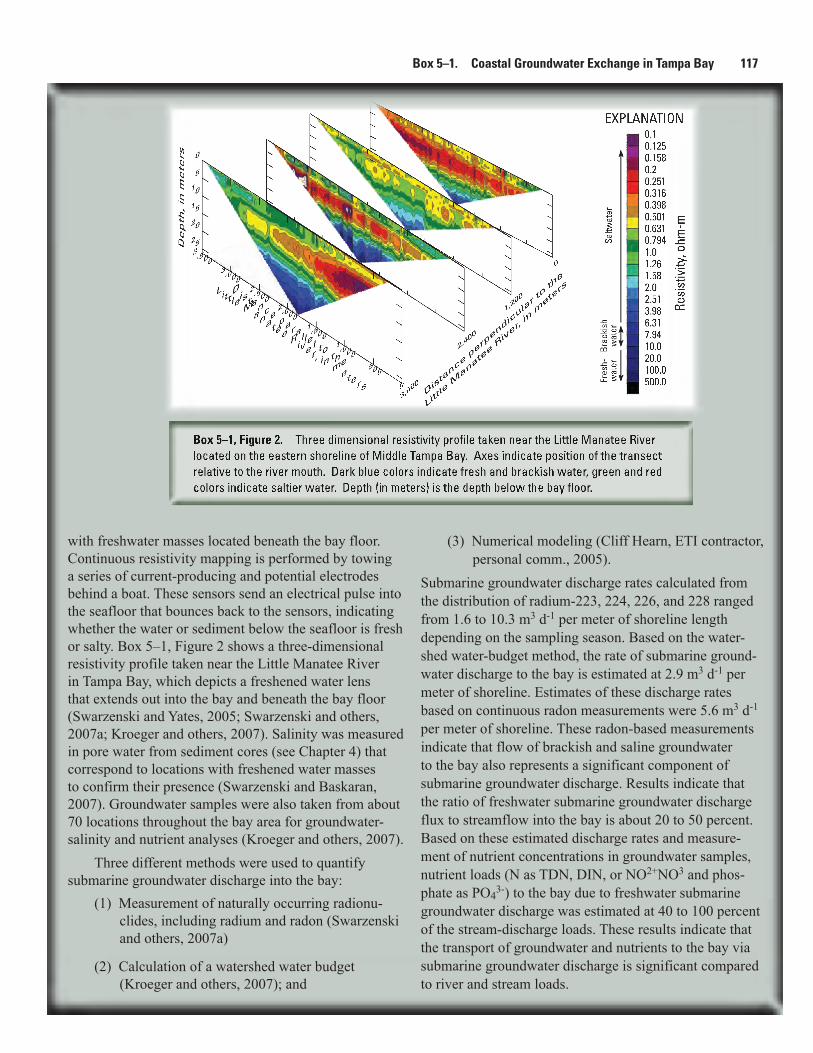
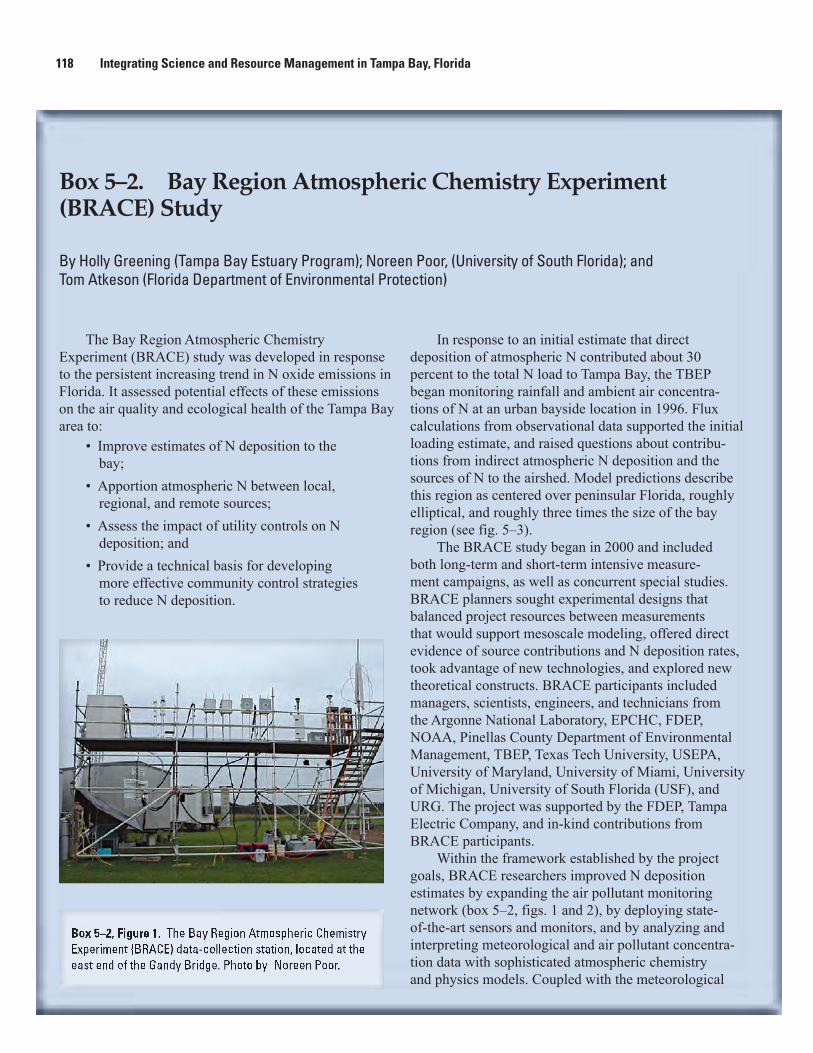
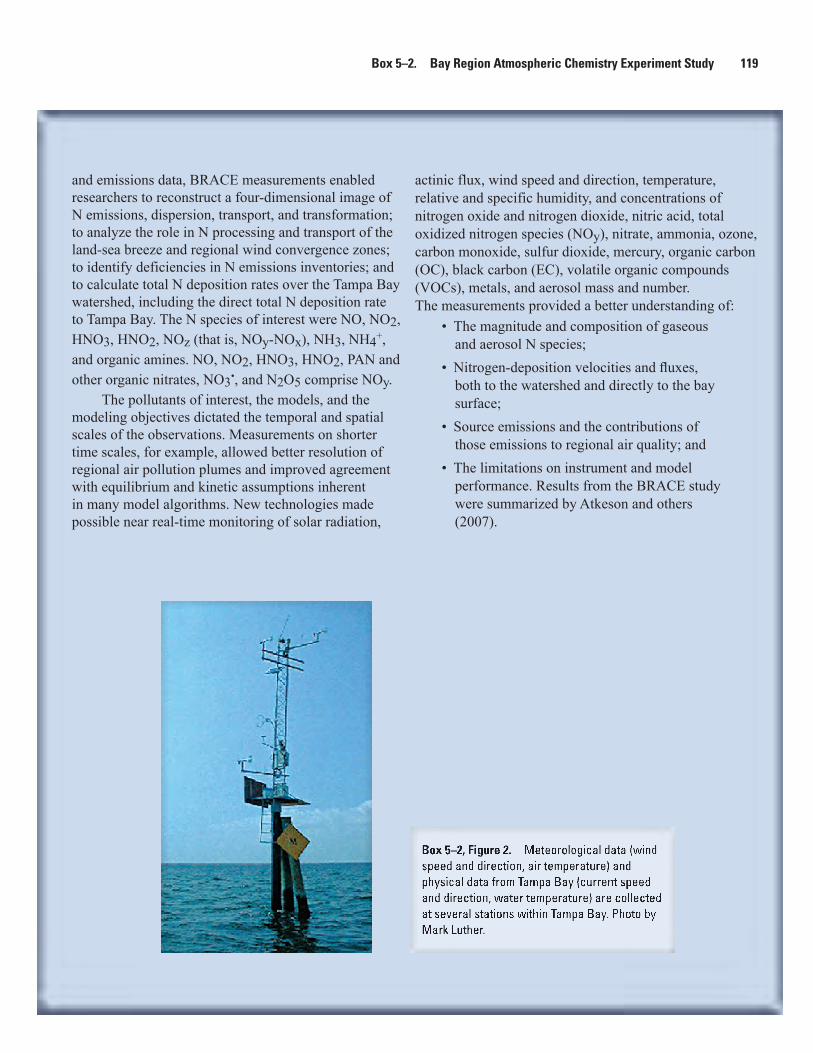
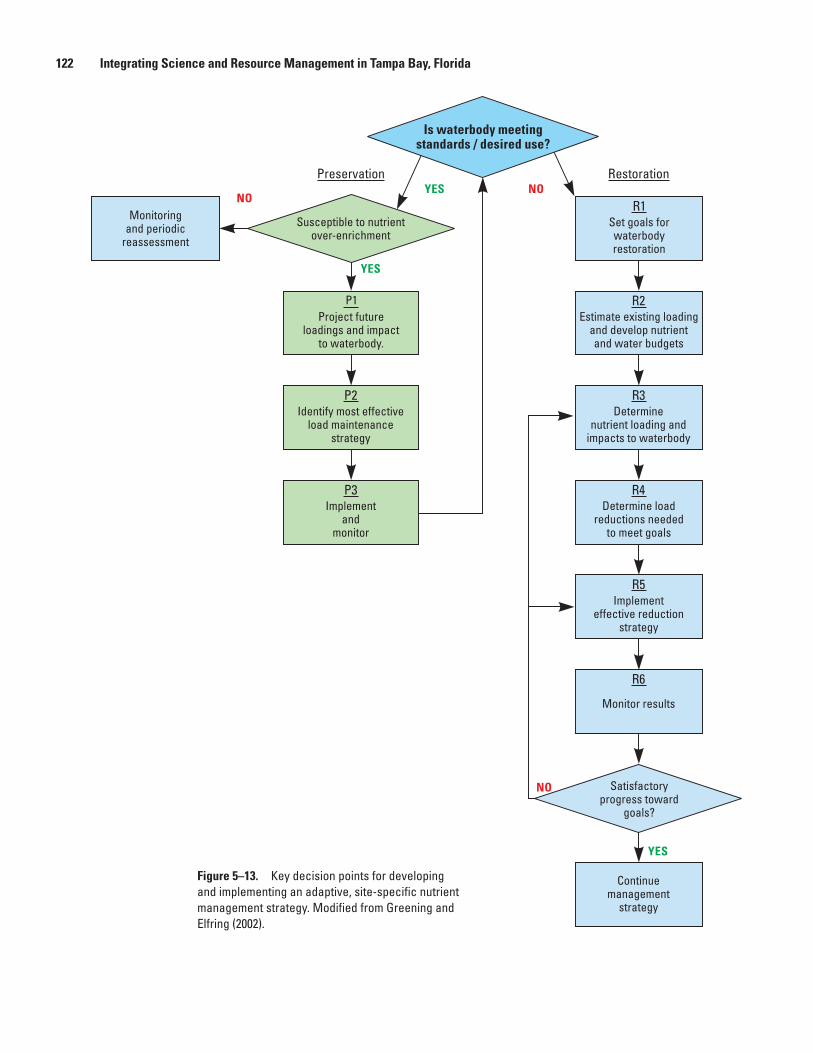
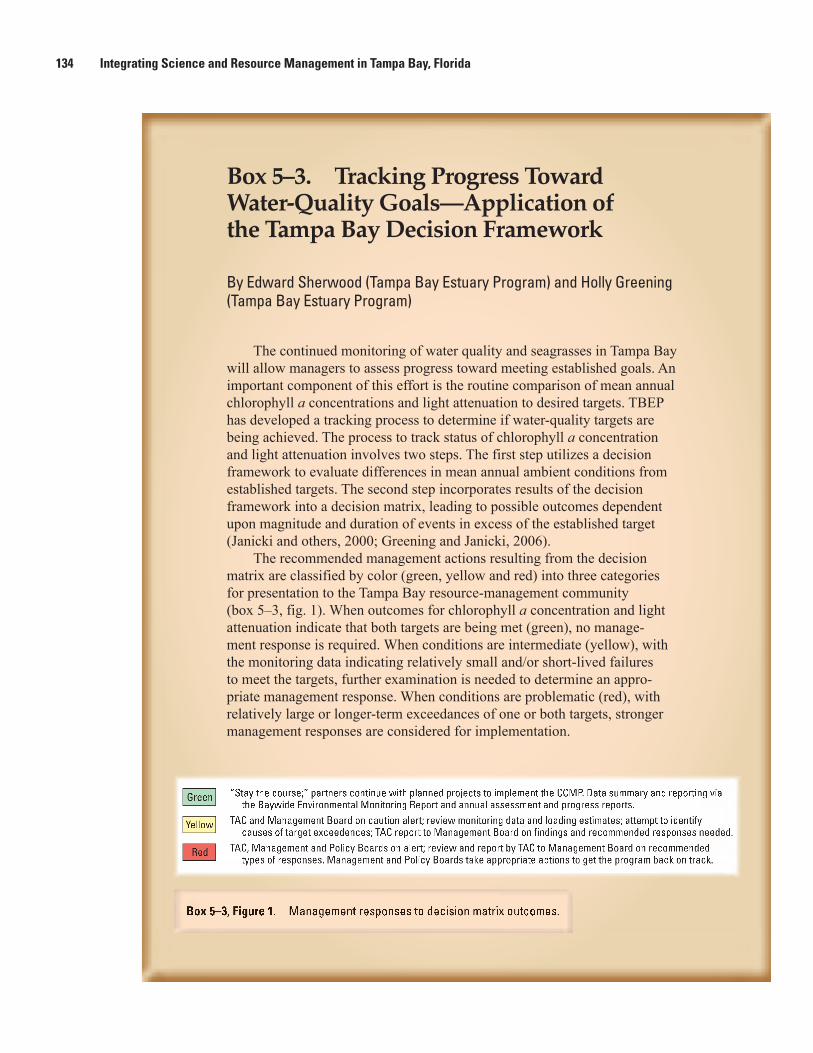
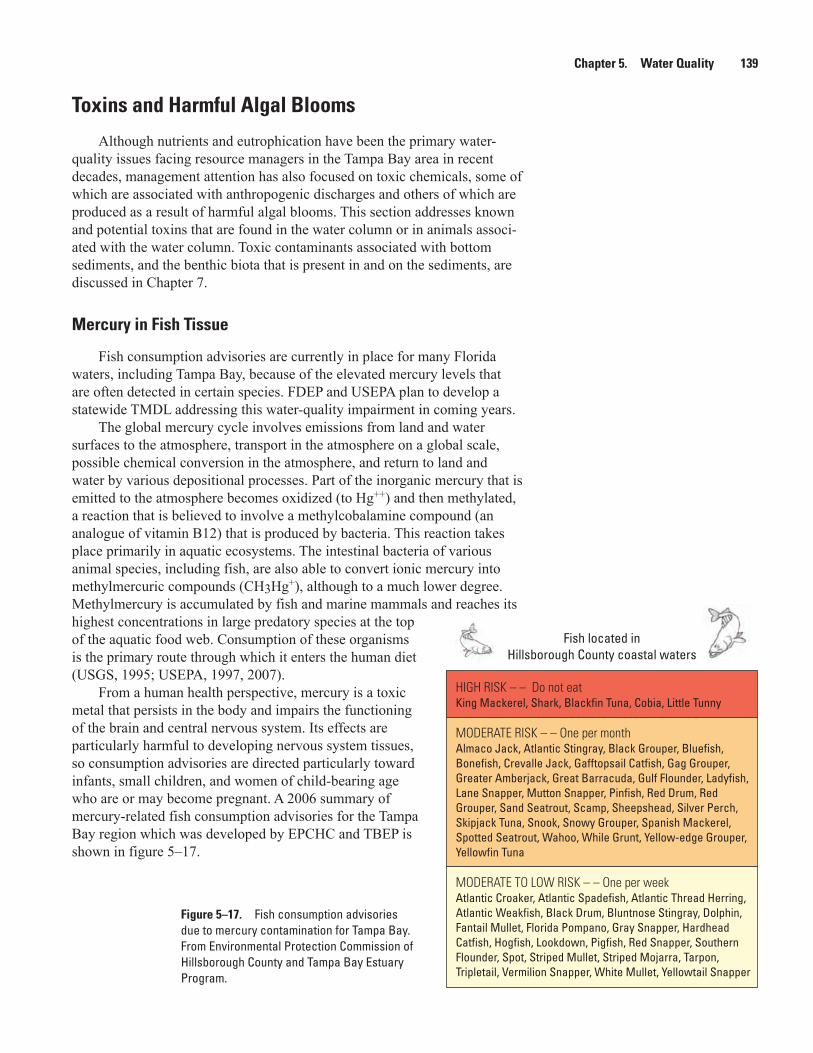
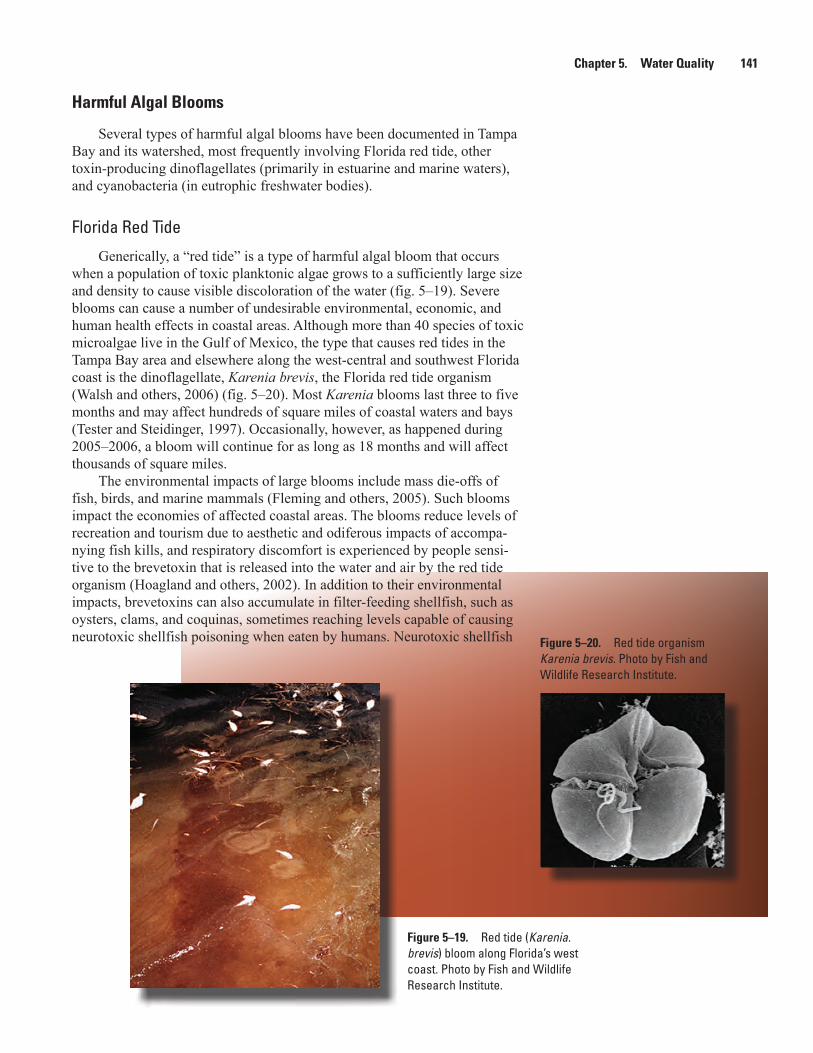
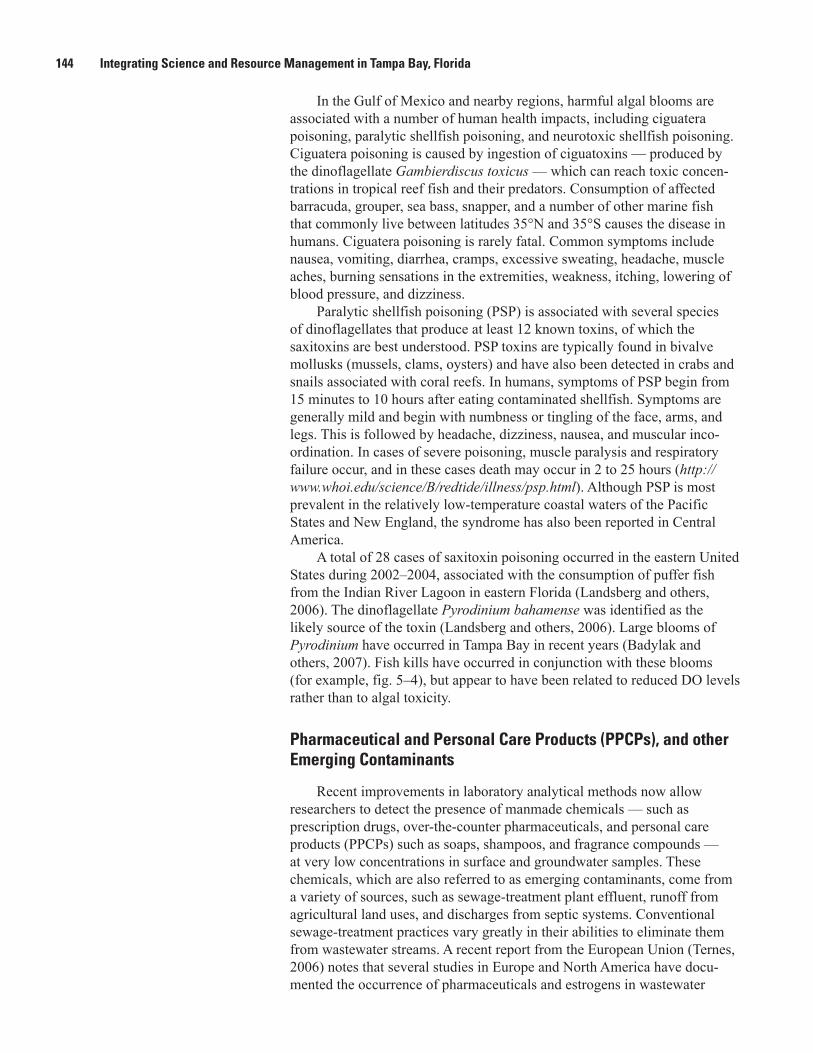