chapter 5 supply. section 1: what is supply main idea: for almost any good or service, the higher...
TRANSCRIPT
CHAPTER 5 SUPPLY

Section 1: What is Supply
• Main Idea: For almost any good or service, the higher the price, the larger the quantity that will be offered for sale.
• Objectives: • Explain how market supply curves are derived.• Specify the reasons for a change in supply.

Section 1 Introduction
• The concept of supply is based on voluntary decisions made by producers, whether they are proprietorships working out of home offices or large corporations operating out of downtown corporate headquarters.
• For example, a producer might decide to offer one amount for sale at one price and a different quantity at another price.

• Supply, then, is defined as the amount of a product that would be offered for sale at all possible prices that could prevail in the market.
• Because the producer is receiving payment for his or her products, it should come as no surprise that more will be offered at higher prices.
• This forms the basis for the Law of Supply, the principle that suppliers will normally offer more for sale at high prices and less at lower prices.
Introduction (cont.)
• Supply is the amount of a product that would be offered for sale at all possible prices in the market.
• The Law of Supply states that suppliers will normally offer more for sale at high prices and less at lower prices.
An Introduction to Supply

• An individual supply curve illustrates how the quantity that a producer will make varies depending on the price that will prevail in the market. A market supply curve illustrates the quantities and prices that all producers will offer in the market for any given product or service.
• Economists analyze supply by listing quantities and prices in a supply schedule (table). When the supply data is graphed, it forms a supply curve with an upward slope.
An Introduction to Supply

The Supply ScheduleFigure 5.1Figure 5.1

The Market Supply CurveFigure 5.2Figure 5.2

• A change in quantity supplied is the change in amount offered for sale in response to a change in price.
• Producers have the freedom, if prices fall too low, to slow or stop production or leave the market completely. If the price rises, the producer can step up production levels.
Change in Quantity Supplied

• A change in supply is when suppliers offer different amounts of products for sale at all possible prices in the market.
• Factors that can cause a change in supply include: the cost of inputs; productivity levels; technology; taxes or the level of subsidies; expectations; and government regulations.
Change in Supply

• A change in supply is when suppliers offer different amounts of products for sale at all possible prices in the market.
• Factors that can cause a change in supply include:• the cost of inputs• productivity levels• Technology
• taxes or the level of subsidies: a government payment to an individual, business, or other group to encourage or protect a certain type of economic activity.
• Expectations• government regulations
Change in Supply (cont.)

• Supply is elastic when a small increase in price leads to a larger increase in output—and supply.
• Supply is inelastic when a small increase in price cause little change in supply.
• Supply is unit elastic when in price causes a proportional change in supply.
Elasticity of Supply

• Determinants of supply elasticity are related to how quickly a producer can act when the change in price occurs. If adjusting production can be done quickly, the supply is elastic. If production is complex and requires much advance planning, the supply is inelastic. Another factor is substitution: if substituting for a given product is easy, the supply is elastic; if it is difficult to substitute, the supply is inelastic.

Elasticity of Supply (cont.)Figure 5.4aFigure 5.4a Figure 5.4bFigure 5.4b
Figure 5.4cFigure 5.4cFigure 5.4dFigure 5.4d

Section 2: The Theory of Production
• Main Idea: A change in the variable input called labor, results in a change in production.
• Objectives: • Explain the theory of production.• Describe the three stages of production.
Section 2 Introduction
• Whether they are film producers of multimillion-dollar epics or small firms that market a single product, suppliers face a difficult task.
• Producing an economic good or service requires a combination of land, labor, capital, and entrepreneurs.
• The theory of production deals with the relationship between the factors of production and the output of goods and services.

• The theory of production generally is based on the short run, a period of production that allows producers to change only the amount of the variable input called labor.
• This contrasts with the long run, a period of production long enough for producers to adjust the quantities of all their resources, including capital.
Introduction (cont.)

• For example, Ford Motors hiring 300 extra workers for one of its plants is a short-run adjustment.
• If Ford builds a new factory, this is a long-run adjustment.
Introduction (cont.)

• In the short run, output will change as one variable input is altered, but others inputs are kept constant.
• The Law of Variable Proportions looks at how the final product is affected as more units of one variable input or resource are added to a fixed amount of other resources.
• Economists prefer that only a single variable be changed at any one time so the impact of this variable on total output can be measured.
Law of Variable Proportions

• The concept illustrates the Law of Variable Proportions within a production schedule or a graph.
• It describes the relationship between changes in output to different amounts of a single input while others are held constant.
The Production Function
• Total product is the total output the company produces: a production schedule shows that, as more workers are added, total product rises until a point that adding more workers causes a decline in total product.
• Marginal product is the extra output or change in total product caused by adding one more unit of variable input.
The Production Function (cont.)

The Production Function (cont.)Figure 5.5aFigure 5.5a

The Production Function (cont.)Figure 5.5bFigure 5.5b

• In Stage I, (increasing returns), marginal output increases with each new worker. Companies are tempted to hire more workers, which moves them to Stage II.
• In Stage II, (diminishing returns), total production keeps growing but the rate of increase is smaller; each worker is still making a positive contribution to total output, but it is diminishing.
• In Stage III (negative returns), marginal product becomes negative, decreasing total plant output.
Three Stages of Production

Section 3: Cost, Revenue, and Profit Maximization
• Main Idea: Profit is maximized when the marginal costs of production equal the marginal revenue from sales.
• Objective: • Define four key measures of cost.• Identify two key measures of revenue.• Apply incremental analysis to business decisions.

Section 3 Introduction
• Overhead is one of many different measures of costs.

• Fixed costs are those that a business has even if it has no output. These include management salaries, rent, taxes, and depreciation on capital goods.
• Variable costs are those that change when the rate of operation or production changes, including hourly labor, raw materials, freight charges, and electricity.
• Total cost is the sum of all fixed costs and all variable costs.
• Marginal cost is the extra (variable) costs incurred when a business produces one additional unit of a product.
Measures of Cost
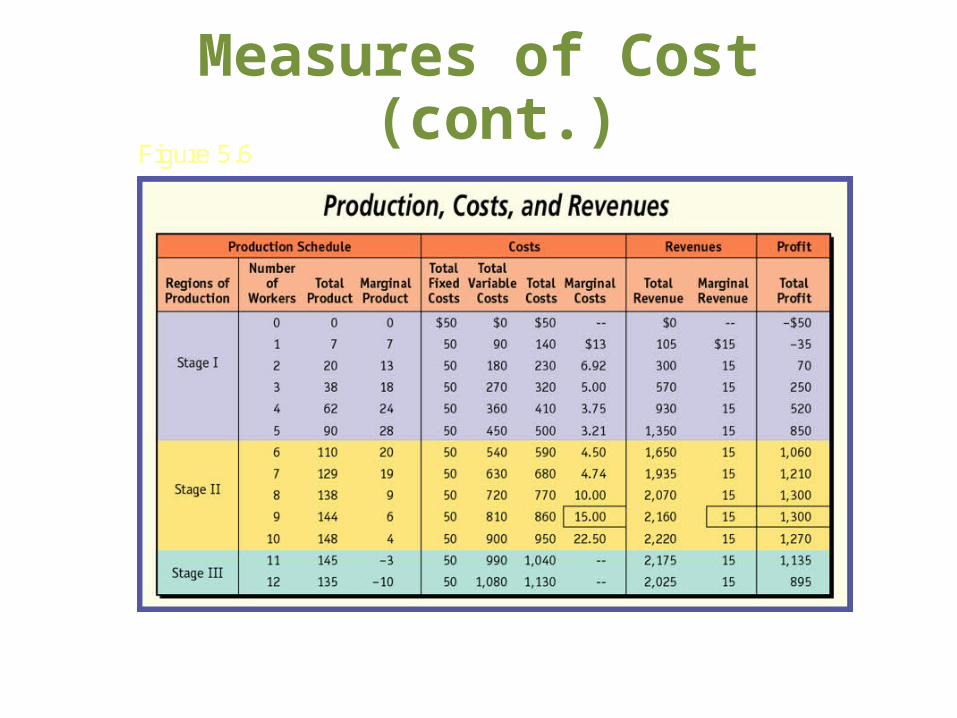
Measures of Cost (cont.)Figure 5.6Figure 5.6

• A self-service gas station is an example of high fixed costs with low variable costs. The ratio of variable to fixed costs is low.
• E-commerce is an example of an industry with low fixed costs.
Applying Cost Principles

• Total revenue is the number of units sold multiplied by the average price per unit.
• Marginal revenue is the extra revenue connected with producing and selling an additional unit of output.
Measures of Revenue
• Marginal analysis, is comparing the extra benefits to the extra costs of a particular decision.
• The break-even point is the total output or total product the business needs to sell in order to cover its total costs.
• Businesses want to find the number of workers and the level of output that generates maximum profits. The profit-maximizing quantity of output is reached when marginal cost and marginal revenue are equal.
Marginal Analysis

Key Terms• Supply• Law of Supply • supply schedule • supply curve • market supply curve • quantity supplied • change in quantity supplied • change in supply • subsidy • supply elasticity• theory of production• short run • long run • Law of Variable Proportions • production function • raw materials • total product
• marginal product • stages of production • diminishing returns• fixed cost• overhead • variable cost • total cost • marginal cost • e-commerce • total revenue • marginal revenue • marginal analysis • break-even point • profit-maximizing quantity of output