chapter 5. reactors - snuwemt.snu.ac.kr/lecture 2013-2/env/2013 ch 5-1 reactors.pdf · 5.1.1...
TRANSCRIPT

Chapter 5. Reactors
• Reactors many different types exist for environmental engineering
generally designed to emphasize suspended growth or biofilms that make use of suspended growth are also called: suspended-floc, dispersed-growth, slurry reactors that make use of biofilms are also called: fixed-film, attached-growth, immobilized reactors
• Engineer must understand 1) kinetics of substrate removal by different types of microorganisms 2) fundamental properties of different reactor types

5. Reactors
• Factors influencing the choice among the different reactor types : physical & chemical characteristics of the waste being considered
concentration of contaminants being treated
presence or absence of oxygen
efficiency of treatment and system reliability required
climatic conditions under which the reactor will operate
number of different biological processes involved in the overall treatment system
skills & experience of those who will operate the system
relative costs at a given location and time for construction and
operation of different possible reactor configurations
• The aim of this chapter : i) how to construct mass balances for different reactors,
ii) how to use of mass balances to derive basic equations that describe the relationship between reactor size and treatment performance.

• Typical reactors used in environmental application
Basic reactors
Biofilm reactors
5. 1 Reactor Types

5.1 Reactor Types

5.1.1 Suspended-Growth Reactors A) Batch reactors: the simplest suspended-growth reactor biochemical reactions take place without new additions until the reaction is complete commonly used in laboratory-scale kinetics of contaminant removal is similar to that of an ideal plug-flow reactor
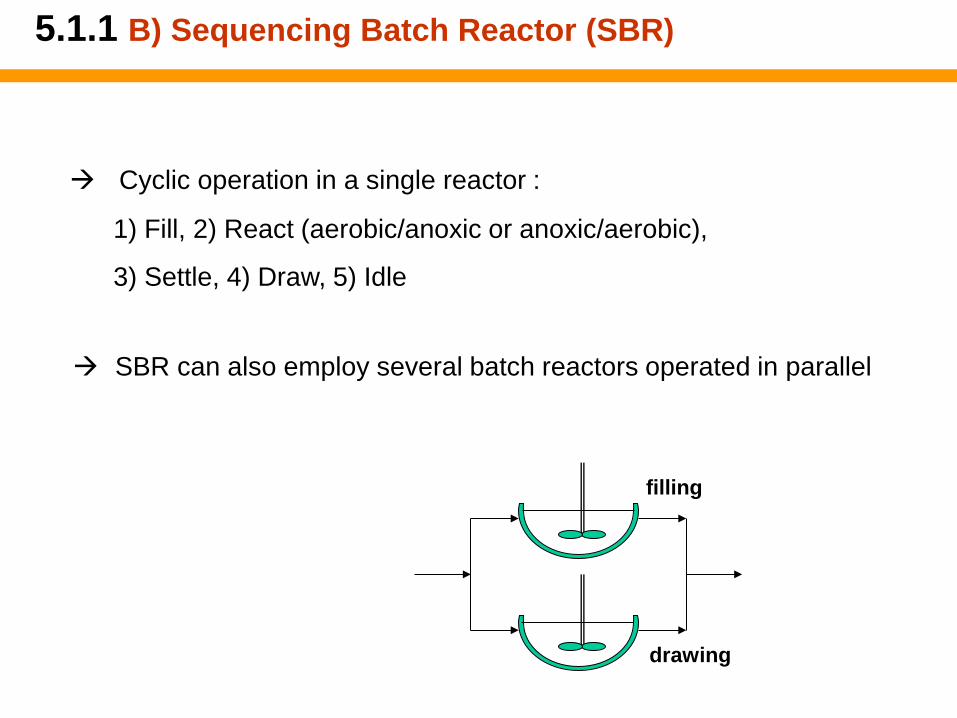
SBR can also employ several batch reactors operated in parallel
filling
drawing
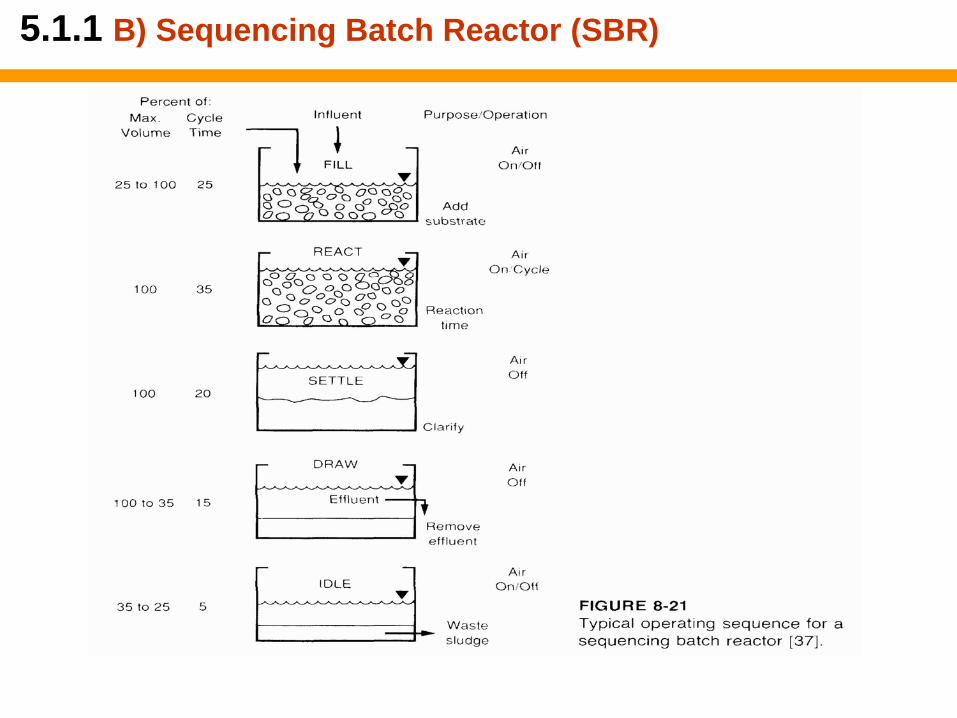
Cyclic operation in a single reactor :
1) Fill, 2) React (aerobic/anoxic or anoxic/aerobic),
3) Settle, 4) Draw, 5) Idle
5.1.1 B) Sequencing Batch Reactor (SBR)
5.1.1 B) Sequencing Batch Reactor (SBR)

5.1.1 B) Sequencing Batch Reactor (SBR)

5.1.1 B) Sequencing Batch Reactor (SBR)
• Advantages of SBR:
1) Total capital costs are significantly reduced due to the elimination of clarifiers and recirculation facilities.
2) Operating flexibility is greatly increased, since the cycle format can be easily modified at any time to offset i)change in process conditions, ii)influent characteristics or iii)effluent objectives.
3) Process reliability is greatly improved because the SBR process is not affected by hourly, daily, or seasonal feed variations.
4) Since only one vessel is used for all proces operations, plant extension is simplified.
5) Better resistance to sludge bulking, since the biomass undergoes cyclic feast-famine conditions, which have been proven to produce better settling sludge than continuous flow.

5.1.1 C) Continuous-flow stirred-tank reactor(CSTR), or completely mixed reactor :
used to culture organisms or to study basic biochemical phenomena in
laboratory (chemostat)
liquid or slurry stream is continuously introduced, and liquid contents are
continuously removed from the reactor
concentration of substrates and microorganisms are the same everywhere
throughout the reactor (Ideal CSTR) ; it makes analysis of CSTR comparatively simple.

5.1.1 D) plug-flow reactor (PFR)
Sometimes referred to tubular reactor or piston-flow reactor. In the ideal PFR,the flow moves through the reactor with no mixing with earlier or later entering flows. Hence if one knows the flow rate to the reactor and its size, the location of the element at any time can be calculated. Unlike the CSTR, the concentartions of substrates and microorganisms vary throughout the reactor. An ideal PFR is difficult to realize in practice, because mixing in the direction of flow is impossible to prevent .

5.1.1 Comparison of CSTR and PFR 1) The high rate of substrate utilization at the entrance of reactor in PFR because the substrate concentrations are highest at the entrance. If other conditions are the same, a higher S gives a higher rate of reaction. So a PFR generally produces a higher conversion of S in a given volume than a CSTR. (advantage of PFR). It exceeds the ability to supply sufficient oxygen (high DO demand at the entrance and low DO demand at the exit) in an aerobic system. Thus the aerators for PFR should be designed to provide more oxygen in the inlet region. (disadvantage of PFR) It results in excess organic acid production and pH problems , e.g., destruction of methanogens at low pH in an anaerobic system. (disadvantage of PFR)

5.1.1 Comparison of CSTR and PFR . 2) In CSTR, the S in the reactor is the same as S in the effluent. So the fresh feed is immediately dispersed into an environment of low S. In PFR, the S decreases along the length of reactor. If no biomass enters PFR, no biological reaction would occur and the reactor washes out. On the other hand, the influent to a CSTR is mixed with reactor fluid containing biomass so that a CSTR can be sustained even in the absence of biomass in the feed. Processes for in situ biodegradation of contaminants in ground waters often operate similar to PFR. Here, mixing in the direction of flow (longitudinal) is generally small, making plug flow the natural outcome.

5.1.1 Comparison of CSTR and PFR
3) The CSTR is more stable than a PFR in response to toxic and shock loadings.
If a concentrated pulse of a toxic substance enters a PFR, the concentration remains high as it moves along the PFR. Because of high concentration, the toxic substance may destroy an appreciable quantity of the biomass in the system and cause a long term upset in PFR performance. With a CSTR, the pulse of toxin is dispersed rapidly throughout the CSTR and its concentration level is reduced so that the metabolic processes of microorganisms may be only slightly affected by the diluted toxin. In general, a CSTR gives a more uniform effluent under varying feed conditions.

5.1.1 Comparison of CSTR and PFR
4) The CSTR and PFR are idealized models that are difficult to achieve in large scale biological reactors.
In actual CSTR, short-circuiting of fluid and stagnant zones may occur because
of incomplete mixing with the bulk of the reactor fluid.
In PFR, aeration of the fluid causes longitudinal mixing and a distribution of residence times. Thus, long biological reactors with aeration are often better simulated by an axial dispersion model or a CSTR in series model.
Tracer techniques are useful in establishing an appropriate hydraulic model for a biological reactor.

5.1.1 Practical Aspects of Reactor Design
• The deviation from two idealized flow patterns :
I) Dead Zone (Stagnant zone) 2) Channeling of fluid 3) Short-circuiting caused by i) density current in plug-flow reactor ii) inadequate mixing in a CSTR • This type of flow should be avoided since it always lowers the
performance of the unit.
• The problems of non-ideal flow are intimately tied to those of scale-up.
• Often the uncontrolled factor differs widely between large and small units. Therefore ignoring this factor may lead to gross errors in design.

• Reactor arrangements
5. 1.3 Reactor Arrangements
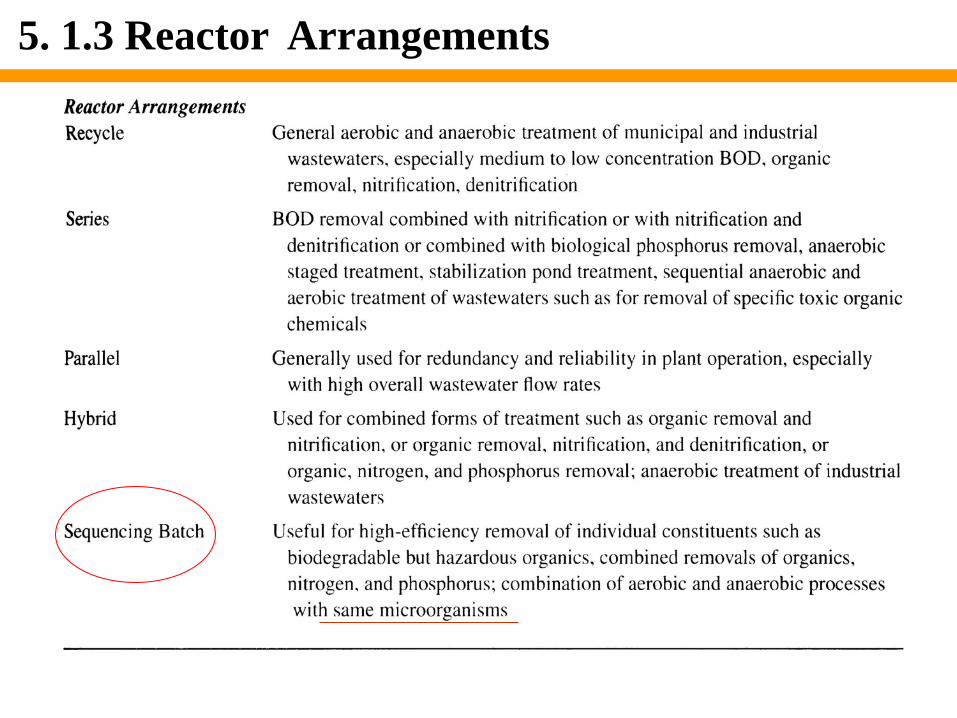
5. 1.3 Reactor Arrangements

5. 1.3 Reactor Arrangements
1) Reactors in series : - when different types of treatment are needed. For example, organic oxidation (1st reactor) nitrification (2nd reactor) denitrification (3rd reactor) - To create plug-flow characteristics.
2) Reactors in parallel : - to provide redundancy in the system so that some reactors can be out of service, while others on a parallel track remain in operation. - when the total flow to be treated far exceeds the capacity of the largest practical units available. - it maintains more of a completely mixed nature, compared to the more plug- flow nature of reactors in series.

5.2 Mass Balances
electron donor elector acceptor nitrogen source
0.02mole bacteria represents and is called ; sludge, waste biomass, waste biosolids, excess biosolids
[ ]34.21067.00133.012.006.002.0
12.002.012.00333.0
2322275
4356
OHHCOCONNOHC
HNHNOCOOHC
++++
→+++
−
++−−
1) Mass balance is the key to design and analysis of microbiological processes. - It provides the critical information on what must be added to and removed from the process. - It makes determine the amount of chemicals to satisfy the energy, nutrient, and environmental needs of the microorganisms.
For example: process for biological denitrification
• Reactor design
bacteria
(a) (b)
(c)
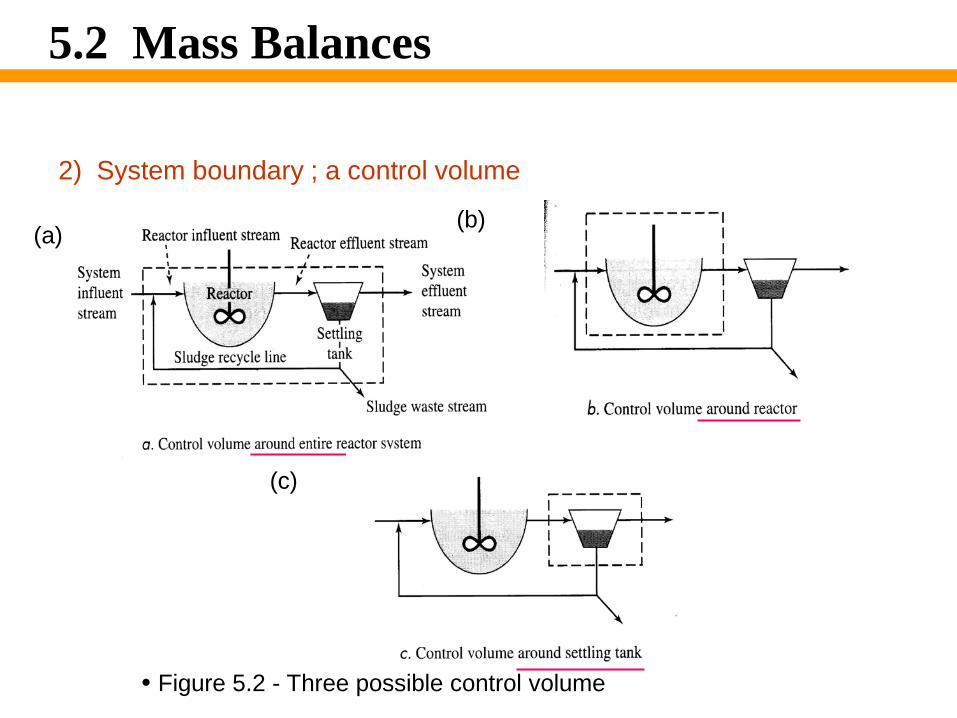
• Figure 5.2 - Three possible control volume
5.2 Mass Balances
2) System boundary ; a control volume

Component entered
Component left
Component Destroyed or formed
Fig.5.2-a By way of influent stream
effluent stream or sludge waste stream
Within the reactor system
Fig.5.2-b influent stream effluent stream In the reactor
Fig.5.2-c Reactor effluent stream
Settling tank effluent stream or sludge recycle line
In the settling tank
5.2 A component may enter /or leave the control volume

-The mass balance is defined in terms of rates of mass change in the control volume. -Each component must have its own mass balance
components : COD, TOC, biomass, oxygen, electron acceptor,
nitrate, ammonium etc. -In the development of equations useful for a reactor system, mass balances on several different components of interest and around several different control volumes sometimes are required.
5.2 Mass Balances 3) Reaction rates affect the size of the treatment system.
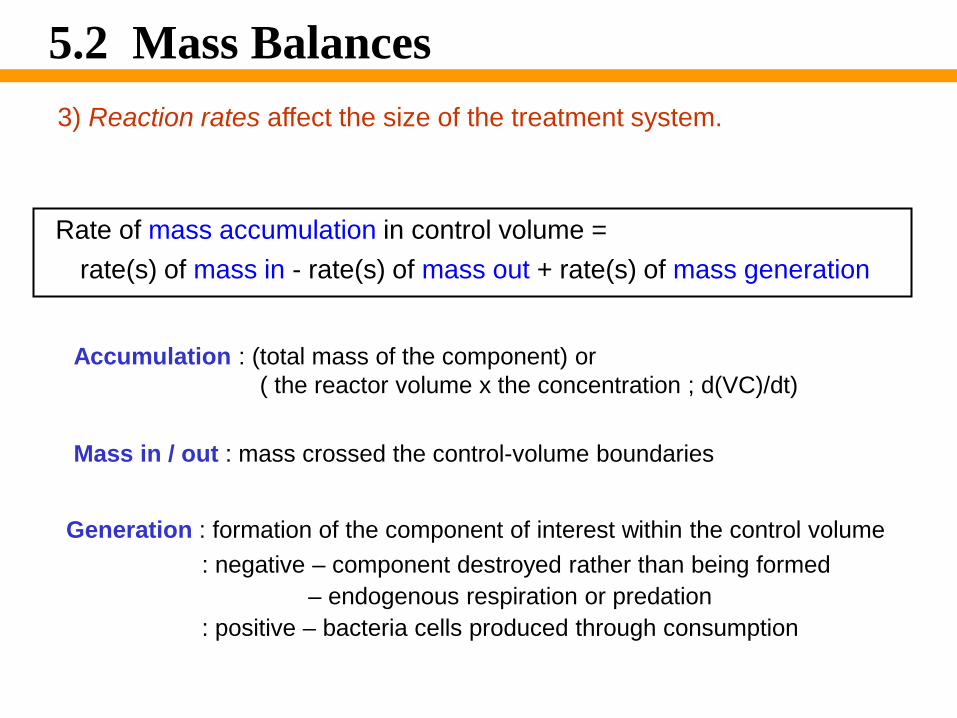
Accumulation : (total mass of the component) or ( the reactor volume x the concentration ; d(VC)/dt)
Generation : formation of the component of interest within the control volume
Rate of mass accumulation in control volume = rate(s) of mass in - rate(s) of mass out + rate(s) of mass generation
Mass in / out : mass crossed the control-volume boundaries
: negative – component destroyed rather than being formed – endogenous respiration or predation : positive – bacteria cells produced through consumption
5.2 Mass Balances 3) Reaction rates affect the size of the treatment system.
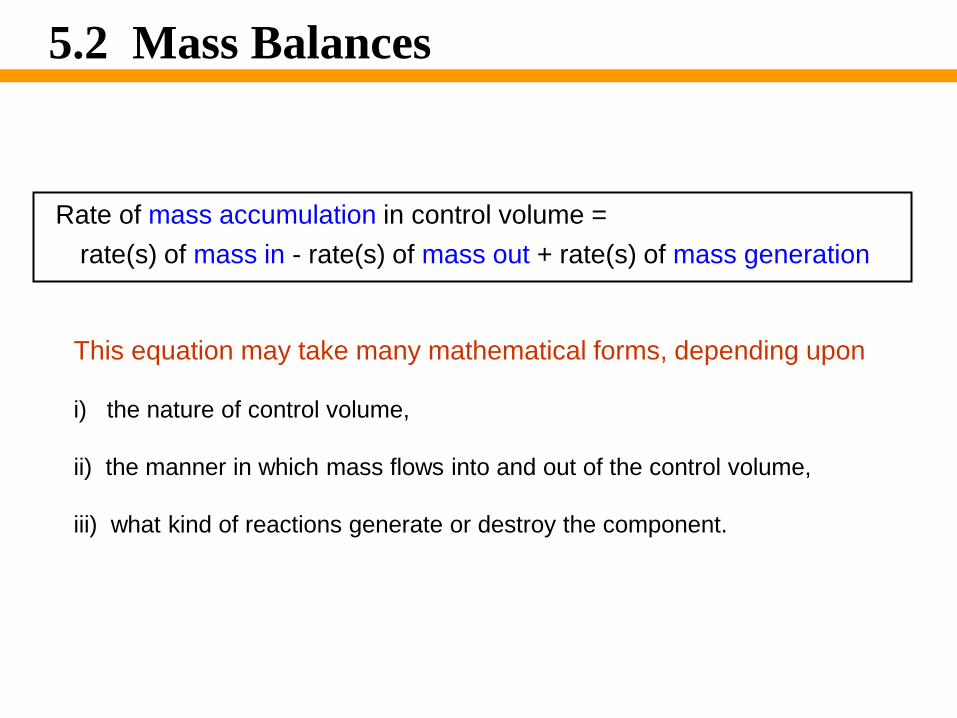
Rate of mass accumulation in control volume = rate(s) of mass in - rate(s) of mass out + rate(s) of mass generation
5.2 Mass Balances
This equation may take many mathematical forms, depending upon i) the nature of control volume,
ii) the manner in which mass flows into and out of the control volume,
iii) what kind of reactions generate or destroy the component.

5.3 A Batch Reactor
- bacteria - limiting substrate – the electron donor
- sufficiently high concentration of all other bacterial requirements such as electron acceptor and nutrients
• A batch reactor operated with mixing
- only component concentrations changing with time. The rate of mass accumulation = Vdc/dt
- constant reactor liquid volume with time
- the control volume consists of the entire reactor - uniformly distribution of components throughout the reactor
• Selection of the components
• Assumption
- at time=0, microorganisms’ concentration in the reactor = X0 (mg/l), rate limiting substrate in the reactor = S0 (mg/l)

• Typical reactors used in environmental application
Basic reactors
Biofilm reactors
5. 1 Reactor Types

Rate of mass accumulation in control volume = rate of mass in - rate of mass out + rate(s) of mass generation
=0 =0
: mass of substrate accumulating = mass of substrate generated if no substrate added or removed
[ ]4.5ˆ
ˆ
a
a
XSK
SqdtdS
XSK
SqVdtdSV
+−=
+−=
[ ]3.5utVrdtdSV =
aut XSK
Sqr+
−=ˆ
• Mass balance for substrate
5.3 A Batch Reactor
If rate of substrate utilization follows Monod kinetics

Rate of mass accumulation in control volume = rate of mass in - rate of mass out + rate(s) of mass generation
=0 =0
[ ]7.5ˆ
ˆ
aa
aa
XbSK
Sdt
dX
XbSK
SVdt
dXV
−
+=
−
+=
µ
µ
bSK
Sdt
dXX decsyn
a
a
−+
=+== µµµµ ˆ1
( ) [ ]6.5aa XV
dtdX
V µ=
• Mass balance for microorganisms
5.3 A Batch Reactor
If the organism growth rate follows Monod kinetics,

- Initial conditions
( ) ( ) [ ]8.500 00 SSXX aa ==
5.3 A Batch Reactor
[ ]4.5ˆ
aXSK
SqdtdS
+−=
[ ]7.5ˆ aa Xb
SKS
dtdX
−
+= µ
Remark: 1) Interdependence between Xa and S, both of which vary with time 2) In order to solve for Xa and S as functions of time, eq 5.4, 5.7and 5.8 should be considered simultaneously. 3) Due to the nonlinear Monod forms, the systems of eq 5.4, 5.7and 5.8 cannot be solved analytically. It must be done with a numerical solution. 4) if organism decay is considered to be negligible (b =0 in eq 5.7), an analytical solution can be obtained. This is reasonable for cases of batch growth where organism decay is small while they are growing rapidly.
Initial conditions ( ) ( ) [ ]8.500 00 SSXX aa ==
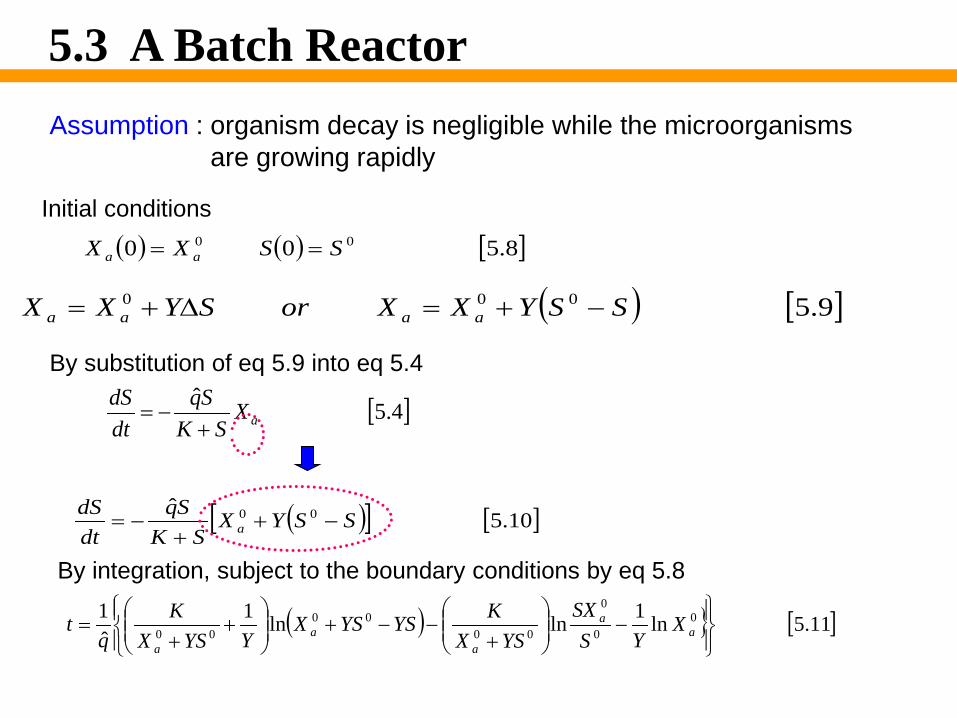
Assumption : organism decay is negligible while the microorganisms are growing rapidly
( ) [ ]9.5000 SSYXXorSYXX aaaa −+=∆+=
[ ]4.5ˆ
aXSK
SqdtdS
+−=
5.3 A Batch Reactor
By substitution of eq 5.9 into eq 5.4
( )[ ] [ ]10.5ˆ 00 SSYX
SKSq
dtdS
a −++
−=
( ) } [ ]11.5ln1lnln1ˆ1 0
0
0
0000
00
−
+
−−+
+
+= a
a
aa
a
XYS
SXYSX
KYSYSXYYSX
Kq
t
By integration, subject to the boundary conditions by eq 5.8

5.3 A Batch Reactor
( ) } [ ]11.5ln1lnln1ˆ1 0
0
0
0000
00
−
+
−−+
+
+= a
a
aa
a
XYS
SXYSX
KYSYSXYYSX
Kq
t
( ) [ ]9.500 SSYXX aa −+=
- When t is known, S can be solved by eq 5.11. And also Xa can be solved by eq 5.9

lag period
affecting bacterial growth and the substrate concentration 0aX
5.3 A Batch Reactor
- The higher the intial concentration of biomass, the lower the substrate utilization time. - For the lowest initial organism con., a lag period occurs before the onset of significant substrate utilization. -The increase of biomass between t=0 and t = t at S=0 is the same in all cases ( = ( Xa – Xa
0 ) = Y S0 = 0.6 X 100 = 60 mg / L )
( ) [ ]9.5)0100(6.0000 −+=−+= aaa XSSYXX