chapter 5 quantification of quantification health...
TRANSCRIPT

THE SUPPLY CHAIN MANAGER’S HANDBOOK A PRACTICAL GUIDE TO THE MANAGEMENT OF HEALTH COMMODITIES THE SUPPLY CHAIN MANAGER’S HANDBOOK A PRACTICAL GUIDE TO THE MANAGEMENT OF HEALTH COMMODITIES
5 5
QUANTIFICATION OF HEALTH COMMODITIES
WHAT A SUPPLY CHAIN MANAGER NEEDS TO KNOW: The supply chain manager needs to know the following about quantification, which are included in this chapter:
• The importance of accurately estimating total quantity and cost of products required for health programs and the timing of when they are needed
• The role of quantification in program planning and budgeting, resource mobilization, and procurement
• Key steps in quantification: preparation, forecasting, and supply planning.
5.1 INTRODUCTION TO QUANTIFICATION
Quantification is the process of estimating the quantities and costs of the products required for a specific health program (or service), and determining when the products should be delivered to ensure an uninterrupted supply for the program (see figure 5-1).
Quantification is a critical supply chain management activity that links information on services and commodities from the facility level with program policies and plans at the national level to estimate the quantities and costs of the commodities required for a health program. Quantification is important for informing supply chain decisions on product selection, financing, procurement, and delivery. The results of a quantification exercise help program managers:
• Identify the funding needs and gaps for procurement of the required commodities
• Leverage the sources, amounts, and timing of funding commitments to maximize the use of available resources
• Advocate for additional resources, when needed
• Develop a supply plan to coordinate procurements and shipment delivery schedules to ensure a continuous supply of commodities
The quantification process is not a one-time, annual exercise but an iterative process of reviewing and updating the quantification data and assumptions, and recalculating the total commodity requirements and costs to reflect actual service delivery and consumption as well as changes in program policies and plans. The results of a quantification exercise should be reviewed every six months, and more frequently for rapidly growing or changing programs.
The right people need to be involved in each step of the quantification process, from data collection and analysis to presenting final results to the Ministry of Health and other relevant authorities. The following personnel are usually involved in a quantification exercise: logistics managers, policymakers, program managers, technical experts, procurement officers, warehouse managers and service providers. Members of the quantification team should have the following knowledge and skills to complete a quantification exercise for health commodities:
• Expertise in the specific program area and knowledge about the commodities and how they are used
• Computer literacy and proficiency in the use of Microsoft Excel spreadsheets, or software programs to create and manage databases
Quantification is not a one-time annual exercise but an iterative process which includes reviews
and updates required year-round.
CHAPTER 5
Serving Customers
InventoryStrategy
Quantification
Warehousing & Distribution
Procurement
THE LOGISTICS CYCLE
Product Selection
Management Support Functions
System Design & Strategy
Logistics Management Information Systems (LMIS)
Performance Management
Organizational Capacity and Workforce
Financing
Risk Management
FIGURE 5-1.
THE LOGISTICS CYCLE
53 54

THE SUPPLY CHAIN MANAGER’S HANDBOOK A PRACTICAL GUIDE TO THE MANAGEMENT OF HEALTH COMMODITIES THE SUPPLY CHAIN MANAGER’S HANDBOOK A PRACTICAL GUIDE TO THE MANAGEMENT OF HEALTH COMMODITIES
• Commitment to conduct ongoing monitoring and data collecting; and update forecasting data, assumptions, and the supply planning data for the PipeLine database
• Ability to prepare and present the quantification data and methodology and the final quantification results to key stakeholders and implementers
5.2 KEY STEPS IN QUANTIFICATIONQuantification of health commodities follows a step-by-step approach. The steps, outlined in figure 5-2, include preparation, forecasting, and supply planning.
FIGURE 5-2.
STEPS IN QUANTIFICATION
TABLE 5-1.
PREPARATION PROCESSQ
uan
tific
atio
n
No
Preparation
• Describe the program
• Define scope and purpose of the quantification
• Collect required data
Forecasting
• Organize, analyze, and adjust data
• Build forecasting assumptions
• Calculate forecasted consumption for each product
• Reconcile forecasts to produce a final estimate for
each product
Supply Planning
• Organize, analyze, and adjust data
• Build supply planning assumptions
• Calculate total commodity requirements and costs
• Develop supply plan
• Compare costs to available funding
FundsSu�cient?
Yes
Yes
Procure Quantities Required
IncreaseFunding?
ResolveGap?
Yes
Mobilize Additional Resources
Adjust Supply PlanningAssumptions
STEPS IN QUANTIFICATION
No
No
Adjust ForecasingAssumptions
Pip
elin
e M
on
ito
rin
g
STEP 1: PREPARATION
PREPARATION PROCESS
Part 1 Describe the program
Part 2 Define the scope and purpose of the quantification
Part 3 Collect the required data
DESCRIBE THE PROGRAMAt this step, background information on the program should be collected, which includes a review of the program goals, strategies, priorities, and any expansion plans or change in policies that will influence uptake of services and demand for commodities. The review should also include a brief description of the service delivery model, supply chain, level of political commitment, and financial support for services and for commodities.
DEFINE THE SCOPE AND PURPOSE OF THE QUANTIFICATIONIn this stage, the following need to be defined – scope of the program (public, private and/faith based; geographical region or specific population group; funding agency or implementing partner) and list of commodities. Also identify the purpose of the quantification and how it will address the program’s needs. Lastly, define the time period for the quantification exercise which could range from two to five years. A quantification for a two-year rolling period is recommended which includes actual quantities to be procured, when they should be procured, and a shipment delivery schedule that considers procurement and supplier lead times as well as maximum-minimum stock levels.
COLLECT REQUIRED DATAThis involves collecting data for forecasting and supply planning steps. Data for forecasting include consumption data, services data on the number of health services being provided, morbidity data, demographic data, and information on current program performance, expansion
Factors that may affect demand for services and commodities include changes in policies and STGs; emergence of new products
and formulations; changes in program priorities; strategies and goals; seasonality in incidence or specific diseases/health
conditions; changes in political, legal or regulatory environment.
5 5
55 56

THE SUPPLY CHAIN MANAGER’S HANDBOOK A PRACTICAL GUIDE TO THE MANAGEMENT OF HEALTH COMMODITIES THE SUPPLY CHAIN MANAGER’S HANDBOOK A PRACTICAL GUIDE TO THE MANAGEMENT OF HEALTH COMMODITIES
plans, strategies, priorities, and program targets for each year of the quantification. Data for supply planning include national/program level stock on hand, expiration dates for products in stock, quantity on order, established shipment schedules and current shipment delivery schedule, established national/program level maximum and minimum stock levels, product information, supplier information, funding information, procurement information, and distribution information.
In addition to the above, information on programmatic, environmental, societal and behavioral factors that may influence demand for services and commodities should also be collected. The data collection activity, though initiated in the preparation step, can be continued throughout the forecasting and supply planning steps of the quantification.
To estimate the total HIV test kit requirements and costs for two government fiscal years, Malawi completed a quantification exercise. The results enabled the Ministry of Health to maintain the current volume of services being provided and it met the government’s plans for scaling up HIV testing and counseling services.
Timing and scope of the quantification exercise: The quantification exercise was coordinated to coincide with the MOH budgeting cycle and donor funding disbursement schedule. National HIV test kit requirements were to be quantified for public, private, non-governmental organizations (NGO), and mission facilities for two years.
Products to be quantified: HIV test kits - Determine, Uni-Gold, and SD Bioline simple rapid assay tests, and long ELISA test kits.
Sources of funding for HIV test kits: Government funding, Global Fund, and UNITAID
Procurement mechanism: UNICEF
Quantification team: Seven quantification team members were selected from the MOH, HIV and AIDS program management
staff, Central Medical Stores staff, NGO representatives, and external technical advisors.
Stakeholders and key informants: A broad range of stakeholders were invited to consultative meetings; one-on-one interviews were scheduled, as needed, with MOH program management staff, NGO representatives, service providers, laboratory specialists, donors, and technical and clinical experts.
Initiation of data collection activities: The following types of documents were researched, collected, and reviewed prior to undertaking any facility level, direct data collection activities - program policy and technical documents, program progress and performance reports, central-level health management information system (HMIS) and logistics management information system (LMIS) reports, including consumption and stock-on-hand data.
Number and selection of sites for data collection: A sample of 20 facilities providing HIV testing and counseling services, plus three regional medical stores, were selected for data collection.
PREPARATION FOR A NATIONAL HIV TEST KIT QUANTIFICATION PROGRAM IN MALAWI
STEP 2: FORECASTINGForecasting, the second step in the quantification process, uses the data collected during the preparation step to estimate the quantity of each product that will be dispensed or used during each year of the quantification. These quantities are the basis for calculating the total commodity requirements in the supply planning step. The forecasting step in a quantification exercise is a four-part process (see table 5-2):
During preparation for a quantification exercise, team members collect program background information and multiple types of data from various sources. The four primary types of data are consumption, services, morbidity, and demographic (see table 5-3 for examples of these data).Consumption data are historical data on the actual quantities of health commodities that have been dispensed to patients or consumed at SDPs within a specific period of time. Consumption data can be collected from a well-functioning LMIS that captures and aggregates data from SDPs. Consumption data are most useful in mature, stable programs that have full supply of products and reliable data. Other logistics data such as issues data can also be used as a proxy for consumption data; issues data are data on the number of commodities transferred from one level of the supply chain to another. Issues data should ideally
be obtained from the lowest level of issue to lessen the over or underestimation of consumption.
Services data are historical program-level or facility-level data on the number of patient visits to facilities, the number of services provided, number of disease episodes or health condition treated, or number of patients who receive a specific service or treatment within a given period.Morbidity and demographic data include total population, population growth rates, incidence and prevalence of specific disease/health conditions that may be available by population group or through surveillance or research study group and extrapolated to estimate national-level incidence or prevalence rates of specific diseases/health conditions. Demographic data include data on the number and characteristics of the population targeted for services while
TABLE 5-2.
FORECASTING PROCESS
FORECASTING PROCESS
Part 1 Organize, analyze, and adjust the data.
Part 2 Build and obtain consensus on the forecasting assumptions.
Part 3 Calculate the forecasted consumption for each product.
Part 4 Compare and reconcile results of different forecasts.
5 5
Real-life in-country examples of supply chain management in action
Fact boxes with answers to common questions
New innovations, advances, and technology in the supply chain management of health commodities
Links, references to other resources, tools, and other USAID/DELIVER PROJECT publications
Examples of how general supply chain concepts apply di�erently to specific health commodities
introduction icons
57 58

THE SUPPLY CHAIN MANAGER’S HANDBOOK A PRACTICAL GUIDE TO THE MANAGEMENT OF HEALTH COMMODITIES THE SUPPLY CHAIN MANAGER’S HANDBOOK A PRACTICAL GUIDE TO THE MANAGEMENT OF HEALTH COMMODITIES
morbidity data are estimates of the number of episodes of a specific disease or health condition that will occur in a common denominator of the population. These data can be extrapolated to define total estimated need and then refined to determine specific
targets, or percentage of total need, to be reached. Because forecasts using morbidity and demographic data tend to overestimate commodity needs, the forecast should be compared to the forecasts using consumption and service data.
TABLE 5-3. TYPES AND SOURCES OF DATA FOR FORECASTING PRODUCT CONSUMPTION
TYPE OF DATA SOURCES OF DATA CHALLENGES IN DATA QUALITY
Program background information
• Program progress and evaluation reports, policy and strategic planning documents, technical reports, and workplans that specify the timing of training and expansion of services
May be outdated and not reflect current policies, strategies, or context
Consumption
• LMIS reports, facility surveys of stock records and consumption records
• Reported quantities of products dispensed to patients/clients or quantities of products used
Data may be unavailable, outdated, incomplete, or unreliable for the past 12 months
Services
• HMIS reports, program M&E reports, facility surveys of service records, daily registers
• Reported number of services provided, e.g., number of cases of disease or health condition treated, number of HIV tests conducted, number of children immunized
Data may be unavailable, outdated, incomplete, or unreliable for the past 12 months
Morbidity
• Epidemiological surveillance data or research data on incidence and prevalence of disease or health conditions in a given population
• Expressed as a ratio or percentage of a defined population (denominator) with a specific disease or health condition (numerator)
Data from epidemiological studies may be outdated (1–2 years)
If data is specific to a particular population group, will need to extrapolate to estimate incidence or prevalence in the general population
Demographic
• Demographic Health Survey (DHS), national census data, Population Reference Bureau
• Data on population growth and trends • Data on population characteristics, e.g.,
geographical distribution, age, gender, occupation
Tends to be outdated (1–4 years old or more)
Data may not reflect the same time period and, therefore, cannot be easily aligned
Program targets
• National policy and strategic planning documents
• National annual program targets or service coverage rates set as goals for the program
Program targets may be politically motivated for advocacy purposes and not based on realistic program capacity
5 5
Photo courtesy of John Snow, Inc.
59 60

THE SUPPLY CHAIN MANAGER’S HANDBOOK A PRACTICAL GUIDE TO THE MANAGEMENT OF HEALTH COMMODITIES THE SUPPLY CHAIN MANAGER’S HANDBOOK A PRACTICAL GUIDE TO THE MANAGEMENT OF HEALTH COMMODITIES
FORECASTING PART 1: ORGANIZE, ANALYZE, AND ADJUST DATAAfter the available data has been collected, the quantification team should assess the quality of the data. The most common data quality issues are inaccurate, incomplete, or outdated data. To assess data quality, determine the facility reporting rate, stockouts, timeliness of data, and any factor that may influence future demand. The adjustment techniques described in chapter 3 can be used to address incomplete or incorrect consumption and services data. When adjusting for outdated demographic data, assumptions about trends for various variables such as population growth rate should be made to project population estimates. Be sure to document the methodology for making any data adjustments, noting any adjustments made for stockouts, for percentage of facilities reporting, or for outdated data. Table 5-4 describes an example of the assessment of data quality for a quantification.
TABLE 5-4. EXAMPLE COUNTRY DATA QUALITY ANALYSIS FOR ARV DRUG QUANTIFICATION
TYPE OF DATA DATA QUALITY OF DATA NOTES
Consumption
Quantities of ARV drugs issued to facilities over the past 12 months (e.g., 650,000 bottles of TDF/3TC/EFV)
Consumption data not available. Central-level issues data used as proxy for consumption.
Not used for the forecast because central-level data does not represent actual consumption
The program is rapidly expanding and thus historical issues data is not a true representation of future demand
Central-level stock on hand(e.g., 700,000 bottles of TDF/3TC/EFV on hand)
Facility-level stock on hand not available
Used later during the supply planning step
Services
Total number of patients on antiretroviral therapy (ART) (703,268 adults)
Facility reporting rate is 90%
Includes the cumulative number of patients that ever started ART. Does not account for any patients who discontinued treatment.
Number of patients on ART by regimen (e.g., 44,190 adults on TDF/3TC/NVP)
Collected at nine facilities and from individual partners supporting facilities
Newly revised ART patient registers collect the number of patients on ART, by regimen; but data is not being reported or aggregated at central-level
Demographic/ morbidity
Total population (40,454,000)HIV prevalence rate (5.3%)
One year old
Not used for the forecast because, given program capacity, calculated quantity would have been unrealistic
Program targets
National program targets for 2017 and 2018 (e.g., target number of ART patients for 2017 is 850,000)
Not based on existing patients or historical scale-up rates
Not used for the forecast
5 5
Photos courtesy of USAID | DELIVER Project
61 62

THE SUPPLY CHAIN MANAGER’S HANDBOOK A PRACTICAL GUIDE TO THE MANAGEMENT OF HEALTH COMMODITIES THE SUPPLY CHAIN MANAGER’S HANDBOOK A PRACTICAL GUIDE TO THE MANAGEMENT OF HEALTH COMMODITIES
FORECASTING PART 2: BUILD AND OBTAIN CONSENSUS ON FORECASTING ASSUMPTIONSAssumptions are made to adjust historical program data when it is of poor quality (incomplete, outdated, unreliable, or unavailable) and also for future program performance. Assumptions may include issues such as:
• Expected uptake in services
• Compliance with recommended treatment guidelines
• Future changes in standard treatment guidelines and/or introduction of new commodities
• Impact of changing program policies and strategies on supply and demand
• Service capacity (infrastructure, human resources availability, and capacity)
• Client awareness of and access to services
• Timing and amount of funding commitments for procurement
• Seasonality
• Geographic variations in disease incidence and prevalence
• Other factors that might affect demand
Consensus should be reached on the forecasting assumptions and a quantification
workshop is an effective forum for achieving such consensus. During a quantification workshop, sufficient time should be allocated for clarifying, agreeing upon, and documenting assumptions. The assumption-building exercise should be a consultative process involving program planners, clinical experts, pharmacists, procurement specialists, and warehouse managers. When building assumptions, the sources of information and inputs from key informants should be documented and the quantification should be revised if any of the assumptions change.
When completing a forecast based on morbidity/demographic data, a forecasting tree is useful for organizing and utilizing data and assumptions to estimate the forecast. A forecasting tree is a diagrammatic presentation of health conditions and the products required to treat one patient or episode (see figure 5-3).
During the national quantification of public sector contraceptives,the forecasting team made the following assumptions:
• The method mix for oral contraceptives was assumed to be 90% combined orals and 10% progesterone-only orals
• Use of long-term contraceptives was expected to increase due to promotion of such methods by the Ministry of Health and training of more health workers in the insertion of IUDs and implants
• As a result of the quantification:
– Consumption of pills was reduced and added to implants
– Use of lactational amenorrhea (LAM) and injectables were reduced and IUDs increased
FIGURE 5-3.
SAMPLE FORECASTING TREE FOR ZINC TABLETS FOR TREATMENT OF DIARRHEA IN CHILDREN UNDER 5 IN THE PUBLIC SECTOR (INCLUDING CHWs)
5 5
Population at risk
x estimated episodes/child/year
by age group if available
Number who seek care from public sector health facilities
Number who seek care from public sector CHWs
AssumptionsA1 Incidence of diarrhea in children under 5 (episodes/child/year)
A2 Children/care givers who seek care for diarrhea from the public sector, %
A3 Children/care givers who seek care for diarrhea from the private sector, %
A4 Children/care givers who do not seek care for diarrhea, %
A5 Children with diarrhea/care givers who will seek care from a public sector facility, %
A6 Children with diarrhea who will seek care from a public sector CHW, %
A7 Children 2–6 months with diarrhea, %
A8 Children 6–59 months with diarrhea, %
A9 No. of tablets needed for course of treatment for children 2-6 months
A10 No. of tablets needed for course of treatment for children 6-59 months
A11 Total number of tablets
SAMPLE FORECASTING TREE FOR ZINC TABLETS FOR TREATMENT OF DIARRHEA IN CHILDREN UNDER 5
In the public sector (including CHWs)
Number who seek care from public sector facilities
Number of children age 6-59 months treated
for diarrhea at public sector facilities
Number of children age 6-59 months treated for
diarrhea by CHWs
Number of children age 2-6 months treated for
diarrhea at public sector facilities
Number of children age 2-6 months treated for
diarrhea by CHWs
A5 A6
A7 A7 A8A8
Population age 0-5
A1
A2A3 A4
Estimated cases of diarrhea per year in children under 5
Est. need for facilities
+ Est. need for CHWs for both age groups
A9
A10
A11
Number of tablets of zinc needed for forecast period
Est. cases of diarrhea
x % that seek care by sector(s) of interest
or not at all
Population under 4
x % in each age group
per STGs
# seeking care within public sector
x Est. % attending health facilities or CHWs
Number who seek care from private
sector facilitiesNumber who do not
seek care
# of children age 2-6 months treated
x # of tablets per course treatment
+ # of children age 6-59 months treated
x # of tablets per course treatment
Real-life in-country examples of supply chain management in action
Fact boxes with answers to common questions
New innovations, advances, and technology in the supply chain management of health commodities
Links, references to other resources, tools, and other USAID/DELIVER PROJECT publications
Examples of how general supply chain concepts apply di�erently to specific health commodities
introduction icons
SAMPLE ASSUMPTIONS FOR A CONTRACEPTIVE QUANTIFICATION
63 64

THE SUPPLY CHAIN MANAGER’S HANDBOOK A PRACTICAL GUIDE TO THE MANAGEMENT OF HEALTH COMMODITIES THE SUPPLY CHAIN MANAGER’S HANDBOOK A PRACTICAL GUIDE TO THE MANAGEMENT OF HEALTH COMMODITIES
TABLE 5-5.
CONVERSION OF DATA INTO PRODUCT QUANTITIES
TYPE OF DATA CONVERSION FACTOR FORECASTED CONSUMPTION
Consumption Estimated quantity of product to be dispensed/used X =
Quantities of product
Services (family planning) Estimated # of visits or users X
Dispensing protocol (contraceptives)
=
Services (HIV and AIDS, TB, malaria, essential medicines, labs)
Estimated # of patients, # of episodes of disease, or health condition, # of lab tests
XSTGs, testing algorithm, lab procedure
=
Demographic (family planning) Estimated # of users X CYP factor =
Demographic/ morbidity
Estimated # of patients, # of episodes of disease or health condition, # of lab tests
XSTGs, testing algorithm, lab procedure
=
Program targets
Targeted # of users, # of patients, # of episodes of disease or health condition, # of lab tests
XCYP factor, STGs, testing algorithm, lab procedure
=
5 5
FORECASTING PART 3: CALCULATE THE FORECASTED CONSUMPTION FOR EACH PRODUCTForecasts based on consumption data and services data can be calculated using time series models that “predict” the future based on the historical data that were adjusted in the previous step. Such models can be useful when demand appears to follow repeating patterns; they are most effective when many periods of data are available and patterns are more evident. Quantification teams may believe that more recent data points are more reliable–for instance, because of LMIS improvements –or indicative of future needs. Thus, in using time series models, quantification teams need to consider the trade-offs between creating projections that emphasize more recent data point(s) versus less recent historical data. Time series approaches include:
• Trend projection. Historical consumption data and services data are analyzed for historical trends by plotting monthly, quarterly, bi-annual, or annual values on a graph. The implicit assumption is that historical trends seen in previous data will continue into the future. The growth trend functionality in MS Excel can be used to project the forecast. However, the disadvantage of this method is that it does not account for program growth that may occur in the future as a result of expansion of services. The trend analysis function in PipeLine uses the trend projection method for forecasting consumption based on historical consumption data.
• Regression methods. MS Excel functions, including Linest, can fit a line to past data in order to project future values.
• Moving average. A moving (or “rolling”) average uses a series of averages of historical data to forecast the demand for the next period–month, quarter or year. A moving average approach is used when demand is fairly constant; it mitigates the effect of random variation.
• Weighted moving average. In this approach, more value, or weight, is placed on data from more recent periods. For instance, LMIS improvements might lead the quantification team to deem more recent data more reliable or predictive of the future.
As logistics management information systems improve and produce consumption data that are closer to “real-time,” more sophisticated statistical methods may become increasingly relevant for forecasting consumption of health commodities
Exponential smoothing. This approach uses both past forecast and past actual data to project future needs in a way that reduces variability. It is in effect a way of assessing forecast error and incorporating it into the new forecast. It requires only one past period of forecast and actual data and uses a “smoothing” constant between 0 and 1 to assign weight to the past actuals and past forecast data. Exponential smoothing software can be used for forecasting, including a function in MS Excel. Types of exponential smoothing calculations include Simple Exponential Smoothing and Damped Trend.
Forecasts completed using consumption data estimate the future consumption of each product needed for quantification period based on the historical consumption and trend (in percentage
or absolute number). The historical trend can be adjusted to reflect changes in the future trends based on the assumptions made. This trend is then applied to project the future demand.
Forecasts completed using services, morbidity, demographic, or program target must be converted from number of patients, visits, and episodes treated into estimates of quantities of products consumed. The future number of patients treated, services provided, or episodes of a disease or health condition that will be treated for the period of the forecast is estimated. The estimation can be made based on the historical trends and assumptions about program plans, targets, and any changes in product selection, STGs, or other policies and strategies that are expected to affect future demand. Table 5-5 shows the conversion factors that should be applied for different types of forecasting data. The conversion requires assumptions about the application and adherence to STGs, dispensing protocols, testing algorithms or lab testing procedures.
65 66

THE SUPPLY CHAIN MANAGER’S HANDBOOK A PRACTICAL GUIDE TO THE MANAGEMENT OF HEALTH COMMODITIES THE SUPPLY CHAIN MANAGER’S HANDBOOK A PRACTICAL GUIDE TO THE MANAGEMENT OF HEALTH COMMODITIES
• Local, political, economic or programmatic events that may have an impact on consumption or service utilization such as commodity shortages or stockouts, strikes or civil unrests that may make forecasts based on consumption and service data artificially low.
Based on the above factors, either one of the forecasts can be selected as the final forecast or the forecasts can be reconciled by adjusting, weighing, or averaging the different forecast quantities. The reconciliation stage should preferably be held as part of the quantification workshop to allow a collaborative process in assessing the quality of the data and strength of the assumptions.
TABLE 5-6.
SUPPLY PLANNING PROCESS
SUPPLY PLANNING PROCESSPART 1 Organize and analyze dataPART 2 Build supply planning assumptionsPART 3 Estimate total commodity requirementsPART 4 Develop supply planPART 5 Compare costs to available funding
5 5
FORECASTING PART 4: COMPARE AND RECONCILE RESULTS OF DIFFERENT FORECASTS If availability and quality of data permits, different data types should be used to generate multiple forecasts. The forecast output from each data type should be compared to arrive at the final forecast. When reconciling the forecasts, the following factors should be assessed:
• Evaluate the quality of each data type (completeness, accuracy, timeliness, and availability)
• Reliability of intermediate variables: assess whether these variables are based on current and accurate local data. Variables include dispensing protocols, CYP conversion factors, population of program covered or reached by program, assumptions such as method mix, disease prevalence, population growth rate, adherence to STGs or testing protocols, and scale-up factor.
QUANTIMED is a Microsoft Access-based tool that facilitates the forecasting of pharmaceutical needs (medicines and health supplies) using three forecasting methods: historical consumption, morbidity (including scaling-up patterns), and proxy consumption. It can be used to determine the need for a single health facility, national public health program, or a group of geographic areas. It is designed to quantify requirements for both acute and chronic health conditions. To obtain Quantimed, email [email protected] or via http://siapsprogram.org/tools-and-guidance/quantimed/.
FORLAB is a multi-method forecasting tool that measures laboratory service delivery and supply chain performance. The tool uses data from multiple sources (demographic, usage, and tests) to compare expected demographic/morbidity estimates with actual usage and service statistics to identify gaps between patient need and existing service capacity. For more information, see Introducing ForLab, a new open-source, multi-method laboratory quantification tool (Clinton Health Access Initiative).
Real-life in-country examples of supply chain management in action
Fact boxes with answers to common questions
New innovations, advances, and technology in the supply chain management of health commodities
Links, references to other resources, tools, and other USAID/DELIVER PROJECT publications
Examples of how general supply chain concepts apply di�erently to specific health commodities
introduction icons
SOFTWARE FOR FORECASTING
At this stage of the quantification exercise, forecasting software such as Quantimed or ForLab and MS Excel can be utilized to calculate the forecast for each year of the quantification.
Photo courtesy of A. Makulec, Ethiopia
67 68
A NOTE ON SEASONALITY: Some products show clear seasonal consumption patterns. So that the supply chain can ensure product is available in accordance with seasonal needs, monthly forecast quantities that reflect this seasonality – rather than standard “average monthly consumption” figures – are required to plan shipments in the supply planning step. One option for arriving at monthly forecast consumption quantities that reflect the seasonal nature of demand is to develop a seasonality index that relates consumption for each month to a reference month based on patterns observed in historical data. This index is applied to the annual forecast quantity. Other methods that may be used to estimate forecasted consumption using data that show seasonal patterns include double and triple exponential smoothing methods.
STEP 3: SUPPLY PLANNINGThe supply planning step is used to estimate the total commodity requirements and costs for the program based on the forecast generated from the forecasting step (see table 5-6). To ensure a continuous supply of products, and maintain stock levels between the established maximum and minimum levels, developing the supply plan entails coordinating the timing of funding disbursements from multiple funding sources with procurement lead times and supplier delivery schedules. The output of the supply planning phase, the supply/procurement plan, should be for twelve to eighteen months and updated on a rolling basis.

THE SUPPLY CHAIN MANAGER’S HANDBOOK A PRACTICAL GUIDE TO THE MANAGEMENT OF HEALTH COMMODITIES THE SUPPLY CHAIN MANAGER’S HANDBOOK A PRACTICAL GUIDE TO THE MANAGEMENT OF HEALTH COMMODITIES
SUPPLY PLANNING PART 2: BUILD SUPPLY PLANNING ASSUMPTIONSAs with the forecasting step, assumptions need to be made in the supply planning step to account for missing or low quality data, and consensus should be reached with various stakeholders at the quantification workshop. It is important to clearly and specifically document the sources of information and the key informant inputs on the assumptions. Examples of supply planning assumptions include:
• Timing of available funds
• Amount of available funds
• Lead times for each supplier
• Arrival dates of supplies
• Minimum and maximum stock levels for each level in the system
• Timing for mopping up existing stock of a commodity that is being phased out
SUPPLY PLANNING PART 3: ESTIMATE TOTAL COMMODITY REQUIREMENTS AND COSTSEstimating the total commodity requirements consists of determining the quantity of each product needed to meet the forecasted consumption and ensure that the in-country supply pipeline has adequate stock levels to maintain a continuous supply to SDPs.
This is determined by calculating the additional quantities of product needed to cover procurement and supplier lead times, and to maintain stock levels between the minimum and maximum. Then, subtract the quantity of each product already in stock in-country, any quantities that have been ordered but have not been received (quantity on order), and any quantities of products that will expire before they are used.
PipeLine is a software tool that is recommended to facilitate the estimation of total commodity requirements and costs as well as preparation of a supply plan. It is specifically designed to address the unique considerations of supply planning and pipeline monitoring in resource-poor and limited settings.
SUPPLY PLANNING PART 4: DEVELOP THE SUPPLY PLAN Developing a supply plan, including the shipment quantities and delivery schedules, will ensure a continuous supply of products to the country.
Developing the supply plan helps program managers to:
• Enter and track forecasted and actual consumption data
• Identify funders and funding commitments, by product
• Identify suppliers for each product
5 5
TABLE 5-7.
SUPPLY PLANNING DATA REQUIREMENTS
SUPPLY PLANNING PART 1 ORGANIZE AND ANALYZE DATAData for the supply planning step are different from the data for the forecasting step. Supply planning data can be collected during the preparation phase and during the quantification process —for example, during individual meetings or consultative workshops with stakeholders. Table 5-7 describes the specific data required for the supply planning step.
PRODUCT
• Patent, registration, or prequalification status, if applicable• Verification that products to be quantified are on the national
essential medicines list• Specific product characteristics (formulations, dosages, shelf life,
temperature requirements, number of units per pack size, unit cost, and others)
SUPPLIER
• Supplier prices• Supplier packaging information• Supplier lead times• Current shipping and handling costs, by supplier• Current shipment intervals and delivery schedules, by supplier
FUNDING
• Funding sources for procurement of commodities• Amount and timing of funding commitments by funder• Funding disbursement schedules to determine when funding will be
available for procurement from each source
PROCUREMENT
• All procurement mechanisms (e.g., competitive international bidding/tendering, donor procurement, local procurement) for all products to be quantified
• Procurement lead time for each procurement mechanism
DISTRIBUTION• Customs clearance fees• In-country storage and distribution costs (if applicable)• In-country sampling/quality testing costs
STOCK STATUS
• Current stock on hand of each product at program level (preferably from physical inventory)
• Program maximum and minimum stock levels• Product consumption and expiration dates to assess months of stock
on hand for each product• Quantity on order for each product and expected delivery date
69 70
THE SUPPLY CHAIN MANAGER’S HANDBOOK A PRACTICAL GUIDE TO THE MANAGEMENT OF HEALTH COMMODITIES THE SUPPLY CHAIN MANAGER’S HANDBOOK A PRACTICAL GUIDE TO THE MANAGEMENT OF HEALTH COMMODITIES
5.3 USING THE QUANTIFICATION RESULTS
The quantification team should formally present the results of the quantification to stakeholders. This will enable the team to receive feedback about the assumptions made during the forecasting and the supply planning steps, as well as the data sources used. Presenting the results of the quantification is an opportunity for the team to describe the national stock status of commodities to all stakeholders and to outline the supply chain actions required to maintain adequate stock levels.
The presentation to stakeholders should explain each step of the quantification, including:
• Scope, purpose, and timeframe of the quantification
• Review of all data sources used, and challenges in data collection
• Summary of the major forecasting assumptions and description of the data sources used to make those assumptions
• Summary of supply planning assumptions (especially if assumptions about amounts and timing of funding commitments will affect procurement and delivery)
• Total quantities of each product required for each year of the quantification
• National stock status (MOS on hand) for each product (PipeLine stock status graphs are very useful to convey this information); highlight products that are about to expire, stocked out, or overstocked, based on stock status analysis (MOS on hand)
• Summary of shipments, by supplier
• Total funding gaps for the next 24 months
• Specific actions required to address any critical stock imbalances and to maintain stocks at the established level
These quantification outputs enable program managers, funders, buyers, and suppliers to plan and schedule their inputs, to coordinate available resources, and to advocate for additional resources when funding gaps are identified. Presentation of the quantification results to policymakers, program managers, procurement managers, funders, and commodity managers facilitates the following activities:
• Program planning and budgeting
• Mobilization and allocation of funding for commodity procurement
• Coordination of multiple sources of funding for procurement
• Procurement decision making about which products to procure, how much to procure, and when to procure
• Adjustment of timing of procurements and shipment delivery schedules to ensure continuous supply while avoiding stockouts and overstocking
5 5
• Coordinate timing of funding commitments and procurements
• Schedule shipments according to procurement lead times, supplier lead times, and stock levels in-country to maintain stock levels between the established maximum and minimum levels and avoid stockouts and/or losses due to overstocking and expiry
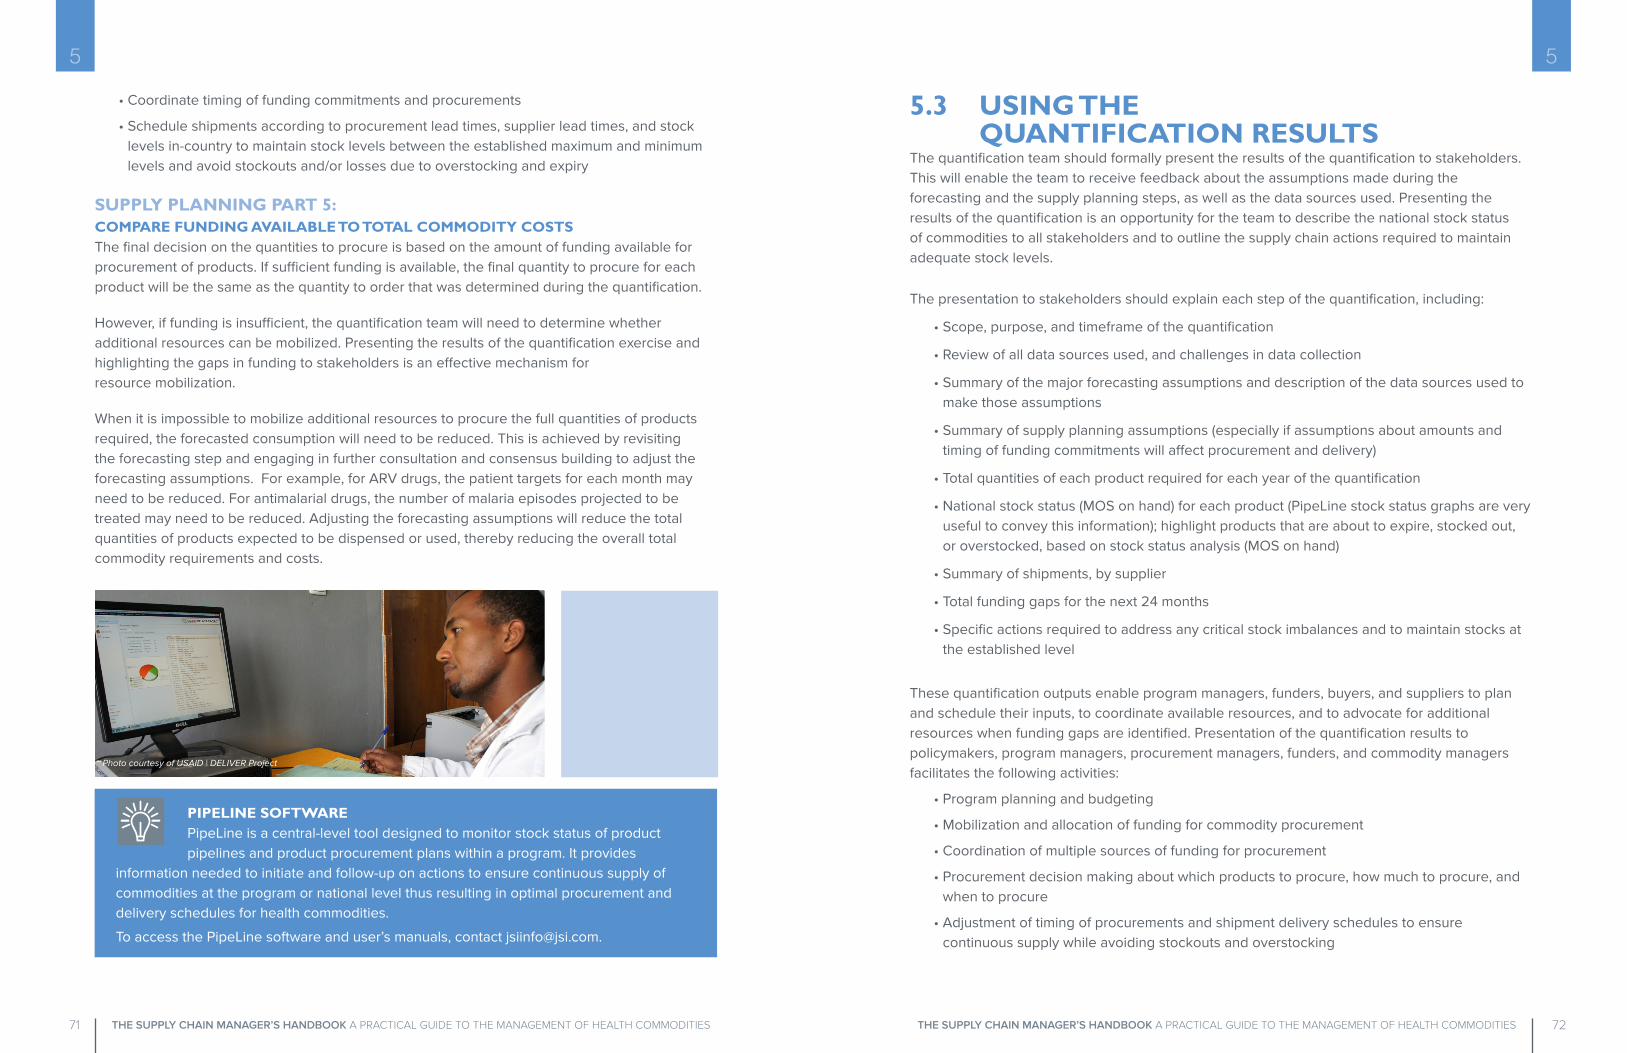
PIPELINE SOFTWAREPipeLine is a central-level tool designed to monitor stock status of product pipelines and product procurement plans within a program. It provides
information needed to initiate and follow-up on actions to ensure continuous supply of commodities at the program or national level thus resulting in optimal procurement and delivery schedules for health commodities.
To access the PipeLine software and user’s manuals, contact [email protected].
SUPPLY PLANNING PART 5: COMPARE FUNDING AVAILABLE TO TOTAL COMMODITY COSTSThe final decision on the quantities to procure is based on the amount of funding available for procurement of products. If sufficient funding is available, the final quantity to procure for each product will be the same as the quantity to order that was determined during the quantification.
However, if funding is insufficient, the quantification team will need to determine whether additional resources can be mobilized. Presenting the results of the quantification exercise and highlighting the gaps in funding to stakeholders is an effective mechanism for resource mobilization.
When it is impossible to mobilize additional resources to procure the full quantities of products required, the forecasted consumption will need to be reduced. This is achieved by revisiting the forecasting step and engaging in further consultation and consensus building to adjust the forecasting assumptions. For example, for ARV drugs, the patient targets for each month may need to be reduced. For antimalarial drugs, the number of malaria episodes projected to be treated may need to be reduced. Adjusting the forecasting assumptions will reduce the total quantities of products expected to be dispensed or used, thereby reducing the overall total commodity requirements and costs.
Real-life in-country examples of supply chain management in action
Fact boxes with answers to common questions
New innovations, advances, and technology in the supply chain management of health commodities
Links, references to other resources, tools, and other USAID/DELIVER PROJECT publications
Examples of how general supply chain concepts apply di�erently to specific health commodities
introduction icons
Photo courtesy of USAID | DELIVER Project
71 72

THE SUPPLY CHAIN MANAGER’S HANDBOOK A PRACTICAL GUIDE TO THE MANAGEMENT OF HEALTH COMMODITIES THE SUPPLY CHAIN MANAGER’S HANDBOOK A PRACTICAL GUIDE TO THE MANAGEMENT OF HEALTH COMMODITIES
• Updating the stock on hand for each product
• Assessing national stock status for each product, based on product consumption and stock levels
• Reviewing and updating shipment delivery schedules to ensure continuous supply and maintain desired stock levels
• Updating the amounts and timing of funding commitments
• Recalculating the commodity requirements and costs over time
• Estimating and updating funding needs and gaps for procurement.
5 5
As noted in this chapter, quantification is a continuous process that includes regular monitoring and updating. Not only is it important to assess the quality of the data and the assumptions used to calculate the initial forecast, but, to assess the accuracy of the forecast, the actual quantities consumed should be compared with the forecasted quantities.
Because forecasting for public health products is more art than science, actual consumption almost always differs from the forecast consumption. By calculating the mean absolute percent error (MAPE)—the absolute difference between the forecasted and actual values, expressed as a percentage of the actual values—the percentage error can be assessed. If error rates are high, the assumptions should be revisited and data quality improved so that the revised forecast better reflects actual consumption. Over time and with regular monitoring, the forecast accuracy and overall quality of quantifications can improve.
Real-life in-country examples of supply chain management in action
Fact boxes with answers to common questions
New innovations, advances, and technology in the supply chain management of health commodities
Links, references to other resources, tools, and other USAID/DELIVER PROJECT publications
Examples of how general supply chain concepts apply di�erently to specific health commodities
introduction icons
MONITORING FORECAST ACCURACY
In addition, conducting a quantification exercise typically reveals supply chain management needs, including strengthening data collection and reporting systems and inventory management procedures, and improving dissemination and training of providers in standard treatment guidelines. The quantification exercise is also an opportunity to identify and advocate for other supply chain improvements.
This is a continuous process that needs to be completed at regular intervals. Pipeline monitoring involves updating data in PipeLine (or other supply planning tool) as new information becomes available, and making informed decisions based on the update. Data to be updated include consumption (actual versus forecast), changes in delivery dates or quantities, and stock on hand. If actual consumption differs greatly from the previously estimated consumption, it may be prudent to update the forecast and supply plan accordingly. Based on the updates, changes to anticipated stock levels may require rescheduling or canceling existing shipments, or creating new shipments. If orders have already been placed, the supply chain manager coordinates with the supplier regarding rescheduling or canceling an existing order. Routine pipeline monitoring helps ensure the continuous supply of commodities and prevent understocking or overstocking.
5.4 REVIEWING AND UPDATING THE QUANTIFICATION
Quantification does not end when the final product quantities and costs have been calculated. It is an ongoing process of monitoring, reviewing, and updating the forecasting data and assumptions; and recalculating the total commodity requirements and costs, as needed. For the quantification exercise to be useful and effective, the forecasting assumptions and the supply plan should be reviewed at least every six months; and more frequently for rapidly growing or changing programs. The forecast and supply plan should be updated whenever new data are available - whether this is the status of a shipment, updated consumption data, or updated stock on hand data. Ideally, the same core team of people who conducted the initial quantification should conduct routine updates. Many country programs have instituted a quarterly quantification review process for specific commodity categories such as ARVs. Ongoing pipeline and supply plan monitoring and updating of the quantification is critical to keep program managers, donors, and other stakeholders informed on the availability of drugs; is required for timely decision-making about product selection, financing, and delivery of commodities.
Reviewing and updating the quantification includes the following activities:
• Updating the actual consumption for each product, and comparing the actual consumption against the forecast consumption to determine the forecast accuracy
• Reviewing and updating the forecasting data and assumptions
• Calculating or recalculating the forecasted consumption using Quantimed, Excel spreadsheets, or other software
Photo courtesy of IAPHL
PIPELINE MONITORING
73 74