chapter 5: multidimensional well-being in contemporary … · in contemporary europe: an analysis...
TRANSCRIPT
104
LUCA CRIVELLI, SARA DELLA BELLA AND MARIO LUCCHINI
Chapter 5
MULTIDIMENSIONAL WELL-BEING IN CONTEMPORARY EUROPE: AN ANALYSIS OF THE USE OF A SELF-ORGANIZING MAP APPLIED TO SHARE DATA.
Luca Crivelli, Department of Business Economics, Health and Social Care (DEASS), University of Applied Sciences and Arts of Southern Switzerland (SUPSI) and Swiss School of Public Health (SSPH+). E-mail: [email protected]
Sara Della Bella, Institute for Public Communication (ICP), Università della Svizzera italiana (Switzerland) and DEASS SUPSI (Switzerland). E-mail: [email protected]
Mario Lucchini, Department of Sociology, University of Milano-Bicocca (Italy) and DEASS SUPSI (Switzerland). E-mail: [email protected]

W O R L D H A P P I N E S S R E P O R T 2 0 1 6 | S P E C I A L R O M E E D I T I O N
105
Introduction
After years during which researchers from different fields were mainly focused on the nega-tive aspects of human psychology (e.g. depres-sion and mental disorders), psychologists and scholars of others social science disciplines (like economics and sociology) have increasingly been looking at ways of measuring happiness and other positive emotions. This trend reflects the importance that modern societies attribute to individuals’ subjective well-being (SWB).1
Today, social scientists widely agree in defining happiness (or subjective well-being, which we consider synonymous) as a broad and multidi-mensional construct. Although happiness has been defined in different ways,2 all definitions identify two basic components to this concept: a hedonic and a eudaimonic one.
These two components are not, of course, completely independent—for instance, subjec-tive evaluations are strongly influenced by emotional experiences—but they need to be distinguished both empirically and conceptual-ly.3 Indeed, these two dimensions are the result of different processes: affective reactions are often responses to immediate situations and tend to be of short duration; life-satisfaction ratings are likely to reflect a long-term perspec-tive.4 Moreover, while a person’s evaluation of her or his life satisfaction tends to reflect con-scious values and goals in life, emotional reac-tions are affected to a greater extent by uncon-scious motives and bodily states.
Following Aristotle, the eudaimonic dimension of happiness is conceptualized as primarily cognitive, and understood to consist of elements such as life satisfaction, meaning and purpose in life, goal attainment, self-determination and personal growth, but also commitment to shared goals and values.5
Carol Ryff, for example, developed a eudaimonic model of psychological well-being (PWB) that includes six fundamental components: self-ac-ceptance, personal growth, purpose in life, environmental mastery, autonomy, and positive relations with others.6 Ryan and Deci7 developed a simplified version of the PWB model which they called self-determination theory (SDT). SDT distinguishes between three psychological needs—autonomy, competence, and related-ness—which, if they remain unmet, will have a detrimental impact on SWB. The PWB approach differs from SDT in that it treats autonomy, competence, and relatedness as indicators of well-being; in STD they are instruments through which to obtain well-being.
As observed by Boniwell,8 the eudaimonic dimension of well-being risks becoming an excessively extended concept into which is dumped everything that does not fit the plea-sure dimension. For example, it has been referred to as “personal expressiveness,”9 and a “flow state” or “optimal experience,” i.e., a state of complete absorption in intrinsically reward-ing activities that challenge our abilities without exceeding them.10
Both positive and negative affects have been identified11 as belonging to the hedonic dimension. Positive affects include joy, contentment, pride, and hope, while negative affects include emotions such as sadness, anger, anxiety, and guilt.
Both types of affects are necessary and fulfill important functions.12 Interestingly, positive and negative affects are not simply antonyms. Although some studies have reported a strong inverse correlation between positive and negative affects, many others have shown that they can, to some extent, be considered inde-pendent constructs13 and related to other variables in different ways, such that they seem to be produced by different processes and biological systems.14
106
The existence of two distinct affect systems (a positive and a negative one) is supported by the evidence that positive emotions tend to co-occur with negative emotions.15
Moreover, several studies have clarified that posi-tive and negative affects reflect the operation of two broad, evolutionarily adaptive motivational systems: a behavioral activation system, which directs organisms towards situations and experi-ences that might yield pleasure, and a behavioral inhibition system that inhibits behavior that might have undesirable consequences.16
Overall, neurophysiologic studies have shown that no single neural system is able to activate both positive and negative affects. Rather, there are complex and emotion-specific neural systems. Indeed, whereas positive affects are systematically associated with the level of resting activity in the left prefrontal area, negative ones are systemati-cally associated with right frontal activation.17
In the “broaden and build” theory developed by Barbara Fredrickson,18 positive emotions are conceptualized not only as enjoyable and ephemeral feelings, as moments in which people are not plagued by negative affects, but also as a means through which to broaden people’s attention and thinking, increase their psychological resilience, and build intellectual and social resources. Positive emotions do not simply operate in the immediate present but also have a long-term impact, enhancing human flourishing and favoring healthy longevity.19
Hence, although positive and negative affects are not completely independent of each other, researchers tend to agree on the usefulness of keeping them separate. As such, happiness can actually be considered to be comprised of three distinct components. Diener and colleagues, for example, have defined subjective well-being as consisting of three interrelated factors: cogni-tion, positive affects, and negative affects.20
Diener and colleagues’ definition has been supported by several empirical studies. Ar-thaud-Day and colleagues,21 for instance, show that the three-factors structure (cognition, positive affects, and negative affects) best fits the data, and that the three elements are discrimi-nately valid.
Studies in the field of depression have docu-mented the existence of two factors underlying the basic emotions: depression, tearfulness, and wishing to die are included in the first, referred to as the “depressed affect factor” while loss of interest, poor concentration, and lack of enjoy-ment are included in the second, the “motiva-tion factor.”22
Despite researchers’ increasing theoretical awareness that multidimensionality is implicit in the concept of SWB, in practice, most existing studies seem to adopt a one-dimensional under-standing of happiness. This can be seen in their use of single-item measures, or of cognitive and affective scales interchangeably, as if they were equivalent proxies for overall SWB.23
Indeed over the past 30 years, researchers have created several scales aimed at capturing the cognitive dimension of happiness, such as the Life-3 Delighted-Terrible Scale,24 the Well-Being Index,25 and the Satisfaction with Life Scale,26 as well as scales designed to measure affect, such as the Affectometer,27 the Affect Balance Scale,28 the Positive and Negative Affect Schedule (PANAS),29 the Scale of Positive and Negative Experience (SPANE),30 the Beck Depression Inventory,31 and the EURO-D scale of depression severity.32
What is astonishing is the lack of measuring tools able to capture the multidimensionality of happiness adequately; indeed, it is a common practice to use individual indicators of SWB or synthetic indicators obtained by subtracting the negative-feelings score from the positive-feel-ings score.33

W O R L D H A P P I N E S S R E P O R T 2 0 1 6 | S P E C I A L R O M E E D I T I O N
107
The aim of this paper is to apply a sophisticated “clustering-and-projection” technique—the Self Organizing Map (SOM)—to a large number of indicators of well-being, to capture the struc-ture of happiness. More specifically, it can help us understand the extent to which different indicators/dimensions of SWB (the eudaimon-ic and hedonic dimensions, cognitive and affective measures, positive and negative affects) are independent rather than totally or partially overlapping.
Although global self-reported measures of happiness possess adequate psychometric properties, good internal consistency, and appro-priate sensitivity to changes in life circumstanc-es,34 in this paper we start from the hypothesis that such measures might not be the best choice when it comes to measuring SBW in its complex-ity because they illegitimately collapse into one dimension different components that only partially overlap. The SOM approach can help us shed light on some ambiguities in the umbrella construct of life satisfaction, and to crystallize the relationship between this concept and other important components of a good life such as positive and negative emotions, health, social relationships, meaning, and social activities.
Method
The aim of this study is to apply an unsuper-vised artificial neural network—the Self Orga-nizing Map (SOM)—to capture and visualize the hidden structure of highly multidimensional data. The SOM is a vector quantization algo-rithm widely used in a variety of domains35 which performs a mapping from a high-dimen-sional input space of data onto a two-dimension-al output space. The latter is a rectangular grid of nodes, each of which is equipped with a weight vector or a model m
i in the data space.
The training algorithm exploits competitive learning such that in the first step each observa-tion or input vector is assigned to its best match-ing unit (BMU), i.e. the unit with the weight
vector mi(t) that matches best with the input vector x(t) in some metric and according to the following equation:
c = argmini {||x(t) – mi(t)||}
Subsequently, in the second step, the weight vectors of the BMU and its closest neighbors in the map are updated such that the modified weight vectors will match better with the input vectors. The equation ruling the updating phase is the following:
mi(t+1) = m
i(t) + k(t)ℎ
ci(t)[x(t) –m
i(t)]
where c is the index of the winner node, k(t) is a monotonically decreasing scalar function of t and ℎ
ci(t) is the neighborhood function, usually
taken to be Gaussian around the BMU, as follows:
ℎci(t) = exp (–
(i – ic)2
22(t) )
where is the width of the neighborhood and ic
is the index of the BMU, the node whose weight vector matches the input vector best. The size of the neighborhood is gradually decreased during the training process until only the weights of the BMU are updated.
Data and Variables
We use data from the fourth wave (2010–11) of the Survey of Health, Aging, and Retirement in Europe (SHARE).36 The conventional approach would be to rank the countries with respect to the average Cantril ladder score using, for in-stance, life satisfaction or quality of life. Using the life-satisfaction indicator reported in SHARE, we obtain the results highlighted in Table 1 and learn that, within the sample of European coun-tries, Denmark, Sweden, and Switzerland had the highest average scores in 2010, whereas Hungary and Estonia had the lowest.

108
Table 1: Ranking of life satisfaction 2010-11 (among people aged 50 or older).
Life Satisfaction
Country mean sd
Denmark 8.621 1.325
Sweden 8.425 1.456
Switzerland 8.402 1.365
Austria 8.304 1.646
Netherlands 8.100 1.036
Germany 7.789 1.723
Belgium 7.780 1.404
Italy 7.680 1.674
Spain 7.633 1.800
Poland 7.453 1.904
Slovenia 7.453 1.750
Czech Republic 7.420 1.929
France 7.315 1.686
Portugal 7.084 2.013
Hungary 6.737 2.147
Estonia 6.736 2.039
The availability in this wave of a wide range of indicators covering different aspects of subjec-tive well-being has made it possible to adopt a truly multidimensional approach. The choice of indicators and dimensions is largely driven by the theories previously reviewed and by the availability of indicators in SHARE. More specifically, we selected 38 items (see Table 2) covering seven different dimensions of well-be-ing, listed below:
1. Positive affects and evaluations: Hope for the future, enjoyment from activity, how often one looks back on one’s life with a sense of happiness, looking forward to each day, feeling that life has meaning and is full of opportunities, feeling full of energy, feeling positive about the future.
2. Negative affects and orientations: Depres-sion, emotional disorders, wishing one were dead, guilt or self-blame, tearfulness,
fear of the worst, fear of dying.
3. Somatic disorders: Trouble sleeping, trembling hands, diminution in appetite, faintness, feeling irritable or nervous.
4. Vitality/apathy/flow state: Interest in things, too little energy to do things/fatigue, difficulty in concentrating on entertainment and on reading.
5. Self-efficacy/pathway thinking/agency thinking: Ability to do the things one wants to do, age prevents one from doing those things, what happens to one is out of one’s control, feeling left out of things, family responsibilities prevent one from doing what one wants to do, shortage of money stops one from doing the things one wants to do.
6. Physical and mental health: Self-assessed health, chronic conditions, impediments to daily activities.
7. Evaluations of life domains: Life in general, satisfaction with the activities engaged in, satisfaction with relationships.
The dimensions of positive and negative affects of somatic disorders and vitality/apathy are more strongly driven by hedonic experience, whereas the indicators included in the dimen-sions of self-efficacy and evaluations of life domains have a stronger eudaimonic orienta-tion, although it is reasonable to think that all indicators show a certain degree of semantic overlap with both forms of SWB.
As our aim is to measure well-being in multidi-mensional terms, we have also included some important indicators of health and social capital that, depending on the theoretical approach adopted, can be considered either, on the one hand, aspects or, on the other, causes or effects of well-being.
W O R L D H A P P I N E S S R E P O R T 2 0 1 6 | S P E C I A L R O M E E D I T I O N
109
Finally, dimensions 1 and 5 express two different forms of optimism. Following Scheier and Carver,37 dimension 1 refers to so-called disposi-tional optimism; that is, the mental disposition based on which the person tends to expect posi-tive outcomes and recognize the available oppor-tunities. Dimension 5 refers to attributional optimism, which implies being self-confident and the creator and protagonist of one’s own destiny.
It is important to underline that the chosen items refer to different time frames: the past, the present and the future. Moreover, whereas some items reflect a relatively short time perspective (last week), others concern much longer time frames (for instance, one’s entire life).
All the items have been rescaled such that they have the same direction and are interpretable as indicators of well-being (in other words, higher values of an indicator entail higher levels of well-being).
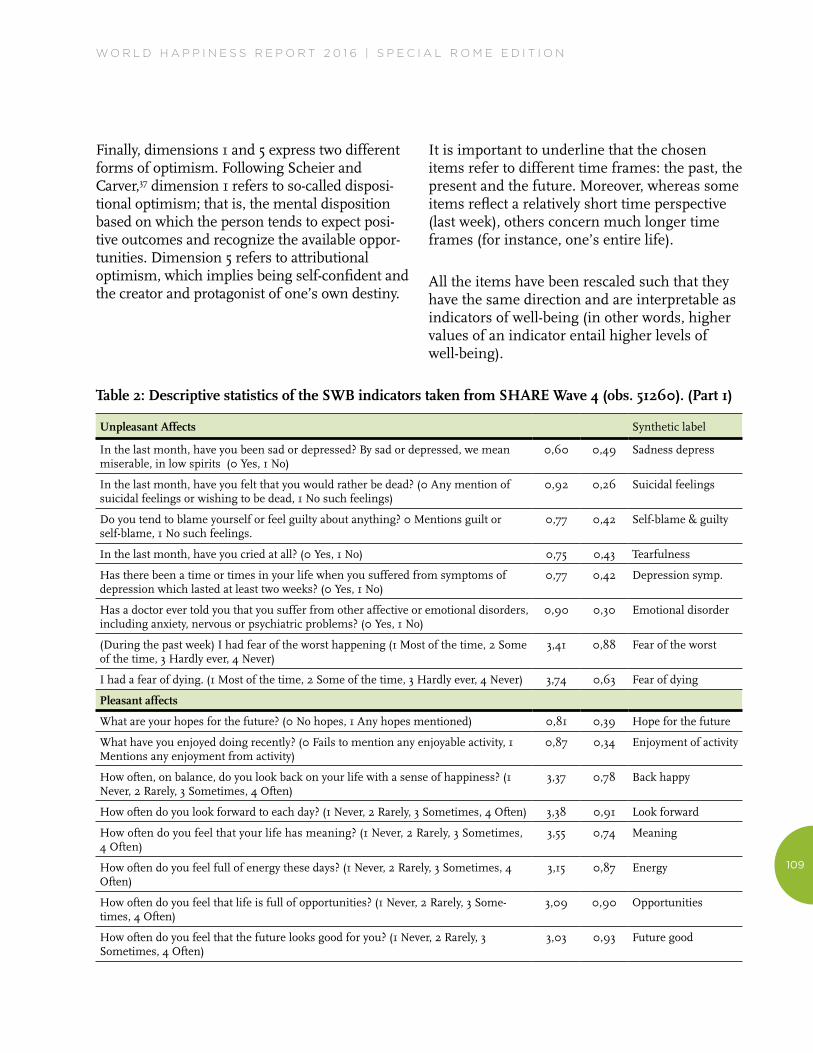
Table 2: Descriptive statistics of the SWB indicators taken from SHARE Wave 4 (obs. 51260). (Part 1)
Unpleasant Affects Synthetic label
In the last month, have you been sad or depressed? By sad or depressed, we mean miserable, in low spirits (0 Yes, 1 No)
0,60 0,49 Sadness depress
In the last month, have you felt that you would rather be dead? (0 Any mention of suicidal feelings or wishing to be dead, 1 No such feelings)
0,92 0,26 Suicidal feelings
Do you tend to blame yourself or feel guilty about anything? 0 Mentions guilt or self-blame, 1 No such feelings.
0,77 0,42 Self-blame & guilty
In the last month, have you cried at all? (0 Yes, 1 No) 0,75 0,43 Tearfulness
Has there been a time or times in your life when you suffered from symptoms of depression which lasted at least two weeks? (0 Yes, 1 No)
0,77 0,42 Depression symp.
Has a doctor ever told you that you suffer from other affective or emotional disorders, including anxiety, nervous or psychiatric problems? (0 Yes, 1 No)
0,90 0,30 Emotional disorder
(During the past week) I had fear of the worst happening (1 Most of the time, 2 Some of the time, 3 Hardly ever, 4 Never)
3,41 0,88 Fear of the worst
I had a fear of dying. (1 Most of the time, 2 Some of the time, 3 Hardly ever, 4 Never) 3,74 0,63 Fear of dying
Pleasant affects
What are your hopes for the future? (0 No hopes, 1 Any hopes mentioned) 0,81 0,39 Hope for the future
What have you enjoyed doing recently? (0 Fails to mention any enjoyable activity, 1 Mentions any enjoyment from activity)
0,87 0,34 Enjoyment of activity
How often, on balance, do you look back on your life with a sense of happiness? (1 Never, 2 Rarely, 3 Sometimes, 4 Often)
3,37 0,78 Back happy
How often do you look forward to each day? (1 Never, 2 Rarely, 3 Sometimes, 4 Often) 3,38 0,91 Look forward
How often do you feel that your life has meaning? (1 Never, 2 Rarely, 3 Sometimes, 4 Often)
3,55 0,74 Meaning
How often do you feel full of energy these days? (1 Never, 2 Rarely, 3 Sometimes, 4 Often)
3,15 0,87 Energy
How often do you feel that life is full of opportunities? (1 Never, 2 Rarely, 3 Some-times, 4 Often)
3,09 0,90 Opportunities
How often do you feel that the future looks good for you? (1 Never, 2 Rarely, 3 Sometimes, 4 Often)
3,03 0,93 Future good

110
Somatic disorders
Have you had trouble sleeping recently? (0 Trouble with sleep or recent change in pattern, 1 No trouble sleeping)
0,65 0,48 Trouble sleeping
Have you been irritable recently? (0 Yes, 1 No) 0,70 0,46 Irritability
What has your appetite been like? (0 Diminution in desire for food, 1 No diminution in desire for food)
0,92 0,27 Appetite
I was nervous. (1 Most of the time, 2 Some of the time, 3 Hardly ever, 4 Never) 2,97 0,99 Nervous
I felt my hands trembling. (1 Most of the time, 2 Some of the time, 3 Hardly ever, 4 Never) 3,66 0,75 Hand trembling
I felt faint. (1 Most of the time, 2 Some of the time, 3 Hardly ever, 4 Never) 3,51 0,84 Feeling faint
Vitality/Apathy
In the last month, what has your interest in things been? (0 Less interest than usual mentioned, 1 No mention of loss of interest)
0,92 0,27 Interest in things
In the last month, have you had too little energy to do the things you wanted to do? (0 Yes, 1 No)
0,63 0,48 Little energy/fatigue
Can you concentrate on a television, film or radio programme? (0 Difficulty in concentrating on entertainment, 1 No such difficulty mentioned)
0,88 0,32 Concentrating entert
Can you concentrate on something you read? (0 Difficulty in concentrating on reading, 1 No such difficulty mention)
0,87 0,34 Concentrating read
Physical and mental health
Would you say your health is? (1 Poor, 2 Fair, 3 Good, 4 Very good, 5 Excellent) 2,80 1,07 Self-assessed health
Some people suffer from chronic or long-term health problems (0 Yes, 1 No) 0,48 0,50 Long illness
For the past six months at least, to what extent have you been limited because of a health problem in activities people usually do? (1 Severely limited, 2 Limited but not severely, 3 Not limited)
2,37 0,73 Limitation activity
Self-efficacy
How often do you think your age prevents you from doing the things you would like to do? (1 Often, 2 Sometimes, 3 Rarely, 4 Never)
2,66 1,06 Age prevent
How often do you feel that what happens to you is out of your control? (1 Often, 2 Sometimes, 3 Rarely, 4 Never)
2,90 0,99 Out of control
How often do you feel left out of things? (1 Often, 2 Sometimes, 3 Rarely, 4 Never) 3,15 0,96 Feel left out
How often do you think that you can do the things that you want to do? (1 Never, 2 Rarely, 3 Sometimes, 4 Often)
3,22 0,91 Do things
How often do you think that family responsibilities prevent you from doing what you want to do? (1 Often, 2 Sometimes, 3 Rarely, 4 Never)
3,15 0,97 Fam resp prev
How often do you think that a shortage of money stops you from doing the things you want to do? (1 Often, 2 Sometimes, 3 Rarely, 4 Never)
2,56 1,13 Money stops
Evacuation of life domains
(On a scale from 0 to 10, where 0 means completely dissatisfied and 10 means completely satisfied) how satisfied are you with the activities that you engaged in (or not)? (i.e. Done voluntary work, attended an educational course, gone to a sports, social or other kind of club, taken part in activities of a religious organization, of a political or community-related organization, read books or newspapers, did games such as crossword puzzles or Sudoku, played cards or games such as chess.
7,88 2,00 Sat activities
Overall, how satisfied are you with the relationship that you have with the person we have just talked about? (Scale from 0 to 10, where 0 means completely dissatisfied and 10 means completely satisfied)
8,92 1,27 Networksat
How satisfied are you with your life? (Scale from 0 to 10, where 0 means completely dissatisfied and 10 means completely satisfied)
7,62 1,81 Satisfaction with life
Table 2: Descriptive statistics of the SWB indicators taken from SHARE Wave 4 (obs. 51260). (Part 2)
W O R L D H A P P I N E S S R E P O R T 2 0 1 6 | S P E C I A L R O M E E D I T I O N
111
Results
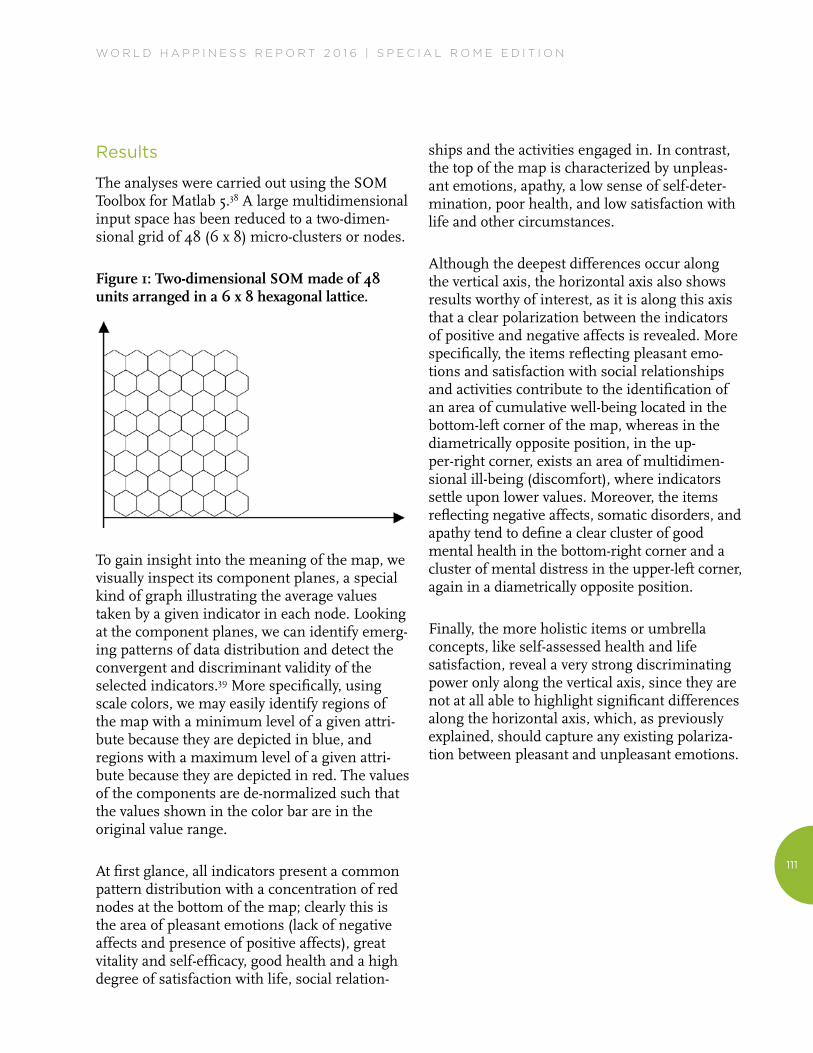
The analyses were carried out using the SOM Toolbox for Matlab 5.38 A large multidimensional input space has been reduced to a two-dimen-sional grid of 48 (6 x 8) micro-clusters or nodes.
Figure 1: Two-dimensional SOM made of 48 units arranged in a 6 x 8 hexagonal lattice.
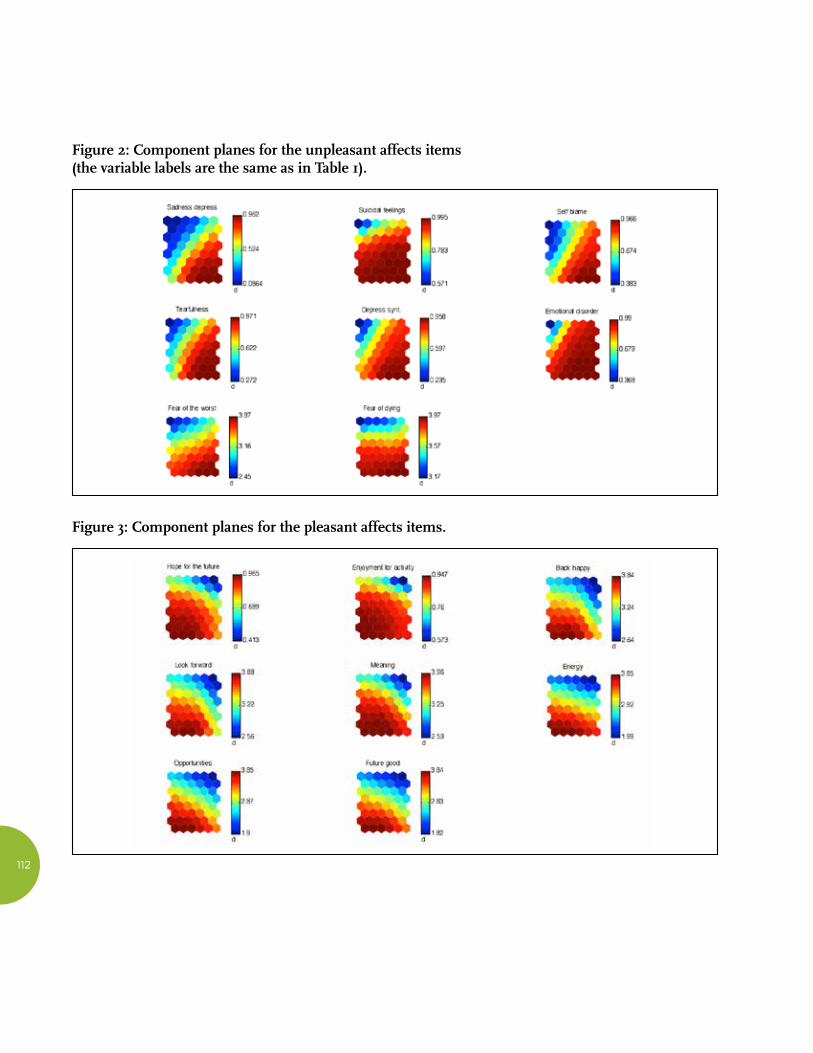
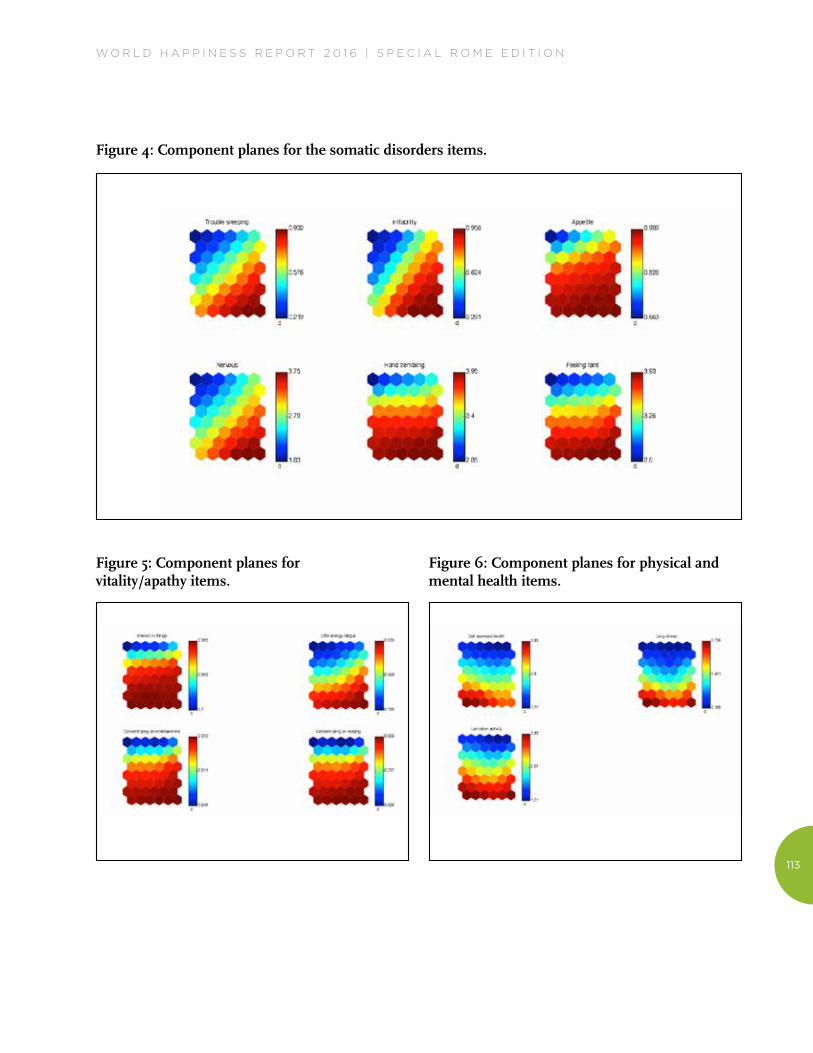
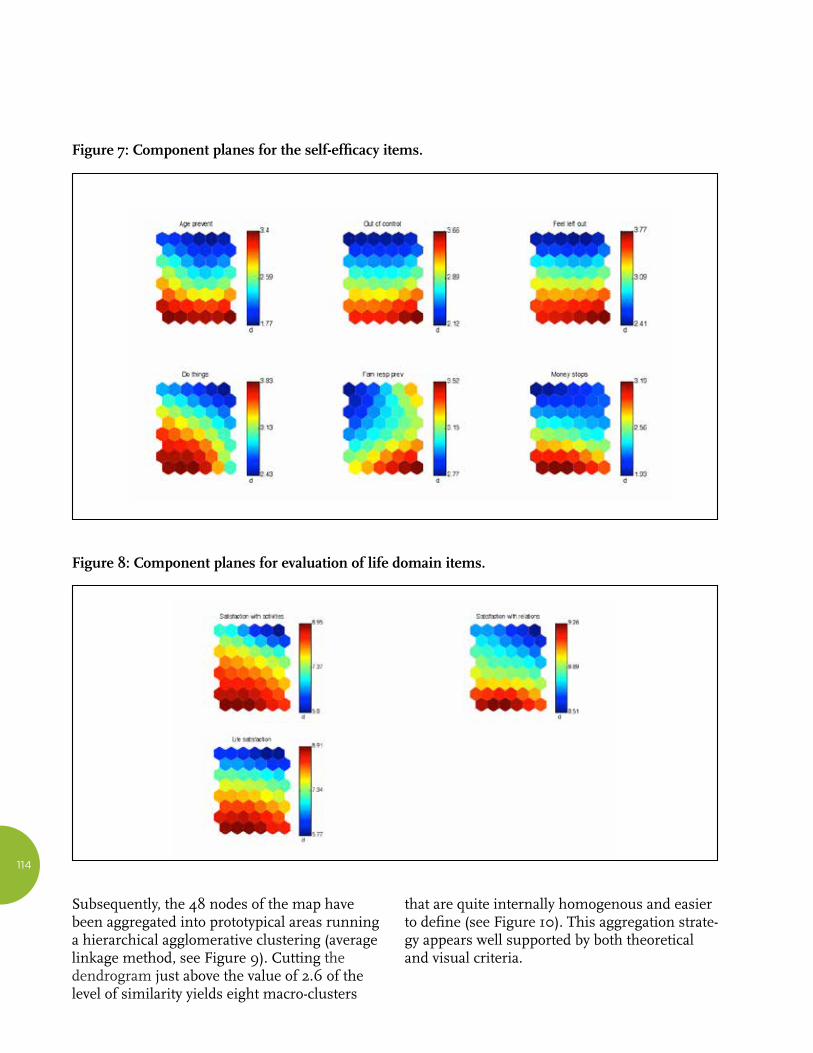
To gain insight into the meaning of the map, we visually inspect its component planes, a special kind of graph illustrating the average values taken by a given indicator in each node. Looking at the component planes, we can identify emerg-ing patterns of data distribution and detect the convergent and discriminant validity of the selected indicators.39 More specifically, using scale colors, we may easily identify regions of the map with a minimum level of a given attri-bute because they are depicted in blue, and regions with a maximum level of a given attri-bute because they are depicted in red. The values of the components are de-normalized such that the values shown in the color bar are in the original value range.
At first glance, all indicators present a common pattern distribution with a concentration of red nodes at the bottom of the map; clearly this is the area of pleasant emotions (lack of negative affects and presence of positive affects), great vitality and self-efficacy, good health and a high degree of satisfaction with life, social relation-
ships and the activities engaged in. In contrast, the top of the map is characterized by unpleas-ant emotions, apathy, a low sense of self-deter-mination, poor health, and low satisfaction with life and other circumstances.
Although the deepest differences occur along the vertical axis, the horizontal axis also shows results worthy of interest, as it is along this axis that a clear polarization between the indicators of positive and negative affects is revealed. More specifically, the items reflecting pleasant emo-tions and satisfaction with social relationships and activities contribute to the identification of an area of cumulative well-being located in the bottom-left corner of the map, whereas in the diametrically opposite position, in the up-per-right corner, exists an area of multidimen-sional ill-being (discomfort), where indicators settle upon lower values. Moreover, the items reflecting negative affects, somatic disorders, and apathy tend to define a clear cluster of good mental health in the bottom-right corner and a cluster of mental distress in the upper-left corner, again in a diametrically opposite position.
Finally, the more holistic items or umbrella concepts, like self-assessed health and life satisfaction, reveal a very strong discriminating power only along the vertical axis, since they are not at all able to highlight significant differences along the horizontal axis, which, as previously explained, should capture any existing polariza-tion between pleasant and unpleasant emotions.
112
Figure 2: Component planes for the unpleasant affects items (the variable labels are the same as in Table 1).
Figure 3: Component planes for the pleasant affects items.
W O R L D H A P P I N E S S R E P O R T 2 0 1 6 | S P E C I A L R O M E E D I T I O N
113
Figure 4: Component planes for the somatic disorders items.
Figure 5: Component planes for vitality/apathy items.
Figure 6: Component planes for physical and mental health items.
114
Figure 7: Component planes for the self-efficacy items.
Figure 8: Component planes for evaluation of life domain items.
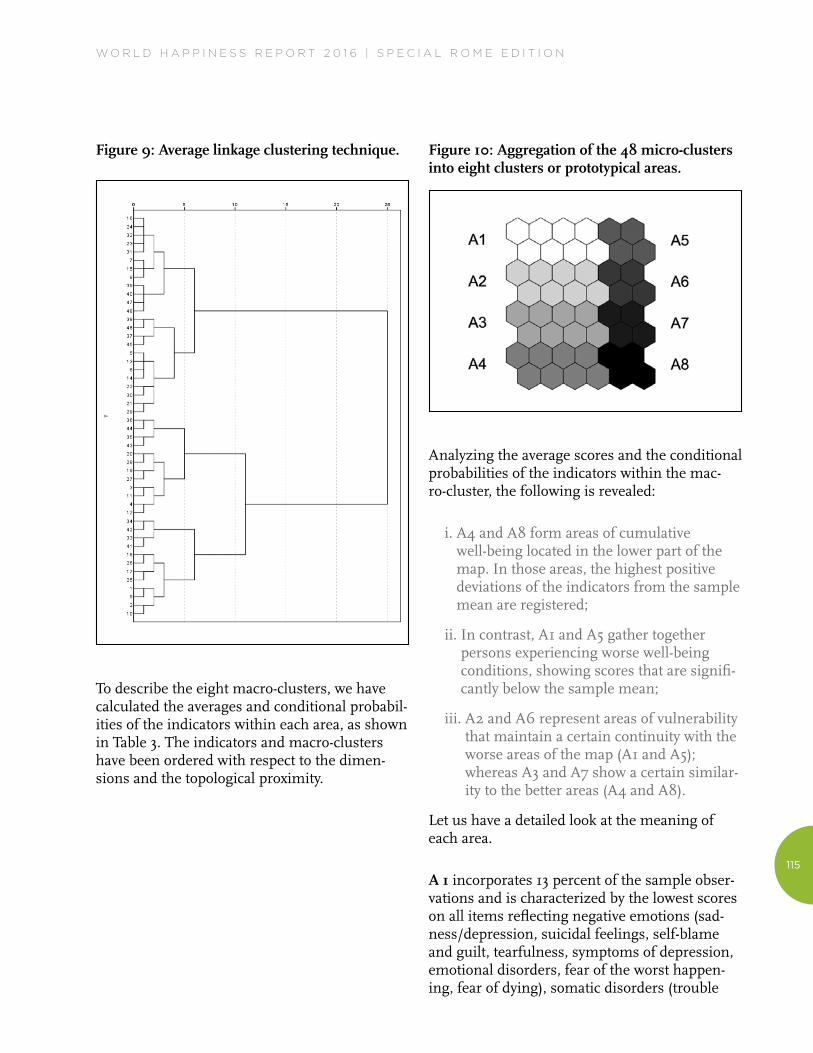
Subsequently, the 48 nodes of the map have been aggregated into prototypical areas running a hierarchical agglomerative clustering (average linkage method, see Figure 9). Cutting the dendrogram just above the value of 2.6 of the level of similarity yields eight macro-clusters
that are quite internally homogenous and easier to define (see Figure 10). This aggregation strate-gy appears well supported by both theoretical and visual criteria.
W O R L D H A P P I N E S S R E P O R T 2 0 1 6 | S P E C I A L R O M E E D I T I O N
115
Figure 9: Average linkage clustering technique.
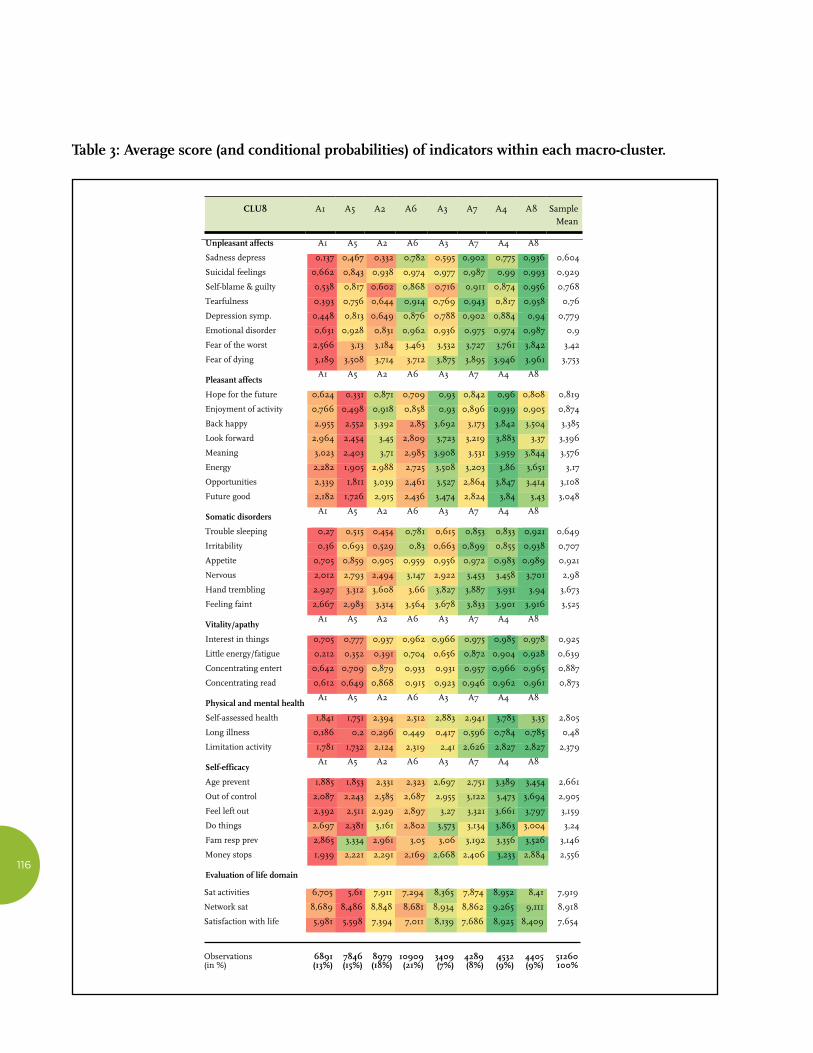
To describe the eight macro-clusters, we have calculated the averages and conditional probabil-ities of the indicators within each area, as shown in Table 3. The indicators and macro-clusters have been ordered with respect to the dimen-sions and the topological proximity.
Figure 10: Aggregation of the 48 micro-clusters into eight clusters or prototypical areas.
Analyzing the average scores and the conditional probabilities of the indicators within the mac-ro-cluster, the following is revealed:
i. A4 and A8 form areas of cumulative well-being located in the lower part of the map. In those areas, the highest positive deviations of the indicators from the sample mean are registered;
ii. In contrast, A1 and A5 gather together persons experiencing worse well-being conditions, showing scores that are signifi-cantly below the sample mean;
iii. A2 and A6 represent areas of vulnerability that maintain a certain continuity with the worse areas of the map (A1 and A5); whereas A3 and A7 show a certain similar-ity to the better areas (A4 and A8).
Let us have a detailed look at the meaning of each area.
A 1 incorporates 13 percent of the sample obser-vations and is characterized by the lowest scores on all items reflecting negative emotions (sad-ness/depression, suicidal feelings, self-blame and guilt, tearfulness, symptoms of depression, emotional disorders, fear of the worst happen-ing, fear of dying), somatic disorders (trouble
116
Table 3: Average score (and conditional probabilities) of indicators within each macro-cluster.
Sat activities 6,705 5,61 7,911 7,294 8,365 7,874 8,952 8,41 7,919
Network sat 8,689 8,486 8,848 8,681 8,934 8,862 9,265 9,111 8,918
Satisfaction with life 5,981 5,598 7,394 7,011 8,139 7,686 8,925 8,409 7,654
Observations 6891 7846 8979 10909 3409 4289 4532 4405 51260 (in %) (13%) (15%) (18%) (21%) (7%) (8%) (9%) (9%) 100%
Table 4: Distribution of the different forms of multidimensional well-being in European countries c1 c2 c3 c4 c5 c6 c7 c8 Denmark 5,56 8,85 21 50,12 1,45 2,81 4,5 5,71 Sweden 4,6 13,64 24,19 33,11 3,14 5,11 8,98 7,24 Switzerland 5,03 11,32 23,42 45,26 0,95 2,18 4,11 7,73 Austria 8,77 12,89 15,97 35,79 3,8 4,27 7,06 11,45 Netherlands 5,38 12,29 25,51 38,73 1,37 3,09 5,54 8,08 Germany 10,46 18,86 21,78 23,13 4,63 4,91 8,4 7,83 Belgium 13,76 17,62 19,91 20,99 3,9 8,24 8,28 7,29 Italy 15,06 14,11 12,81 8,01 8,55 13,35 14,52 13,6 Spain 19,82 11,96 12,57 13,28 8,44 8,89 13,76 11,28 Poland 20,55 17,16 16,63 12,07 11,09 9,78 6,59 6,13 Slovenia 9,03 13,32 19,37 20,65 5,49 6,51 9,32 16,3 Czech Republic 17,63 18,05 13,34 10,5 6,37 14,13 11,93 8,04
France 13,15 18,32 23,28 21,04 4,52 5,77 7,3 6,62 Portugal 26,02 13,92 6,51 2,58 14,73 18,66 10,32 7,26 Hungary 21,51 16,24 12,71 10,16 12,6 10,09 9,6 7,09 Estonia 15,84 18,85 15,12 8,95 14,15 11,83 8,93 6,33 Total 13,44 15,31 17,52 21,28 6,65 8,37 8,84 8,59 Table 5: Multinomial logit regression: Estimation results (n. id=47913) c1 c2 c3 c5 c6 c7 c8 Age (centred at 65 years) 0,016*** 0,018** 0,012*** 0,049*** 0,026*** 0,016*** 0,004 (0,00) (0,00) (0,00) (0,00) (0,00) (0,00) (0,00) Age squared (divided by 100)
0,063*** 0,045** 0,024 0,113*** 0,057** 0,062*** 0,058***
(0,02) (0,01) (0,01) (0,02) (0,02) (0,02) (0,02) Female 0,330*** 0,307*** 0,129*** -0,545*** -0,564*** -0,509*** -0,562*** (0,04) (0,04) (0,03) (0,05) (0,05) (0,04) (0,04) Never married (cat.ref.) Married and living together with spouse
-0,356*** -0,185* -0,074 -0,824*** -0,450*** -0,438*** -0,070
(0,09) (0,08) (0,08) (0,10) (0,09) (0,09) (0,09) Living separated from spouse/divorced
0,222* 0,028 0,038 -0,311** -0,187 -0,064 0,018
(0,10) (0,09) (0,09) (0,12) (0,11) (0,10) (0,11) Widowed -0,152 -0,201* -0,143 -0,551*** -0,441*** -0,443*** -0,112 (0,10) (0,09) (0,09) (0,11) (0,11) (0,11) (0,11) Household size 0,107*** 0,102*** 0,074*** 0,124*** 0,119*** 0,101*** 0,018 (0,02) (0,02) (0,02) (0,03) (0,02) (0,02) (0,02) Number of children -0,019 -0,012 0,013 -0,069*** -0,052** -0,057*** -0,068*** (0,01) (0,01) (0,01) (0,02) (0,02) (0,02) (0,02) Years of education -0,113*** -0,044*** -0,019*** -0,133*** -0,083*** -0,046*** -0,026*** (0,00) (0,00) (0,00) (0,01) (0,01) (0,01) (0,00)
Sample CLU8 A1 A5 A2 A6 A3 A7 A4 A8
mean
Unpleasant affects A1 A5 A2 A6 A3 A7 A4 A8
Sadness depress 0,137 0,467 0,332 0,782 0,595 0,902 0,775 0,936 0,604
Suicidal feelings 0,662 0,843 0,938 0,974 0,977 0,987 0,99 0,993 0,929
Self-blame & guilty 0,538 0,817 0,602 0,868 0,716 0,911 0,874 0,956 0,768
Tearfulness 0,393 0,756 0,644 0,914 0,769 0,943 0,817 0,958 0,76
Depression symp. 0,448 0,813 0,649 0,876 0,788 0,902 0,884 0,94 0,779
Emotional disorder 0,631 0,928 0,831 0,962 0,936 0,975 0,974 0,987 0,9
Fear of the worst 2,566 3,13 3,184 3,463 3,532 3,727 3,761 3,842 3,42
Fear of dying 3,189 3,508 3,714 3,712 3,875 3,895 3,946 3,961 3,753
Pleasant affects A1 A5 A2 A6 A3 A7 A4 A8
Hope for the future 0,624 0,331 0,871 0,709 0,93 0,842 0,96 0,808 0,819
Enjoyment of activity 0,766 0,498 0,918 0,858 0,93 0,896 0,939 0,905 0,874
Back happy 2,955 2,552 3,392 2,85 3,692 3,173 3,842 3,504 3,385
Look forward 2,964 2,454 3,45 2,809 3,723 3,219 3,883 3,37 3,396
Meaning 3,023 2,403 3,71 2,985 3,908 3,531 3,959 3,844 3,576
Energy 2,282 1,905 2,988 2,725 3,508 3,203 3,86 3,651 3,17
Opportunities 2,339 1,811 3,039 2,461 3,527 2,864 3,847 3,414 3,108
Future good 2,182 1,726 2,915 2,436 3,474 2,824 3,84 3,43 3,048
Somatic disorders A1 A5 A2 A6 A3 A7 A4 A8
Trouble sleeping 0,27 0,515 0,454 0,781 0,615 0,853 0,833 0,921 0,649
Irritability 0,36 0,693 0,529 0,83 0,663 0,899 0,855 0,938 0,707
Appetite 0,705 0,859 0,905 0,959 0,956 0,972 0,983 0,989 0,921
Nervous 2,012 2,793 2,494 3,147 2,922 3,453 3,458 3,701 2,98
Hand trembling 2,927 3,312 3,608 3,66 3,827 3,887 3,931 3,94 3,673
Feeling faint 2,667 2,983 3,314 3,564 3,678 3,833 3,901 3,916 3,525
Vitality/apathy A1 A5 A2 A6 A3 A7 A4 A8
Interest in things 0,705 0,777 0,937 0,962 0,966 0,975 0,985 0,978 0,925
Little energy/fatigue 0,212 0,352 0,391 0,704 0,656 0,872 0,904 0,928 0,639
Concentrating entert 0,642 0,709 0,879 0,933 0,931 0,957 0,966 0,965 0,887
Concentrating read 0,612 0,649 0,868 0,915 0,923 0,946 0,962 0,961 0,873
Physical and mental health A1 A5 A2 A6 A3 A7 A4 A8
Self-assessed health 1,841 1,751 2,394 2,512 2,883 2,941 3,783 3,35 2,805
Long illness 0,186 0,2 0,296 0,449 0,417 0,596 0,784 0,785 0,48
Limitation activity 1,781 1,732 2,124 2,319 2,41 2,626 2,827 2,827 2,379
Self-efficacy A1 A5 A2 A6 A3 A7 A4 A8
Age prevent 1,885 1,853 2,331 2,323 2,697 2,751 3,389 3,454 2,661
Out of control 2,087 2,243 2,585 2,687 2,955 3,122 3,473 3,694 2,905
Feel left out 2,392 2,511 2,929 2,897 3,27 3,321 3,661 3,797 3,159
Do things 2,697 2,381 3,161 2,802 3,573 3,134 3,863 3,004 3,24
Fam resp prev 2,865 3,334 2,961 3,05 3,06 3,192 3,356 3,526 3,146
Money stops 1,939 2,221 2,291 2,169 2,668 2,406 3,233 2,884 2,556
Evaluation of life domain
CLU8 A1 A5 A2 A6 A3 A7 A4 A8 Sample Mean
W O R L D H A P P I N E S S R E P O R T 2 0 1 6 | S P E C I A L R O M E E D I T I O N
117
sleeping, irritability, reduced appetite, nervous-ness, trembling hands, feeling faint) and apathy (low interest in things, too little energy to do things, difficulty in concentrating on entertain-ment and reading).
The health conditions (self-assessed health, long illness, and limited activity) and the feelings of self-efficacy (age prevents one from doing things, what happens to one is out of one’s control, feeling left out of things, family respon-sibilities prevent one from doing what one wants to do, shortage of money stops one from doing the things one wants to do) are very poor.
The indicators of positive emotions/evaluations (hopes for the future, enjoyable activities, satis-faction with life, looking back on one’s life with a sense of happiness, looking forward to each day, feeling that life has meaning and is full of opportunities, feeling full of energy, feeling that the future looks good) and of satisfaction with some important aspects of life (with the activi-ties engaged in, with relationships) are below the sample mean but higher than in A5.
A5, located in the left-upper part of the map, incorporates 7 percent of observations and is characterized by the lowest scores for both positive emotions (hopes for the future, enjoy-able activities, satisfaction with life, looking back on one’s life with a sense of happiness, looking forward to each day, feeling that life has mean-ing and is full of opportunities, feeling full of energy, feeling that the future looks good) and satisfaction with social relationships and activi-ties in which one is engaged.
Even the indicators of somatic disorders and some items of negative emotions (sadness, suicidal feelings, fear of the worst, fear of dying) show negative deviations from the sample mean, but without reaching the same intensity as in A1.
The scores for health indicators, life satisfaction, apathy/vitality and self-efficacy (with only one
exception: family responsibilities prevent one from doing what one wants to do) are very similar to those of cluster 1.
A4, which incorporates 21 percent of observa-tions, seems specular to A5 and can be defined as the macro-cluster of cumulative well-being. This area is associated with higher values in the indicators of positive emotions and satisfaction with life, activities engaged in and relationships. The better the health condition, the higher the sense of self-efficacy and vitality. Protection from negative emotions and somatic disorders is significant, although without reaching A8 levels.
If A4 seems specular to A5, A8 appears symmet-ric to A1. It incorporates 9 percent of the sample and is characterized by higher values with respect to the lack of negative emotions and somatic disorders.
People belonging to this cluster show a profile similar to that of A4 in health, vitality and self-efficacy. With regard to the positive-emo-tions dimension in only some indicators, howev-er, (happiness with regard to the past, meaning, energy, opportunities and future good), import-ant positive gaps are registered. Satisfaction with life, activities in which one is engaged, and relationships is also high, though without reaching the intensity of A4.
A2 groups 15 percent of the observations, and it expresses a pattern of vulnerability to negative emotions, somatic disorders, bad health and low self-efficacy, but without reaching the gravity of cluster 1. The scores regarding positive emo-tions, apathy/vitality, and satisfaction with activities and relationships roughly follow the sample mean.
A3, which consists of 18 percent of the observa-tions, shows some similarities to area 4, as we can see in it some positive gaps, although of minor intensity, with reference to positive emotions and satisfaction with life, activities
CLU8 A1 A5 A2 A6 A3 A7 A4 A8 Sample Mean
118
engaged in, and social relationships. The items regarding other dimensions roughly follow the average profile.
A6 incorporates 8 percent of observations and, being topologically close to cluster 5, shares some aspects with it, but without equaling their gravity. In more detail, people belonging to this cluster are less likely to express positive emo-tions, and have a low level of self-efficacy and a high level of psychophysical weakness. Their levels of satisfaction regarding life, activities, and relationships are also below the average.
A7, finally, includes 9 percent of observations and presents some similarities to A8. People belonging to this group have an appropriate degree of protection from negative emotions and somatic disorders, and above-average health and vitality. With regard to the other dimensions, particularly relevant gaps are not registered. Satisfaction with life follows the sample mean almost perfectly.
In summary, the multidimensional area of data is representable along two axes. The vertical axis catches the intensity of SWB. While the horizon-tal axis is less relevant, it usefully breaks up the polarization between pleasant and unpleasant emotions. The dendrogram reveals a clear logic behind the node conglomerates on the map. Node aggregations situated along the horizontal axis correspond to low levels of dissimilarity. These aggregations catch the polarization between the lack (or presence) of pleasant emotions and the presence (or lack) of unpleas-ant emotions, whereas we can see only a high level of dissimilarity between aggregations of areas and zones located along the vertical axis. That is also proved by the fact that the main dividing line is between the nodes situated in the upper area (1, 5, 2 and 6) and the lower area (3, 7, 4 and 8).
Although the horizontal axis is certainly less relevant than the vertical one, the results of our map seem to confirm what several authors have hypothesized: that positive and negative emo-tions/orientations cannot be reduced to a single dimension, but are instead polarized within two different factors that are only partially correlat-ed.40 In other words, unpleasant and pleasant emotions represent different and complementa-ry contributions to well-being that enrich the interpretation of forms of unhappiness and ill-being, exclusively based on the presence of depression, anxiety, and unpleasant emotions.41
Another important result is the behavior of some indicators, such as the ability to concen-trate on entertainment and reading, self-as-sessed health, suffering from chronic problems, physical limitation in daily activities, and satis-faction with life. These indicators represent broader constructs that are cognitive rather than emotional and do not seem to be revealed very much, if at all, along the horizontal axis, where-as they are revealed clearly along the vertical axis. It follows that such holistic indicators are not useful for revealing whether ill-being can be attributed to negative emotions or to a lack of positive emotions.
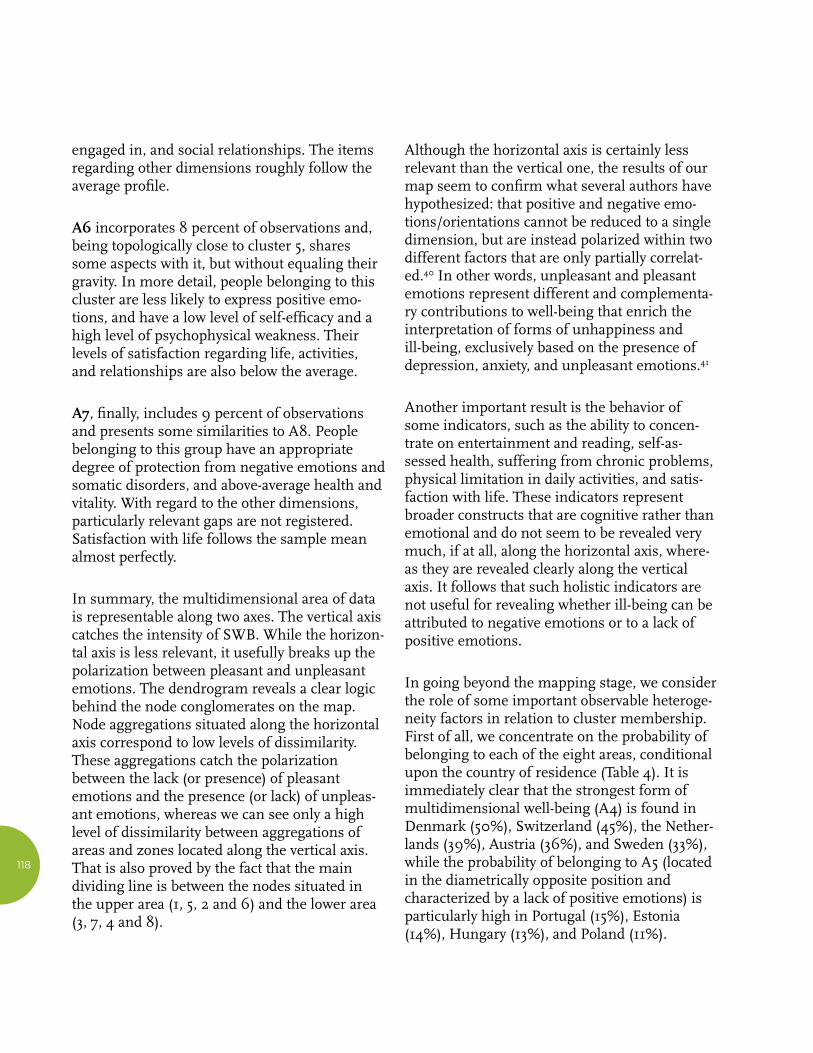
In going beyond the mapping stage, we consider the role of some important observable heteroge-neity factors in relation to cluster membership. First of all, we concentrate on the probability of belonging to each of the eight areas, conditional upon the country of residence (Table 4). It is immediately clear that the strongest form of multidimensional well-being (A4) is found in Denmark (50%), Switzerland (45%), the Nether-lands (39%), Austria (36%), and Sweden (33%), while the probability of belonging to A5 (located in the diametrically opposite position and characterized by a lack of positive emotions) is particularly high in Portugal (15%), Estonia (14%), Hungary (13%), and Poland (11%).
W O R L D H A P P I N E S S R E P O R T 2 0 1 6 | S P E C I A L R O M E E D I T I O N
119
The probability of belonging to A8, which indicates the highest protection from unpleasant affects, is higher in Slovenia (16%), Italy (14%), Spain (11%), and Austria (11%), while severe mental distress, represented by A1, seems quite widespread in Portugal (26%), Hungary (21%), Poland (21%), and Spain (20%).
There is a higher probability for individuals in Italy and Spain to belong to A7, which rep-resents moderate well-being, whereas individu-
als in Germany, Estonia, France, the Czech Republic, and Belgium have a high probability of belonging to A2, which has a less-intense degree of unpleasant emotions than A1.
Finally, A3, which captures a condition of mod-erate multidimensional well-being, is wide-spread in the Netherlands, Sweden, Switzerland, and France; while a moderate lack of positive emotions seems to mark Portugal (18.6%), the Czech Republic (14%), and Italy (13%).
Table 4: Distribution of the different forms of multidimensional well-being in European countries.
c1 c2 c3 c4 c5 c6 c7 c8
Denmark 5,56 8,85 21 50,12 1,45 2,81 4,5 5,71
Sweden 4,6 13,64 24,19 33,11 3,14 5,11 8,98 7,24
Switzerland 5,03 11,32 23,42 45,26 0,95 2,18 4,11 7,73
Austria 8,77 12,89 15,97 35,79 3,8 4,27 7,06 11,45
Netherlands 5,38 12,29 25,51 38,73 1,37 3,09 5,54 8,08
Germany 10,46 18,86 21,78 23,13 4,63 4,91 8,4 7,83
Belgium 13,76 17,62 19,91 20,99 3,9 8,24 8,28 7,29
Italy 15,06 14,11 12,81 8,01 8,55 13,35 14,52 13,6
Spain 19,82 11,96 12,57 13,28 8,44 8,89 13,76 11,28
Poland 20,55 17,16 16,63 12,07 11,09 9,78 6,59 6,13
Slovenia 9,03 13,32 19,37 20,65 5,49 6,51 9,32 16,3
Czech Republic 17,63 18,05 13,34 10,5 6,37 14,13 11,93 8,04
France 13,15 18,32 23,28 21,04 4,52 5,77 7,3 6,62
Portugal 26,02 13,92 6,51 2,58 14,73 18,66 10,32 7,26
Hungary 21,51 16,24 12,71 10,16 12,6 10,09 9,6 7,09
Estonia 15,84 18,85 15,12 8,95 14,15 11,83 8,93 6,33
Total 13,44 15,31 17,52 21,28 6,65 8,37 8,84 8,59
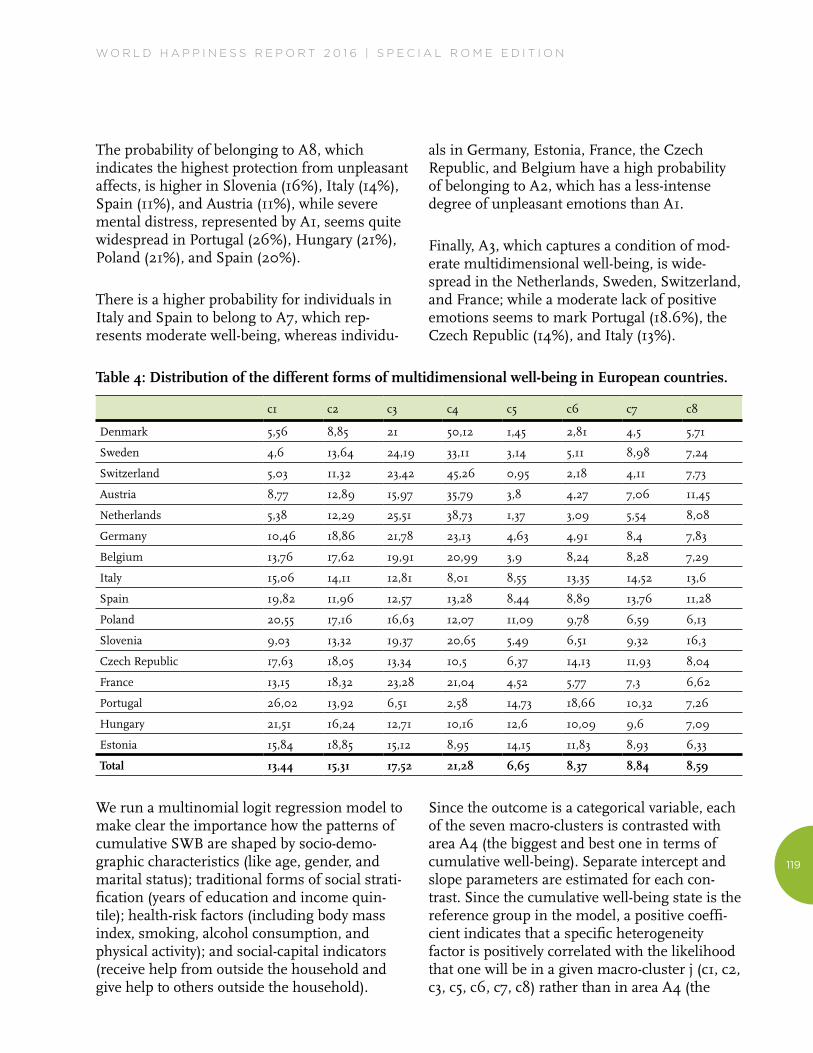
We run a multinomial logit regression model to make clear the importance how the patterns of cumulative SWB are shaped by socio-demo-graphic characteristics (like age, gender, and marital status); traditional forms of social strati-fication (years of education and income quin-tile); health-risk factors (including body mass index, smoking, alcohol consumption, and physical activity); and social-capital indicators (receive help from outside the household and give help to others outside the household).
Since the outcome is a categorical variable, each of the seven macro-clusters is contrasted with area A4 (the biggest and best one in terms of cumulative well-being). Separate intercept and slope parameters are estimated for each con-trast. Since the cumulative well-being state is the reference group in the model, a positive coeffi-cient indicates that a specific heterogeneity factor is positively correlated with the likelihood that one will be in a given macro-cluster j (c1, c2, c3, c5, c6, c7, c8) rather than in area A4 (the
120
reference group). Below, we present the estima-tion results obtained by our model.
**c1
The chances of being in A1 (the macro-cluster of negative emotion/depressive symptoms) rather than in A4 (the macro-cluster of cumulative well-being) are higher for females, for individu-als who are separated or divorced, for individuals living in large families, and for individuals who receive help from outside the household. Logits are also higher for those who smoke and have a low level of physical activity. Being married, having a high level of education, belonging to the higher income quintiles, alcohol consump-tion, and being of normal weight or overweight are factors that significantly reduce the chances of belonging to this area.
**c2
From the second contrast, an outline emerges that is similar to the first one: the factors that increase or decrease the chances of belonging to A2 are about the same as previously observed, although there is a reduction in the strength of the effects related to heterogeneity factors. An important difference is the positive effect linked to giving help to others, which in the previous contrast was of the opposite sign, although it was statistically non-significant.
**c3
The likelihood of belonging to A3, which is spatially adjacent to A4, is higher for females, people living in larger families, individuals who receive help from outside the household and who have given help to others outside the household, obese people (BMI of 30 and above), people who have ever smoked daily and those who have a low level of physical activity. Again, the coefficients associated with years of educa-tion and income quintiles have a negative and statistically significant sign, although of a lower magnitude than in the previous contrast.
**c5
In the contrast between A5 (a lack of positive emotions) and A4, the role of education and income is clear in protecting against this form of multidimensional ill-being: The inverse relation-ship between years of education and income quintile, on the one hand, and ill-being, on the other, is almost linear. Other factors that have a protective effect are being female (unlike in the previous contrasts), being married, separated/divorced or a widow(er), having a greater num-ber of children, giving help to others, being of normal weight or overweight, and alcohol consumption. The factors that have a positive effect are house size, receiving help from out-side the household, smoking, sedentariness, and physical inactivity.
**c6
It is not surprising that the predictive character-istics of belonging to A6 are very similar to those of belonging to A5, given the spatial contiguity between the two macro-clusters. Once again, the inverse relationship between the number of years of education and the income quintile, on the one hand, and the chances of belonging to A6, on the other, is almost linear, although the correlation is lower than in the previous contrast. Also as with A5, being female, being married, separated/divorced or a wid-ow(er), having a greater number of children, giving help to others, and alcohol consumption have negative and statistically significant effects; household size, receiving help from outside the household, smoking at the present time, and physical inactivity have the opposite effect.
**c7
The estimates of the parameters referred to in the contrast between A7 and A4 are modelled once again on what came to light in the two previous comparisons, even if, as we move towards the bottom of the map, the discriminat-ing strength of the factors of heterogeneity decreases: Being female, married or a widow(er),
W O R L D H A P P I N E S S R E P O R T 2 0 1 6 | S P E C I A L R O M E E D I T I O N
121
and having a higher number of children reduce the chances of belonging to A7. Years of educa-tion, income quintile, giving help to others, and alcohol consumption have a negative effect, while smoking at the present time and physical inactivity have a positive one.
**c8
The final contrast concerns A8, which rep-resents a macro-cluster with high protection from unpleasant affects and depressive symp-toms and which is spatially contiguous to the area of reference (A4). Once again, being fe-male, having a greater number of children, having a greater number of years of education, being in a higher income quintile, giving help to others, and alcohol consumption decrease the chances of belonging to A8, while smoking at the present time and physical inactivity have the opposite effect.
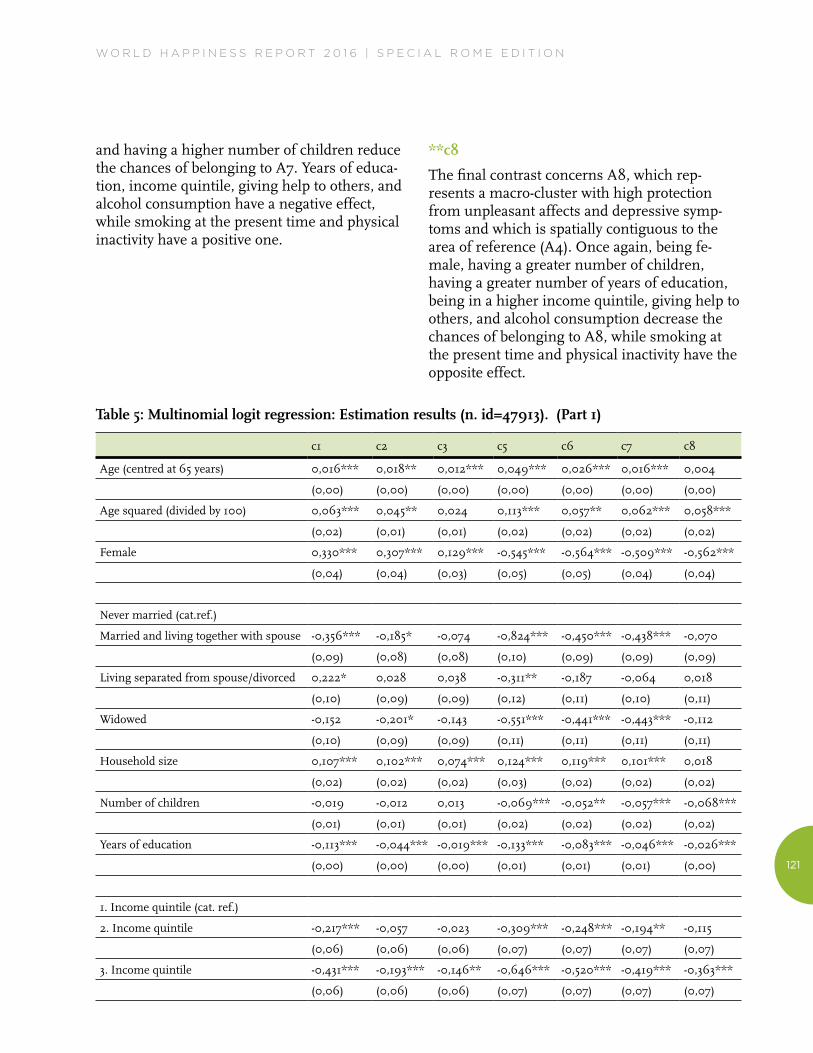
Table 5: Multinomial logit regression: Estimation results (n. id=47913). (Part 1)
c1 c2 c3 c5 c6 c7 c8
Age (centred at 65 years) 0,016*** 0,018** 0,012*** 0,049*** 0,026*** 0,016*** 0,004
(0,00) (0,00) (0,00) (0,00) (0,00) (0,00) (0,00)
Age squared (divided by 100) 0,063*** 0,045** 0,024 0,113*** 0,057** 0,062*** 0,058***
(0,02) (0,01) (0,01) (0,02) (0,02) (0,02) (0,02)
Female 0,330*** 0,307*** 0,129*** -0,545*** -0,564*** -0,509*** -0,562***
(0,04) (0,04) (0,03) (0,05) (0,05) (0,04) (0,04)
Never married (cat.ref.)
Married and living together with spouse -0,356*** -0,185* -0,074 -0,824*** -0,450*** -0,438*** -0,070
(0,09) (0,08) (0,08) (0,10) (0,09) (0,09) (0,09)
Living separated from spouse/divorced 0,222* 0,028 0,038 -0,311** -0,187 -0,064 0,018
(0,10) (0,09) (0,09) (0,12) (0,11) (0,10) (0,11)
Widowed -0,152 -0,201* -0,143 -0,551*** -0,441*** -0,443*** -0,112
(0,10) (0,09) (0,09) (0,11) (0,11) (0,11) (0,11)
Household size 0,107*** 0,102*** 0,074*** 0,124*** 0,119*** 0,101*** 0,018
(0,02) (0,02) (0,02) (0,03) (0,02) (0,02) (0,02)
Number of children -0,019 -0,012 0,013 -0,069*** -0,052** -0,057*** -0,068***
(0,01) (0,01) (0,01) (0,02) (0,02) (0,02) (0,02)
Years of education -0,113*** -0,044*** -0,019*** -0,133*** -0,083*** -0,046*** -0,026***
(0,00) (0,00) (0,00) (0,01) (0,01) (0,01) (0,00)
1. Income quintile (cat. ref.)
2. Income quintile -0,217*** -0,057 -0,023 -0,309*** -0,248*** -0,194** -0,115
(0,06) (0,06) (0,06) (0,07) (0,07) (0,07) (0,07)
3. Income quintile -0,431*** -0,193*** -0,146** -0,646*** -0,520*** -0,419*** -0,363***
(0,06) (0,06) (0,06) (0,07) (0,07) (0,07) (0,07)
122
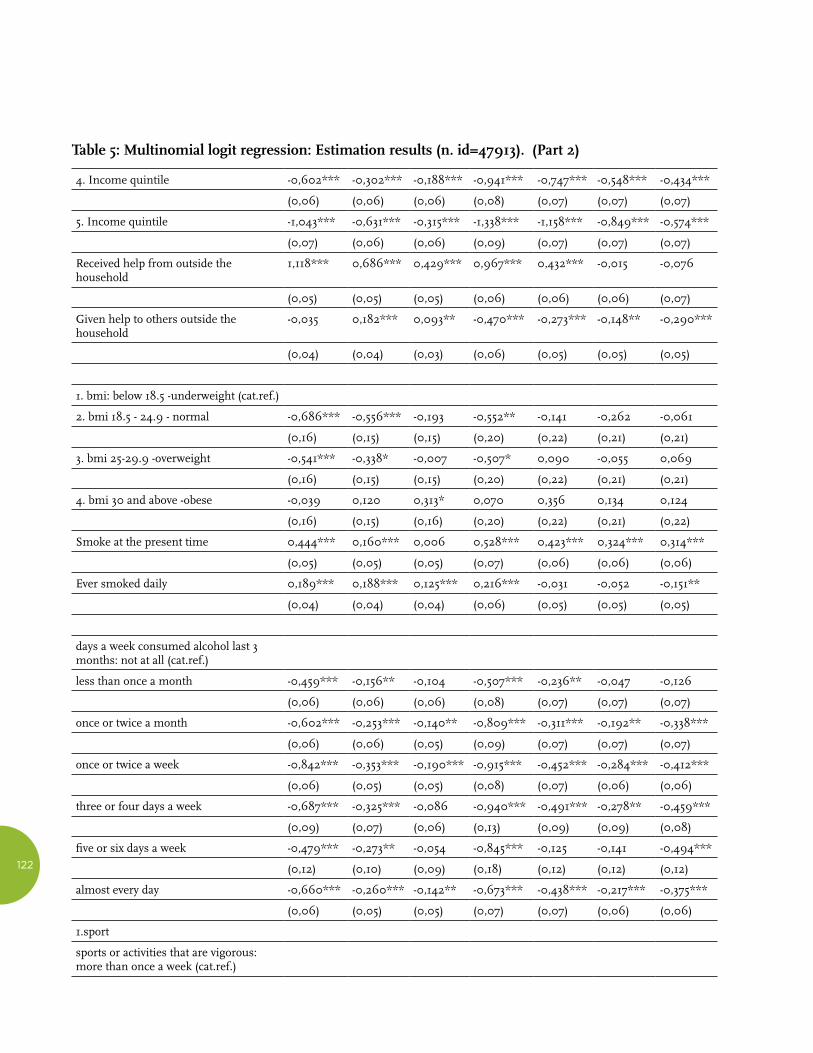
4. Income quintile -0,602*** -0,302*** -0,188*** -0,941*** -0,747*** -0,548*** -0,434***
(0,06) (0,06) (0,06) (0,08) (0,07) (0,07) (0,07)
5. Income quintile -1,043*** -0,631*** -0,315*** -1,338*** -1,158*** -0,849*** -0,574***
(0,07) (0,06) (0,06) (0,09) (0,07) (0,07) (0,07)
Received help from outside the household
1,118*** 0,686*** 0,429*** 0,967*** 0,432*** -0,015 -0,076
(0,05) (0,05) (0,05) (0,06) (0,06) (0,06) (0,07)
Given help to others outside the household
-0,035 0,182*** 0,093** -0,470*** -0,273*** -0,148** -0,290***
(0,04) (0,04) (0,03) (0,06) (0,05) (0,05) (0,05)
1. bmi: below 18.5 -underweight (cat.ref.)
2. bmi 18.5 - 24.9 - normal -0,686*** -0,556*** -0,193 -0,552** -0,141 -0,262 -0,061
(0,16) (0,15) (0,15) (0,20) (0,22) (0,21) (0,21)
3. bmi 25-29.9 -overweight -0,541*** -0,338* -0,007 -0,507* 0,090 -0,055 0,069
(0,16) (0,15) (0,15) (0,20) (0,22) (0,21) (0,21)
4. bmi 30 and above -obese -0,039 0,120 0,313* 0,070 0,356 0,134 0,124
(0,16) (0,15) (0,16) (0,20) (0,22) (0,21) (0,22)
Smoke at the present time 0,444*** 0,160*** 0,006 0,528*** 0,423*** 0,324*** 0,314***
(0,05) (0,05) (0,05) (0,07) (0,06) (0,06) (0,06)
Ever smoked daily 0,189*** 0,188*** 0,125*** 0,216*** -0,031 -0,052 -0,151**
(0,04) (0,04) (0,04) (0,06) (0,05) (0,05) (0,05)
days a week consumed alcohol last 3 months: not at all (cat.ref.)
less than once a month -0,459*** -0,156** -0,104 -0,507*** -0,236** -0,047 -0,126
(0,06) (0,06) (0,06) (0,08) (0,07) (0,07) (0,07)
once or twice a month -0,602*** -0,253*** -0,140** -0,809*** -0,311*** -0,192** -0,338***
(0,06) (0,06) (0,05) (0,09) (0,07) (0,07) (0,07)
once or twice a week -0,842*** -0,353*** -0,190*** -0,915*** -0,452*** -0,284*** -0,412***
(0,06) (0,05) (0,05) (0,08) (0,07) (0,06) (0,06)
three or four days a week -0,687*** -0,325*** -0,086 -0,940*** -0,491*** -0,278** -0,459***
(0,09) (0,07) (0,06) (0,13) (0,09) (0,09) (0,08)
five or six days a week -0,479*** -0,273** -0,054 -0,845*** -0,125 -0,141 -0,494***
(0,12) (0,10) (0,09) (0,18) (0,12) (0,12) (0,12)
almost every day -0,660*** -0,260*** -0,142** -0,673*** -0,438*** -0,217*** -0,375***
(0,06) (0,05) (0,05) (0,07) (0,07) (0,06) (0,06)
1.sport
sports or activities that are vigorous: more than once a week (cat.ref.)
Table 5: Multinomial logit regression: Estimation results (n. id=47913). (Part 2)

W O R L D H A P P I N E S S R E P O R T 2 0 1 6 | S P E C I A L R O M E E D I T I O N
123
once a week 0,502*** 0,244*** 0,214*** 0,398*** 0,451*** 0,302*** 0,222***
(0,06) (0,05) (0,04) (0,09) (0,06) (0,06) (0,06)
one to three times a month 0,840*** 0,551*** 0,389*** 0,921*** 0,694*** 0,623*** 0,462***
(0,07) (0,06) (0,06) (0,10) (0,07) (0,07) (0,07)
hardly ever, or never 1,490*** 0,784*** 0,427*** 1,719*** 0,909*** 0,615*** 0,304***
(0,05) (0,04) (0,04) (0,06) (0,05) (0,05) (0,05)
_cons 1,033 -0,018 -0,700 1,093 -0,052 1,191 2,665***
(0,73) (0,68) (0,65) (0,96) (0,85) (0,81) (0,79)
Robust standard errors in parentheses; significance levels: ***p≤0.001, **p≤0.01, *p≤0.05 Estimates include (but don’t show) country dummies %Final quantization error: 5.057 %Final topographic error: 0.025
]According to the estimates of the parameters reported in Table 5, membership in these areas is deeply influenced by some important hetero-geneity factors whose effect maintains the same sign in correspondence of the different con-trasts, whereas the intensity follows a pattern of topological distance of the macro-cluster. More concretely, areas A1 and A5, which are further from the reference category (A4), show stronger effects (or discriminatory power) in relation to the number of years of education and income in respect to closer areas.
Finally, in all the contrasts, we observe a curvi-linear relationship with age, with a positive instantaneous rate of change and a positive curvature. A positive coefficient for age and a positive coefficient for age squared cause the curve to increase at a increasing rate.
In conclusion, it is worth highlighting applying standard regression models to observational data precludes attributing a causal relationship to the parameters of evaluation. The analysis here is an associative rather than a causal one, and it would be highly naïve to make causal conclusions from data and identification strategies that are weak because they do not consider the problem of reverse causality, or check for unobserved individual heterogeneity (which is generally
greater than the differences between groups). In short, we cannot confirm whether people who do physical exercise, are married, do not smoke, are more educated, and belong to a higher income quintile are happier and healthier because they have intentionally chosen a certain lifestyle or whether, because they are happier and healthier, they benefit from a competitive advantage in terms of education and income, and have had more opportunities to choose a healthy lifestyle.
Conclusion
This paper proposes the application of an inno-vative technique of clustering and projection—the Self-Organizing Map—to identify multidi-mensional patterns of subjective well-being in contemporary Europe, and to overcome the limitations inherent in standard approaches based on a single measure of life satisfaction, or on synthetic indices that are unable to capture these multidimensional patterns. Starting from a rich set of hedonic and eudaimonic indicators from the fourth wave (2010–11) of SHARE, which refer to positive and negative affects, somatic disorders, vitality/apathy, self-efficacy, physical and mental health, and an evaluation of some important life domains, the study has extrapolated a topological map.
Table 5: Multinomial logit regression: Estimation results (n. id=47913). (Part 3)

124
This map is composed of 48 micro-clusters that are subsequently grouped into eight prototypical macro-cluster or areas, each of which describes a specific profile. By and large, areas located on the upper part of the map indicate a greater degree of depression and psychophysical ill-be-ing, while areas on the bottom identify a greater degree of SWB, characterized by pleasant emo-tions, self-determination, good health, and a high degree of satisfaction with life and life circumstances. More precisely, the analysis carried out here indicates that one in three Europeans enjoys a state of multidimensional well-being (areas A4 and A8), one in five has unpleasant or a lack of pleasant emotions (A1 and A5), one in five is in a condition of psycho-logical fragility (A2 and A6), and the remaining 27 percent are in a state of moderate well-being (A4 and A7).
Although the vertical axis shows a discriminant power that is higher than the horizontal one, the latter is quite useful in enabling us to capture a certain degree of bipolarity between the pres-ence of unpleasant emotions and the lack of pleasant emotions. More specifically, in the upper right area of the map we can find individ-uals who have no hopes for the future, have not enjoyed any activity recently, rarely look back on life with a sense of happiness, rarely think they can do the things they want to do, rarely look forward to each day, rarely feel that their life has meaning, rarely feel full of energy, rarely feel that life is full of opportunities, rarely feel that their future is bright, and are relatively dissatis-fied with their free-time activities and their personal relationships. The area at the top left of the map indicates individuals who are more likely to have been sad or depressed within the last month, wish they were dead, blame them-selves, have trouble sleeping, have less interest in things than usual, feel irritable, lack appetite, feel fatigue, have cried in the last month, have suffered from depression or other affective disorders, fear the worst most of the time, are nervous most of the time, have trembling hands,
are afraid of dying, feel faint, often think that family responsibilities prevent them from doing what they want to do, and believe that a shortage of money keeps them from doing the things they want to do.
As affirmed by some authors, it seems that the cause for such a polarization can be attributed to different neurobiological systems.42 Some indica-tors that represent holistic ideas of a cognitive or emotional nature, such as life satisfaction and self-assessed health, show a low degree of polar-ization on the map, which means that it is not possible to determine whether the type of detect-ed ill-being (or well-being) is caused by the lack (or presence) of positive emotions or by the presence (or lack) of negative emotions.43 In conclusion, in going beyond the mapping stage, we have discovered important variations in the distribution of the different forms of multidi-mensional well-being, in relation to some im-portant observed heterogeneity factors.
In general, married individuals who maintain a healthy lifestyle; are well educated and wealthy; and reside in Denmark, Switzerland, the Nether-lands, Austria, or Sweden are more likely to belong to the macro-cluster of highest well-be-ing. Separated/divorced individuals with a low level of education and a low income who are exposed to health risks and reside in Portugal, Estonia, Hungary, or Poland have a high proba-bility of belonging to the clusters of psychophys-ical discomfort and lack of positive emotions.
W O R L D H A P P I N E S S R E P O R T 2 0 1 6 | S P E C I A L R O M E E D I T I O N
125
1. Arthaud-Day, Rode, Mooney, and Near (2005); Diener, Suh, Lucas, and Smith (1999).
2. Diener et al. (1999); Diener et al. (2003); Seligman and Csikszentmihalyi (2000;) Seligman (2002); Waterman (1993); Ryan and Deci (2001).
3. Seligman et al. (2005).
4. Pavot and Diener (1993).
5. Ryff (1989); Seligman et al. (2005); Massimini and Delle Fave (2000); Steger et al. (2006); Waterman et al. (2010).
6. Ryff e Keyes (1995); Ryff and Singer (1998); Ryff, Singer and Love (2004).
7. Ryan and Deci (2000).
8. Boniwell (2012).
9. Waterman (1993).
10. Csikszentmihalyi (1992).
11. Diener et al. (1985); Diener (2000); Pavot and Diener (2008); Fredrickson (2001).
12. Nesse (2005).
13. Arthaud-Day et al. (2005); Bradburn and Caplovitz (1965); Bradburn (1969); Watson et al. (1988).
14. Diener et al. (1999).
15. Diener et al. (1999).
16. cf. Watson et al. (1999).
17. Bruder et al. 1(997); Davidson (1992); Tomarken and Keener (1998).
18. Barbara Fredrickson (2001, 2009).
19. Fredrickson (2009, p. 234).
20. Diener et al. (1999).
21. Arthaud-Day et al., (2005).
22. Prince et al. (1999).
23. Lyubomirsky and Lepper (1999); Arthaud-Day et al. (2005).
24. Andrews and Withey (1976).
25. Campbell et al. 1976).
26. Diener et al. (1985).
27. Kammann and Flett (1983).
28. Bradburn (1969).
29. Watson et al. (1988).
30. Diener et al. (2010).
31. Beck et al. (1961).
32. Prince et al. (1999).
33. cf. Diener et al. (2010).
34. cf. Diener et al. (1999).
35. Kohonen (1982).
36. The target population for the baseline samples consists of all persons born in 1960 or earlier having their regular residence in the respective country, together with their current partners/spouses, independent of age (Börsch-Supan, 2013).
37. Scheier and Carver (1985).
38. Vesanto et al. (2000).
39. Kohonen (2001).
40. Diener et al. (1999); Watson et al. (1999).
41. Pavot and Diener (1993); Arthaud-Day et al. (2005); Prince et al. (1999).
42. Diener et al. (1999).
43. Diener and Emmons (1984); Veenhoven (1984).

126
References
Andrews, F. M., & Withey, S. B. (1976). Social Indicators of well-being: Americans’perceptions of life quality. New York: Plenum.
Arthaud-Day, M. L., Rode, J. C., Mooney, C.H., & Near, J. P. (2005). The subjective well-being construct: a test of its convergent, discriminant, and factorial validity. Social Indicators Research, 74, pp. 445–476.
Beck, A.T., Ward, C. H., Mendelson, M., Mock, J., & Erbaugh, J. (1961). An inventory for measuring depression. Archives of General Psychiatry 4, pp. 561–571.
Boniwell, I. (2012). Positive psychology in a nutshell. The science of happiness. Maidenhead: Open University Press.
Börsch-Supan, A. (2013). Survey of health, ageing and retirement in europe wave 4 (release version 1.1.1.). DOI: 10.6103/SHARE.w4.111
Bradburn, N. M. (1969). The structure of psychological well-be-ing. Chicago, IL: Aldine Publishing Company.
Bradburn, N. M., & Caplovitz, D. (1965). Reports on happiness. Chicago, IL: Aldine Publishing Company.
Bruder, G.E., Fong, R., Tenke, C.E., Leite, P., Towey, J.P., & Stewart, J.E. (1997). Regional brain asymmetries in major depression with or without an anxiety disorder: A quantitative electroencephalographic study. Biological Psychiatry, 41, pp. 939–948.
Csikszentmihalyi, M. (1992). Flow. The psychology of happiness. London: Rider.
Davidson, R. J. (1992). Emotion and affective style: Hemi-spheric substrates. Psychological Science, 3, pp. 39–43.
Diener, E. (2000). Subjective well-being: The science of happiness, and a proposal for a national index. American Psychologist, 55, pp. 34–43.
Diener, E., & Emmons, R.A. (1984). The independence of positive and negative affect. Journal of Personality and Social Psychology, 47, 1105–1117.
Diener, E., Emmons, R. A., Larsen, R. J., & Griffin, S. (1985). The satisfaction with life scale. Journal of Personality Assess-ment, 49, 71–75.
Diener, E., Suh, E. M., Lucas, R. E., & Smith, H. L. (1999). Subjective well-being: Three decades of progress. Psychological Bulletin, 125, pp. 276–302.
Diener E., Oishi, S., & Lucas, R.E. (2003). Personality, culture and subjective well-being: Emotional and cognitive evalua-tions of life. Annual Review of Psychology, 59, pp. 229–259.
Diener, E., Ng, W., Harter, J. & Arora, R. (2010). Wealth and happiness across the world: Material prosperity predicts life evaluation, whereas psychosocial prosperity predicts positive feeling. Journal of Personality and Social Psychology, 99, pp. 52–61.
Diener, E., Wirtz, D., Tov, W., Kim-Prieto, C., Choi, D. W., Oishi, S., & Biswas-Diener, R. (2010).
New well-being measures: Short scales to assess flourishing and positive and negative feelings. Social Indicators Research, 97(2), 143–156.
Fredrickson, B.L. (2001). The role of positive emotions in positive psychology: The broaden-and-build theory of positive emotion. American Psychologist, 56, pp. 218–226.
Fredrickson, B.L. (2009). Positivity. Crown Publishers.
Kammann, N.R., & Flett, R. (1983). Affectometer 2: A scale to measure current level of general happiness. Australian Journal of Psychology, 35(2), 259–265.
Kohonen, T. (1982). Self-organized formation of topologically correct feature maps. Biological Cybernetics, 43, pp. 59–69.
Kohonen, T. (2001). Self-Organizing Maps. Berlin: Springer.
Lyubomirsky, S., & Lepper, H. (1999). A measure of subjective happiness: Preliminary reliability and construct validation. Social Indicators Research, 46, pp. 137–155.
Massimini, F., & Delle Fave, A. (2000). Individual develop-ment in a bio-cultural perspective. American Psychologist, 55, pp. 24–33.
Nesse, R. M. (2005). Natural selection and the regulation of defenses: A signal detection analysis of the smoke detector principle. Evolution and Human Behavior, 26, pp. 88–105.
Pavot, W., & Diener, E. (1993). Review of the satisfaction with life scale. Psychological Assessment, 5, pp. 164–172.
Pavot, W., & Diener, E. (2008). The satisfaction with life scale and the emerging construct of life satisfaction. The Journal of Positive Psychology, 3, pp. 137–152.
Prince, M.J., Reischies, F., Beekman, A.T.F (1999): Develop-ment of the EURO-D scale – a European Union initiative to compare symptoms of depression in 14 European centres. British Journal of Psychiatry, 174, pp. 330–38.
Ryan, R.M., & Deci, E.L. (2000). Self-determination theory and the facilitation of intrinsic motivation, social develop-ment, and well-being. American Psychologist, 55, pp. 68–78.
Ryan, R.M., & Deci, E.L. (2001). On happiness and human potentials: A review of research on hedonic and eudaimonic well-being. In Fiske, S. (Ed). Annual review of psychology (Vol. 52, pp. 141–166). Palo Alto, CA: Annual Reviews Inc.

W O R L D H A P P I N E S S R E P O R T 2 0 1 6 | S P E C I A L R O M E E D I T I O N
127
Ryff, C.D. (1989). Happiness is everything, or is it? Explora-tions on the meaning of psychological well-being. Journal of Personality and Social Psychology, 57, pp. 1069–1081.
Ryff, C., & Keyes, C. (1995). The structure of psychological well-being revisited. Journal of Personality and Social Psychology, 69, pp. 719–727.
Ryff, C. D., & Singer, B. H. (1998). The contours of positive human health. Psychological Inquiry, 9, pp. 1–28.
Ryff, C. D., Singer, B. H., & Love, G. D. (2004). Positive health: Connecting well-being with biology. Philosophical Transactions of the Royal Society of London B, 359, pp. 1383–1394.
Scheier, M. F. & Carver, C. S. (1985). Optimism, coping, and health: assessment and implications of generalized outcome expectancies. Health Psychology, 4, pp. 219–247.
Seligman, M.E.P., & Csikszentmihalyi, M. (2000). Positive psychology: An introduction. American Psychologist, 55(1), 5–14.
Seligman, M.E.P. (2002). Authentic happiness: Using the new positive psychology to realize your potential for lasting fulfillment). New York: Free Press.
Seligman, M.E.P., Steen, T.A., Park, N. & Peterson, C. (2005). Positive psychology progress: empirical validation of interven-tions. American Psychologist, 60, pp. 410–421.
Steger, M. F., Frazier, P., Oishi, S., & Kaler, M. (2006). The meaning in life questionnaire: Assessing the presence of and search for meaning in life. Journal of Counseling Psychology, 53, pp. 80–93.
Tomarken, A. J., & Keener, A. D. (1998). Frontal brain asymmetry and depression: A self–regulatory perspective. Cognition and Emotion, 12, pp. 387–420.
Veenhoven, R. (1984) Databook of Happiness. Dordrecht: Reidel Publishing Company.
Vesanto, J., Himberg, J., Alhoniemi, E., & Parhankangas, J.(2000). SOM toolbox for Matlab 5, Technical Report A57. Finland: Helsinki University of Technology.
Waterman, A.S. (1993). Two conceptions of happiness: Contrasts of personal expressiveness (eudaimonia) and hedonic enjoyment. Journal of Personality and Social Psychology, 64(4), 678–691.
Waterman, A.S., Schwartz, S.J., Zamboanga, B.L., Ravert, R.D., Williams, M.K., Agocha, M.B., & Donnellan, V.B. (2010). The questionnaire for eudaimonic well-being: Psychometric properties, demographic comparisons, and evidence of validity. The Journal of Positive Psychology, 5(1), 41–61.
Watson, D., Clark, L. A., & Tellegen, A. (1988). Development and validation of brief measures of positive and negative affect: The PANAS Scales, Journal of Personality and Social Psychology, 54(6), 1063–1070.
Watson, D., Wiese, D., Vaidya, J., & Tellegen, A. (1999). The two general activation systems of affect: Structural findings, evolutionary considerations, and psychobiological evidence. Journal of Personality and Social Psychology, 76, 820–838.