chapter 5 modern portfolio concepts. copyright ©2014 pearson education, inc. all rights...
TRANSCRIPT

Chapter 5
Modern Portfolio Concepts
Copyright ©2014 Pearson Education, Inc. All rights reserved. 5-2
Required computations (10-12)
• Various return concepts (HPR, IRR, realized return, expected return)
• Compute the average return and standard deviation on a time series using excel.
• Compute the mean/expected return and standard deviation given scenarios with probabilities.
• Compute the mean return, beta of a portfolio of multiple assets
• Compute the standard deviation of a two-asset portfolio
• Apply CAPM to compute required rate of return, return sensitivity to market moves, and market risk premium.
Copyright ©2014 Pearson Education, Inc. All rights reserved. 5-3
What is a Portfolio?
• Portfolio is a collection of investments assembled to meet one or more investment goals.
• Efficient portfolio
– A portfolio that provides the highest return for a given level of risk
– Requires search for investment alternatives to get the best combinations of risk and return

Copyright ©2014 Pearson Education, Inc. All rights reserved. 5-4
Portfolio Return and Risk Measures
• The return on a portfolio is simply the weighted average of the individual assets’ returns in the portfolio
• The standard deviation of a portfolio’s returns is more complicated, and is a function of the portfolio’s individual assets’ weights, standard deviations, and correlations with all other assets

Copyright ©2014 Pearson Education, Inc. All rights reserved. 5-5
Return on Portfolio

Copyright ©2014 Pearson Education, Inc. All rights reserved. 5-6
Correlation: Why Diversification Works!
• Correlation is a statistical measure of the relationship between two series of numbers representing data
• Positively Correlated items tend to move in the same direction
• Negatively Correlated items tend to move in opposite directions
• Correlation Coefficient is a measure of the degree of correlation between two series of numbers representing data

Copyright ©2014 Pearson Education, Inc. All rights reserved. 5-7
Correlation Coefficients
• Perfectly Positively Correlated describes two positively correlated series having a correlation coefficient of +1
• Perfectly Negatively Correlated describes two negatively correlated series having a correlation coefficient of -1
• Uncorrelated describes two series that lack any relationship and have a correlation coefficient of nearly zero

Copyright ©2014 Pearson Education, Inc. All rights reserved. 5-8
Figure 5.1 The Correlation Between Series M, N, and P

Copyright ©2014 Pearson Education, Inc. All rights reserved. 5-9
Correlation: Why Diversification Works!
• Assets that are less than perfectly positively correlated tend to offset each others movements, thus reducing the overall risk in a portfolio
• The lower the correlation the more the overall risk in a portfolio is reduced– Assets with +1 correlation eliminate no risk
– Assets with less than +1 correlation eliminate some risk
– Assets with less than 0 correlation eliminate more risk
– Assets with -1 correlation eliminate all risk

Copyright ©2014 Pearson Education, Inc. All rights reserved. 5-10
Figure 5.2 Combining Negatively Correlated Assets to Diversify Risk

Copyright ©2014 Pearson Education, Inc. All rights reserved. 5-11
Figure 5.3 Portfolios of IBM and Celgene

Copyright ©2014 Pearson Education, Inc. All rights reserved. 5-12
Figure 5.4 Risk and Return for Combinations of Two Assets with Various Correlation Coefficients

Copyright ©2014 Pearson Education, Inc. All rights reserved. 5-13
Why Use International Diversification?
• Offers more diverse investment alternatives than U.S.-only based investing
• Foreign economic cycles may move independently from U.S. economic cycle
• Foreign markets may not be as “efficient” as U.S. markets, allowing true gains from superior research

Copyright ©2014 Pearson Education, Inc. All rights reserved. 5-14
International Diversification
• Advantages of International Diversification– Broader investment choices– Potentially greater returns than in U.S.– Reduction of overall portfolio risk
• Disadvantages of International Diversification– Currency exchange risk– Less convenient to invest than U.S. stocks– More expensive to invest– Riskier than investing in U.S.

Copyright ©2014 Pearson Education, Inc. All rights reserved. 5-15
Methods of International Diversification
• Foreign company stocks listed on U.S. stock exchanges– Yankee Bonds– American Depository Shares (ADS’s)– Mutual funds investing in foreign stocks– U.S. multinational companies (typically not
considered a true international investment for diversification purposes)

Copyright ©2014 Pearson Education, Inc. All rights reserved. 5-16
Components of Risk
• Diversifiable (Unsystematic) Risk– Results from uncontrollable or random events
that are firm-specific– Can be eliminated through diversification– Examples: labor strikes, lawsuits
• Nondiversifiable (Systematic) Risk– Attributable to forces that affect all similar
investments– Cannot be eliminated through diversification – Examples: war, inflation, political events

Copyright ©2014 Pearson Education, Inc. All rights reserved. 5-17
Components of Risk
Copyright ©2014 Pearson Education, Inc. All rights reserved. 5-18
Beta: A Popular Measure of Risk
• A measure of undiversifiable risk• Indicates how the price of a security responds to market
forces• Compares historical return of an investment to the market
return (the S&P 500 Index)• The beta for the market is 1.0• Stocks may have positive or negative betas. Nearly all are
positive.• Stocks with betas greater than 1.0 are more risky than the
overall market.• Stocks with betas less than 1.0 are less risky than the overall
market.

Copyright ©2014 Pearson Education, Inc. All rights reserved. 5-20
Beta as a Measure of Risk
Table 5.4 Selected Betas and Associated Interpretations

Copyright ©2014 Pearson Education, Inc. All rights reserved. 5-21
Interpreting Beta
• Higher stock betas should result in higher expected returns due to greater risk
• If the market is expected to increase 10%, a stock with a beta of 1.50 is expected to increase 15%
• If the market went down 8%, then a stock with a beta of 0.50 should only decrease by about 4%
• Beta values for specific stocks can be obtained from Value Line reports or websites such as yahoo.com

Copyright ©2014 Pearson Education, Inc. All rights reserved. 5-22
Interpreting Beta

Copyright ©2014 Pearson Education, Inc. All rights reserved. 5-23
Capital Asset Pricing Model (CAPM)
• Model that links the notions of risk and return
• Helps investors define the required return on an investment
• As beta increases, the required return for a given investment increases
Copyright ©2014 Pearson Education, Inc. All rights reserved. 5-24
Capital Asset Pricing Model (CAPM) (cont’d)
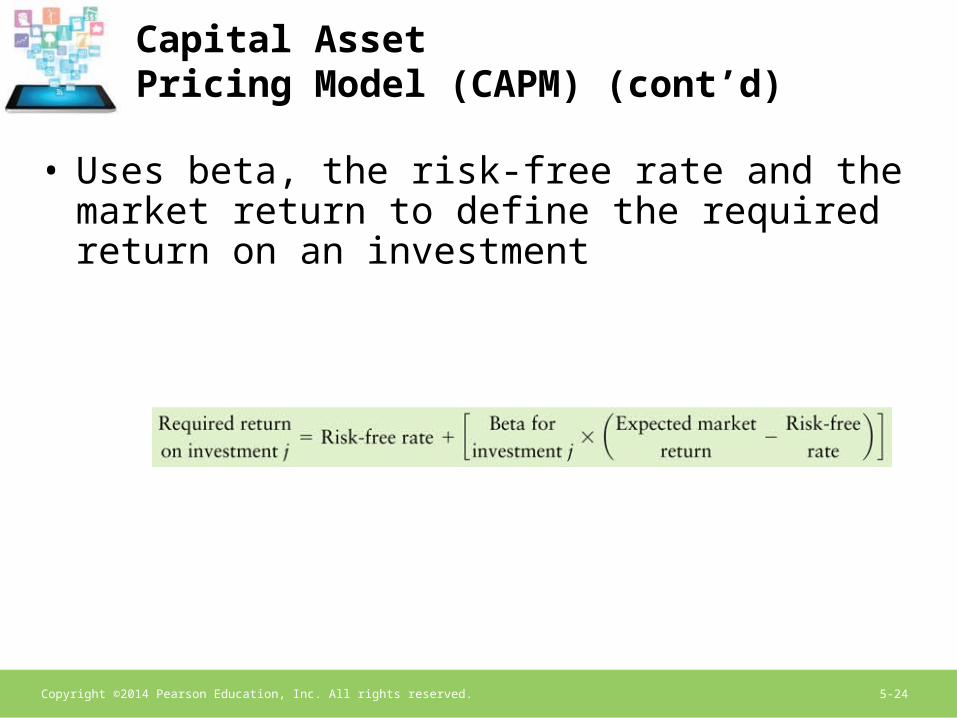
• Uses beta, the risk-free rate and the market return to define the required return on an investment

Copyright ©2014 Pearson Education, Inc. All rights reserved. 5-25
Capital Asset Pricing Model (CAPM) (cont’d)
• CAPM can also be shown as a graph
• Security Market Line (SML) is the “picture” of the CAPM
• Find the SML by calculating the required return for a number of betas, then plotting them on a graph

Copyright ©2014 Pearson Education, Inc. All rights reserved. 5-26
Figure 5.6 The Security Market Line (SML)

Copyright ©2014 Pearson Education, Inc. All rights reserved. 5-27
Two Approaches to Constructing Portfolios
Traditional Approachversus
Modern Portfolio Theory
Copyright ©2014 Pearson Education, Inc. All rights reserved. 5-28
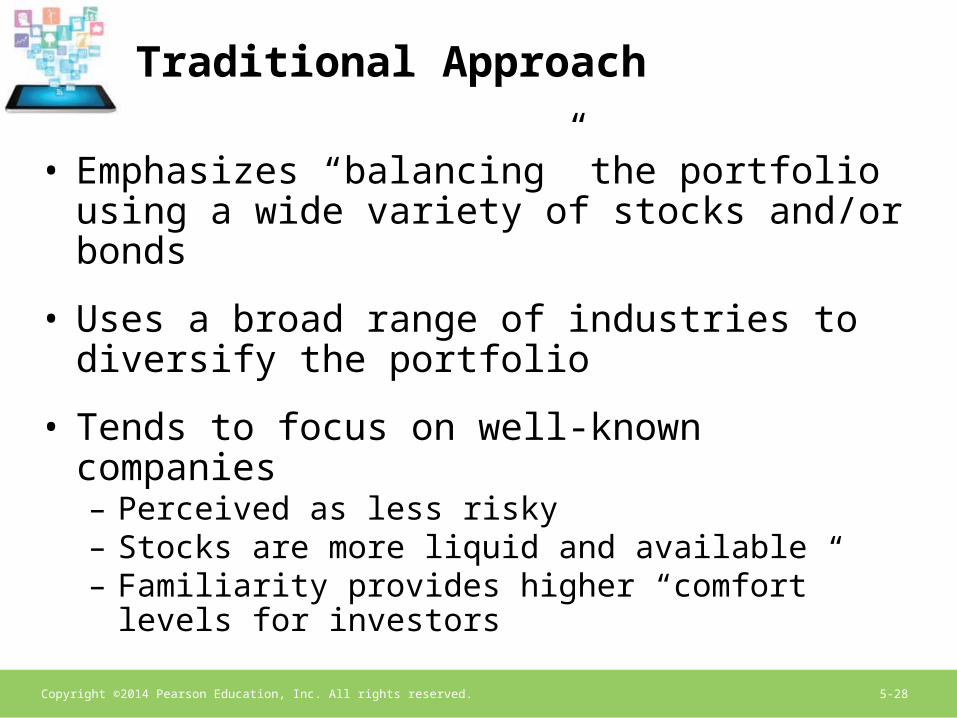
Traditional Approach
• Emphasizes “balancing” the portfolio using a wide variety of stocks and/or bonds
• Uses a broad range of industries to diversify the portfolio
• Tends to focus on well-known companies– Perceived as less risky– Stocks are more liquid and available– Familiarity provides higher “comfort” levels for
investors

Copyright ©2014 Pearson Education, Inc. All rights reserved. 5-29
Modern Portfolio Theory (MPT)
• Emphasizes statistical measures to develop a portfolio plan
• Focus is on:– Expected returns– Standard deviation of returns– Correlation between returns
• Combines securities that have negative (or low-positive) correlations between each other’s rates of return

Copyright ©2014 Pearson Education, Inc. All rights reserved. 5-30
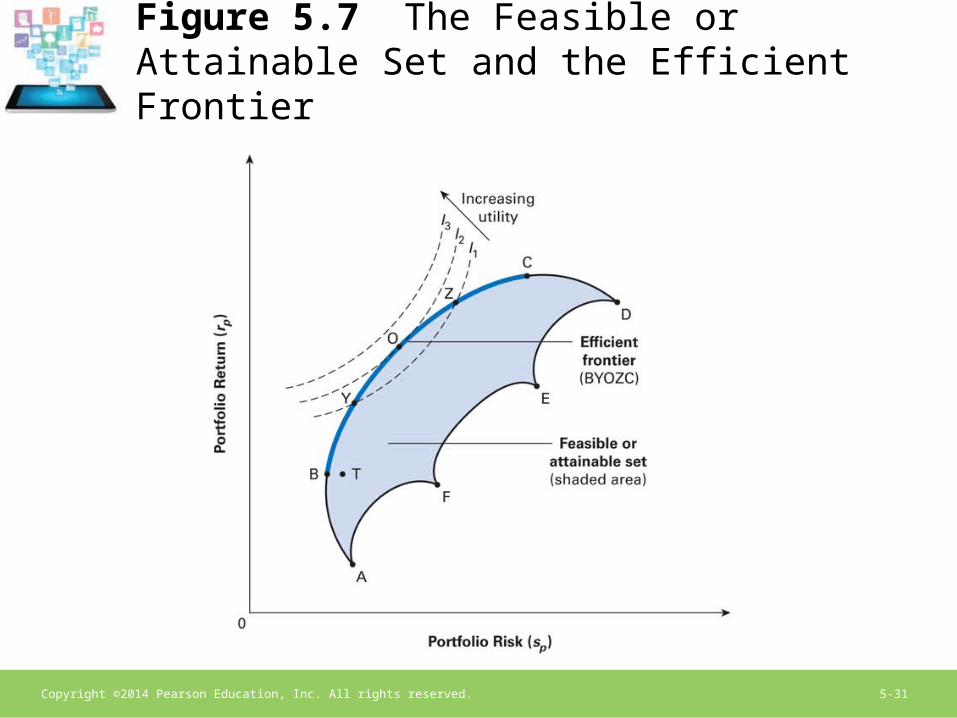
Key Aspects of MPT: Efficient Frontier
• Efficient Frontier
– The leftmost boundary of the feasible set of portfolios that include all efficient portfolios: those providing the best attainable tradeoff between risk and return
– Portfolios that fall to the right of the efficient frontier are not desirable because their risk return tradeoffs are inferior
– Portfolios that fall to the left of the efficient frontier are not available for investments
Copyright ©2014 Pearson Education, Inc. All rights reserved. 5-31
Figure 5.7 The Feasible or Attainable Set and the Efficient Frontier

Copyright ©2014 Pearson Education, Inc. All rights reserved. 5-32
Key Aspects of MPT: Portfolio Betas
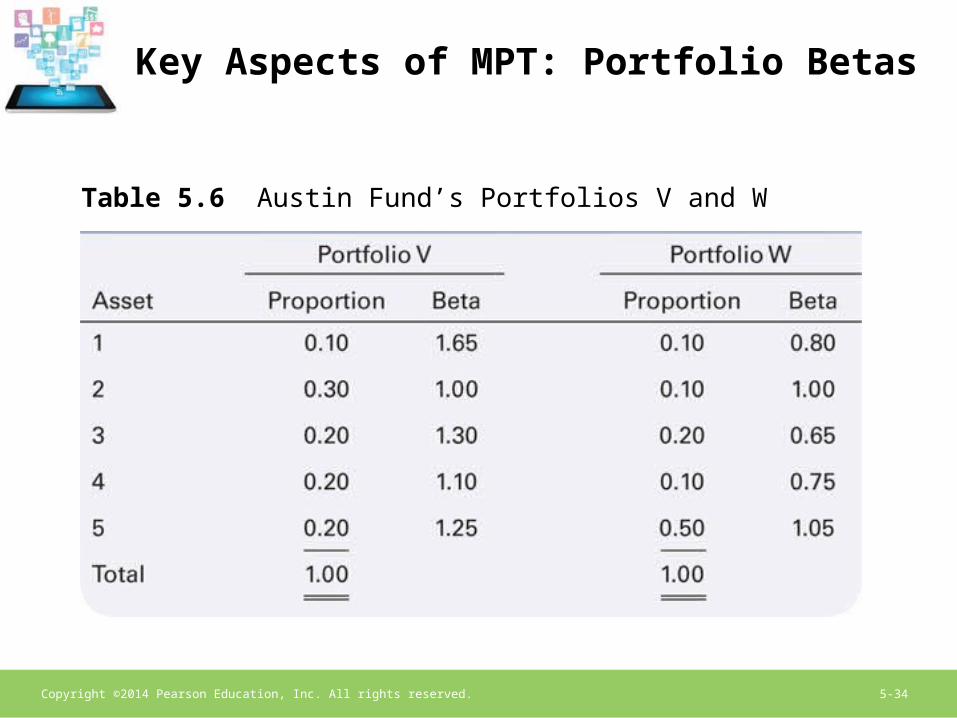
• Portfolio Beta
– The beta of a portfolio; calculated as the weighted average of the betas of the individual assets the portfolio includes
– To earn more return, one must bear more risk
– Only nondiversifiable risk (relevant risk) provides a positive risk-return relationship

Copyright ©2014 Pearson Education, Inc. All rights reserved. 5-33
Figure 5.8 Portfolio Risk and Diversification
Copyright ©2014 Pearson Education, Inc. All rights reserved. 5-34
Key Aspects of MPT: Portfolio Betas
Table 5.6 Austin Fund’s Portfolios V and W
Copyright ©2014 Pearson Education, Inc. All rights reserved. 5-35
Interpreting Portfolio Betas
• Portfolio betas are interpreted exactly the same way as individual stock betas.– Portfolio beta of 1.00 will experience a 10% increase when
the market increase is 10%– Portfolio beta of 0.75 will experience a 7.5% increase
when the market increase is 10%– Portfolio beta of 1.25 will experience a 12.5% increase
when the market increase is 10%
• Low-beta portfolios are less responsive and less risky than high-beta portfolios.
• A portfolio containing low-beta assets will have a low beta, and vice versa.

Copyright ©2014 Pearson Education, Inc. All rights reserved. 5-36
Interpreting Portfolio Betas
Table 5.7 Portfolio Betas and Associated Changes in Returns

Copyright ©2014 Pearson Education, Inc. All rights reserved. 5-37
Reconciling the Traditional Approach and MPT
• Recommended portfolio management policy uses aspects of both approaches:– Determine how much risk you are willing to bear
– Seek diversification between different types of securities and industry lines
– Pay attention to correlation of return between securities
– Use beta to keep portfolio at acceptable level of risk
– Evaluate alternative portfolios to select highest return for the given level of acceptable risk

Copyright ©2014 Pearson Education, Inc. All rights reserved. 5-38
Figure 5.9 The Portfolio Risk-Return Tradeoff