chapter 5 - islamic university of...
TRANSCRIPT

Chapter 5 Failures Resulting from Static Loading

Chapter Outline
Dr. Mohammad Suliman Abuhaiba, PE
April 19, 2014 2
Stress Concentration
Failure Theories for Ductile Materials
Maximum-Shear-Stress Theory
Distortion-Energy Theory
Coulomb-Mohr Theory
Failure Theories for Brittle Materials
Maximum-Normal-Stress Theory
Modifications of the Mohr Theory
Selection of Failure Criteria

Stress Concentration
Localized increase
of stress near
discontinuities
Kt = Theoretical (Geometric) Stress
Concentration
Factor
Dr. Mohammad Suliman Abuhaiba, PE
April 19, 2014 3
(3.48)

Appendix A–15 & A–16
Peterson’s Stress-Concentration Factors
Theoretical Stress
Concentration Factor
Dr. Mohammad Suliman Abuhaiba, PE
April 19, 2014 4
Figure A–15–1: Bar in
tension or simple
compression with a
transverse hole. σ0 =
F/A, A = (w − d)t and t
is the thickness.

Theoretical Stress
Concentration Factor
Dr. Mohammad Suliman Abuhaiba, PE
April 19, 2014 5
Figure A–15–9:
Round shaft with
shoulder fillet in
bending. σ0 =
Mc/I, c = d/2 & I
= πd4/64.

Stress Concentration for Static
and Ductile Conditions
With static loads and ductile materials:
Highest stressed fibers yield (cold work)
Load is shared with next fibers
Cold working is localized
Overall part does not see damage unless
ultimate strength is exceeded
SC effect is commonly ignored for static
loads on ductile materials
Dr. Mohammad Suliman Abuhaiba, PE
April 19, 2014 6

Stress Concentration for Static
and Ductile Conditions
SC must be included for dynamic
loading
SC must be included for brittle
materials, since localized yielding may
reach brittle failure rather than cold-
working and sharing the load.
Dr. Mohammad Suliman Abuhaiba, PE
April 19, 2014 7

Uniaxial stress element
(tension test)
Multi-axial stress
element One strength, multiple stresses
How to compare stress state
to single strength?
Need for Static Failure Theories
Dr. Mohammad Suliman Abuhaiba, PE
Strength Sn
Stress
April 19, 2014 8

Need for Static Failure Theories
Failure theories propose
appropriate means of comparing
multi-axial stress states to single
strength
Dr. Mohammad Suliman Abuhaiba, PE
April 19, 2014 9

Maximum Normal Stress
Theory (MNS)
Yielding begins when max principal stress
in a stress element exceeds the yield
strength.
Use Mohr’s circle to find principal stresses
Compare largest principal stress to yield
strength
Dr. Mohammad Suliman Abuhaiba, PE
April 19, 2014 10

Theory is
unsafe in 4th
quadrant
Not safe to
use for ductile
materials
Dr. Mohammad Suliman Abuhaiba, PE
April 19, 2014 11
Max Normal Stress Theory (MNS)

Max Shear Stress Theory (MSS)
Yielding begins when tmax in a stress
element exceeds tmax in a tension test specimen of same material when that
specimen begins to yield.
For a tension test specimen, tmax = 1 /2.
At yielding, 1 = Sy and tmax = Sy /2
Yielding begins when max shear stress in a
stress element exceeds Sy/2
Dr. Mohammad Suliman Abuhaiba, PE
April 19, 2014 12

Mohr’s circle: find max shear stress.
Compare max shear stress to Sy/2.
Order principal stresses: 1 ≥ 2 ≥ 3
Incorporate a design factor n
Dr. Mohammad Suliman Abuhaiba, PE
max
/ 2ySn
t
April 19, 2014 13
Max Shear Stress Theory (MSS)

Consider a plane stress state
A & B = two non-zero principal stresses
Order them with zero principal stress such
that 1 ≥ 2 ≥ 3
Assuming A ≥ B , three cases to consider:
Case 1: A ≥ B ≥ 0
Case 2: A ≥ 0 ≥ B
Case 3: 0 ≥ A ≥ B
Dr. Mohammad Suliman Abuhaiba, PE
April 19, 2014 14
Max Shear Stress Theory (MSS)

Case 1: A ≥ B ≥ 0
1 = A and 3 = 0
Eq. (5–1) reduces to A ≥ Sy
Case 2: A ≥ 0 ≥ B
1 = A and 3 = B
Eq. (5–1) reduces to A − B ≥ Sy
Case 3: 0 ≥ A ≥ B
1 = 0 and 3 = B
Eq. (5–1) reduces to B ≤ −Sy
Dr. Mohammad Suliman Abuhaiba, PE
April 19, 2014 15
Max Shear Stress Theory (MSS)

1. A ≥ B ≥ 0, A ≥ Sy
2. A ≥ 0 ≥ B, A − B ≥ Sy
3. 0 ≥ A ≥ B, B ≤ −Sy
Dr. Mohammad Suliman Abuhaiba, PE
Fig. 5–7
April 19, 2014 16
Max Shear Stress Theory (MSS)
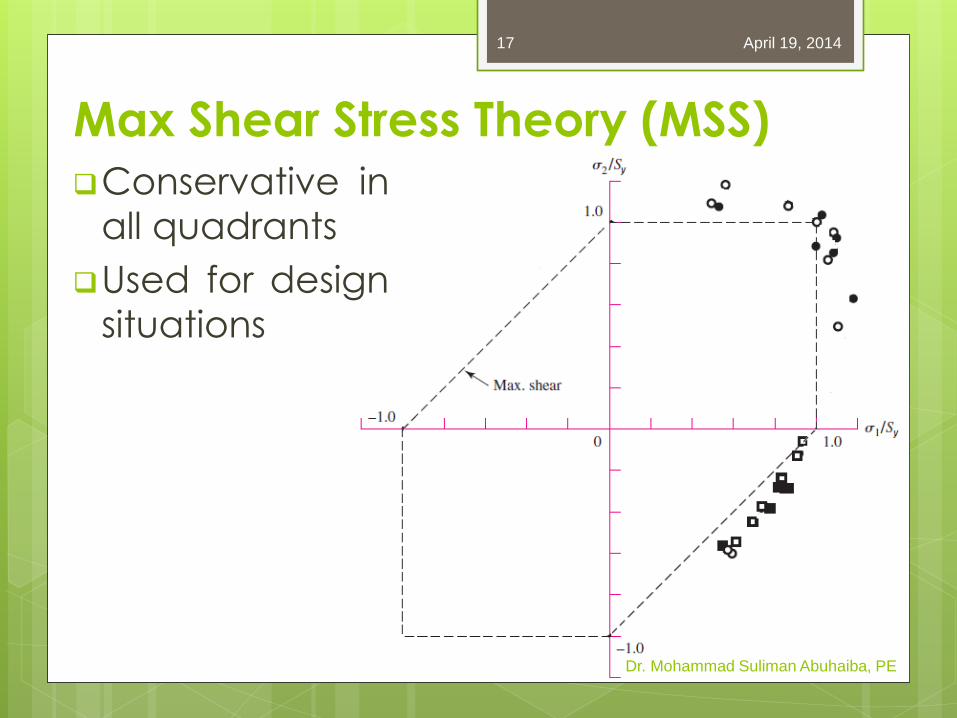
Conservative in
all quadrants
Used for design
situations
Dr. Mohammad Suliman Abuhaiba, PE
April 19, 2014 17
Max Shear Stress Theory (MSS)

Distortion Energy (DE) Failure Theory
Other Names:
Octahedral Shear Stress
Shear Energy
Von Mises
Von Mises – Hencky
Dr. Mohammad Suliman Abuhaiba, PE
April 19, 2014 18

Ductile materials stressed hydrostatically
exhibited yield strengths greatly in excess
of expected values.
Strain energy is divided into:
1. hydrostatic volume changing energy
2. angular distortion energy
Yielding is primarily affected by distortion
energy
Dr. Mohammad Suliman Abuhaiba, PE
April 19, 2014 19
Distortion Energy (DE) Failure Theory

Yielding occurs when distortion strain energy
per unit volume reaches distortion strain
energy per unit volume for yield in simple
tension or compression of same material.
Dr. Mohammad Suliman Abuhaiba, PE Fig. 5–8
April 19, 2014 20
Distortion Energy (DE) Failure Theory

Hydrostatic stress is average of principal
stresses
Strain energy per unit volume,
Dr. Mohammad Suliman Abuhaiba, PE
April 19, 2014 21
Distortion Energy (DE) Failure Theory
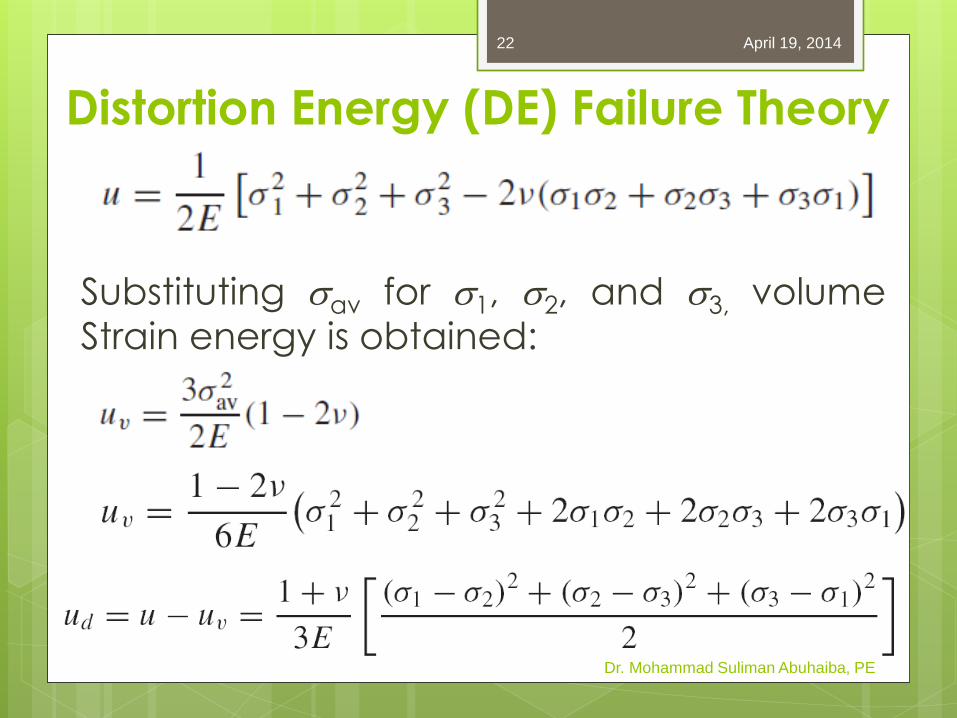
Substituting av for 1, 2, and 3, volume
Strain energy is obtained:
Dr. Mohammad Suliman Abuhaiba, PE
April 19, 2014 22
Distortion Energy (DE) Failure Theory

Tension test specimen at yield has 1 = Sy
and 2 = 3 =0
Applying to Eq. (5–8), distortion energy for
tension test specimen is
DE theory predicts failure when DE (Eq. 5.8)
exceeds DE of tension test specimen (Eq.
5.9)
Dr. Mohammad Suliman Abuhaiba, PE
April 19, 2014 23
Distortion Energy (DE) Failure Theory

Von Mises Stress (VMS)
Von Mises stress
For plane stress, simplifies to
In terms of xyz components, in 3D
Dr. Mohammad Suliman Abuhaiba, PE
April 19, 2014 24

Distortion Energy Theory With VMS
Von Mises Stress can be thought of as a
single, effective stress for the entire general
state of stress in a stress element.
Distortion Energy failure theory simply
compares von Mises stress to yield strength.
Introducing a design factor,
Dr. Mohammad Suliman Abuhaiba, PE
ySn
April 19, 2014 25

DE Theory Compared to
Experimental Data
Plot VMS on
principal stress
axes to
compare to
experimental
data
DE curve is
typical of data
Dr. Mohammad Suliman Abuhaiba, PE
Fig. 5–15
April 19, 2014 26

DE Theory Compared to
Experimental Data
Typically equates to a 50% reliability from
a design perspective
Commonly used for analysis situations
MSS theory useful for design situations
where higher reliability is desired
Dr. Mohammad Suliman Abuhaiba, PE
April 19, 2014 27

Shear Strength Predictions
For pure shear
loading, Mohr’s
circle shows that A
= −B = t
Intersection of pure
shear load line with
failure curve
indicates shear
strength has been
reached Dr. Mohammad Suliman Abuhaiba, PE
Fig. 5–9
April 19, 2014 28

For MSS theory, intersecting pure shear load
line with failure line [Eq. (5–5)] results in
Dr. Mohammad Suliman Abuhaiba, PE
Fig. 5–9
April 19, 2014 29
Shear Strength Predictions

For DE theory, intersection pure shear load line with
failure curve [Eq. (5–11)] gives
Dr. Mohammad Suliman Abuhaiba, PE
Fig. 5–9
April 19, 2014 30
Shear Strength Predictions

Selection of
Failure Criteria
Dr. Mohammad Suliman Abuhaiba, PE
April 19, 2014 31

Example 5-1
A hot-rolled steel has a yield strength of Syt =
Syc = 100 kpsi and a true strain at fracture of
εf = 0.55. Estimate the factor of safety for the
following principal stress states:
a. σx = 70 kpsi, σy = 70 kpsi, τxy = 0 kpsi
b. σx = 60 kpsi, σy = 40 kpsi, τxy = −15 kpsi
c. σx = 0 kpsi, σy = 40 kpsi, τxy = 45 kpsi
d. σx = −40 kpsi, σy = −60 kpsi, τxy = 15 kpsi
e. σ1 = 30 kpsi, σ2 = 30 kpsi, σ3 = 30 kpsi
Dr. Mohammad Suliman Abuhaiba, PE

Some materials have compressive strengths
different from tensile strengths
Mohr theory is based on three simple tests:
1. Tension
2. Compression
3. shear
Mohr Theory
Dr. Mohammad Suliman Abuhaiba, PE
Fig. 5−12
April 19, 2014 33

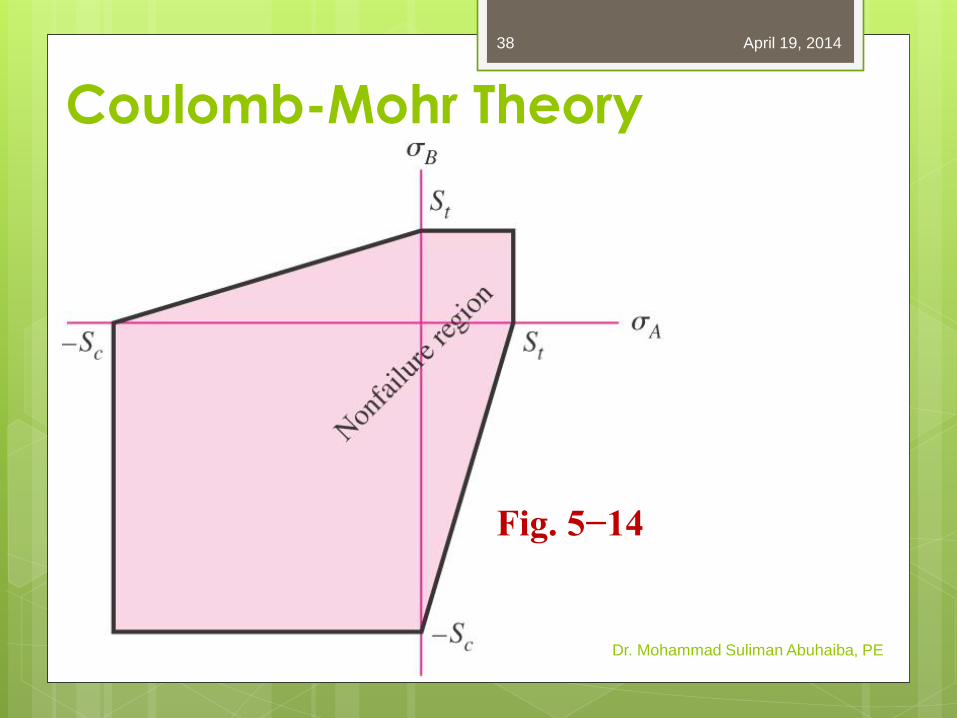
Coulomb-Mohr Theory
Coulomb-Mohr theory
simplifies to linear failure
envelope using only
tension and
compression tests
Dr. Mohammad Suliman Abuhaiba, PE
Fig. 5−13
April 19, 2014 34

Dr. Mohammad Suliman Abuhaiba, PE Fig. 5−13
April 19, 2014 35
Coulomb-Mohr Theory

Incorporating factor of safety
For ductile material, use tensile and
compressive yield strengths
For brittle material, use tensile and
compressive ultimate strengths
Dr. Mohammad Suliman Abuhaiba, PE
April 19, 2014 36
Coulomb-Mohr Theory

Consider three cases
Case 1: A ≥ B ≥ 0 , 1 = A and 3 = 0
Eq. (5−22) reduces to
Case 2: A ≥ 0 ≥ B , 1 = A and 3 = B
Eq. (5-22) reduces to
Case 3: 0 ≥ A ≥ B , 1 = 0 and 3 = B
Eq. (5−22) reduces to
Dr. Mohammad Suliman Abuhaiba, PE
April 19, 2014 37
Coulomb-Mohr Theory
Dr. Mohammad Suliman Abuhaiba, PE
Fig. 5−14
April 19, 2014 38
Coulomb-Mohr Theory

Intersect pure shear load line with the
failure line to determine the shear
strength
Dr. Mohammad Suliman Abuhaiba, PE
April 19, 2014 39
Coulomb-Mohr Theory

Example 5-2
A 25-mm-diameter shaft is statically torqued
to 230 N・m. It is made of cast 195-T6 aluminum, with a yield strength in tension of
160 MPa and a yield strength in
compression of 170 MPa. It is machined to
final diameter. Estimate the factor of safety
of the shaft.
Dr. Mohammad Suliman Abuhaiba, PE

Example 5-3 A certain force F applied at D near the end
of the 15-in lever shown in Fig. 5–16, which is
quite similar to a socket wrench, results in
certain stresses in the cantilevered bar
OABC. This bar (OABC) is of AISI 1035 steel,
forged and heat-treated so that it has a
minimum (ASTM) yield strength of 81 kpsi. We
presume that this component would be of
no value after yielding. Thus the force F
required to initiate yielding can be regarded
as the strength of the component part. Find
this force. Dr. Mohammad Suliman Abuhaiba, PE

Example 5-3
Dr. Mohammad Suliman Abuhaiba, PE
Fig. 5−16
Example 5-4
The cantilevered tube shown in Fig. 5–17 is
to be made of 2014 aluminum alloy
treated to obtain a specified minimum
yield strength of 276 MPa. We wish to
select a stock-size tube from Table A–8
using a design factor nd = 4. The bending
load is F = 1.75 kN, the axial tension is P =
9.0 kN, and the torsion is T = 72 N・m. What is the realized factor of safety?
Dr. Mohammad Suliman Abuhaiba, PE

Example 5-4
Dr. Mohammad Suliman Abuhaiba, PE
Fig. 5−17

Failure Theories for Brittle Materials
Experimental data indicates some
differences in failure for brittle materials.
Failure criteria is generally ultimate
fracture rather than yielding
Compressive strengths are usually larger
than tensile strengths
Dr. Mohammad Suliman Abuhaiba, PE
April 19, 2014 45
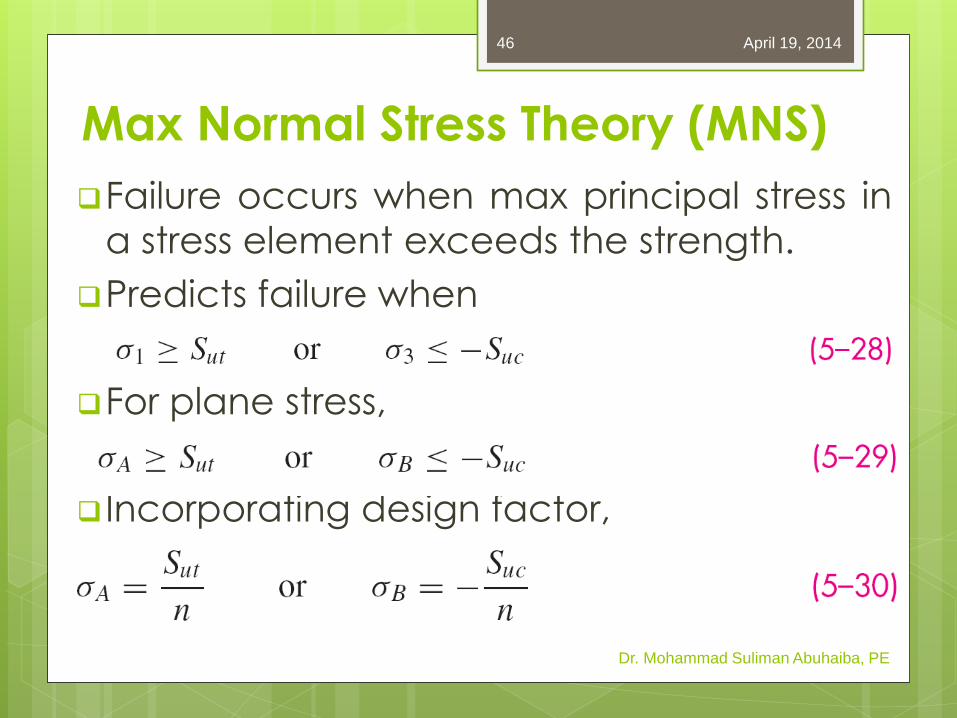
Max Normal Stress Theory (MNS)
Failure occurs when max principal stress in
a stress element exceeds the strength.
Predicts failure when
For plane stress,
Incorporating design factor,
Dr. Mohammad Suliman Abuhaiba, PE
April 19, 2014 46

Unsafe in part of
fourth quadrant
Not
recommended for
use
historical
comparison
Dr. Mohammad Suliman Abuhaiba, PE
Fig. 5−18
April 19, 2014 47
Max Normal Stress Theory (MNS)

Failure equations dependent on quadrant
Quadrant condition Failure criteria Equation No.
Brittle Coulomb-Mohr
Dr. Mohammad Suliman Abuhaiba, PE
April 19, 2014 48

Failure equations dependent on quadrant
Brittle Coulomb-Mohr
Dr. Mohammad Suliman Abuhaiba, PE
Fig. 5−14
April 19, 2014 49

Brittle Failure Experimental Data
Coulomb-Mohr is
conservative in
4th quadrant
Modified Mohr
criteria adjusts to
better fit the
data in the 4th
quadrant
Dr. Mohammad Suliman Abuhaiba, PE
Fig. 5−19
April 19, 2014 50

Quadrant condition Failure criteria Equation No.
Modified-Mohr
Dr. Mohammad Suliman Abuhaiba, PE
April 19, 2014 51

Example 5-5
Consider the wrench in Ex. 5–3, Fig. 5–16, as
made of cast iron, machined to dimension.
The force F required to fracture this part can
be regarded as the strength of the
component part. If the material is ASTM
grade 30 cast iron, find the force F with
a. Coulomb-Mohr failure model.
b. Modified Mohr failure model.
Dr. Mohammad Suliman Abuhaiba, PE

Example 5-5
Dr. Mohammad Suliman Abuhaiba, PE
Fig. 5−16

Selection of
Failure Criteria
Dr. Mohammad Suliman Abuhaiba, PE
April 19, 2014 54