chapter 5 hydrodesulphurization of thiophene
TRANSCRIPT

ReactorSTM : imaging catalysts under realistic conditionsHerbschleb, C.T.
CitationHerbschleb, C. T. (2011, May 10). ReactorSTM : imaging catalysts under realistic conditions.Casimir PhD Series. Retrieved from https://hdl.handle.net/1887/17620 Version: Not Applicable (or Unknown)License: Leiden University Non-exclusive licenseDownloaded from: https://hdl.handle.net/1887/17620 Note: To cite this publication please use the final published version (if applicable).

Chapter 5
Hydrodesulphurization ofthiophene
5.1 Hydrotreating: industry and research
The refinement of crude oil is one of the cornerstones of modern society. Inthis chemical process, the crude oil is converted into transportation fuels, suchas gasoline and diesel oil. An important step in oil refining is the catalytichydrotreating of liquid petroleum fractions, which are obtained after distil-lation of the crude oil. During catalytic hydrotreating, the hetero-atoms N,S, and O are removed from the petroleum fractions. During the combustionof the carbohydrates containing these elements, SO2 and NOx are formed,which are the main contributors to the formation of acid rain. Furthermore,these types of carbohydrates have a detrimental effect on the transition-metalbased catalysts used in the further refining processes and in car exhausts. Inaddition, hydrotreating converts olefins and aromatics into saturated carbo-hydrates, which burn more cleanly (i.e. fully to CO2 and H2O). The annualsale of hydrotreating catalysts is 10% of the total global catalyst market,which emphasizes the importance of hydrotreating. In short, the hydrotreat-ing catalyst consists of CoMo, NiMo, and NiW sulfides, dispersed on a highlyporous γ-alumina support. CoMoS is the catalyst for desulphurization andNiMoS for denitrogenation and hydrogenation, and in one of the processes,NiWS assists in hydrocracking [140, 141].
Throughout the years, the hydrotreating catalysts have drastically im-proved, which is undoubtedly partly thanks to a contribution of scientificresearch. The main drive for this drastic improvement was legislation in theEuropean Union and the United States. Up to now, European legislation

84 Hydrodesulphurization of thiophene
decreed six emission standards, starting from the end of the eighties to set-ting maxima to the emission of CO, NOx, unburnt hydrocarbons, and soot,to improve the air quality [132]1. Additionally, to decrease the SO2 emis-sion, the maximum sulphur content for fuel was decreed to be at maximum350 ppm (diesel)/ 150 ppm (gasoline) from the year 2000, to 50 ppm from2005, and to <10 ppm (“sulphur free”) from 2009 onward. Although thesestandards have already been met, hydrodesulphurization, the hydrotreatingprocess in which sulphur is removed from hydrocarbons, is still gaining a lotof attention, for various reasons. Firstly, to meet this ultra low sulphur stan-dard, deep desulphurization of liquid petroleum fractions is necessary. Crudeoil contains a large variety of organosulphur compounds, including thiols(R-S), sulfides (R-S-R), and aromatic heterocycles called thiophenes [133].Within the group of thiophenes, the larger molecules, such as, for instance,4,6-dimethyldibenzothiophene (C12H8S), are the real challenge to desulphur-ize, because they exhibit steric hindrance with respect to the active sites ofthe catalyst [134, 135], decreasing their reactivity towards desulphurization,as is illustrated in figure 5.1. Deep desulphurization means to desulphurizethese types of molecules. With an increasing demand for light fuels such asdiesel, refineries have increased their production of these fuels by crackingincreasingly heavy feedstocks, which contain more of these large thiophenes.In addition, oil fields at different geological locations differ in sulphur con-tent, which can be up to 5% in weight2; new oil fields, to be exploited inthe future, are foreseen to contain, on average, more sulphur. Secondly,the reaction mechanisms for all hydrotreating catalysts are believed to bequite similar, since their structure is more or less the same. Legal standardsfor NOx emission are still being intensified, meaning that the hydrodenitro-genation catalyst is still under pressure for improvement. Understandingthe hydrodesulphurization reaction also assists improvement of the hydro-denitrogenation catalyst. And the economics of the hydrodesulphurization
1Euro 6, which should be met in 2014, sets the following emission standards for dieseland gasoline passenger cars (in g/km). Light commercial vehicles have similar standards[132].
CO HC HC+NOx NOx PMDiesel 0.5 - 0.17 0.08 0.005
Gasoline 1.0 0.10 - 0.06 0.005
2Five examples of crude oil from different geological orientations, in combination withtheir sulphur content (low sulphur content is “sweet” oil; high sulphur content is “sour”oil) are [136–138]:
Oil type S contentWest Texas Intermediate 0.24%
Brent Blend 0.37%Dubai Crude (Fateh) 2%
Tia Juana heavy 2.82%Boscan 5.4%

5.1 Hydrotreating: industry and research 85
play a role in catalysis development. Currently, a typical plant heats a feed-stock, mixed with a high amount of hydrogen (50-100 bar), to a temperaturebetween 300 and 400, after which it is exposed to a fixed-bed reactor,containing highly dispersed catalytic nano-particles supported on γ-alumina.The exact combination of temperature and pressure depends on the sulphurcontent of the crude oil. Generally, the high temperature is needed to breakthe strong S-bonds, whereas the high hydrogen pressure is needed to preventthe catalyst from sulphur saturation. Hydrogen is expensive, and elevatedtemperatures cause the catalyst to age more quickly by coking and sintering– fundamental insights into the action of the catalyst might lead to loweroperational temperatures and pressures [139–144].
Figure 5.1: Various thiophene components which can be found in crude oil.The larger molecules are more difficult to desulphurize, because of sterichindrance [134, 135].
5.1.1 Catalyst structure and reactivity: Literature
The development of the high-quality catalyst used in today’s desulphuriza-tion plants, molybdenum disulphide nano-crystallites, with cobalt as a pro-moter, was supported by extensive scientific research on this catalytic system.Direct and indirect insights into the structure and activity were gained byexperimental studies, including gas chromatography [147], low energy elec-tron diffraction (LEED) [148], Auger electron spectroscopy (AES) [148], STM[149–154], X-Ray crystallography [155], elastic scattering quantum chemistry,extended X-ray adsorption fine-structure spectroscopy (EXAFS) [156], andscanning electron microscopy; theoretical studies include electronic structurecalculations [157–159, 164–166]. In these research efforts, both the non-promoted and the cobalt-promoted MoS2 crystallites have been investigated.
86 Hydrodesulphurization of thiophene
Amongst the most important findings were the active sites of the catalyst:the edges, rims, and corners of the crystallites. In contrast, the basal planesexhibit no reactivity. Steps in the activated reaction cycle include the bind-ing of reactants and reaction intermediates to the rims and sulphur vacanciesin the edges; the formation of sulphur vacancies at the edges is favored, sincethe sulphur atoms are less strongly bound there, with respect to the onesin the basal plane. In addition, edge and rim positions provide a betteraccessibility to the large organosulphur compounds than the plane. Addi-tional evidence for the activity of the edges and rims is an experimentalstudy, which has shown a direct proportional relation between the amountof edge and rim sites on a sample containing MoS2 nano-crystallites and itsreactivity. The number of edge and rim sites can be decreased by sinteringthe crystallites into bigger particles. The promoters of the catalyst, cobalt,and nickel, are believed to replace molybdenum atoms at the edges of thecrystallites, lowering the activation energy of, for example, the creation ofa sulphur vacancy [173]. They also lower the activation energy for bindingorganosulphur molecules to the basal planes of the nano-particles, after whichthe additives assist diffusion of these molecules to the active sites [151]. Themorphology of the MoS2 crystallites, which determines the number of activesites, is an important issue, which depends on the reaction conditions. Therehave been many efforts to determine the composition, electronic structure,and morphology of MoS2 nano-crystallites, in order to gain insight into themechanisms behind the activity and selectivity of the catalyst. Extensivereviews on this subject exist in the literature [134, 140, 155, 171–174, 177].This will be discussed in more detail below. The reaction mechanism hasbeen investigated by studying hydrogen and thiophene interaction; thiophenedesulphurises rather easily. Langmuir-Hinshelwood kinetics are accepted tobe the mechanism for this reaction [155]. Apart from desulphurization, sev-eral hydrogenation steps take place on the surface of the catalyst; the variousreaction pathways, in combination with the state of the edges under variousconditions, have been studied extensively by DFT, and are supported by exsitu STM studies [145, 153, 175–177]. These will also be described in moredetail in the paragraphs below.
Usually, unpromoted MoS2 is used as a starting point for models of thehydrodesulphurization catalyst, since in situ EXAFS has shown that the cat-alysts used ordinarily consist of MoS2 crystallites, with a size of 10 to 20 A,after sulphidation at 300 to 400 [182]. Several STM studies have resolvedthese nano-particles atomically, providing valuable information about theirmorphology and edge terminations [142, 145, 153]. Figure 5.2 shows thebasic structure of MoS2. The crystallites consist of layered S-Mo-S slabs,

5.1 Hydrotreating: industry and research 87
Figure 5.2: (A) A top view of a MoS2 crystallite under reaction conditions; inthis case the shape is a deformed hexagon [164, 178], rather than a triangle,as is the case under UHV or H2S rich conditions [145]. The (0001) plane isindicated. (B) A 3D rendition of a MoS2 crystallite, showing two possibleedge terminations: a (1010) S edge and a (1010) Mo edge. (C) A side viewof a single layer S-Mo-S slab; the atoms are hexagonally arranged. Theinteratomic distance is 3.15 A[183]. (D) A unit cell of 2H-MoS2. The Mo-Modistance between the two layers is 6.15 A[183]. (E) An STM image obtainedby Helveg et al. [145] resolving a triangular MoS2 crystallite on Au(111). Abright rim following the perimeter of the crystallite can be distinguished.
in which the atoms are arranged hexagonally in (0001) planes. In both thesulphur layers and the molybdenum layer, the interatomic distance is 3.15A. The molybdenum layer is trigonal-prismatically oriented with respect tothe sulphur layers above and below, which span 3.16 A, the thickness of asingle MoS2 slab. Multiple slabs are stacked in the same way as graphite,and are held together by Van der Waals interactions. Since this interactionis weak, one of the uses of MoS2 is that of a lubricant. In molybdenite, thenatural form of MoS2, the second row is shifted by half, with respect to thefirst layer, creating a unit cell as depicted in figure 5.2 D. Here the distancebetween the two metal layers is 6.15 A. STM images from earlier work haverevealed a bright rim of high electron density, which follows the perimeterof the crystallites. This is attributed to the existence of localized electronicstates on the edges. An example from the work of Helveg et al. [145] is shownin figure 5.2 E, illustrating this bright rim. Their studies concluded that theedge states are one-dimensional, localized perpendicular to the edges, but

88 Hydrodesulphurization of thiophene
delocalized parallel to the edges [140, 143, 145, 171, 184, 185].
As can be seen in figure 5.2 B, there are two natural edge terminations:an (1010) S edge and an (1010) Mo edge. Initially, after preparing the MoS2
crystallites under high sulphiding conditions (pH2S ≫ pH2), previous STMstudies in ultrahigh vacuum have shown that the crystallites exhibit a trian-gular structure, with the bright rim along the edges, as shown in figure 5.2E. The triangular structure indicates that, under these conditions, one of theedges is favored above the other. By combining DFT studies with the STMresults obtained, it was determined to be the (1010) Mo edge, in which theuncoordinated molybdenum atoms at the edges are decorated with sulphurdimers (fig. 5.3 C). Figure 5.3 B shows a different possible Mo edge termina-tion, occurring under different environmental conditions: the 50% S coveredMo edge. Figure 5.3 A shows the bare Mo edge as reference. The bright rimis believed to correspond to metallic states occurring at the Mo edges of thecrystallites, which in itself is a semiconductor [145, 153, 158–160]. The brightrim is believed to play a key role in the reaction mechanism, to be discussedbelow. The Mo edge is not, however, always the most stable configuration:there is a size effect [175]. An S:Mo ratio in the crystallites larger thanapproximately 3:1 seems to be energetically disfavored, leading to morpho-logical transitions of the crystallites to lower the S:Mo ratio. This happensfor small clusters, where the number of atoms along the edge n ≤ 6, in whichthe sulphur excess relative to the bulk is relatively large with respect to Moedges, which are decorated with sulphur dimers. The change in configura-tion for the smaller particles translates into triangular crystallites, exhibitingthe (1010) S edges instead of the Mo edges. For even smaller clusters, theS edges undergo a transition from fully sulphided to 75% S coverage [175].Since the Mo edge differs from the S edge, this size effect is predicted to havean influence on the reactivity of the catalyst. In the STM studies mentioned,two types of crystallites were distinguished, defined as type I and type IIcrystallites. Type I crystallites consist of single slabs of MoS2, whereas typeII crystallites comprise multiple MoS2 slabs. At annealing temperatures Ta
(see section 5.2), during preparation below 673 K, only type I crystallites areformed, whereas at higher Ta, also type II crystallites have been observed[145]. Another effect, observed at higher temperatures, is the sintering ofsmaller crystallites into larger ones, which accumulate at the steps on theAu(111) substrate [142].
When the crystallites are prepared under more reducing conditions, i.e.a larger pH2 : pH2S ratio, deformed hexagonal crystallites are obtained, alongwith rhombic, trapezoid, and pentagonal structures [145]. In our case, the

5.1 Hydrotreating: industry and research 89
Figure 5.3: (A) A bare molybdenum edge, (B) sulphur monomers bonded tothe molybdenum edge, (C) Sulphur dimers bonded to the molybdenum edge.
crystallites were deposited under sulphiding conditions, after which they wereexposed to hydrogen, a reducing environment, in the reactor. Both the pres-ence of the Mo edge, and the S edge were observed, as will be shown in section5.4, probably in combination with adsorbed hydrogen. This indicates that,under more practical conditions, both edge terminations are present. Themolybdenum edge is accompanied by the bright rim, which, to rule out sup-port effects, is also observed when MoS2 is deposited on carbon supports[177]. On the S edge, sulphur vacancies are created, when exposed to hy-drogen; vacancy creation is also observed at the Mo edges, but only withpre-dissociated hydrogen at high temperatures [175]. The conversion of thio-phenes, in particular the sterically hindered group of dibenzothiophenes, inthe HDS process, mainly takes place via a pre-hydrogenation (HYD) route,rather than a direct desulphurization (DDS) route [179]. The edge termi-nations of the hexagonal crystallites, under HDS conditions, is predicted byDFT to consist of both Mo and S edges, with dissociated adsorbed hydrogenforming S-H groups. More specifically: (1) Mo edges with 50% S coverage,and 50% H adsorption, and (2) S edges, with 100% S coverage3 and 100% Hadsorption [160, 177, 180, 181], which is schematically depicted in figure 5.4.
Due to the various possible active edge sites, which act as adsorption sites,H donors, and activate C-S scission, there are numerous reaction pathwaysfor thiophene to react to butene or butane. The process includes various
3which, under the influence of hydrogen, will also contain sulphur vacancies

90 Hydrodesulphurization of thiophene
Figure 5.4: The edge termination of a MoS2 crystallite under HDS conditions.Left: (A) An S edge, with 100% S coverage and 100% H adsorption; (B) AnMo edge, with 50% S coverage (S monomers) and 50% H adsorption. Right:Top view of the crystallite
hydrogenation steps, and a pre-hydrogenation step. The most recent reac-tion scheme is depicted in figure 5.5, adapted from reference [176]. The greyarrows represent very slow reactions. The top part shows the reaction inter-mediates on the sulphur edge, whereas the bottom part shows the reactionintermediates on the brim (“bright rim”) sites of the molybdenum edge. Thereaction scheme, in combination with the energy barrier calculations, give afew interesting predictions. Firstly, thiophene is found to prefer adsorptionon the brim sites, whereas some of the reaction intermediates (e.g. 2,5-dihydrothiophene and cis-2-butenethiol) prefer to adsorb at a vacancy siteon the S edge. Hydrogenation and H-transfer are favored on the brim sites,whereas C-S scission can occur on both the brim sites at the molybdenumedge, and the sulphur vacancy sites at the sulphur edge. The preferential sitedepends on the reaction conditions; under reducing conditions, C-S scissionat the, in that case easily formed, S vacancies is favorable. Since desorptionand diffusion of the reaction intermediates is fairly easy, the reaction mech-anism under HDS conditions could be adsorption and pre-hydrogenation ofthiophene at the brim sites, followed by diffusion to a vacancy site, whereC-S scission takes place. A final important consideration is the regenerationof the active sites, which has a higher barrier at the S edge [143, 160, 176].

5.1 Hydrotreating: industry and research 91
Figure 5.5: A schematic reaction scheme for the desulphurization of thio-phene on either of the two edges, as defined in figure 5.4 under HDS con-ditions. The top part represents the S edge (vacancy model), whereas thebottom part represents the Mo edge (brim site model). (i) adsorption andpre-hydrogenation, (ii) hydrogenation, (iii) C-S scission (direct desulphur-ization), (iv) C-S scission in combination with hydrogenation, (v) diffusion.Grey arrows represent slow reactions [146, 176].
5.1.2 Enabling MoS2 STM studies
When studying catalysis with STM, generally a well-prepared flat single crys-tal surface of the catalytic active material is used, which then is exposed tothe particular reactants. In this case, however, one of the areas of interest isthe morphological dynamics of MoS2 nano-crystals under various conditions.Using a single MoS2 crystal would be futile. A recipe for dispersing MoS2
nano-crystallites on a conducting and chemically inert surface has been de-veloped for STM studies on this reaction system – in short, molybdenumis evaporated onto the (111) surface of gold, in the presence of an excessof H2S gas [145, 153]. Next to the inertness of bulk gold4, the herringbonereconstruction onto its (111) surface provides good nucleation sites for highlydispersed metal islands [145]. In performing STM on the nano-crystallites,the bias voltage applied between tip and sample influence the apparent heightof the crystallites. At increasing bias voltages, the apparent height asymptot-ically approaches the expected height for a single MoS2 slab, 3.15 A, whereasfor small bias voltages, the apparent height goes to zero [153]. On the otherhand, the distance between sample and tip also determines whether the cur-rent tunnels via the top sulphur layer (large distance), or directly to themolybdenum layer below (small distance). STM images in these two cases,
4Gold nano-particles are actually found to be catalytically very active for reactionssuch as CO oxidation [31–33]

92 Hydrodesulphurization of thiophene
however, are reported to be quite similar, which makes it difficult, for exam-ple, to identify an S site on the surface [150].
5.1.3 MoS2 catalysis in the ReactorSTM
The aim of this work was to study thiophene desulphurization in situ, un-der reaction conditions, with the ReactorSTMTM, in order to investigate theinfluence of the conditions on the morphology of the crystallites. This in-cluded witnessing various steps in the reaction mechanism in situ, such asthe binding of a thiophene molecule to a rim site, its conversion to reactionintermediates like thiolates, the creation of sulphur vacancies on the edges,and reaction of the intermediate species at these vacancies. To achieve this,the aforementioned recipe of depositing MoS2 on Au(111) was used, and thesurface was exposed at elevated temperatures to various mixtures of thio-phene, hydrogen, and argon, at ambient pressures. The overall reactionstudied is C4H4S + 4H2 C4H10 + H2S. Since both in preparing the cat-alyst, and performing the experiment, substances had to be used which arenot commonly used with ultrahigh vacuum equipment (H2S and thiophene),this was first performed as a pilot experiment on the ReactorSTMTM MarkI, after some system adjustments. Then, the experiment was moved to theReactorSTMTM Mark II, described in detail in chapter 25.
5.2 Preparation
5.2.1 Setup adjustments
In order to make the ReactorSTMTM compatible with the desulphurizationexperiment, adjustments had to be made at two fronts. Firstly, additions tothe preparation chamber of the UHV system were necessary, and secondly,adjustments to the gas cabinet and the STM itself had to be made, to beable to run the experiment. Both will be discussed in this section.
To form the MoS2 nano-particles, molybdenum is deposited on the sur-face, by electron beam deposition, in an H2S background. For the molyb-denum deposition, an E-beam evaporator [68] was installed on the UHVchamber, in combination with a quartz microbalance [167], for monitoringthe deposition rate. H2S was supplied to the chamber via a standard leak
5This work has been done in the framework of NIMIC [57], in cooperation with thecompany Albemarle Catalysts BV.

5.2 Preparation 93
valve. The tubing, valves, and rotary pump [168] for the H2S gas supplysystem, are all corrosion resistant.
Because one of the reactants, thiophene, is a liquid at room temperature(Tb = 84), the existing gas cabinet and parts of the ReactorSTMTM hadto be adapted, in order to offer gaseous thiophene to the MoS2 catalyst, andto prevent thiophene from condensing in the gas lines and reactor6. Further-more, clogging of the mass flow controllers, pressure regulators, and pumpshad to be prevented. Figure 5.6 shows a schematic drawing of the modifica-tions applied to the system.
Figure 5.6: (Left) A schematic drawing of the modifications applied to thegas lines and ReactorSTMTM. Left (L) of the dashed line, the equipment isat room temperature, while right (R) from the dashed line, all equipment isheated. (GM) The gas manifold, (1) thiophene flask, (2) heat bath, (3) coldtrap, (4) ice bath, (R) reactor, (7) rotary pump. (Right) A detail photographof the ReactorSTMTM, showing the heated gas lines (5) and the cartridgeheater heating the reactor (6).
Figure 5.6 schematically shows the flow path from the gas manifold (GM),via the reactor (R), back to the gas cabinet. The gas manifold supplies amixture of argon and hydrogen, which bubbles through a flask containingthiophene (1), after which it enters a teflon tube. It is possible to heat upthe thiophene, via a heat bath (2), in order to control the vapor pressure ofthiophene. This opens the possibility of changing the amount of thiophene
6The modifications were only prepared for the gas cabinet and parts of theReactorSTMTM Mark I, which is discussed in this section. For the experiments performedin the ReactorSTMTM Mark II, a separate gas cabinet was constructed, and during ex-periments, the whole STM chamber was heated to 120, in order to prevent C4H4S fromcondensing in the chamber or reactor.

94 Hydrodesulphurization of thiophene
offered to the catalyst. To the right of the dashed line in the schematic,all components are heated. The gas lines outside the UHV are heated byheating tapes [65], while the gas lines inside the vacuum system are heatedby a high resistance Cu alloy wire (R = 6.8 Ω/m) (5). The reactor is heatedby a cartridge heater (6) [169], clamped in a copper block, in order to creategood thermal contact between the heater and the reactor. Both systems areequipped with separate thermocouples, for accurate temperature monitor-ing. A rotary pump (7) was added to the inlet, to be able to pump down thereactor, in case of a severe leak of the reactor. At the end of the heated gasline, a cold trap (3), cooled by an ice bath (4), was installed, to liquify thethiophene in the exhaust line, before the exhaust continues to the gas cabinet.
5.2.2 Sample preparation
Figure 5.7: (Left) 400x400 nm2 STM image (Vb = 80 mV; It = 0.2 nA),showing the clean Au(111) surface exhibiting large terraces. (Right) A heightprofile (i), showing the monatomic step height on Au(111) to be 2.3 A.
As described in section 5.1, a gold surface, cut in the (111) direction,was chosen as a good support for MoS2 nano-particles. First, the gold sur-face was cleaned by repeated cycles of 0.6 kV Ar+ ion bombardment andannealing under UHV at 850 K. Figure 5.7 shows the surface of the preparedgold sample, which we used as a support for growing the MoS2 crystallites.STM images obtained in the hours following this image show little variation,indicating that the surface is very stable; the height profile, in figure 5.7,

5.2 Preparation 95
shows the monatomic step height of Au(111) to be 2.3 A, which is well inaccordance with the theoretical value of 2.36 A [170].
Before creating the nano-particles, the cleanliness of the gold crystal waschecked by LEED/Auger and STM. The procedure of creating the nano-particles, following the cleaning of the gold sample, is schematically depictedin figure 5.8.
Figure 5.8: The graph shows the temperature evolution of the sample duringthe MoS2 nano-particles preparation on Au(111) [142]. Ta represents thetemperature at which the sample is annealed during H2S exposure, after theevaporation of molybdenum. te is the duration of molybdenum evaporation.It is tuned such, that a coverage of 15 – 20% molybdenum is obtained.
Figure 5.8 starts with the final annealing step of the Au(111) surface at850 K, after which the sample is cooled down to 430 K, which temperatureis maintained. At this point, the UHV chamber is backfilled with H2S, at apressure of 1 · 10−6 mbar. This is done because an excess amount of sulfurshould be offered to the surface, in order to form MoS2; backfilling the UHVchamber with 1 · 10−6 mbar of H2S corresponds to one monolayer of H2Sexposure to the surface per second. The evaporation time te is chosen such,that a coverage of 15 to 20 % MoS2 nano-particles is obtained in the end; at amolybdenum flux of 70 nA, te ≈ 20 seconds. After deposition, the sample isannealed for 15 minutes at temperature Ta, which for different preparationsis between 600 K and 800 K, maintaining the H2S background. When thesample is cooled down to room temperature, the H2S valve is shut.

96 Hydrodesulphurization of thiophene
5.3 In situ HDS of C4H4S on MoS2 crystal-
lites
The first aim was to learn whether this catalytic system would be a suitablesubject for investigation with the ReactorSTM. As mentioned in the intro-duction to this chapter, it was decided to first perform this experiment onthe ReactorSTM Mark I, to discover the effects of H2S and thiophene onthe ultrahigh vacuum system. In addition, a study of the behavior of theSTM itself, under reaction conditions for this catalyst, could be done. Alsothe capability of the STM to image the MoS2 nano-crystallites, as well asthe fact whether we could obtain a measurable reaction rate with the massspectrometer, could be studied. Since the results of the pilot study on theReactorSTM Mark I proved to be positive, the step to the ReactorSTM MarkII was taken. The results obtained by both STM’s are mixed throughout thefollowing sections. The first section describes the findings on the chemicalcomposition of the crystal, using Auger electron spectroscopy. The sectioncovering the reaction kinetics is followed by the section which finishes withan in-depth discussion about the structure of the catalyst.
5.3.1 Auger electron spectroscopy
Auger electron spectroscopy (AES) provides information about the amountof certain chemical elements present on a surface. By performing AES on ourcrystal, the chemical composition of the sample, before and after preparationof the MoS2 crystallites on the Au(111) surface, and before and after expo-sure to reaction conditions, could be determined. Figure 5.9 shows four Augerspectra obtained in four different situations. Graph 5.9 A shows the spec-trum for clean Au(111). 5.9 B shows Au(111), with MoS2 evaporated ontoit, which has not been exposed to C4H4S/H2. 5.9 C shows Au(111)/MoS2
after exposure to reaction conditions. 5.9 D shows Au(111) without MoS2,after exposure to the reactants. And finally, 5.9 E shows the gold surfaceonto which an excess of molybdenum has been evaporated.
The gold peak at 69 eV was observed in all spectra, which has been usedto verify whether the sample has been placed in the electron beam. Apartfrom this, there are various differences between the spectra in figure 5.9. Theclean surface, shown in spectrum A, does not have any other peaks but thegold peak. Spectra B, C, and D all exhibit sulphur peaks at 152 eV. Inspectrum B, the sulphur signal is very weak, whereas the peaks in spectra Cand D are strongly pronounced. The sulphur peak in spectrum B comes only

5.3 In situ HDS of C4H4S on MoS2 crystallites 97
Figure 5.9: Auger spectra of Au/MoS2 in the following situations: (A) CleanAu(111), (B) MoS2 evaporated onto Au(111), (C) Au/MoS2 after C4H4S/H2
exposure, (D) Au(111) after C4H4S/H2 exposure, (E) Excess molybdenumdeposition (≈ 1 ML). The peaks used for identification are 69 eV (Au), 152eV (S), 186 eV (Mo), and 272 eV (C)
98 Hydrodesulphurization of thiophene
from the MoS2 crystallites, since the crystal has not been exposed to reactionconditions. In spectra C and D, the surface has been exposed to 1.2 bar ofthiophene and hydrogen/argon at 120. After exposure, thiophene remainson the gold surface, which can be either adsorbed or condensed – the crystalis cooled down to room temperature, prior to a transfer to the AES. Inaddition, spectra C and D also exhibit carbon peaks at 272 eV, indicatingthe presence of a carbon containing species, which could be thiophene. Thecarbon peak in spectrum C, however, shows a different kind of behavior thanthe one in spectrum D. When the bare gold surface is exposed to thiophene(D), the carbon peak is stable, whereas the carbon peak seems to disappearafter the initial Auger scan of the surface, which had been catalytically active(C). The reason for the disappearance of the carbon peak in spectrum C isnot exactly known. It could possibly be ascribed to a process of diffusionand reaction, under the influence of the electron beam, but this hypothesisneeds verification. The only spectrum in which a clear molybdenum peakcan be seen is spectrum E, in which the sample was exposed to an excess ofmolybdenum, with respect to the amount aimed for in the desulphurizationexperiments. With the quartz crystal monitor calibrated for molybdenum,it was determined that, for a full monolayer of molybdenum, an evaporationtime te (see fig. 5.8) of 3 minutes would be needed. In the case of spectrumE, the evaporation lasted for 1 minute, leading to 1/3 Mo coverage. For theseexperiments, however, the coverage aimed at was between 5 and 10 %, whichtranslated into an evaporation time between 10 and 20 seconds. In this case,the molybdenum peak at 186 eV was sufficiently low to disappear into thebackground noise.
5.3.2 Reaction kinetics
The adjustments applied to the ReactorSTMTM, as described in section 5.2,allowed a mixture of argon, hydrogen, and thiophene to be offered to thecatalytic surface in the reactor. During an experiment, the direct leak fromthe Kalrez seal to the UHV for residual gas analysis, with the QMS (chap-ter 1), was used. The amount of hydrogen offered to the surface is easy tocontrol, by altering the ratio between the mass flow controller settings forargon and hydrogen. The amount of thiophene is difficult to adjust duringan experiment. To carry this out, the vapor pressure should be increased,which is only possible by changing the temperature of the heat bath, whichis a slow process. In practice, thiophene is the limiting factor for the reactionrate in the reactor; even bubbling the smallest possible amount of hydrogen,set by the gas manifold, through the thiophene initiated no decrease of reac-tion product yield. Because of this, and the low reaction rate, it was difficult

5.3 In situ HDS of C4H4S on MoS2 crystallites 99
to conclude, from a flow experiment, whether the surface was catalyticallyactive or not. Therefore, a batch experiment was performed, by closing theinlet and exhaust valve to the reactor at a set ratio of Ar/H2/C4H4S, at atemperature of 120, and a pressure of 1.2 bar. In a batch experiment, itwas expected that the leak of the reaction products would have a differenttime evolution than those of the reactants, because the reactants were beingconsumed, whereas the products were being produced. In addition to thisexperiment, a batch control experiment was performed, using the same set-tings, but exposing the reactant mixture to a clean Au(111) surface, withoutMoS2 crystallites evaporated onto it. The outcome of both experiments areshown in figure 5.10.
Panel A, in figure 5.10, shows the evolution in time of reactants andreaction products, for the batch experiment with MoS2 crystallites on thesurface, whereas the panel B represents the control experiment. The bluishlines correspond to the reactants, hydrogen (amu 2), and thiophene (consist-ing of amu 45, 58, and 84). The reddish lines reflect the reaction products:H2S (amu 34), butane (amu 29, 43, and 58), and butene (amu 41 and amu56 (not checked)). Mass 58 corresponds both to a reactant and a product,and is green; mass 20, corresponding to doubly ionized argon, is inert andgrey. The first difference between these two graphs is the level of the reac-tion products, which, in the upper panel, are order(s) of magnitude higherthan in the control experiment, whereas the thiophene signals are more orless in the same range. There is, however, a large difference in the level ofhydrogen between the two experiments. But in the control experiment, therewas still an excess of hydrogen with respect to thiophene, and as mentionedearlier, hydrogen is not the limiting factor in these experiments. Secondly,as can be seen in the upper panel, the slopes of the masses corresponding tobutane seem to be different from the slopes of the masses corresponding tothiophene. In the control experiment, in the lower panel, this effect cannotbe seen – here the differences in slopes seem only marginal, and could be as-cribed to the fact that each type of molecule has a different leak rate into thevacuum system. Moreover, the graphs with the lowest levels approach thedetection limit of the mass spectrometer, which can be translated into thelarge variations in the measured signals. An effort to approach the differencein slopes more qualitatively, in both the real and the control experiment, isdiscussed in the next paragraph.
To determine the reactivity of the catalyst, it is necessary to know whetherthe ratios between the QMS signals are changing in time. During the batchexperiment, in addition to a reaction taking place, the reactor was also being

100 Hydrodesulphurization of thiophene
Figure 5.10: (Upper panel) The batch experiment, in which the MoS2 islandson a Au(111) support were exposed to a mixture of argon, hydrogen, andthiophene. (Lower panel) The batch experiment, in which a clean Au(111)surface was exposed to the same reactant composition. Both experimentswere performed at T = 120 and p = 1.2 bar.

5.3 In situ HDS of C4H4S on MoS2 crystallites 101
Figure 5.11: (Upper panel) The slopes of the QMS signals in the real ex-periment, corrected to the argon slope. The STM image is 100x100 nm2,with Vb = −80 mV, and It = 0.15 nA. (Lower panel) The slopes of the QMSsignals in the control experiment, corrected to argon slope. The STM imageis 100x100 nm2, with Vb = 80 mV, and It = 0.2 nA.
slowly emptied, via the small leak into the UHV system, for which a cor-rection must be made. Starting from a small example: suppose there are
102 Hydrodesulphurization of thiophene
two gases, A and B, in a volume with a ratio of A:B = 1:10. If no reac-tion between A and B is taking place, for each molecule of A leaving thevolume, 10 molecules of B will leave the volume. The time evolution of gasA and B, on a linear scale, will therefore be different. On a logarithmicscale, however, the slopes of A and B will be the same. So the first stepin determining the differences between the slopes in this experiment, was tofit an exponential function to the QMS signals, to plot these functions on alogarithmic scale, and to determine the slopes of the lines resulting from thisoperation. Next, in this experiment, there is a carrier gas, argon, which isnot participating in the reaction. The slope of argon, therefore, should be 0if there was no leak. To correct for the leak, the values of the slopes of allthe mass spectrometer signals were subtracted from the value of the slopeof the argon signal. If the outcome of this simple calculation for a certainsignal is negative, it means that more of this specific material is disappearingthan is leaking out, meaning that this material is being consumed. On theother hand, when the outcome is positive, more material is leaking out thanshould happen, meaning that this material is being created in the reactor.This operation has been done, on both the real and the control experiment, ofwhich the results are shown in figure 5.11. The color codes correspond withthose used in figure 5.10. Panel A again reflects the experiment in which thecatalyst is used; panel B matches the control experiment. A general look atthese graphs indicates that, in the upper panel, the reaction products corre-sponding to butane indeed have larger slopes, when compared to the signalscorresponding to thiophene, whereas the slopes are more or less the samein the control experiment. This supports the findings discussed in the lastparagraph. However, there are several question marks here. During the ex-periment, H2S seems to have been consumed, rather than produced – perhapsthe fact that H2S was used to create the MoS2 crystallites compromises thissignal, since H2S is probably spread throughout the system. The marginaladdition of the H2S, created during the reaction, cannot nearly compensatefor the H2S, degassing from the walls and being evacuated by the pumps.Also, despite the fact that thiophene had a negative slope, its ionized mass45 had a positive slope; this was reversed in the control experiment. In ad-dition, the signal of mass 45 was higher than the signal of mass 84 (see fig.5.10); of all the substances used, the only combination of atoms adding upto 45 was S=C-H+, which could only have originated from thiophene. Anexplanation for this is not yet available.
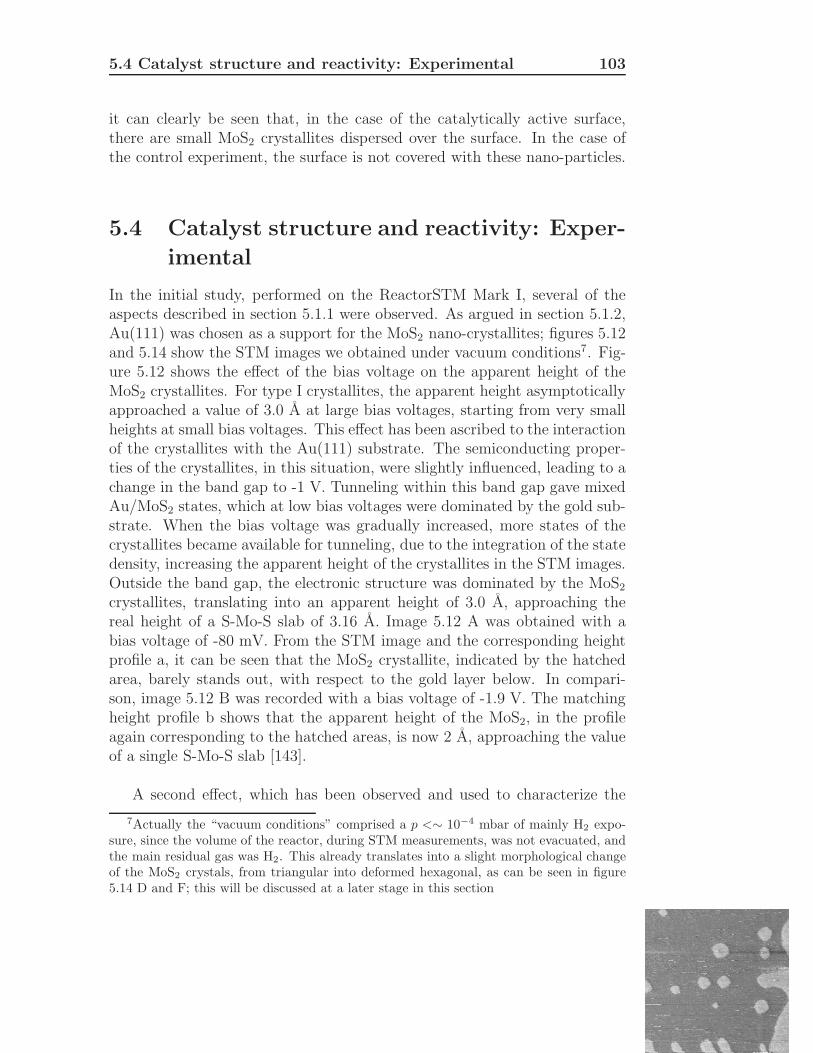
In the upper right hand corner of both graphs, in figure 5.11, an STMimage obtained by the ReactorSTM Mark I, corresponding to the situationof that particular experiment, is shown. Although the image quality is poor,
5.4 Catalyst structure and reactivity: Experimental 103
it can clearly be seen that, in the case of the catalytically active surface,there are small MoS2 crystallites dispersed over the surface. In the case ofthe control experiment, the surface is not covered with these nano-particles.
5.4 Catalyst structure and reactivity: Exper-
imental
In the initial study, performed on the ReactorSTM Mark I, several of theaspects described in section 5.1.1 were observed. As argued in section 5.1.2,Au(111) was chosen as a support for the MoS2 nano-crystallites; figures 5.12and 5.14 show the STM images we obtained under vacuum conditions7. Fig-ure 5.12 shows the effect of the bias voltage on the apparent height of theMoS2 crystallites. For type I crystallites, the apparent height asymptoticallyapproached a value of 3.0 A at large bias voltages, starting from very smallheights at small bias voltages. This effect has been ascribed to the interactionof the crystallites with the Au(111) substrate. The semiconducting proper-ties of the crystallites, in this situation, were slightly influenced, leading to achange in the band gap to -1 V. Tunneling within this band gap gave mixedAu/MoS2 states, which at low bias voltages were dominated by the gold sub-strate. When the bias voltage was gradually increased, more states of thecrystallites became available for tunneling, due to the integration of the statedensity, increasing the apparent height of the crystallites in the STM images.Outside the band gap, the electronic structure was dominated by the MoS2
crystallites, translating into an apparent height of 3.0 A, approaching thereal height of a S-Mo-S slab of 3.16 A. Image 5.12 A was obtained with abias voltage of -80 mV. From the STM image and the corresponding heightprofile a, it can be seen that the MoS2 crystallite, indicated by the hatchedarea, barely stands out, with respect to the gold layer below. In compari-son, image 5.12 B was recorded with a bias voltage of -1.9 V. The matchingheight profile b shows that the apparent height of the MoS2, in the profileagain corresponding to the hatched areas, is now 2 A, approaching the valueof a single S-Mo-S slab [143].
A second effect, which has been observed and used to characterize the
7Actually the “vacuum conditions” comprised a p <∼ 10−4 mbar of mainly H2 expo-sure, since the volume of the reactor, during STM measurements, was not evacuated, andthe main residual gas was H2. This already translates into a slight morphological changeof the MoS2 crystals, from triangular into deformed hexagonal, as can be seen in figure5.14 D and F; this will be discussed at a later stage in this section

104 Hydrodesulphurization of thiophene
Figure 5.12: Two 100 x 100 nm2 STM images of MoS2 on Au(111). For imageA, Vbias = −80 mV, It = 0.2 nA; for image B, Vbias = −1.9 V, It = 0.15 nA.
Figure 5.13: (A) A 3D impression of a MoS2 crystallite on a gold (111)substrate. (B) A side view of image (A), showing the difference in latticespacing between the crystallites and the substrate from which the Moirepattern originates, indicated as “mismatch”. (C) A top view of image (A).
MoS2 crystallites with the ReactorSTM Mark I, was the sintering and ac-cumulation of MoS2 at the Au(111) steps, occurring at higher annealingtemperatures Ta, as shown in figure 5.14. Since the resolution of the Reac-torSTM Mark I was insufficient to atomically resolve 10 to 20 A wide MoS2
crystallites, a Ta ≈ 800 K was used, in order to create these larger crystal-lites. Since the interatomic distances of unreconstructed Au(111) (2.88 A),

5.4 Catalyst structure and reactivity: Experimental 105
Figure 5.14: (A) A 400 x 400 nm2 STM image of Au(111), with MoS2 crystal-lites on it. (B) A 35 x 35 nm2 STM image. Corresponding height profile (b)shows the corrugation of the Moire pattern. (C) A 10 x 10 nm2 STM image,in which the edge states of the crystallites can be seen. The periodicity ofthe Moire pattern is 30A. All STM images in this figure were obtained atVb = −1.9 V and It = 0.15 nA.
which was believed to support the crystallites [145], and MoS2 (3.15 A) dif-fer, a Moire pattern should appear, due to the lattice mismatch. The latticemismatch is shown schematically in the ball models in figure 5.13. (A) showsan on scale 3D impression of a MoS2 crystallite on Au(111), for which a sideview and top view are shown in 5.13 B and C. In the side view, the latticemismatch, leading to the Moire pattern between Au and MoS2 is indicated bythe arrows. Three STM images are shown in figure 5.14, which were obtainedat room temperature and under exposure to the residual gases in the reactor,

106 Hydrodesulphurization of thiophene
which was not being evacuated during the STM operation. Image 5.14 A isa large scale scan, showing both sintered MoS2 crystallites, collected at theAu(111) steps, and 10 to 20 A MoS2 nano-particles, scattered on the goldterraces. The small scale images 5.14 B and C, and also figure 5.12 B, revealmore detailed information about the MoS2 structure. The nano-crystalliteson the terraces, as visible in image 5.12 B, exhibited a deformed hexagonalstructure, ascribable to the reducing conditions in the reactor volume (seefootnote 7); the residual gas consisted mainly of hydrogen. The height ofthe crystallites, indicated in the corresponding height profile in figure 5.12b, was 2 A, corresponding to a single S-Mo-S slab. Furthermore, the brightrim along the edges of the nano-crystallites was slightly visible, although itwas difficult to distinguish in individual height profiles. In image 5.14 C, thebright rim along the edge is more clearly distinguishable, and is pointed outby the blue arrow. The larger MoS2 patches, shown in images 5.14 B andC, clearly exhibit an overlayer structure, with a periodicity of 30 A. The z-corrugation of this corrugation is about 1 A, which can be seen in the heightprofile b, corresponding to figure 5.14 B. For a non-rotated hexagonal over-layer – the MoS2 overlayer is not rotated with respect to the gold substrate –with lattice constant ao on a hexagonal substrate with lattice constant as, abuckling would be expected, due to the atoms of the overlayer structure al-ternatingly being positioned at on-top sites and high-coordination sites. Thisbuckling would have a periodicity of as · ao/(ao − as) [186]. For ao = 3.15A and as = 2.88 A, this leads to a periodicity of 33.6 A, which correspondswell with the distance measured between the maxima of the Moire pattern,indicating that the structures observed in the STM images are MoS2 crys-tallites.
However, as can be clearly seen in the STM images in figure 5.12 B and5.14 B, and as mentioned in footnote 7, the shape of the crystallites on theAu(111) terraces is not triangular, but deformed hexagonal. The questionof what happens under reaction conditions needs to be addressed, since thegas composition in the reactor of the STM, during a “vacuum” experiment,consisted mainly of hydrogen, one of the reactants in the hydrodesulphur-ization process. Despite the fact that the research reported in the literature([145, 160, 175, 177, 179–181]) has not been performed under reaction con-ditions, the experimental studies include investigations of the interaction ofMoS2 crystallites with hydrogen and thiophene separately, and the theoreti-cal DFT studies elaborate on the morphology and edge terminations, underpractical HDS (reducing) conditions. These studies, as described in section5.1.1, reveal a complex interplay between the different aspects of the reactionmechanism, and the crystallites’ morphology, under different environmen-

5.4 Catalyst structure and reactivity: Experimental 107
tal conditions. The effect on the reactivity and reaction mechanism of thechanging edge termination, under the influence of the size of the crystallites,is unknown. Also, the experimental studies have not been performed in situunder reaction conditions. In addition, a change in the chemical potentialis predicted, by density functional theory, to change the active sites and thestructure of MoS2 [160]. In summary, this theoretical study investigated theeffect of the sulphur chemical potential µS on the sulphur saturation of theMo and S edges of MoS2 crystallites. For the Mo terminated edge, in thephysically realistic range, the S coverage is expected to be 50 %; only at avery high µS will there be 100 % coverage. Sulphur coverage of < 50 % isonly stable outside the physically realistic range of µS. For the S terminatededge, 100 % coverage is expected, in the realistic range for µS; formation ofS vacancies will only occur at low values of µS. Sulphur exchange betweenthe edges might occur in this situation. The absence of experimental studies,under realistic conditions, in combination with theoretical studies predictingdifferences in catalytically active sites, between vacuum and high-pressureconditions, confirms the importance of studying this reaction system in situ,under reaction conditions, which was the target with the ReactorSTM. Dur-ing the first runs of this experiment on the ReactorSTM Mark I, knowledgeof whether the reaction system was suitable for study with this type of ma-chine was required. The STM images, obtained by the ReactorSTM MarkI, resolved the MoS2 crystallites on the Au(111) surface, as shown in fig-ure 5.14. The batch experiment, as described in section 5.3.2, indicated ameasurable catalytic activity of the surface. Together, they have proven thesuitability of the ReactorSTM for this catalytic system. In addition, theH2S and thiophene, necessary for sample preparation and desulphurizationexperiments, did not prove to become a serious handicap for the ultrahighvacuum system. There remained, however, a major issue with respect to theexperiment: under reaction conditions, the tip approach was very unreliable.On many occasions, the tip did not detect a tunneling current, i.e. it eithergot stuck or the apex was covered by some insulating layer. And in most ofthe few cases when the tip did find the surface, a tip crash occurred. Oneof the possible explanations is the presence of a cold spot in the reactor; asdescribed in section 5.2, an external heating cartridge was used for heatingup the reactor, which, due to its position and the low thermal conductiv-ity of stainless steel, might not be able to heat up all parts of the reactorequally. Thiophene might condense onto a cold spot (in which “cold” meansbelow 84) on the tip holder or the tracks along which the tip holder slides,affecting the properties of the approach motor. Perhaps the acceleration re-quired to make the tip holder perform its stick-slip motions exceeded themaximum acceleration provided by the piezo element. Another possibility is
108 Hydrodesulphurization of thiophene
the presence of sulphur-containing molecules covering the tip apex, making itelectrically insulating. Additionally, the resolution of the ReactorSTM MarkI, under reaction conditions, was too poor to atomically resolve the crystal-lites, edge vacancies, and the large organic molecules adsorbed onto the Moand/or S edges; the edges would also be hard to distinguish.
All in all, the pilot experiment performed on the ReactorSTM Mark I wassuccessful in imaging and detecting reactivity, however, with poor resolutionand unreliable tip approach. Both the success, as well as the drawbacks, leadto repeating the experiment with the ReactorSTM Mark II, in which it washoped to observe the dynamics of the morphology of the crystallites, underreaction conditions, as well as the various reaction steps. An attempt to solvethe approach issue by heating up the whole SPM chamber to 110 duringSTM operation was made. The initial findings are summarized in figure 5.15.Image A and B show the clean gold surface, A on a large scale, showing theherringbone reconstruction, and B on the atomic level. The reconstructionon the Au(111) surface originates from the reduced coordination number ofthe surface atoms, which are compressed by about 5 % along the 110 direc-tion. This leads to two different domains, an fcc domain, and an hcp domainalong the 112 direction. These domains are separated by the gold atoms nearthe bridge positions of the bulk layer below, which appear as bright lines inthe STM image. The reconstruction has a 22x
√3 unit cell. On a larger scale,
these domains exhibit a zigzag pattern, with angles of 120, due to elasticinteractions. This zigzag pattern resembles a fish scale, hence the name “her-ringbone” reconstruction [145, 161, 162]. Image C, in figure 5.15, shows thegold surface when more then a monolayer of molybdenum is deposited. Thesurface is characterized by blobs, which seem to have a preference for buck-ling at the steps. From the height profile c can be seen that the difference inheight between two terraces is 6 A, which does not correspond to any integer,multiplied by the monatomic step height of Au(111)8, but does correspondto a multiple step of some kind, rather then a single step. Along the steps,“speed bumps” of accumulated material exist, also with a height of 6 A, ascan be seen in the height profile. Finally, image D shows an STM image froma successful MoS2 deposition experiment in the ReactorSTM Mark II. Thequality of the image is not very high, but the characteristic Moire patterncan be distinguished. The step height of the crystallites is 3 A, as can beseen in height profile d. Although MoS2 crystallites have been successfullycreated in this experiment, the recipe has not yet been optimized. The small
8This might arise under the influence of Au-Mo alloying, which is discussed in theappendix at the end of this chapter

5.4 Catalyst structure and reactivity: Experimental 109
Figure 5.15: STM images obtained by ReactorSTM Mark II. (A) A 100 nm2
STM image, showing a large terrace on Au(111), exhibiting the herringbonereconstruction. (B) A 2.5 nm2 STM image of atomically resolved Au(111).(C) A 25 nm2 STM image of Au(111) with > 1 monolayer of Mo deposited;c is the corresponding height profile. (D) A 10 nm2 STM image of a MoS2
crystallite on Au(111), with height profile d. Image D’ is a 110 nm2 subsectionfrom a large scan, showing the accumulation of MoS2 islands at the steps.

110 Hydrodesulphurization of thiophene
image, shown in figure 5.15 D’, is a cut-out from a large scale image, showingthat, all the MoS2 crystallites are on the edges of the Au(111) terraces, andon the terraces themselves no nano-particles can be seen. Unfortunately, ithas not been possible to continue with this experiment up to the momentof writing, after obtaining the series of STM images, including figure 5.15.This means that the aim of atomically resolving the MoS2 crystallites, andof performing high-pressure experiments lie in the near future [163].
Although the focus of this study has only been on the unpromoted MoS2
nano-crystallites, a few words should be included about the addition of themain promoters for MoS2, cobalt and nickel. Adding cobalt or nickel to thecatalyst, on its industrial support γ-alumina, the promoter can appear inthree forms. Firstly, the promoter atoms can dissolve into the γ-alumina,and secondly, cobalt can form a stable sulphide, Co8S9, on top of the sup-port. Neither of these forms are believed to influence the desulphurizationreaction rate. The third form, in which cobalt or nickel atoms replace someof the molybdenum atoms in MoS2, forming CoMoS or NiMoS, increases re-activity by an order of magnitude. It is believed that the promoter atoms,in this structure, do not affect the molybdenum edges; they do, however,replace the molybdenum atoms at the sulphur edges. The activation energyfor the creation of a sulphur vacancy, in the case of a sulphur edge, in whichthe metal atoms are replaced by cobalt or nickel, is significantly lower thanfor the sulphur edge with molybdenum [140, 187, 188]. In future experi-ments, adding these promoters to the MoS2 crystallites has been planned, tostudy their influence on the activity of the catalyst under realistic conditions.
5.5 Concluding remarks
In conclusion, two milestones have been achieved in this experiment, up tothe moment of writing. Firstly, it has been possible to successfully depositMoS2 nano-crystallites onto a Au(111) support, both with the ReactorSTMMark I and Mark II. Up to now, in both cases it has only been possible tocharacterize the crystallites by the Moire pattern, generated due to the lat-tice mismatch between Au(111) and MoS2. However, the ReactorSTM MarkII is capable of atomically resolving the Au(111) surface, which opens thepossibility of also atomically resolving the crystallites. This would be im-possible with the ReactorSTM Mark I. Secondly, the activity of the catalystunder high-pressure and high-temperature conditions has been shown, withthe combination of a batch experiment and a control experiment, using the

5.5 Concluding remarks 111
ReactorSTM Mark I. The microscope was also able to image the catalystunder these conditions, however with poor quality.
Further research is necessary, to investigate the behavior of the catalystunder high-pressure conditions, e.g. to determine which of the two edgeterminations will be dominant, and what the role of each of the edges is,during various reaction steps. In a later stage, also the effect of the promoterscobalt and nickel should also be studied in the same fashion.
Appendix: Mo-Au alloying
At the first attempts at preparing molybdenum disulfide adatom islands onthe (111) surface of gold, an unexpected, but easy to explain behavior wasobserved. Figure 5.16 shows a series of STM images, under different con-ditions. Image A and B are an example of what the STM images lookedlike, after the first MoS2 deposition attempts. As can be seen, adatom islandstructures are present at the surface, which at first suggested the presenceof MoS2 on the surface. However, these surfaces were not stable, but beganto behave like the series of STM images shown in figure 5.17. This figureshows four consecutive STM images A to D, each with a recording time ofabout 80 s. The markers I and II follow two evolving steps on the gold sur-face, throughout the imaging. As can be seen, these steps change drasticallywithin the recording time of these four images, in total about five minutes,indicating a huge mobility of the steps on the gold surface. The densityof adatom islands has significantly decreased, with respect to image A andB in figure 5.16; in the lower left hand corner of the images, some adatomisland features still can be seen, which exhibit a larger stability than thesteps on the gold surface. Apparently these are not MoS2 crystallites (or atleast stable ones) in image A and B of figure 5.16. There are a few indica-tions supporting this hypothesis. Firstly, as the height profile a2 on image Asuggests, the apparent height of the adatom structures is 2 A, which meansthese structures in this case actually cannot be MoS2. This is because thebias voltage used to obtain this image, 80 mV, is well below the band gapof the semiconducting crystallites, in which case it should yield a very lowapparent height for the crystallites, as in figure 5.12 A. The step height ofthe terraces, as indicated in the height profile a1, is about 2.5 A, which doesseem to be different from the adatom structure’s height. Next to the veryirregular shapes of the adatom structures in image B, which according tothe height profile b seem to exhibit the same step height as the terraces,vacancy islands can also be distinguished. As a reference, image C in figure

112 Hydrodesulphurization of thiophene
5.16 shows an STM image of one of the successful deposition experiments,exhibiting large MoS2 crystallites, which are recognizable from their charac-teristic Moire pattern. The step height of the Au(111) terrace here is 2.3A; the apparent height of the crystallites in this experiment were measuredto be 2 A, as shown in figures 5.12 and 5.14. Furthermore, in this case, nomobility of the Au(111) steps was observed. Image D in figure 5.16 showsthe freshly prepared Au(111) surface, before Mo/H2S exposure, in which thestep height of the terraces again is 2.5 A. In all these images, the step heightsof the terraces correspond to a single step on Au(111). This is also the casefor the steps in image A of figure 5.17, as shown in its corresponding heightprofile a. Finally, it should be mentioned that, in the situation of image Aand B of figure 5.16, molybdenum, in combination with sulphur, (probably)was not deposited on the Au(111) surface. Whenever we observed the highstep mobility, only a large series of sputtering and annealing cycles9 wouldcompletely remove this mobile step behavior, returning to the initial situa-tion of a clean Au(111) surface.
So since there has been material deposited on the gold surface, leadingto a high step mobility, the question arises as to what mechanism is behindit. The literature reports the possibility of molybdenum alloying with gold.When molybdenum is deposited on gold, it forms clusters in the elbows ofthe herringbone reconstruction. This structure is stable up to a temper-ature of 600 K, above which gold encapsulates the molybdenum, formingAu-Mo-Au sandwiches on the surface. The same happens when molybde-num is deposited at a temperature above 525 K (one paper reports alreadyhaving observed alloying at a deposition temperature of 300 K). When thealloying takes place, a large mobility of the steps on the gold surface has beenobserved. Once alloyed, exposure to atomic oxygen or sulfur can separatethe metals, ending with molybdenum oxides or sulfides on top of the surface[189–191].
What has apparently been seen, in the early experiments here, is thisalloying between the two metals, because the initially observed adatom is-lands (which could be just molybdenum, or molybdenum in combination withsome sulphur), disappear; thereafter, huge step mobility on the gold surfacewas observed. There are two possible reasons for this alloying to occur inthis case. In the initial deposition experiments, various parameters were be-ing tuned, including H2S pressure, molybdenum, and H2S exposure time,
9On the order of ten cycles were needed to get rid of the step mobility. Molybdenumis hard to get rid of.

5.5 Concluding remarks 113
Figure 5.16: (A) A 300 x 335 nm2 STM image, with height profiles a1 anda2, showing adatom island structures on Au(111); Vb = 80 mV; It = 0.2 nA.(B) A 300 x 155 nm2 STM image, with height profile b; Vb = -2 V, It =0.2 nA. (C) A 35 nm2 STM image, with height profile c, showing MoS2 onAu(111); Vb = -1.9 B, It = 0.15 nA. (D) A 100 nm2 STM image of terraceson Au(111); Vb = 80 mV, It = 0.2 nA. T = 293 K.

114 Hydrodesulphurization of thiophene
Figure 5.17: Four consecutive 100 x 100 nm2 STM images (the recording timewas ∼80 s/image), showing large step mobility. The indicated terrace stepsI and II have been followed. For image A, a corresponding height profile a isincluded. T = 393 K; Vb = -0.8 V; It = 0.2 nA.
and temperature. Under the “wrong” conditions this might lead to instableMo/MoS2 structures on the Au(111) surface, eventually leading to alloyingof the two metals. However, there is one more factor present. When startingwith the experiments involving thiophene, and still tweaking the parametersin the initial preparation steps, the alloying was no longer observed. Thisleaves a second option for destabilizing MoS2 structures: the residual gasesin the reactor, prior to thiophene exposure. The main residual gases in thereactor volume, before it was exposed to thiophene, were CO and H2. COdoes interact with MoS2, but is not expected to destroy the islands [192]. H2,on the other hand, reacts with the step edges, forming H2S, which is partof the desulphurization reaction to be studied. With no organosulphur com-pounds present to fill these vacancies, hydrogen will proceed to react awayall the sulfur, leaving bare molybdenum on gold, opening the possibility ofalloying of the two metals.
Presumabely the interaction of the residual hydrogen in the reactor withthe MoS2 nano-particles is one of the key players in these experiments, in
5.5 Concluding remarks 115
which the metals alloy. Initially, adatom islands are seen (of which, it shouldbe said, their composition is not completely certain, due to the low biasvoltage used to be able to image them, as in figure 5.16 A; it could beMoSx, just Mo, or even Au already covering Mo). Later the fingerprint ofalloying (the mobile steps) was observed. That the alloying did not takeplace directly, but only after an exposure of several hours in the reactor,could be explained by the fact that it takes hydrogen some time to reactaway all the sulfur – remember that the sample was at room temperature.Since molybdenum sulphides are stable on the gold surface, and sulphur iscapable of de-alloying gold and molybdenum, a large fraction of the sulphurwould have to be removed before alloying could begin. In addition, whenthiophene was used, alloying was no longer observed. This could mean thatwhen there is a steady supply of a sulphur containing carbohydrate, it fillsup the vacancies created by the residual hydrogen, and the islands on thesurface are stabilized. Once thiophene is in the reactor surroundings, it isvery difficult to remove, and it continues to outgas. This means that, evenwhen there is no external supply of thiophene, the remnants of the previousexperiments are enough to counteract the destabilizing effect of hydrogen.