chapter 5 gwas and meta-analysis in aging/longevity · gwas and meta-analysis in aging/longevity...
TRANSCRIPT

107
Chapter 5GWAS and Meta-Analysis in Aging/Longevity
Linda Broer and Cornelia M. van Duijn
© Springer Science+Business Media New York 2015G. Atzmon, PhD (ed.), Longevity Genes, Advances in Experimental Medicine and Biology 847, DOI 10.1007/978-1-4939-2404-2_5
C. M. van Duijn () · L. BroerDepartment of Epidemiology, Erasmus University Medical Center, Dr. Molewaterplein 50, PO-Box 2040, 3000 CA Rotterdam, Netherlandse-mail: [email protected]
L. Broere-mail: [email protected]
The Role of Genes in Longevity
In the past century, most Western countries have experienced substantial increases in life expectancy. This has been mostly due to a marked reduction in early life mor-tality during the first half of the twentieth century, followed by an almost twofold reduction in mortality at ages above 70 years in the past 50 years [1, 2]. Longevity is often defined as reaching extreme age. There is no single accepted age threshold and given the ever increasing life expectancy and the differences in life expectancy across countries, the definition is time and place dependent. At present, the ‘oldest-old’ in Western societies are often defined as individuals of 85 years and older and this cut-off has been used in genetic studies in the past [3].
However, the percentage of individuals reaching 90 years of age, or even 100 years of age, is growing enormously [4]. The proportions of individuals in a given birth cohort projected to reach 90 or 100 years of age are shown in Fig. 5.1 [4]. The figure illustrates that the proportion of individuals who survive to age 90 has increased dramatically over the past century. When we consider the elderly of today (born between 1919–1929), less than 5 % of the women and men reached age 90 years. Also for more recent cohorts (now middle age), reaching 90 years of age is still relatively rare, and reaching 100 years of age even more so. For example, 10 % of women from the 1959 birth cohort are projected to reach 90 years of age, and only 0.3 % are projected to reach 100 years of age [4]. How difficult it is to reach age 100 can be seen by comparing the likelihood of making it from birth to age 90 with the likelihood of making it from age 90 to age 100. These are similar implying surviving from 90 to 100 years is as difficult as living from 0 to 90 years [4].

108 L. Broer and C. M. van Duijn
Without a doubt, control of environmental risk factors (from hygiene to diet) and improved treatment of major diseases (cardiovascular and cancer) underlie the increase in life expectancy. Yet genes play a key role in reaching extreme age as shown by the fact that the heritability of age at death is higher at more exceptional thresholds for longevity [5]. Heritability estimates of age at death, range from 20 to 30 % in twin registries [6, 7] and 15–25 % in population-based samples [8, 9]. However, studying the birth cohort up that reached old age now, the heritability of surviving past 85 years was found to be 40 % [10]. This is very similar to the heri-tability of other complex genetic traits such as blood pressure, lipids and diabetes [11, 12].
Fig. 5.1 Survivorship to ages 90 years (a) and 100 years (b) for the 1900–2007 birth cohorts by sex, United States. (Data were obtained from Arias [3])

1095 GWAS and Meta-Analysis in Aging/Longevity
Despite the high heritability, in the previous century there has been little prog-ress in unraveling the genetics of longevity. As has been the case for other diseases, candidate genes studies have limited few genes that have been replicated including apolipoprotein E and FOXO3a nor have family based studies yielded genes with major impact in the population [13–18]. Interestingly known age-related disease-causing genes have not been found to be associated with longevity [19, 20], sug-gesting there are specific domains in the genome that determine longevity beyond those that determine morbidity in the population. Genome-wide association studies (GWAS) have been able to identify hundreds of genetic loci for traits with similar or even lower heritability. The basic rationale of GWAS is that thousands to millions of genetic variants (single nucleotide polymorphisms (SNPs)) are measured across the genome and then associated to the phenotype of interest. Here we review the GWAS for longevity, distinguishing those using 85+ or 90+ as a cut-off and those studying more extreme phenotypes (100+ or centenarians). Further, we discuss an alternative approach to genetic studies of longevity using time to death as an outcome.
GWAS on Longevity (85+)
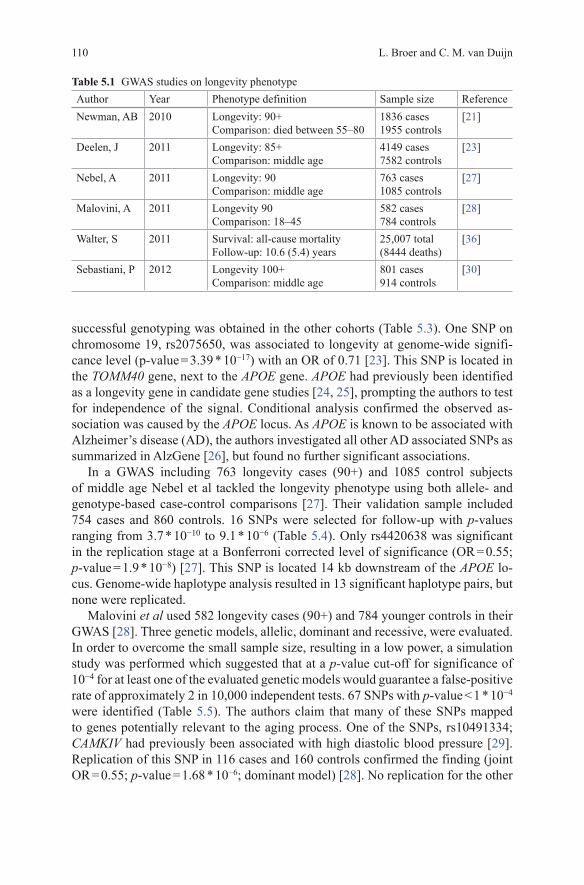
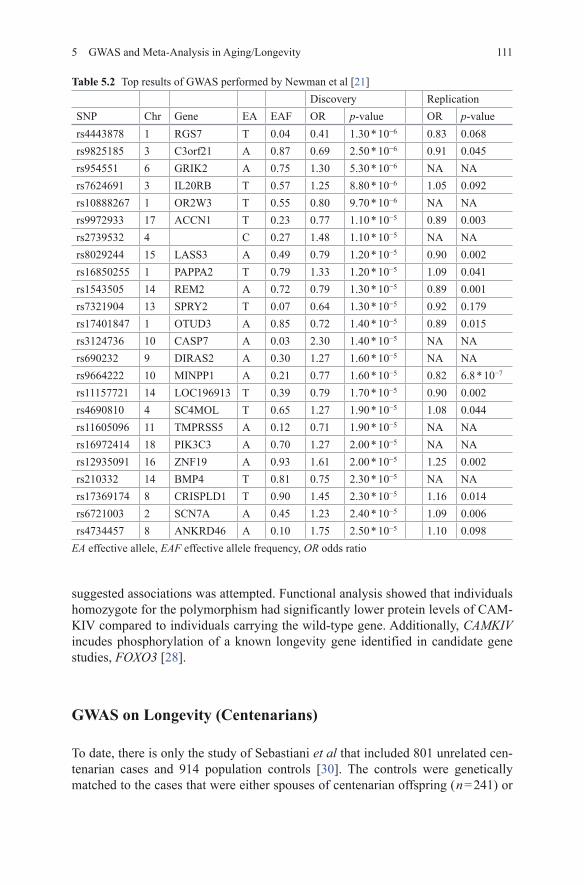
The Table 5.1 lists all currently performed GWAS on longevity, with their phe-notype definition and sample sizes. The first GWAS investigating the longevity phenotype was by Newman et al [21]. This study consisted of 1836 individuals who achieved longevity, defined as 90 years and over. The comparison group consisted of 1955 individuals who died between 55 and 80 years of age [21]. The youngest age in the comparison group was set to match the minimum age at enrollment in one of the included cohorts. The maximal age at death in the comparison group was set arbitrarily at 80 years of age to include the majority of deaths, while excluding those individuals who survived far beyond average life expectancy for their respec-tive birth cohort and nearly reached longevity [21]. None of the SNP-longevity associations achieved genome-wide significance ( p-value < 5 * 10−8). 24 indepen-dent regions with suggestive association levels ( p-value < 1 * 10−4) were identified (Table 5.2). 16 SNPs were successfully genotyped in a second stage including two independent cohorts. Only one of the SNPs had a smaller p-value after including the replication cohorts in the meta-analysis. This SNP, rs9664222, is located approxi-mately 25 kb from the MINPP1 gene and had an OR(odds Ratio) of 0.82 for the minor allele in the final meta-analysis ( p-value = 6.77 * 10−7) [21]. MINPP1 encodes multiple inositol polyphosphate phosphatase 1, which is an enzyme that removes 3-phosphate from inositol phosphate substrates. MINPP1-deficient mice have no obvious defects, though targeted deletion in vitro is associated with slowed cellular proliferation [22].
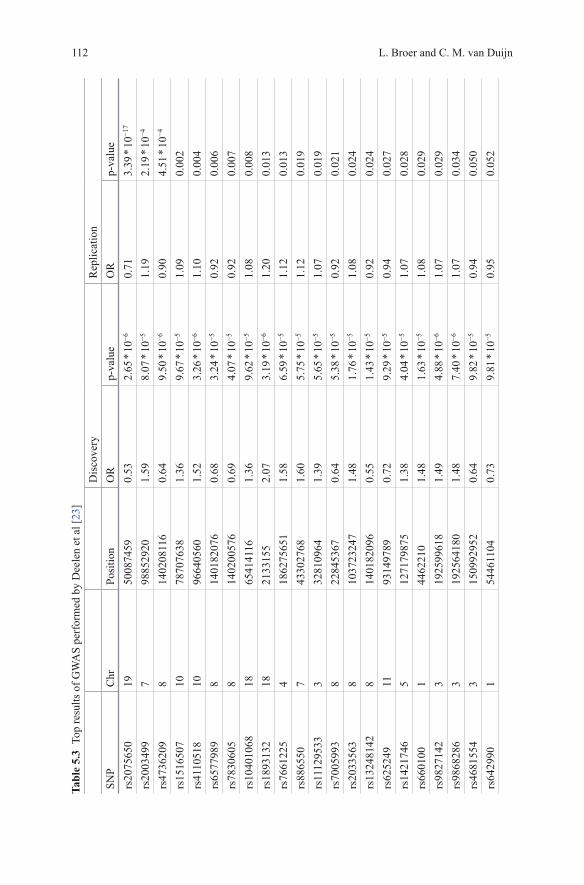
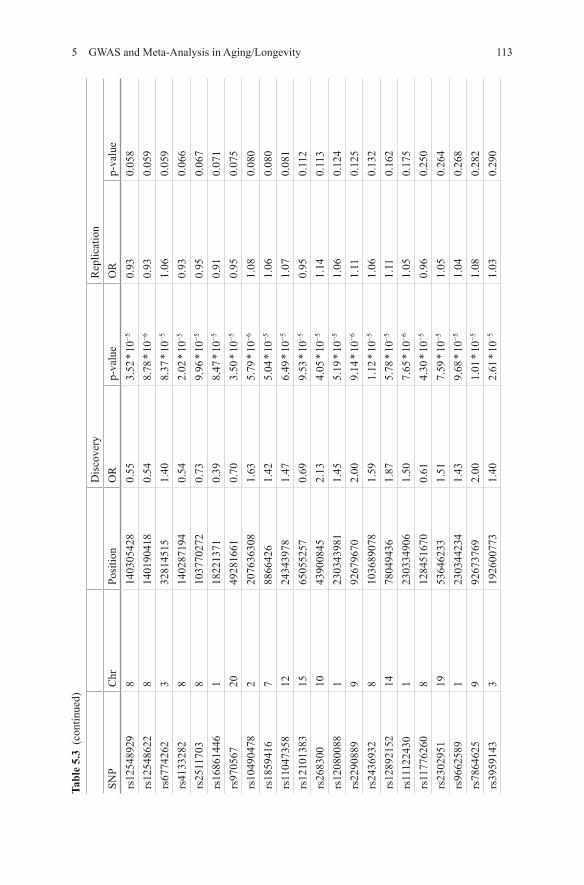
Deelen et al published a longevity GWAS consisting of 4149 individuals over 85 years of age and a comparison group of 7582 younger controls [23]. In a first round including only one study (403 longevity cases and 1670 controls) no genome-wide significant SNPs were identified. For 58 out of 62 SNPs reaching a p-value <1 * 10−4
110 L. Broer and C. M. van Duijn
successful genotyping was obtained in the other cohorts (Table 5.3). One SNP on chromosome 19, rs2075650, was associated to longevity at genome-wide signifi-cance level (p-value = 3.39 * 10−17) with an OR of 0.71 [23]. This SNP is located in the TOMM40 gene, next to the APOE gene. APOE had previously been identified as a longevity gene in candidate gene studies [24, 25], prompting the authors to test for independence of the signal. Conditional analysis confirmed the observed as-sociation was caused by the APOE locus. As APOE is known to be associated with Alzheimer’s disease (AD), the authors investigated all other AD associated SNPs as summarized in AlzGene [26], but found no further significant associations.
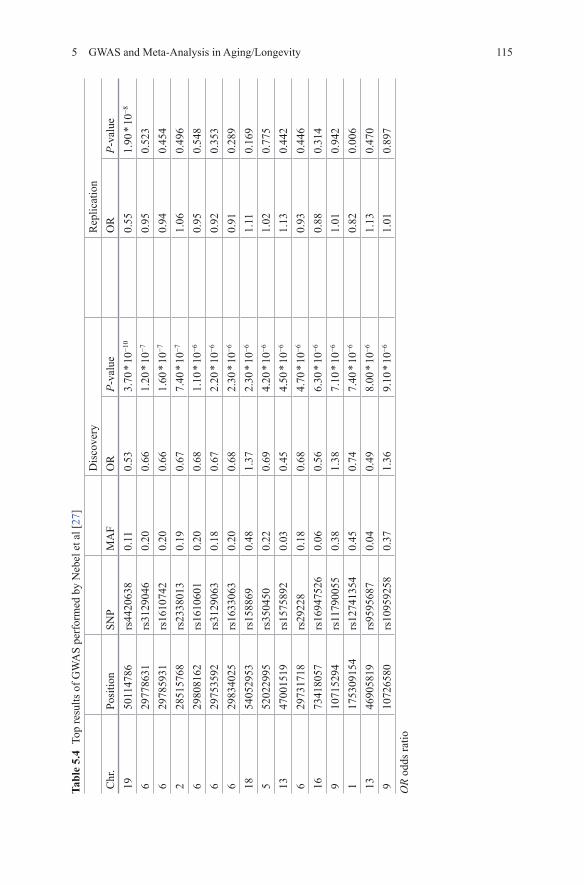
In a GWAS including 763 longevity cases (90+) and 1085 control subjects of middle age Nebel et al tackled the longevity phenotype using both allele- and genotype-based case-control comparisons [27]. Their validation sample included 754 cases and 860 controls. 16 SNPs were selected for follow-up with p-values ranging from 3.7 * 10−10 to 9.1 * 10−6 (Table 5.4). Only rs4420638 was significant in the replication stage at a Bonferroni corrected level of significance (OR = 0.55; p-value = 1.9 * 10−8) [27]. This SNP is located 14 kb downstream of the APOE lo-cus. Genome-wide haplotype analysis resulted in 13 significant haplotype pairs, but none were replicated.
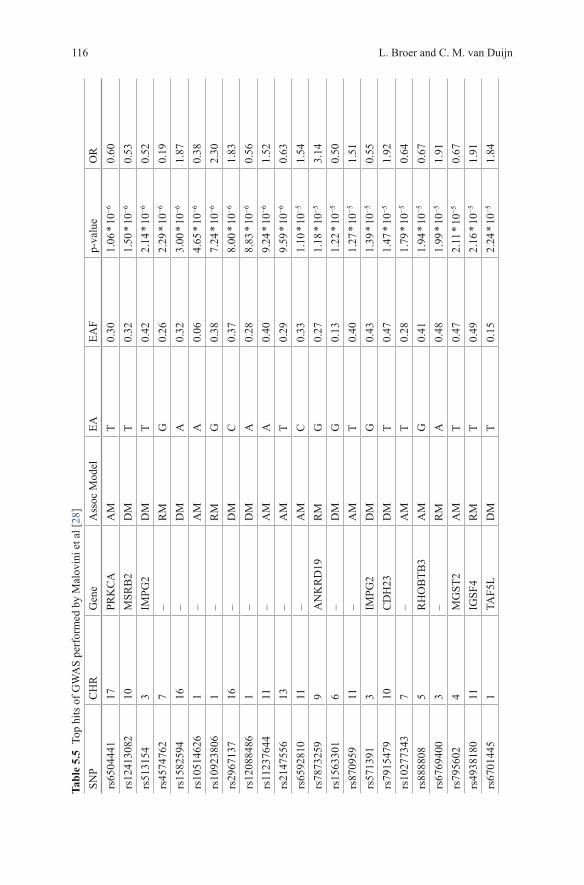
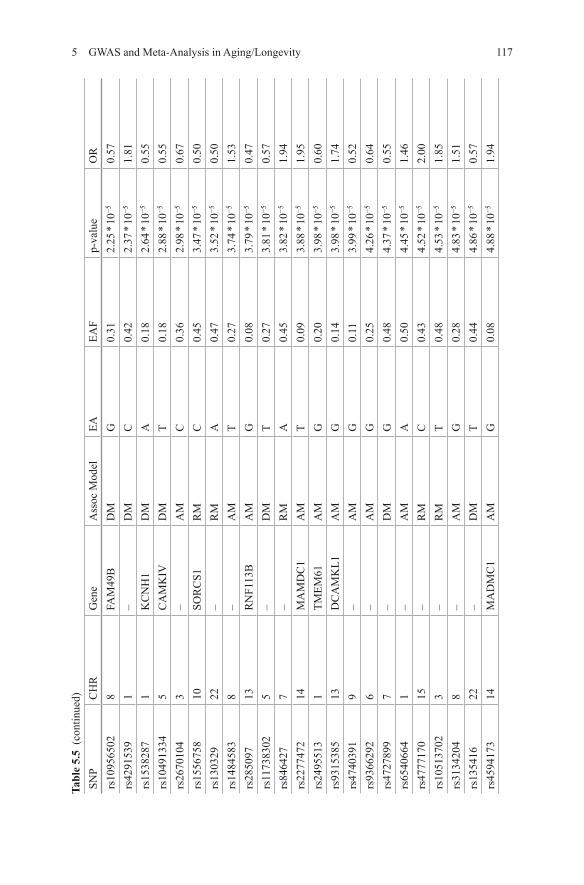
Malovini et al used 582 longevity cases (90+) and 784 younger controls in their GWAS [28]. Three genetic models, allelic, dominant and recessive, were evaluated. In order to overcome the small sample size, resulting in a low power, a simulation study was performed which suggested that at a p-value cut-off for significance of 10−4 for at least one of the evaluated genetic models would guarantee a false-positive rate of approximately 2 in 10,000 independent tests. 67 SNPs with p-value < 1 * 10−4 were identified (Table 5.5). The authors claim that many of these SNPs mapped to genes potentially relevant to the aging process. One of the SNPs, rs10491334; CAMKIV had previously been associated with high diastolic blood pressure [29]. Replication of this SNP in 116 cases and 160 controls confirmed the finding (joint OR = 0.55; p-value = 1.68 * 10−6; dominant model) [28]. No replication for the other
Table 5.1 GWAS studies on longevity phenotypeAuthor Year Phenotype definition Sample size ReferenceNewman, AB 2010 Longevity: 90+
Comparison: died between 55–801836 cases1955 controls
[21]
Deelen, J 2011 Longevity: 85+Comparison: middle age
4149 cases7582 controls
[23]
Nebel, A 2011 Longevity: 90Comparison: middle age
763 cases1085 controls
[27]
Malovini, A 2011 Longevity 90Comparison: 18–45
582 cases784 controls
[28]
Walter, S 2011 Survival: all-cause mortalityFollow-up: 10.6 (5.4) years
25,007 total(8444 deaths)
[36]
Sebastiani, P 2012 Longevity 100+Comparison: middle age
801 cases914 controls
[30]
1115 GWAS and Meta-Analysis in Aging/Longevity
suggested associations was attempted. Functional analysis showed that individuals homozygote for the polymorphism had significantly lower protein levels of CAM-KIV compared to individuals carrying the wild-type gene. Additionally, CAMKIV incudes phosphorylation of a known longevity gene identified in candidate gene studies, FOXO3 [28].
GWAS on Longevity (Centenarians)
To date, there is only the study of Sebastiani et al that included 801 unrelated cen-tenarian cases and 914 population controls [30]. The controls were genetically matched to the cases that were either spouses of centenarian offspring ( n = 241) or
Table 5.2 Top results of GWAS performed by Newman et al [21]Discovery Replication
SNP Chr Gene EA EAF OR p-value OR p-valuers4443878 1 RGS7 T 0.04 0.41 1.30 * 10−6 0.83 0.068rs9825185 3 C3orf21 A 0.87 0.69 2.50 * 10−6 0.91 0.045rs954551 6 GRIK2 A 0.75 1.30 5.30 * 10−6 NA NArs7624691 3 IL20RB T 0.57 1.25 8.80 * 10−6 1.05 0.092rs10888267 1 OR2W3 T 0.55 0.80 9.70 * 10−6 NA NArs9972933 17 ACCN1 T 0.23 0.77 1.10 * 10−5 0.89 0.003rs2739532 4 C 0.27 1.48 1.10 * 10−5 NA NArs8029244 15 LASS3 A 0.49 0.79 1.20 * 10−5 0.90 0.002rs16850255 1 PAPPA2 T 0.79 1.33 1.20 * 10−5 1.09 0.041rs1543505 14 REM2 A 0.72 0.79 1.30 * 10−5 0.89 0.001rs7321904 13 SPRY2 T 0.07 0.64 1.30 * 10−5 0.92 0.179rs17401847 1 OTUD3 A 0.85 0.72 1.40 * 10−5 0.89 0.015rs3124736 10 CASP7 A 0.03 2.30 1.40 * 10−5 NA NArs690232 9 DIRAS2 A 0.30 1.27 1.60 * 10−5 NA NArs9664222 10 MINPP1 A 0.21 0.77 1.60 * 10−5 0.82 6.8 * 10−7
rs11157721 14 LOC196913 T 0.39 0.79 1.70 * 10−5 0.90 0.002rs4690810 4 SC4MOL T 0.65 1.27 1.90 * 10−5 1.08 0.044rs11605096 11 TMPRSS5 A 0.12 0.71 1.90 * 10−5 NA NArs16972414 18 PIK3C3 A 0.70 1.27 2.00 * 10−5 NA NArs12935091 16 ZNF19 A 0.93 1.61 2.00 * 10−5 1.25 0.002rs210332 14 BMP4 T 0.81 0.75 2.30 * 10−5 NA NArs17369174 8 CRISPLD1 T 0.90 1.45 2.30 * 10−5 1.16 0.014rs6721003 2 SCN7A A 0.45 1.23 2.40 * 10−5 1.09 0.006rs4734457 8 ANKRD46 A 0.10 1.75 2.50 * 10−5 1.10 0.098
EA effective allele, EAF effective allele frequency, OR odds ratio
112 L. Broer and C. M. van Duijn
D
isco
very
Rep
licat
ion
SNP
Chr
Posi
tion
OR
p-va
lue
OR
p-va
lue
rs20
7565
019
5008
7459
0.53
2.65
* 10
−60.
713.
39 *
10−1
7
rs20
0349
97
9885
2920
1.59
8.07
* 10
−51.
192.
19 *
10−4
rs47
3620
98
1402
0811
60.
649.
50 *
10−6
0.90
4.51
* 10
−4
rs15
1650
710
7870
7638
1.36
9.67
* 10
−51.
090.
002
rs41
1051
810
9664
0560
1.52
3.26
* 10
−61.
100.
004
rs65
7798
98
1401
8207
60.
683.
24 *
10−5
0.92
0.00
6rs
7830
605
814
0200
576
0.69
4.07
* 10
−50.
920.
007
rs10
4010
6818
6541
4116
1.36
9.62
* 10
−51.
080.
008
rs18
9313
218
2133
155
2.07
3.19
* 10
−61.
200.
013
rs76
6122
54
1862
7565
11.
586.
59 *
10−5
1.12
0.01
3rs
8865
507
4330
2768
1.60
5.75
* 10
−51.
120.
019
rs11
1295
333
3281
0964
1.39
5.65
* 10
−51.
070.
019
rs70
0599
38
2284
5367
0.64
5.38
* 10
−50.
920.
021
rs20
3356
38
1037
2324
71.
481.
76 *
10−5
1.08
0.02
4rs
1324
8142
814
0182
096
0.55
1.43
* 10
−50.
920.
024
rs62
5249
1193
1497
890.
729.
29 *
10−5
0.94
0.02
7rs
1421
746
512
7179
875
1.38
4.04
* 10
−51.
070.
028
rs66
0100
144
6221
01.
481.
63 *
10−5
1.08
0.02
9rs
9827
142
319
2599
618
1.49
4.88
* 10
−61.
070.
029
rs98
6828
63
1925
6418
01.
487.
40 *
10−6
1.07
0.03
4rs
4681
554
315
0992
952
0.64
9.82
* 10
−50.
940.
050
rs64
2990
154
4611
040.
739.
81 *
10−5
0.95
0.05
2
Tabl
e 5.
3 To
p re
sults
of G
WA
S pe
rfor
med
by
Dee
len
et a
l [23
]
1135 GWAS and Meta-Analysis in Aging/Longevity
Dis
cove
ryR
eplic
atio
nSN
PC
hrPo
sitio
nO
Rp-
valu
eO
Rp-
valu
ers
1254
8929
814
0305
428
0.55
3.52
* 10
−50.
930.
058
rs12
5486
228
1401
9041
80.
548.
78 *
10−6
0.93
0.05
9rs
6774
262
332
8145
151.
408.
37 *
10−5
1.06
0.05
9rs
4133
282
814
0287
194
0.54
2.02
* 10
−50.
930.
066
rs25
1170
38
1037
7027
20.
739.
96 *
10−5
0.95
0.06
7rs
1686
1446
118
2213
710.
398.
47 *
10−5
0.91
0.07
1rs
9705
6720
4928
1661
0.70
3.50
* 10
−50.
950.
075
rs10
4904
782
2076
3630
81.
635.
79 *
10−6
1.08
0.08
0rs
1859
416
788
6642
61.
425.
04 *
10−5
1.06
0.08
0rs
1104
7358
1224
3439
781.
476.
49 *
10−5
1.07
0.08
1rs
1210
1383
1565
0552
570.
699.
53 *
10−5
0.95
0.11
2rs
2683
0010
4390
0845
2.13
4.05
* 10
−51.
140.
113
rs12
0800
881
2303
4398
11.
455.
19 *
10−5
1.06
0.12
4rs
2290
889
992
6796
702.
009.
14 *
10−6
1.11
0.12
5rs
2436
932
810
3689
078
1.59
1.12
* 10
−51.
060.
132
rs12
8921
5214
7804
9436
1.87
5.78
* 10
−51.
110.
162
rs11
1224
301
2303
3490
61.
507.
65 *
10−6
1.05
0.17
5rs
1177
6260
812
8451
670
0.61
4.30
* 10
−50.
960.
250
rs23
0295
119
5364
6233
1.51
7.59
* 10
−51.
050.
264
rs96
6258
91
2303
4423
41.
439.
68 *
10−5
1.04
0.26
8rs
7864
625
992
6737
692.
001.
01 *
10−5
1.08
0.28
2rs
3959
143
319
2600
773
1.40
2.61
* 10
−51.
030.
290
Tabl
e 5.
3 (c
ontin
ued)

114 L. Broer and C. M. van Duijn
Dis
cove
ryR
eplic
atio
nSN
PC
hrPo
sitio
nO
Rp-
valu
eO
Rp-
valu
ers
1019
1593
220
7567
835
1.49
6.97
* 10
−51.
040.
304
rs11
7827
358
1284
3578
60.
614.
92 *
10−5
0.97
0.36
9rs
6581
191
1257
1619
651.
384.
06 *
10−5
1.02
0.51
1rs
6852
830
414
5726
008
1.50
7.17
* 10
−51.
020.
641
rs70
1166
08
3040
5716
1.42
8.64
* 10
−50.
990.
761
rs10
5020
0511
1019
8563
11.
482.
42 *
10−5
1.01
0.78
4rs
6941
242
648
4798
871.
976.
91 *
10−5
1.03
0.84
7rs
8577
881
1570
5176
11.
411.
55 *
10−5
1.00
0.86
8rs
1093
1700
219
6176
676
1.41
6.06
* 10
−51.
000.
869
rs85
7785
115
7050
883
1.43
2.68
* 10
−50.
990.
877
rs12
8152
8912
1027
7934
90.
695.
40 *
10−5
1.00
0.89
5rs
9473
350
648
4751
661.
995.
68 *
10−5
1.02
0.94
3rs
1019
4564
214
2611
043
1.55
8.88
* 10
−51.
010.
962
rs17
1549
0310
4383
9414
2.68
7.31
* 10
−51.
030.
976
OR
odds
ratio
Tabl
e 5.
3 (c
ontin
ued)
1155 GWAS and Meta-Analysis in Aging/Longevity
Tabl
e 5.
4 To
p re
sults
of G
WA
S pe
rfor
med
by
Neb
el e
t al [
27]
Dis
cove
ryR
eplic
atio
nC
hr.
Posi
tion
SNP
MA
FO
RP-
valu
eO
RP-
valu
e19
5011
4786
rs44
2063
80.
110.
533.
70 *
10−1
00.
551.
90 *
10−8
629
7786
31rs
3129
046
0.20
0.66
1.20
* 10
−70.
950.
523
629
7859
31rs
1610
742
0.20
0.66
1.60
* 10
−70.
940.
454
228
5157
68rs
2338
013
0.19
0.67
7.40
* 10
−71.
060.
496
629
8081
62rs
1610
601
0.20
0.68
1.10
* 10
−60.
950.
548
629
7535
92rs
3129
063
0.18
0.67
2.20
* 10
−60.
920.
353
629
8340
25rs
1633
063
0.20
0.68
2.30
* 10
−60.
910.
289
1854
0529
53rs
1588
690.
481.
372.
30 *
10−6
1.11
0.16
95
5202
2995
rs35
0450
0.22
0.69
4.20
* 10
−61.
020.
775
1347
0015
19rs
1575
892
0.03
0.45
4.50
* 10
−61.
130.
442
629
7317
18rs
2922
80.
180.
684.
70 *
10−6
0.93
0.44
616
7341
8057
rs16
9475
260.
060.
566.
30 *
10−6
0.88
0.31
49
1071
5294
rs11
7900
550.
381.
387.
10 *
10−6
1.01
0.94
21
1753
0915
4rs
1274
1354
0.45
0.74
7.40
* 10
−60.
820.
006
1346
9058
19rs
9595
687
0.04
0.49
8.00
* 10
−61.
130.
470
910
7265
80rs
1095
9258
0.37
1.36
9.10
* 10
−61.
010.
897
OR
odds
ratio
116 L. Broer and C. M. van Duijn
SNP
CH
RG
ene
Ass
oc M
odel
EAEA
Fp-
valu
eO
Rrs
6504
441
17PR
KC
AA
MT
0.30
1.06
* 10
−60.
60rs
1241
3082
10M
SRB
2D
MT
0.32
1.50
* 10
−60.
53rs
5131
543
IMPG
2D
MT
0.42
2.14
* 10
−60.
52rs
4574
762
7–
RM
G0.
262.
29 *
10−6
0.19
rs15
8259
416
–D
MA
0.32
3.00
* 10
−61.
87rs
1051
4626
1–
AM
A0.
064.
65 *
10−6
0.38
rs10
9238
061
–R
MG
0.38
7.24
* 10
−62.
30rs
2967
137
16–
DM
C0.
378.
00 *
10−6
1.83
rs12
0884
861
–D
MA
0.28
8.83
* 10
−60.
56rs
1123
7644
11–
AM
A0.
409.
24 *
10−6
1.52
rs21
4755
613
–A
MT
0.29
9.59
* 10
−60.
63rs
6592
810
11–
AM
C0.
331.
10 *
10−5
1.54
rs78
7325
99
AN
KR
D19
RM
G0.
271.
18 *
10−5
3.14
rs15
6330
16
–D
MG
0.13
1.22
* 10
−50.
50rs
8709
5911
–A
MT
0.40
1.27
* 10
−51.
51rs
5713
913
IMPG
2D
MG
0.43
1.39
* 10
−50.
55rs
7915
479
10C
DH
23D
MT
0.47
1.47
* 10
−51.
92rs
1027
7343
7–
AM
T0.
281.
79 *
10−5
0.64
rs88
8808
5R
HO
BTB
3A
MG
0.41
1.94
* 10
−50.
67rs
6769
400
3–
RM
A0.
481.
99 *
10−5
1.91
rs79
5602
4M
GST
2A
MT
0.47
2.11
* 10
−50.
67rs
4938
180
11IG
SF4
RM
T0.
492.
16 *
10−5
1.91
rs67
0144
51
TAF5
LD
MT
0.15
2.24
* 10
−51.
84
Tabl
e 5.
5 To
p hi
ts o
f GW
AS
perf
orm
ed b
y M
alov
ini e
t al [
28]
1175 GWAS and Meta-Analysis in Aging/Longevity
SNP
CH
RG
ene
Ass
oc M
odel
EAEA
Fp-
valu
eO
Rrs
1095
6502
8FA
M49
BD
MG
0.31
2.25
* 10
−50.
57rs
4291
539
1–
DM
C0.
422.
37 *
10−5
1.81
rs15
3828
71
KC
NH
1D
MA
0.18
2.64
* 10
−50.
55rs
1049
1334
5C
AM
KIV
DM
T0.
182.
88 *
10−5
0.55
rs26
7010
43
–A
MC
0.36
2.98
* 10
−50.
67rs
1556
758
10SO
RC
S1R
MC
0.45
3.47
* 10
−50.
50rs
1303
2922
–R
MA
0.47
3.52
* 10
−50.
50rs
1484
583
8–
AM
T0.
273.
74 *
10−5
1.53
rs28
5097
13R
NF1
13B
AM
G0.
083.
79 *
10−5
0.47
rs11
7383
025
–D
MT
0.27
3.81
* 10
−50.
57rs
8464
277
–R
MA
0.45
3.82
* 10
−51.
94rs
2277
472
14M
AM
DC
1A
MT
0.09
3.88
* 10
−51.
95rs
2495
513
1TM
EM61
AM
G0.
203.
98 *
10−5
0.60
rs93
1538
513
DC
AM
KL1
AM
G0.
143.
98 *
10−5
1.74
rs47
4039
19
–A
MG
0.11
3.99
* 10
−50.
52rs
9366
292
6–
AM
G0.
254.
26 *
10−5
0.64
rs47
2789
97
–D
MG
0.48
4.37
* 10
−50.
55rs
6540
664
1–
AM
A0.
504.
45 *
10−5
1.46
rs47
7717
015
–R
MC
0.43
4.52
* 10
−52.
00rs
1051
3702
3–
RM
T0.
484.
53 *
10−5
1.85
rs31
3420
48
–A
MG
0.28
4.83
* 10
−51.
51rs
1354
1622
–D
MT
0.44
4.86
* 10
−50.
57rs
4594
173
14M
AD
MC
1A
MG
0.08
4.88
* 10
−51.
94
Tabl
e 5.
5 (c
ontin
ued)

118 L. Broer and C. M. van Duijn
SNP
CH
RG
ene
Ass
oc M
odel
EAEA
Fp-
valu
eO
Rrs
9644
033
SUM
F1R
MA
0.39
4.91
* 10
−52.
07rs
1562
688
3–
RM
C0.
434.
93 *
10−5
0.50
rs71
2773
3G
RM
7A
MG
0.32
4.98
* 10
−50.
66rs
6977
396
ATX
N1
DM
A0.
345.
05 *
10−5
0.59
rs21
1117
312
PTPR
OD
MC
0.39
5.22
* 10
−51.
74rs
4282
145
4–
RM
T0.
335.
32 *
10−5
0.38
rs38
6405
13
SUM
F1R
MT
0.39
5.49
* 10
−52.
07rs
1428
689
5–
RM
C0.
495.
51 *
10−5
1.85
rs81
647
16–
DM
G0.
405.
53 *
10−5
0.58
rs10
1340
5614
–R
MA
0.39
5.61
* 10
−50.
46rs
2070
325
20LP
LUN
C4
RM
G0.
305.
98 *
10−5
2.42
rs29
0547
69
–R
MT
0.28
6.35
* 10
−50.
29rs
7583
529
2C
FLA
RR
MA
0.21
6.45
* 10
−53.
15rs
7842
001
8–
RM
G0.
267.
12 *
10−5
0.32
rs96
9845
12–
RM
A0.
187.
22 *
10−5
5.87
rs23
5431
44
–R
MT
0.43
7.81
* 10
−50.
51rs
2073
586
11A
BC
C8
RM
T0.
408.
15 *
10−5
0.48
rs45
0546
62
SH3B
P4R
MT
0.40
8.31
* 10
−52.
06rs
1584
547
14–
RM
T0.
248.
52 *
10−5
2.96
rs31
0248
48
–R
MG
0.49
9.20
* 10
−51.
82rs
7312
8713
–R
MT
0.28
9.88
* 10
−52.
51A
ssoc
Mod
el: A
M a
llelic
mod
el [1
df]
), D
M d
omin
ant m
odel
[1, d
f]; R
M re
cess
ive
mod
el [1
df]
), O
R od
ds ra
tio
Tabl
e 5.
5 (c
ontin
ued)
1195 GWAS and Meta-Analysis in Aging/Longevity
came from the Illumina control database ( n = 673). For replication two additional sets were used of 253 and 60 centenarians and 341 and 2863 population controls [30]. Four different genetic models (general/genotypic, allelic/additive, recessive and dominant) were investigated. A single SNP, rs2075650, in APOE/TOMM40 reached genome-wide significance [30]. Table 5.6 contains the top 17 SNPs with a p-value < 10−4 in the additive model. They further explored the hypothesis that different sets of SNPs that are associated with exceptional longevity, although with moderate effects, may jointly characterize the genetic predisposition to exceptional longevity [31, 32]. The authors included 281 predictive SNPs in the genetic risk profiles reaching 89 % sensitivity and specificity for predicting centenarian status in the discovery sample [30]. In the replication samples the sensitivity was 60 % and specificity was 58 %. However, this set was slightly younger. In the older subjects sensitivity increased to 85 %. The 281 predictive SNPs are located in 130 genes. Some of these genes are known for progeroid (premature aging-like) syndromes, like LMNA (Huthcinson-Gilford syndrome) and WRN (Werner’s Syndrome) [33, 34]. 38 of the 130 genes were linked to AD in literature, 42 to dementia and 38 to tauopathies. The fact that so many genes play a role in dementia is consistent with the epidemiologic finding that dementia is absent or markedly delayed amongst centenarians [35]. Cluster analysis identified 26 groups of 8 to 94 centenarians (90 % of the discovery set) with similar genetic risk profiles [30]. The genetic risk profiles associated with each cluster represent different genetic signatures of excep-tional longevity. Some of the genetic signatures were significantly associated with different life spans, while others were associated with varying prevalences and ages of onset of various age-related diseases [30].
Alternative Approach
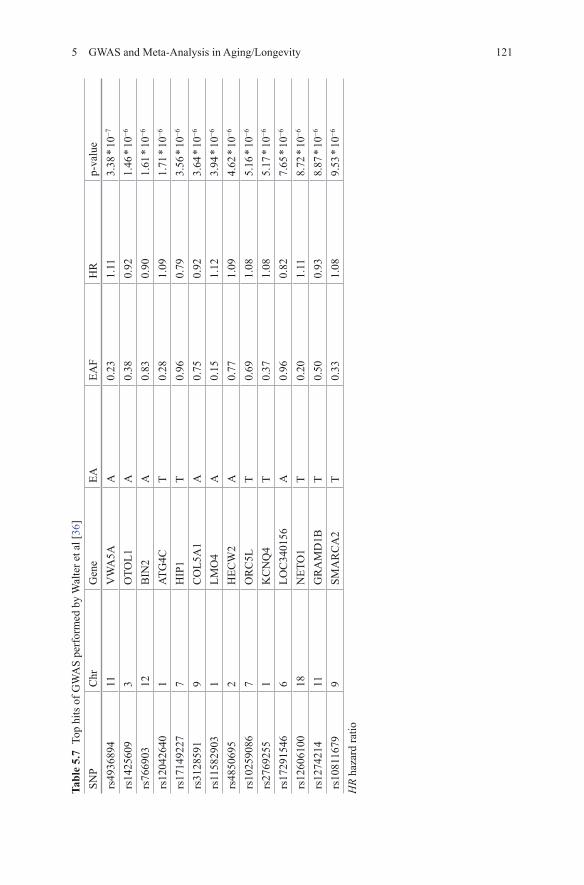
A different approach to study longevity was employed by Walter et al [36]. They employed a prospective follow-up design to investigate time to death as a con-tinuous outcome (all-cause mortality) using a Cox proportional hazard model. The GWAS study included 25,007 participants including 8444 deaths. Mean follow-up time was 10.6 years. Mean age at death was 81.1 years of age. 14 SNPs were asso-ciated with time to death at a suggestive threshold of p-value <1 * 10−5 (Table 5.7). The strongest association was for rs4936894 (chromosome 11, near VWA5A) with a p-value of 3.4 * 10−7 [36]. Replication for the top 5 SNPs was sought in 4 inde-pendent samples ( n = 10,411, deaths = 1295). None of the SNPs were consistently replicated. In the combined meta-analysis only rs1425609 near OTOL1 showed a stronger association compared to discovery ( p-value = 1.61 * 10−6) [36]. Pathway analysis was applied to investigate the SNPs with p-values < 1 * 10−3 in more detail. Relevant biological processes overrepresented in the results were developmental processes, neuronal activities, signal transduction, neurogenesis, ectoderm develop-ment and cell adhesion.

120 L. Broer and C. M. van Duijn
Tabl
e 5.
6 To
p hi
ts o
f GW
AS
perf
orm
ed b
y Se
bast
iani
et a
l [30
]SN
PG
ene
EAEA
FPV
AL.
GA
PVA
L.A
APV
AL.
DA
PVA
L.R
Ars
2075
650
TOM
M40
/APO
EG
0.14
2.89
* 10
−92.
36 *
10−1
02.
50 *
10−4
1.03
* 10
−8
rs12
6299
71EI
F4E3
G0.
821.
95 *
10−5
1.90
* 10
−67.
44 *
10−6
0.02
5rs
4977
756
NA
G0.
373.
87 *
10−5
7.97
* 10
−61.
44 *
10−4
5.88
* 10
−4
rs68
0117
3EI
F4E3
G0.
806.
81 *
10−5
8.16
* 10
−62.
20 *
10−5
0.04
1rs
1456
669
NA
C0.
891.
94 *
10−5
8.60
* 10
−64.
05 *
10−6
0.37
4rs
4802
234
CEA
CA
M16
C0.
523.
06 *
10−5
9.22
* 10
−63.
25 *
10−5
0.00
3rs
1063
192
CD
KN
2AG
0.41
9.70
* 10
−51.
66 *
10−5
6.33
* 10
−44.
53 *
10−4
rs91
5179
LMN
AG
0.39
1.03
* 10
−42.
37 *
10−5
0.00
13.
18 *
10−4
rs27
5833
1SO
D2
C0.
551.
31 *
10−4
2.93
* 10
−54.
39 *
10−4
0.00
1rs
4073
968
NA
G0.
765.
38 *
10−5
3.64
* 10
−51.
24 *
10−5
0.12
9rs
1412
832
NA
G0.
282.
18 *
10−4
4.55
* 10
−50.
002
6.89
* 10
−4
rs95
5727
6C
LYB
LC
0.50
2.62
* 10
−44.
65 *
10−5
3.21
* 10
−40.
004
rs47
2209
4N
AG
0.18
8.66
* 10
−55.
00 *
10−5
0.23
91.
93 *
10−5
rs10
4834
93TT
C6
C0.
253.
32 *
10−4
5.96
* 10
−50.
004
6.17
* 10
−4
rs69
9758
9SH
2D4A
G0.
223.
70 *
10−4
6.25
* 10
−50.
017
2.31
* 10
−4
rs37
6330
5B
TNL2
G0.
961.
62 *
10−4
6.27
* 10
−54.
51 *
10−5
0.81
0rs
2774
32N
AG
0.62
3.86
* 10
−49.
12 *
10−5
0.00
10.
002
PVAL
.GA
p-va
lue
for g
enot
ype
asso
ciat
ion,
PVA
L.AA
p-v
alue
for a
llelic
ass
ocia
tion,
PVA
L.D
A p-
valu
e fo
r dom
inan
t ass
ocia
tion,
PVA
L.RA
p-v
alue
for r
eces
-si
ve a
ssoc
iatio
n
1215 GWAS and Meta-Analysis in Aging/Longevity
Tabl
e 5.
7 To
p hi
ts o
f GW
AS
perf
orm
ed b
y W
alte
r et a
l [36
]SN
PC
hrG
ene
EAEA
FH
Rp-
valu
ers
4936
894
11V
WA
5AA
0.23
1.11
3.38
* 10
−7
rs14
2560
93
OTO
L1A
0.38
0.92
1.46
* 10
−6
rs76
6903
12B
IN2
A0.
830.
901.
61 *
10−6
rs12
0426
401
ATG
4CT
0.28
1.09
1.71
* 10
−6
rs17
1492
277
HIP
1T
0.96
0.79
3.56
* 10
−6
rs31
2859
19
CO
L5A
1A
0.75
0.92
3.64
* 10
−6
rs11
5829
031
LMO
4A
0.15
1.12
3.94
* 10
−6
rs48
5069
52
HEC
W2
A0.
771.
094.
62 *
10−6
rs10
2590
867
OR
C5L
T0.
691.
085.
16 *
10−6
rs27
6925
51
KC
NQ
4T
0.37
1.08
5.17
* 10
−6
rs17
2915
466
LOC
3401
56A
0.96
0.82
7.65
* 10
−6
rs12
6061
0018
NET
O1
T0.
201.
118.
72 *
10−6
rs12
7421
411
GR
AM
D1B
T0.
500.
938.
87 *
10−6
rs10
8116
799
SMA
RC
A2
T0.
331.
089.
53 *
10−6
HR
haza
rd ra
tio

122 L. Broer and C. M. van Duijn
The Future of GWAS on Longevity
Published GWAS on longevity have so far failed to identify any new robust as-sociations with longevity that have replicated over studies. The only loci robustly associated stem from candidate genes APOE and FOXO3a [13, 14, 16, 18, 24]. Though GWAS has proven to be a powerful approach to unravel the genetics of many complex traits, the longevity phenotype remains resistant to the efforts to uncover new genetic associations.
A reason for not finding any replicated associations for longevity could be the sheer complexity of the phenotype. Even centenarians fall into different groups in terms of age of onset of age-related diseases: survivors (onset of aging disease < 80 years), delayers (onset of aging disease between 80 and 100 years) and escapers (onset of aging disease > 100 years) [37]. Taking a younger age-cutoff for longevity cases (85+ or 90+), the number of cases will increase, which is very relevant for prospective cohort studies. However, along with an increase in power, the hetero-geneity is expected to increase. The key to success in GWAS of other traits has been to increase samples size, ignoring issues of heterogeneity, which also occur in other complex outcomes such a blood pressure and cardiovascular disease. Without a doubt progress may be achieved by pooling the present studies in a joint analysis and adding as much as possible new studies available to increase the statistical power. Despite the robustness of GWAS to heterogeneity, there is a definite need to harmonize the longevity phenotype across studies. As seen in Table 5.1, almost every study investigating longevity uses different criteria for either longevity cases or the comparison group. This makes comparing the results between studies very difficult.
Why have we not identified new genes for longevity by GWAS? It has been argued that it may require a great number of ‘protective’ genes all with very small effects to have a genetic advantage to achieve longevity [30]. This model is also referred to as the infinitesimal model [38]. We have recently tested the infinitesimal model in the Rotterdam study and found that 81.3 % of the heritability in longev-ity defined as survival to age 90+ years is explained by common variants. Such a mechanism has been proposed for other complex traits including height. Though for highly heritable traits like height these genes are uncovered [39], in a trait like longevity this may require extremely large samples size to achieve sufficient sta-tistical power, which have not been achieved yet. Using biomarkers of aging might be a more fruitful pursuit for finding associations with longevity. Unfortunately, no good biomarkers of aging currently exist, though many have been proposed [40]. Telomere length, a marker of cellular senescence, is one of the previously proposed biomarkers of aging [41] and has already proven successful in identifying genes for this trait [42]. As of yet, these genes have been associated with cardiovascular dis-ease [42] but have not been found to associate with longevity [43]. These findings are not final as only a very small percentage of the telomere length variance can be explained by the currently uncovered genes [42].

1235 GWAS and Meta-Analysis in Aging/Longevity
An alternative approach to solving the heterogeneity issue in longevity is ad-dressing healthy aging, as captured in a healthy aging index (HAI) [44]. The HAIs may include markers of 5 various organ systems that are known to predict mortality and disability. The systems included are vascular (carotid wall thickness), brain (white matter grade on MRI), kidney (cystatin-c), lung (forced vital capacity) and metabolic (fasting glucose levels) [44]. The HAI is able to distinguish a wide risk gradient, but is most remarkable for its advantage in identifying low risk individu-als. As a single factor, the HAI prediction of mortality is similar in magnitude to age itself. When entered together, age remained partly independent, but the HAI explained 40 % of the effect of age [44].
Another potential reason for not finding any solid associations with the longevity phenotype stems back to the old debate of the role of common versus rare variants [45]. The common disease, common variant (CDCV) hypothesis states that com-mon traits are caused by common variants with small effect sizes [46]. This theory is essentially targeted in GWAS. However, assuming a role of common variants may be an oversimplification of the true genetic architecture behind complex traits as longevity [47]. An alternate hypothesis is that rare phenotypes such as extreme longevity may be explained by rare variants with large effects that explain the high heritability and the clustering of nonagenarians and centenarians in families [48]. GWAS is not suited to identify rare variants as they are often not properly tagged by the variants present on genotyping arrays. Exome sequencing, or even genome sequencing, might help in uncovering such rare variants [49].
Although findings of GWAS to date have been disappointing, as discussed in this chapter there is ample opportunity to improve the statistical power of studies to find common variants with small effects that appear to explain over 80 % of the heritability in the Rotterdam study. Collaboration between various consortia is most likely the fastest way forward to success and may likely require some a priori titra-tion on the definition of longevity cases and controls with the view to maximize the statistical power.
References
1. Oeppen J, Vaupel JW (2002) Demography. Broken limits to life expectancy. Science 296(5570):1029–1031
2. Vaupel JW et al (1998) Biodemographic trajectories of longevity. Science 280(5365):855–8603. Suzman R, Riley MW (1985) Introducing the “oldest old”. Milbank Mem Fund Q Health Soc
63(2):177–1864. Arias E (2011) United States life tables, 2007. Natl Vital Stat Rep 59(9):1–605. vB Hjelmborg J et al (2006) Genetic influence on human lifespan and longevity. Hum Genet
119(3):312–3216. Herskind AM et al (1996) The heritability of human longevity: a population-based study of
2872 Danish twin pairs born 1870–1900. Hum Genet 97(3):319–3237. McGue M et al (1993) Longevity is moderately heritable in a sample of Danish twins born
1870–1880. J Gerontol 48(6):B237–2448. Kerber RA et al (2001) Familial excess longevity in Utah genealogies. J Gerontol A Biol Sci
Med Sci 56(3):B130–139

124 L. Broer and C. M. van Duijn
9. Mitchell BD et al (2001) Heritability of life span in the Old Order Amish. Am J Med Genet 102(4):346–352
10. Murabito JM, Yuan R, Lunetta KL (2012) The search for longevity and healthy aging genes: insights from epidemiological studies and samples of long-lived individuals. J Gerontol A Biol Sci Med Sci 67(5):470–479
11. McIlhany ML, Shaffer JW, Hines EA Jr (1975) The heritability of blood pressure: an investi-gation of 200 pairs of twins using the cold pressor test. Johns Hopkins Med J 136(2):57–64
12. Pilia G et al (2006) Heritability of cardiovascular and personality traits in 6148 Sardinians. PLoS Genet 2(8):e132
13. Anselmi CV et al (2009) Association of the FOXO3A locus with extreme longevity in a southern Italian centenarian study. Rejuvenation Res 12(2):95–104
14. Bathum L et al (2006) Apolipoprotein e genotypes: relationship to cognitive functioning, cognitive decline, and survival in nonagenarians. J Am Geriatr Soc 54(4):654–658
15. Beekman M et al (2013) Genome-wide linkage analysis for human longevity: genetics of healthy aging study. Aging Cell 12(2):184–193
16. Flachsbart F et al (2009) Association of FOXO3A variation with human longevity confirmed in German centenarians. Proc Natl Acad Sci U S A 106(8):2700–2705
17. Gerdes LU et al (2000) Estimation of apolipoprotein E genotype-specific relative mortality risks from the distribution of genotypes in centenarians and middle-aged men: apolipoprotein E gene is a frailty gene, not a longevity gene. Genet Epidemiol 19(3):202–210
18. Willcox BJ et al (2008) FOXO3A genotype is strongly associated with human longevity. Proc Natl Acad Sci U S A 105(37):13987–13992
19. Beekman M et al (2010) Genome-wide association study (GWAS)-identified disease risk al-leles do not compromise human longevity. Proc Natl Acad Sci U S A 107(42):18046–18049
20. Ganna A et al (2013) Genetic determinants of mortality. Can findings from genome-wide as-sociation studies explain variation in human mortality? Hum Genet 132(5):553–561
21. Newman AB et al (2010) A meta-analysis of four genome-wide association studies of surviv-al to age 90 years or older: the cohorts for heart and aging research in genomic epidemiology consortium. J Gerontol A Biol Sci Med Sci 65(5):478–487
22. Chi H et al (2000) Targeted deletion of Minpp1 provides new insight into the activity of multiple inositol polyphosphate phosphatase in vivo. Mol Cell Biol 20(17):6496–6507
23. Deelen J et al (2011) Genome-wide association study identifies a single major locus contrib-uting to survival into old age; the APOE locus revisited. Aging Cell 10(4):686–698
24. Schachter F et al (1994) Genetic associations with human longevity at the APOE and ACE loci. Nat Genet 6(1):29–32
25. Christensen K, Johnson TE, Vaupel JW (2006) The quest for genetic determinants of human longevity: challenges and insights. Nat Rev Genet 7(6):436–448
26. Bertram L et al (2007) Systematic meta-analyses of Alzheimer disease genetic association studies: the AlzGene database. Nat Genet 39(1):17–23
27. Nebel A et al (2011) A genome-wide association study confirms APOE as the major gene influencing survival in long-lived individuals. Mech Ageing Dev 132(6–7):324–330
28. Malovini A et al (2011) Association study on long-living individuals from Southern Italy identifies rs10491334 in the CAMKIV gene that regulates survival proteins. Rejuvenation Res 14(3):283–291
29. Levy D et al (2007) Framingham heart study 100 k project: genome-wide associations for blood pressure and arterial stiffness. BMC Med Genet 8(Suppl 1):S3
30. Sebastiani P et al (2012) Genetic signatures of exceptional longevity in humans. PLoS One 7(1):e29848
31. Hekimi S (2006) How genetic analysis tests theories of animal aging. Nat Genet 38(9):985–99132. Terry DF et al (2008) Disentangling the roles of disability and morbidity in survival to excep-
tional old age. Arch Intern Med 168(3):277–28333. Gray MD et al (1997) The Werner syndrome protein is a DNA helicase. Nat Genet
17(1):100–103

1255 GWAS and Meta-Analysis in Aging/Longevity
34. Eriksson M et al (2003) Recurrent de novo point mutations in lamin A cause Hutchinson–Gil-ford progeria syndrome. Nature 423(6937):293–298
35. Hitt R et al (1999) Centenarians: the older you get, the healthier you have been. Lancet 354(9179):652
36. Walter S et al (2011) A genome-wide association study of aging. Neurobiol Aging 32(11):2109 e15–28
37. Evert J et al (2003) Morbidity profiles of centenarians: survivors, delayers, and escapers. J Gerontol A Biol Sci Med Sci 58(3):232–237
38. Gibson G (2011) Rare and common variants: twenty arguments. Nat Rev Genet 13(2):135–14539. Lango AH et al (2010) Hundreds of variants clustered in genomic loci and biological path-
ways affect human height. Nature 467(7317):832–83840. Johnson TE (2006) Recent results: biomarkers of aging. Exp Gerontol 41(12):1243–124641. von Zglinicki T, Martin-Ruiz CM (2005) Telomeres as biomarkers for ageing and age-related
diseases. Curr Mol Med 5(2):197–20342. Codd V et al (2013) Identification of seven loci affecting mean telomere length and their as-
sociation with disease. Nat Genet 45(4):422–427, 427e1–243. Deelen J et al (2014) Leukocyte telomere length associates with prospective mortality in-
dependent of immune-related parameters and known genetic markers. Int J Epidemiol 43(3):878–886
44. Newman AB et al (2008) A physiologic index of comorbidity: relationship to mortality and disability. J Gerontol A Biol Sci Med Sci 63(6):603–609
45. Schork NJ et al (2009) Common vs. rare allele hypotheses for complex diseases. Curr Opin Genet Dev 19(3):212–219
46. Reich DE, Lander ES (2001) On the allelic spectrum of human disease. Trends Genet 17(9):502–510
47. Maher B (2008) Personal genomes: the case of the missing heritability. Nature 456(7218):18–2148. Pritchard JK (2001) Are rare variants responsible for susceptibility to complex diseases? Am
J Hum Genet 69(1):124–13749. Cirulli ET, Goldstein DB (2010) Uncovering the roles of rare variants in common disease
through whole-genome sequencing. Nat Rev Genet 11(6):415–425