chapter 5 growth and characterization...
TRANSCRIPT

103
CHAPTER 5
GROWTH AND CHARACTERIZATION OF NONLINEAR
OPTICAL CRYSTALS OF GLYCINE OXALATE
5.1 INTRODUCTION
Nonlinear optical (NLO) applications demand good quality single crystals
which inherit large NLO coefficient coupled with improved physical parameters. One
potentially attractive system, where there is a potential for realizing very large second
order nonlinear coefficient is based on organic crystals. Organic materials have been
of particular interest because the non linear optical responses in this broad class of
materials is microscopic in origin, offering an opportunity to use theoretical modeling
coupled with synthetic flexibility to design and produce novel materials [160]. Further
investigations on organic NLO materials have subsequently produced very good
materials with highly attractive characteristics.
Amino acid family crystals have been subjected to extensive investigation
during the recent decades for their nonlinear optical properties [161]. Glycine
[NH2CH2COOH] is the simplest amino acid. Glycine remains as one of the most
extensively studied amino acids as it is known to form innumerable complexes with
metals, inorganic salts and inorganic acids. Many researchers have investigated the
properties of pure glycine and its derivatives. The growth of -glycine from gel was
reported by Ambujam et al [161]. They have reported the photoconductivity of
-glycine crystals, which revealed the negative photoconducting nature. The EPR
study of Cu2+ in glycine zinc sulphate was studied by Ravi et al., [162]. The spin-
Hamiltonian parameters were obtained from the single crystal EPR analysis. By using
the EPR data, the molecular bonding coefficient and the Fermi contact interaction
terms have been evaluated. Narayana Moolya et al., [160] have studied the growth of
104
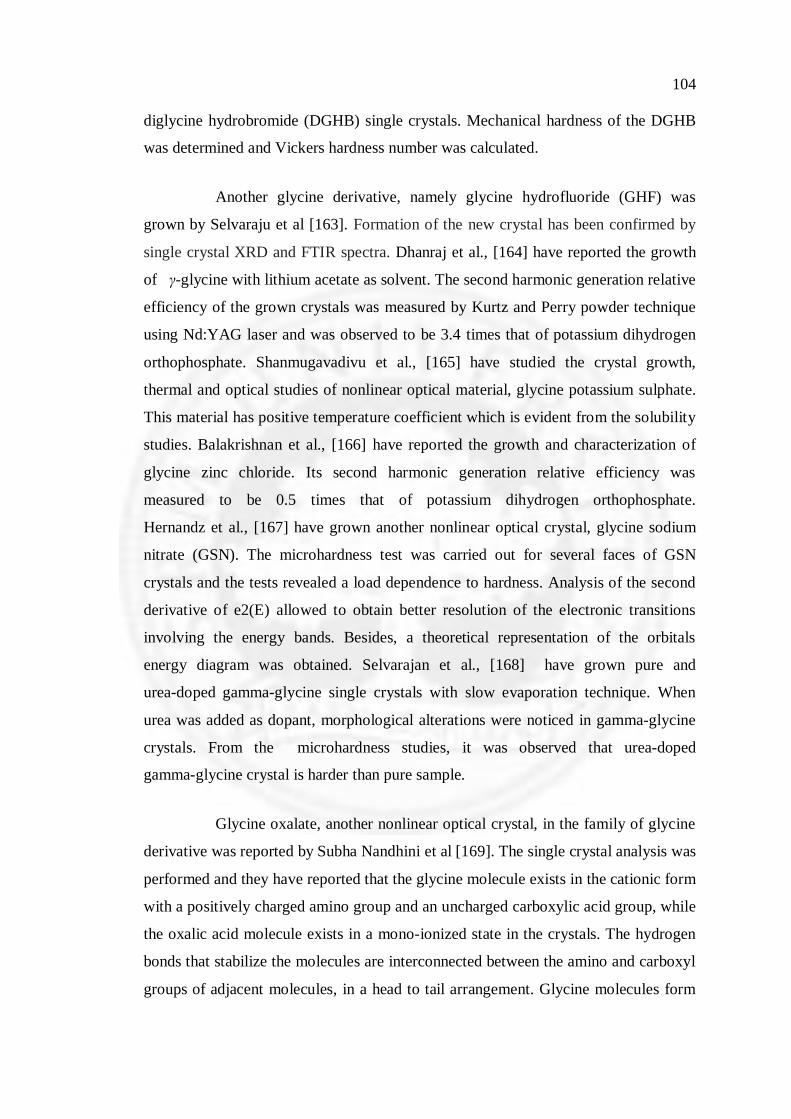
diglycine hydrobromide (DGHB) single crystals. Mechanical hardness of the DGHB
was determined and Vickers hardness number was calculated.
Another glycine derivative, namely glycine hydrofluoride (GHF) was
grown by Selvaraju et al [163]. Formation of the new crystal has been confirmed by
single crystal XRD and FTIR spectra. Dhanraj et al., [164] have reported the growth
of -glycine with lithium acetate as solvent. The second harmonic generation relative
efficiency of the grown crystals was measured by Kurtz and Perry powder technique
using Nd:YAG laser and was observed to be 3.4 times that of potassium dihydrogen
orthophosphate. Shanmugavadivu et al., [165] have studied the crystal growth,
thermal and optical studies of nonlinear optical material, glycine potassium sulphate.
This material has positive temperature coefficient which is evident from the solubility
studies. Balakrishnan et al., [166] have reported the growth and characterization of
glycine zinc chloride. Its second harmonic generation relative efficiency was
measured to be 0.5 times that of potassium dihydrogen orthophosphate.
Hernandz et al., [167] have grown another nonlinear optical crystal, glycine sodium
nitrate (GSN). The microhardness test was carried out for several faces of GSN
crystals and the tests revealed a load dependence to hardness. Analysis of the second
derivative of e2(E) allowed to obtain better resolution of the electronic transitions
involving the energy bands. Besides, a theoretical representation of the orbitals
energy diagram was obtained. Selvarajan et al., [168] have grown pure and
urea-doped gamma-glycine single crystals with slow evaporation technique. When
urea was added as dopant, morphological alterations were noticed in gamma-glycine
crystals. From the microhardness studies, it was observed that urea-doped
gamma-glycine crystal is harder than pure sample.
Glycine oxalate, another nonlinear optical crystal, in the family of glycine
derivative was reported by Subha Nandhini et al [169]. The single crystal analysis was
performed and they have reported that the glycine molecule exists in the cationic form
with a positively charged amino group and an uncharged carboxylic acid group, while
the oxalic acid molecule exists in a mono-ionized state in the crystals. The hydrogen
bonds that stabilize the molecules are interconnected between the amino and carboxyl
groups of adjacent molecules, in a head to tail arrangement. Glycine molecules form

105
columns around 21 screw axis parallel to b axis. Semi-oxalate ions also form columns
parallel to b axis. Adjacent molecules are related by a cell translation and
interconnected by an O-H-O hydrogen bond. Each such column and its equivalent
generated by a centre of inversion connect two glycine columns giving rise to a
double layer parallel to ( 1 0 2 ) plane. In each layer, the unlike molecules are
connected through O-H-O hydrogen bond between the carboxyl group of the amino
acid and the carboxylate group of the semi-oxalate ion and their symmetry
equivalents. The double layer is further stabilized by hydrogen bonds of the amino
group of glycine with the semi-oxalate ion. The double layers are held together by
possible C-H-O and vander Waals interactions. The vibrational spectral analysis were
carried out by Sajan et al., [170] using NIR-FT Raman and FT-IR spectra.
Mythili et al., [171] have reported the preliminary studies of glycine oxalate. The
molecular structure of glycine oxalate is shown in Figure 5.1.
Figure 5.1 Molecular structure of glycine oxalate
In the present work, an attempt has been made to grow bulk single crystals
of glycine oxalate. The grown crystals were subjected to various characterization
methods such as single crystal X-ray diffraction, powder X-ray diffraction, FTIR
studies, UV-Vis spectral analysis, TGA and DSC, second harmonic generation
studies, laser damage threshold measurement, refractive index studies, dielectric and
A.C. Conductivity studies, hardness studies (Vickers, Knoops and Anisotropy) and
etching studies. The results are presented in this chapter.

106
5.1 GROWTH OF GLYCINE OXALATE CRYSTALS
Analytical grade reagents of Glycine and Oxalic acid were procurred from
Loba chemicals and were used as such without further purification. Mythili et al.,
[171] have performed the solubility studies for glycine oxalate crystals using water as
solvent. It is found that the solubility increases with increase in temperature. In the
present work, triple distilled water was used as solvent. Glycine and oxalic acid were
mixed in an equimolar ratio (1:1). First, 7.5 g of glycine was dissolved in 100 ml of
water. The solution was stirred continuously for a period of 5 hours. Then, 12.6 g of
oxalic acid was then dissolved in a beaker containing 100 ml of distilled water. The
solutions of glycine and oxalic acid were mixed together and the resulting solution
was stirred for 5 hours, to get an homogenous mixture. The reaction which occurs is
given below:
2 5 2 2 2 4 2 6 2 2 4C H NO H C O C H NO . C HO
The solution was filtered to remove the solid impurities in the mother
solution using an ultrapore filter. The solution was left for slow evaporation. The salt
of glycine oxalate were obtained, which were recrystallised. The seeds were obtained
and the seed crystal was kept in the mother solution for 15 days. Large crystals of
dimensions 30 mm × 27 mm × 20 mm were obtained as shown in Figure 5.2.
Figure 5.2 Photograph of as grown crystal of glycine oxalate

107
5.3 RESULTS AND DISCUSSION
5.3.1 Single crystal X-ray diffraction analysis
The accurate cell parameters of the glycine oxalate crystals at room
temperature were determined by single crystal X-ray diffraction. The glycine oxalate
crystallizes in the monoclinic system. The lattice parameters were calculated by
using least-squares refinement and are found to be: a = 10.578 Å, b = 5.468 Å,
c = 12.069 Å. The volume of the unit cell is 659.8 Å3. It is found that the lattice
parameters and the cell volume are in good agreement with the literature [169, 171].
5.3.2 Powder X-ray diffraction studies
The X-ray powder diffraction was performed on the grown crystals. The
crystals were made into fine powders. The powder XRD pattern was recorded using
powder SEIFERT X-ray diffractometer with CuK 1 Radiation ( = 1.5406 Å). The
samples were scanned over the range 10° - 70° at a rate of 1° per minute. The lattice
parameters and the cell volume obtained from powder XRD are: a = 10.539 Å,
b = 5.549 Å, c = 12.080 Å and V = 648.2 Å3. The peaks which were obtained from
powder XRD were indexed using UNIT CELL program. The indexed pattern is
shown in the Figure 5.3. The indexed powder XRD data is presented in Table 5.1.
5.3.3 FTIR spectral analyses
Freshly crushed powder of glycine oxalate crystal was mixed with KBr
and pelletized using a hydraulic press and subjected to the Fourier Transform Infrared
(FTIR) studies in order to analyze the functional groups present in the compound. The
spectrum (Figure 5.4) shows all the functional groups in glycine oxalate crystal. The
vibrational analysis of glycine oxalate is carried out on the basis of vibrations of the
glycinium ion consisting of amino, methylene, COOH groups and the oxalate ion. The
NH3+ asymmetric stretching vibration of amino group usually appears at 3224 cm-1
[170]. As expected, in the spectrum, it appears at 3229 cm-1 with strong intensity.

108
10 20 30 40 50 60 70
0
500
1000
1500
2000
2500
3000
3500
(7 1
-1)
(7 0
-2)
(3 1
-3)
(0 3
1)
(4 1
-1)
(2 0
0)
(2 0
-4)
(12
1 -2
)(1
1 2
)(0
1 2
)
Inte
nsity
(cps
)
Two Thetha (Degree)
Figure 5.3 Indexed powder XRD pattern of glycine oxalate
Table 5.1 Indexed powder XRD data of glycine oxalate
S. No
h k l
d(obs) Å
d(cal) Å
Diff(d) Å
(obs) (deg)
(calc) (deg)
Diff(2 ) (deg)
1 2 0 0 4.82024 4.83506 -0.01482 18.39 18.333 0.057 2 1 1 2 4.08259 4.05264 0.02995 21.75 21.913 -0.163 3 0 1 2 3.91384 3.92125 -0.00741 22.7 22.657 0.043 4 2 1 2 3.57845 3.57769 0.00076 24.86 24.865 -0.005 5 2 0 4 2.9654 2.9664 -0.001 30.11 30.1 0.01 6 3 1 3 2.7144 2.71976 -0.00536 32.97 32.903 0.067 7 4 1 1 2.33745 2.34382 -0.00637 38.48 38.371 0.109 8 0 3 1 1.82427 1.82445 -0.00017 49.95 49.945 0.005 9 7 0 2 1.48753 1.48632 0.00121 62.37 62.427 -0.057
10 7 1 1 1.39701 1.39663 0.00038 66.92 66.941 -0.021

109
4000 3500 3000 2500 2000 1500 1000 5000
20
40
60
80
100
Tran
smitt
ance
(%)
Wave Number(cm-1)
Figure 5.4 FTIR spectrum of glycine oxalate crystal
The NH3+ asymmetric deformation modes appear in the region
1625 - 1560 cm-1 [171]. The strong band at around 1595 cm-1 is assigned to the asymmetric NH3
+ deformation modes. The NH3+ rocking modes occurs at frequencies
around 1100 cm-1 for glycine and its derivatives. In the FTIR spectrum, this vibration appears at 1097 cm-1. The exact band position depends on the position and strength of hydrogen bonds [173]. The absorption at 971 cm-1 is assigned to NH3
+ rocking modes. The band at 481 cm-1 is attributed to NH3
+ torsion mode. For aminoacids, the asymmetric CH2 stretching vibrations are generally observed in the region 3100 - 3000 cm-1. The strong absorption at 3034 cm-1 is due to CH2 asymmetric vibrations. The symmetric stretching mode of CH2 appears between 3000 - 2900 cm-1
[173, 174]. The very strong band at 2867 cm-1 is due to the CH2 stretching vibration. The carbonyl stretching vibrations are usually observed in the region 1780 - 1700 cm-1 [172, 175]. The sharp intense band at 1718 cm-1 is due to C=O stretching vibrations. The COO bending vibration [176] appears as sharp band at

110
707 cm-1. The corresponding wagging and rocking vibrations are available at 582 cm-1 and 518 cm-1 respectively. The very strong bands in the region 2500 cm-1 to 2600 cm-1 corresponds to overtones and combinations. In the spectrum, there is a sharp band at 1915 cm-1 corresponding to C-C overtone. The detailed band assignments are given in Table 5.2.
Table 5.2 Vibrational band assignments for glycine oxalate
Wave number (cm-1)
Vibrational Assignments
3229 (vs) NH3+ asymmetric stretching
3034 (vs) CH2 asymmetric stretching
2867 (vs) Symmetric stretching of CH2
2668 (vs) Combination/Overtone
2515 (vs) Combination/Overtone
1915 (vs) C-C overtone
1718 (vs) C=O stretching
1595 (vs) NH3+ asymmetric deformation
1429 (vs) CH2 scissoring
1322 (vs) CH2 wagging
1271 (vs) C-O symmetric stretching
1230 (vs) O-H in plane bending
1097 (vs) NH3+ rocking
1037 (vs) CH2 rocking
1013 (vs) O-H-O stretching
971 (vs) NH3 rocking
900 (vs) C-C stretching
869 (s) C-C stretching
707 (vs) COO bending
667 (m) COO bending
582 (s) COO wagging
518 (s) COO rocking
481 (s) NH3+ torsion

111
5.3.4 Optical studies
The UV-Vis-NIR absorption spectrum of glycine oxalate is shown in
Figure 5.5. It is found that the crystal possesses a good transparency in the range
300 - 800 nm which is consistent with the literature [171]. The cut off wavelength of
the grown crystal is found to be 280 nm. Ambujam et al., [177] have determined the
cut off wavelength of bisglycine hydrochloride as around 240 nm. The cut off
wavelength for GHF was reported to be below 300 nm by Selvaraju et al [163]. The
cut off wavelength for glycine oxalate is comparable with that of BGHC and GHF.
The transparent nature of glycine oxalate in the entire visible region makes the
material, an apt candidate for NLO applications.
200 300 400 500 600 700 800
0
1
2
3
4
5
6
Abs
orba
nce
(AU
)
Wavelength (nm)
Figure 5.5 UV-Visible spectrum of glycinium oxalate crystal
5.3.5 Thermal analyses
In the present work, the thermogravimetric analysis (TGA) and differential
scanning calorimetry (DSC) of glycine oxalate crystal were performed by using

112
Netzsch TGA / DSC Instrument. The measurements were carried out in nitrogen
atmosphere at a heating rate of 20 °C/min in the temperature of 50 °C to 800 °C. The
TGA/DSC curve is shown in Figure 5.6.
Figure 5.6 TGA /DSC trace for glycine oxalate crystals
The TG trace of the crystal shows that the crystal is thermally stable upto 181 °C. There are three stages of decomposition of the crystal. In the first stage (from 182 °C to 225 °C), 49% of the sample was decomposed which corresponds to major loss in the mass. This corresponds to the evolution of carbon di oxide and hydrogen gases. Nearly 15% of the sample gets decomposed in the second stage. It starts at 226 °C and ends at 275 °C. In this stage, the carbon and oxygen gases are evolved. The third stage of decomposition is less dominant and it starts at 276 °C which corresponds to the evolution of nitrogen gas. It is found that a residual mass of 13.91% is left in the crucible, even at a temperature of 796 °C. The DSC trace shows one sharp endotherm with an onset of 172 °C. This endotherm has a peak at 186 °C which corresponds to the melting point of glycine oxalate. The values are in good agreement with the literature [171]. Dhanraj et al., [164] have found that gamma glycine crystal grown from a mixture of glycine and lithium acetate, was structurally stable upto 182 °C. Shanmugavadivu et al., [165] have reported that the glycine potassium sulphate crystal decomposes completely at a temperature of 250 °C. Thus, the good thermal stability of glycine oxalate crystals makes it a strong candidate for NLO applications.
Hea
t flo
w (m
W/m
g)
Wei
ght (
%)
Temperature (oC)
113
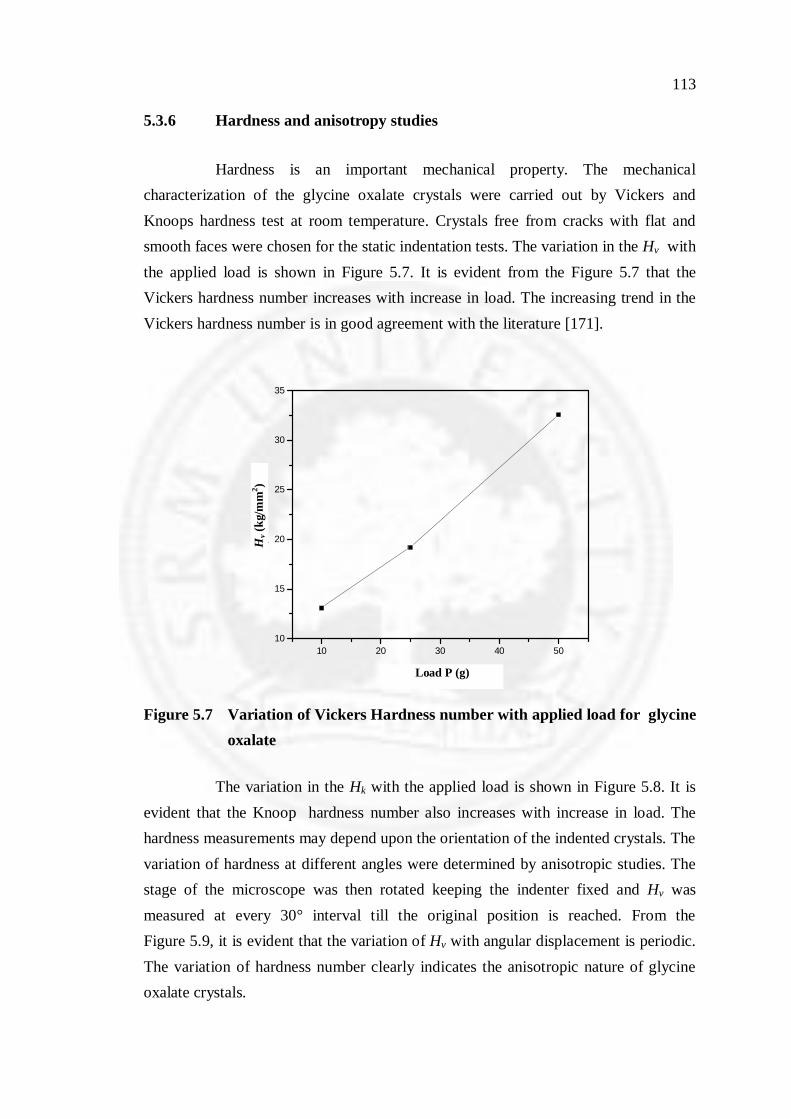
5.3.6 Hardness and anisotropy studies
Hardness is an important mechanical property. The mechanical characterization of the glycine oxalate crystals were carried out by Vickers and Knoops hardness test at room temperature. Crystals free from cracks with flat and smooth faces were chosen for the static indentation tests. The variation in the Hv with the applied load is shown in Figure 5.7. It is evident from the Figure 5.7 that the Vickers hardness number increases with increase in load. The increasing trend in the Vickers hardness number is in good agreement with the literature [171].
10 20 30 40 5010
15
20
25
30
35
Hv
in k
g/m
m2
Load P in (g)
Figure 5.7 Variation of Vickers Hardness number with applied load for glycine
oxalate
The variation in the Hk with the applied load is shown in Figure 5.8. It is evident that the Knoop hardness number also increases with increase in load. The hardness measurements may depend upon the orientation of the indented crystals. The variation of hardness at different angles were determined by anisotropic studies. The stage of the microscope was then rotated keeping the indenter fixed and Hv was measured at every 30° interval till the original position is reached. From the Figure 5.9, it is evident that the variation of Hv with angular displacement is periodic. The variation of hardness number clearly indicates the anisotropic nature of glycine oxalate crystals.
Hv (
kg/m
m2 )
Load P (g)

114
10 20 30 40 5012
14
16
18
20
22
24
26
28
Hk(k
g/m
m2 )
Load P in (g)
Figure 5.8 Variation of Knoop Hardness Number with applied load for
glycine oxalate crystals
-30 0 30 60 90 120 150 180 210 240 270 300 330 360
10
15
20
25
30
35
Hv (
kg/m
m2 )
Angular Displacement ( deg )
Figure 5.9 Anisotropic nature for glycine oxalate crystals
Hk (
kg/m
m2 )
Load P (g)
Hv (
kg/m
m2 )
Angular displacement (deg)

115
5.3.7 Dielectric studies
Good quality single crystals of glycine oxalate having regular faces were
selected for dielectric measurements. The samples were prepared from large crystals
by thinning them to the appropriate thickness. Graphite was applied on opposite faces
of crystal, to make a capacitor with the crystal as medium. The dielectric constant,
dielectric loss and A.C. Conductivity were calculated.
The variation of A.C. Conductivity with temperature is presented in
Figure 5.10. It is seen that the A.C. Conductivity increases with increase in
temperature. This trend is due to the conduction of electrons which takes place at high
temperatures. The variations of dielectric constant with frequency at different
temperatures are presented in Figure 5.11. It is observed that dielectric constant
decreases rapidly at low frequencies and then slowly as the frequency increases and
finally it becomes a constant at higher frequencies [178].
30 40 50 60 70 80 90 1000.000000
0.000001
0.000002
0.000003
0.000004
0.000005
Temperature ( O C)
ac
100 Hz 1 KHz 10 KHz 100 KHz 1 MHz
Figure 5.10 Variation of A.C. Conductivity with Temperature for glycine
oxalate crystals
ac (o
hm-1
cm
-1)
Temperature (oC)

116
2 3 4 5 6
2
4
6
8
10
12
log f
Die
lect
ric c
onst
ant (
r )
368 K 363 K 358 K 353 K 348 K 343 K 338 K 333 K 328 K 323 K 318 K 313 K 308 K
Figure 5.11 Variation of Dielectric constant with frequency for glycine oxalate
crystals
It also indicates that the dielectric constant increases with increase in
temperature. At low frequencies and high temperatures, only space charge
polarization is dominant and it indicates the perfection of crystal. The low value of
dielectric constant at high frequency implies that the crystal possesses good optical
quality with lesser defects and this parameter is of vital importance for NLO materials
[179].
5.3.8 Etching studies
Etching is one of the selective tools which is used to identify the defects in
the grown crystals. When the crystal is dissolved in a solvent, the reversal of the
growth takes place by forming well defined etch pits. In the present work, ethanol,
methanol and water were used as etchants. The photographs were taken with a
maximum etching time of 60 seconds. The etch patterns for ethanol, methanol and
water as etchant are shown in the Figure 5.12 (a) - (c) respectively. The etch pits
formed are rod like in nature when ethanol was used as the etchant. Triangular etch
Die
lect
ric
cons
tant
(r)
log f

117
pits are obtained when methanol was used as the etchant. Deep striations were formed
on the surface of the crystal when water was used as the etchant.
(a)
(b)
(c)
Figure 5.12 Etch patterns for glycine oxalate crystals with (a) ethanol
(b) methanol and (c) water as etchant (t = 60 s)

118
5.3.9 Refractive index measurements
Finely polished crystals of the as grown glycine oxalate were used for
refractive index measurements. These crystal were cleaved and are placed on a
rotating mount at an angle varying from 0 to 90 degrees. He-Ne laser of wavelength
632.8 nm was used as the source. Brewster’s angle ( p) for glycine oxalate was
measured to be 54.4 degrees. The refractive index has been calculated using the
equation n = tan p, where p is the polarizing angle and it is found to be 1.397.
5.3.10 SHG and laser damage threshold studies
Fine powders of glycine oxalate were exposed under 1064 nm laser beam
to a pulsed Nd:YAG laser having a repetition rate of 10 Hz and pulse width of 8 ns to
test the second harmonic generation (SHG) efficiency. An input pulse of 5.8 mJ/pulse
was supplied. The glycine oxalate crystal gave an output of 4 mV. The standard KDP
crystal gave an SHG output of 20 mV. This indicates the glycine oxalate crystal has a
SHG efficiency nearly 0.20 times that of the standard KDP crystal.
The laser damage threshold were carried out for the glycine oxalate
crystals using single shot laser mode. The laser damage threshold was calculated
using the equation (2.10). The laser damage threshold of the crystal is found to be
6.230 GW/cm2 which is relatively larger than KDP [180]. Thus the glycine oxalate
crystal is a material with very high laser damage threshold compared to KDP and can
be used for device applications.
5.4 CONCLUSION
Bulk sized glycine oxalate crystals were grown by slow solvent
evaporation technique. Single crystal XRD and powder XRD confirmed the lattice
parameters. TGA and DSC studies reveals the thermal stability of the crystals.
UV-Visible studies and FTIR studies reveal the transmission range and functional
groups for the given material. The SHG studies and Laser Damage threshold studies
were carried out to study the suitability of the crystals for NLO applications. It is

119
found that glycine oxalate crystals have larger laser damage threshold than that of
KDP. The dielectric and A.C. Conductivity studies were carried out to study the
variation of dielectric constant with frequency and temperature. The refractive index
was determined using Brewster’s angle method. The Vickers hardness and Knoop
hardness were determined for the grown crystals. Thus, the excellent optical quality,
high thermal stability, high laser damage threshold makes glycine oxalate crystals, a
strong candidate for NLO applications.