chapter 5 graduate academic & professional...
TRANSCRIPT

44

Chapter 5 – Graduate Academic & Professional Degree Students (11th Edition) 45
Chapter 5 Graduate Academic & Professional Degree Students
Goals The University of Michigan offers a rigorous and remarkably broad array of graduate and professional degree programs that are among the very best in the country. The University attracts outstanding students to graduate study, and prepares them to make lasting contributions to society through successful careers in professions and academic disciplines. Interdisciplinary study and joint degrees are a special strength of the University. The vibrant community of graduate and professional students on campus is highly diverse in citizenship, demographic background, and intellectual perspective.
Overview The Horace H. Rackham School of Graduate Studies oversees graduate academic education in partnership with the schools and colleges. In fall 2017, the University enrolled 8,610 students in 119 Ph.D., 149 master's degree, and 45 graduate-level certificate programs offered by the schools and colleges. In addition to obtaining an education, graduate students contribute significantly to the conduct of research, scholarship and teaching on campus. The research enterprise at the U-M benefits enormously from the talent and intelligence of these students.
Another 7,571 students enrolled in fall 2017 in professional degree programs in medicine, law, business, public health, dentistry, pharmacy, nursing, information, engineering, social work and architecture and urban planning. The schools or colleges administer these degree programs in keeping with each profession’s requirements and standards.
The tuition paid by graduate and professional students varies considerably depending on the program. Almost all Ph.D. students and about half of academic Master’s students receive financial support.
Professional degree programs are generally more costly than graduate academic tuition. A large fraction of the students in professional degree programs complete graduate school with loans to repay. Eighty percent of students who recently completed U-M programs in medicine, law and dentistry owe an average of $100,000 or more in student loans.
The Rackham Graduate School collects data on the number of entering graduate students who complete Ph.D. programs Overall, about 75 percent of the students who enrolled in a
program between 2001 and 2011 have received a Ph.D. The rates vary somewhat by discipline.
By the time U-M Ph.D. students complete their degrees, a significant fraction will have published scholarly articles in journals or have articles accepted for publication. Since 2007, more than 80 percent of graduates from programs in the biological, health and physical sciences and engineering will have a publication record to include on their CVs. In that same time period, two-thirds of Michigan graduates in the social sciences and one-third of those in the humanities and arts are or soon will be published.
Post-graduation plans vary along disciplinary lines. Ph.D. graduates in the humanities and the arts often find academic positions immediately after graduating. Graduates in the biological, physical and social sciences frequently take a postdoctoral training position before moving into other employment. Industry positions attract a large number of graduates from engineering and the physical sciences. U-M’s international students tend to remain in the U.S. after graduation, probably reflecting the kind and number of opportunities available in this country for those holding advanced degrees.
In several professions, prospective practitioners must pass one or more examinations before becoming a full member of his or her chosen career; U-M students in medicine, law and dentistry have high pass rates.
For more information Horace H. Rackham School of Graduate Studies (rackham.umich.edu)
U-M Graduate Program Information (rackham.umich.edu/academics/programs-of-study)
Data about the gender and racial/ethnic diversity of graduate students are reported in Chapter 8.
Chapter 5 – Graduate Academic & Professional Degree Students (11th Edition) 46
Charts in Chapter 5 5.1.1 Graduate Academic and Professional Student Enrollment by Level, Fall 2007-17. 5.1.2 Graduate Academic and Professional Student Enrollment by Percent of Total Enrollment for U-M and AAU
Public and Private Universities, Fall 2007-17. 5.1.3 U-M Graduate Academic and Professional Student Enrollment Headcount, with Percent of Total Enrollment,
for Selected Years from 1960 to 2017. 5.1.4 U-M Graduate Academic and Professional Student Enrollment by School/College and Degree Sought,
Fall 2017. 5.2.1 Graduate Academic and Professional Degree Tuition and Required Fees, per Semester, 2017-18. 5.2.2 Graduate Academic Student Tuition and Required Fees, Adjusted for Inflation, per Semester,
FY1998-FY2018. 5.2.3 Graduate Professional Student Tuition and Required Fees, Adjusted for Inflation, In-State per Semester,
FY1998-FY2018. 5.2.4 Graduate Professional Student Tuition and Required Fees, Adjusted for Inflation, Out-of-State per Semester,
FY1998-FY2018. 5.3.1 Graduate Master’s, Academic Doctorate and Professional Doctorate Degrees Awarded, Headcount for U-M,
Peers and Big Ten Universities, 2014-15. 5.3.2 Ph.D. Degrees Awarded, Headcount and Percent, by Discipline Group for U-M, Peers and Big Ten
Universities, 2014-15. 5.3.3 Master’s Degrees Awarded, Headcount and Percent, by Discipline Group for U-M, Peers and Big Ten
Universities, 2014-15. 5.3.4 Professional Degrees Awarded, Headcount and Percent, by Program for U-M, Peers and Big Ten
Universities, 2014-15. 5.4.1 Academic Doctoral Completion Rates by Discipline Group, Enrollment Cohorts from 2002-11. 5.4.2 Academic Master’s Completion Rates by Discipline Group, Enrollment Cohorts from 2012-15. 5.5.1 Funding Support for Rackham Ph.D. Students, 2016-17. 5.5.2 Funding Support for Rackham Master’s Students, 2016-17. 5.6.1 Self-reported Cumulative Undergraduate and Graduate Debt by U-M Ph.D. students at Graduation,
by Discipline Group for Domestic Students, FY2006-16. 5.6.2 Graduate Professional Students’ Self-Reported Debt at Graduation, by Program, 2006-16. 5.7 Placement outcomes for U-M Ph.D. Students, by Discipline Group, FY2004-17. 5.8.1 Geographic Origins of U-M Graduate Academic Degree Recipients, Headcount and Percent, by Discipline
Group, FY2006-16. 5.8.2 Geographic Destinations of U-M Graduate Academic Degree Recipients, Headcount and Percent, by
Discipline Group, FY2006-16. 5.9.1 Pass Rates for Four States’ Bar (Law) Examinations by U-M Law School Graduates, 2012-16. 5.9.2 Pass Rates for U.S. Medical Licensing Examination by U-M Medical Students, 2012-16. 5.9.3 Pass Rates for Northeast Regional Board Examination by U-M D.D.S. Students, 2012-16.
Chart updated since the September 2017 edition.
Chapter 5 – Graduate Academic & Professional Degree Students (11th Edition) 47
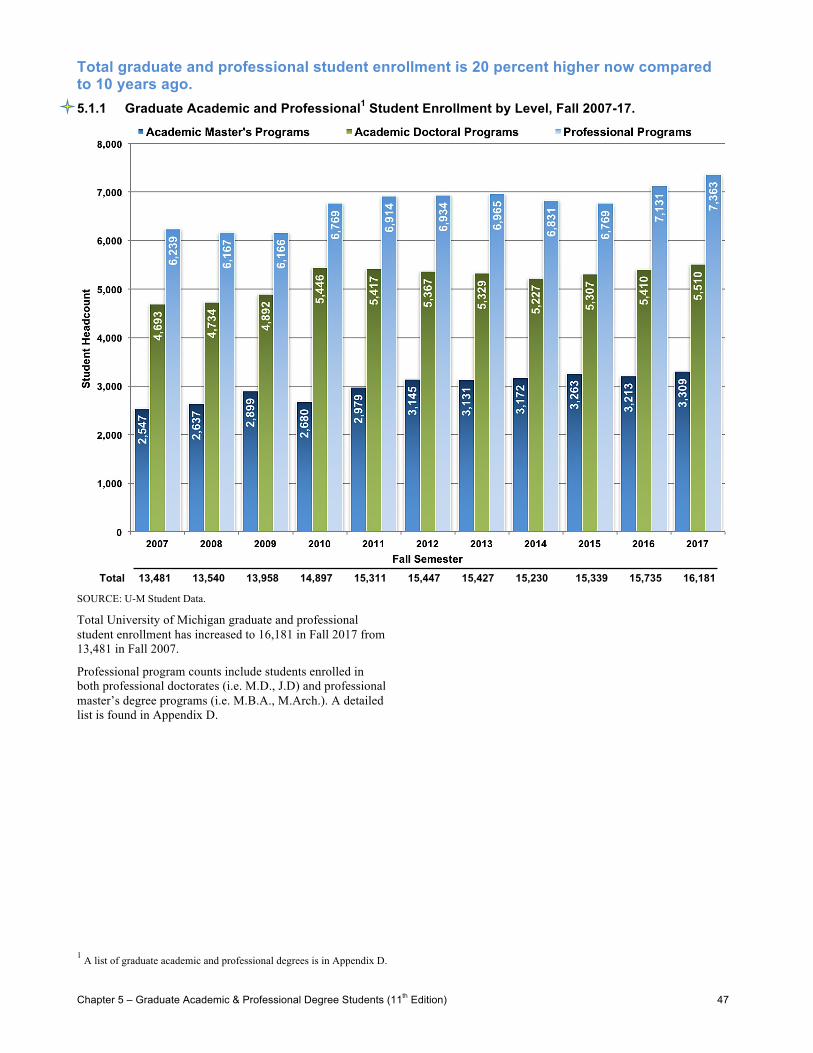
Total graduate and professional student enrollment is 20 percent higher now compared to 10 years ago. 5.1.1 Graduate Academic and Professional1 Student Enrollment by Level, Fall 2007-17.
Total 13,481 13,540 13,958 14,897 15,311 15,447 15,427 15,230 15,339 15,735 16,181
SOURCE: U-M Student Data.
Total University of Michigan graduate and professional student enrollment has increased to 16,181 in Fall 2017 from 13,481 in Fall 2007.
Professional program counts include students enrolled in both professional doctorates (i.e. M.D., J.D) and professional master’s degree programs (i.e. M.B.A., M.Arch.). A detailed list is found in Appendix D.
1 A list of graduate academic and professional degrees is in Appendix D.
Chapter 5 – Graduate Academic & Professional Degree Students (11th Edition) 48
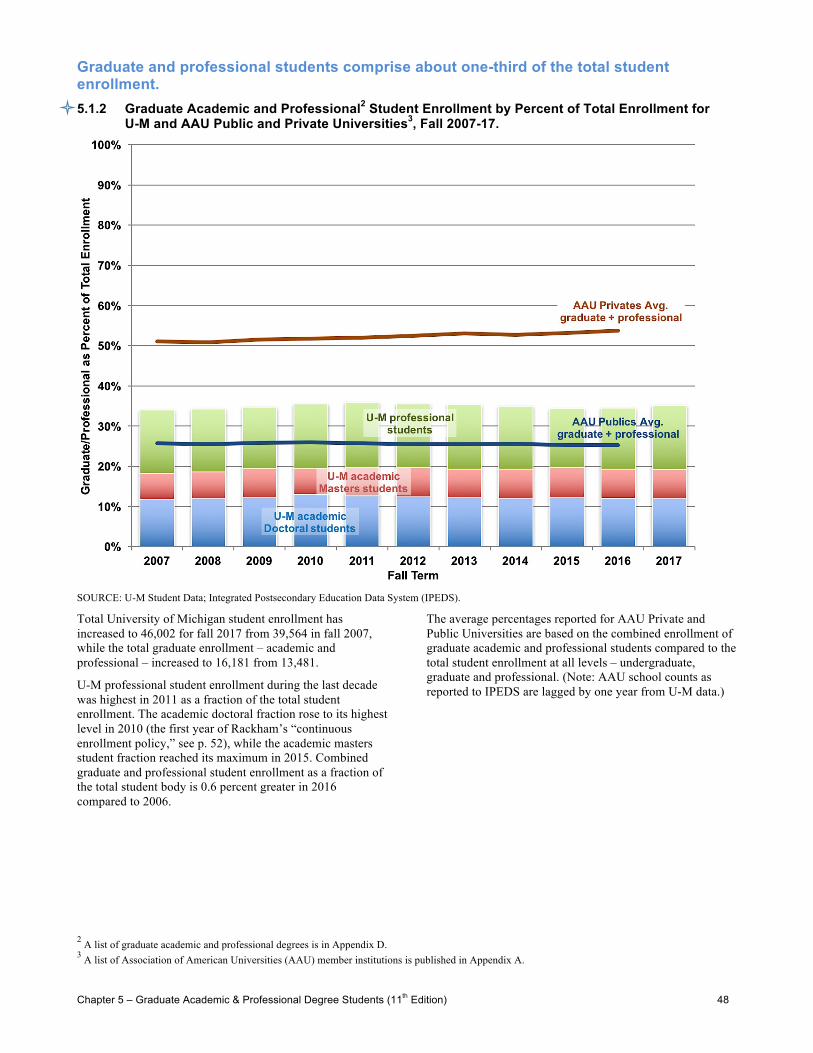
Graduate and professional students comprise about one-third of the total student enrollment. 5.1.2 Graduate Academic and Professional2 Student Enrollment by Percent of Total Enrollment for
U-M and AAU Public and Private Universities3, Fall 2007-17.
SOURCE: U-M Student Data; Integrated Postsecondary Education Data System (IPEDS).
Total University of Michigan student enrollment has increased to 46,002 for fall 2017 from 39,564 in fall 2007, while the total graduate enrollment – academic and professional – increased to 16,181 from 13,481.
U-M professional student enrollment during the last decade was highest in 2011 as a fraction of the total student enrollment. The academic doctoral fraction rose to its highest level in 2010 (the first year of Rackham’s “continuous enrollment policy,” see p. 52), while the academic masters student fraction reached its maximum in 2015. Combined graduate and professional student enrollment as a fraction of the total student body is 0.6 percent greater in 2016 compared to 2006.
The average percentages reported for AAU Private and Public Universities are based on the combined enrollment of graduate academic and professional students compared to the total student enrollment at all levels – undergraduate, graduate and professional. (Note: AAU school counts as reported to IPEDS are lagged by one year from U-M data.)
2 A list of graduate academic and professional degrees is in Appendix D. 3 A list of Association of American Universities (AAU) member institutions is published in Appendix A.

Chapter 5 – Graduate Academic & Professional Degree Students (11th Edition) 49
While the total number of graduate and professional students has grown from 8,916 in 1960 to 16,181 in 2017, the fraction of the total student body on the Ann Arbor campus that they represent has varied by less than five percent. 5.1.3 U-M Graduate Academic and Professional Student Enrollment Headcount, with Percent of Total
Enrollment, for Selected Years from 1960 to 2017.
SOURCE: U-M Student Data Sets.
In the chart, the number inside each column represents the total enrollment of graduate academic and professional students in the fall of that year. Over the last 50 years, Ann Arbor campus enrollment increased by about one graduate student for every two additional undergraduates.

Chapter 5 – Graduate Academic & Professional Degree Students (11th Edition) 50
The largest academic doctoral enrollment at U-M is in the College of Literature, Science & the Arts. The largest master's program is the M.B.A. in the Stephen M. Ross School of Business. 5.1.4 U-M Graduate Academic and Professional Student Enrollment by School/College and Degree
Sought, Fall 2017.
SOURCE: U-M Office of the Registrar.
The professional doctor’s degrees include M.D., J.D., D.D.S, Pharm.D. (Doctor of Pharmacy), D.Eng. (Doctor of Engineering), D.P.H (Doctor of Public Health), and D.N.P. (Doctor of Nursing Practice).
The Joint Program (last row of table) is offered by the School of Information and the School of Public Health.
A complete list of graduate academic, other and professional degrees offered by the University of Michigan is found in Appendix D.
College/School Academic Other Professional
Master’s Ph.D. Master's Doctor’s Doctor’s Taubman College of Architecture & Urban Planning 91 43 356 - -
Penny W. Stamps School of Art & Design 18 - - - - Stephen M. Ross School of Business - 84 1,730 - - School of Dentistry 98 12 - - 471 School of Education 224 155 - - - College of Engineering 1.489 1,666 479 3 - School for Environment & Sustainability 252 32 - - - Horace H. Rackham School of Graduate Studies 87 408 - - -
School of Information - 66 406 - - School of Kinesiology 70 24 - - - Law School - - - - 967 College of Literature, Science & the Arts 412 2,101 - - - Medical School 134 335 17 - 892 School of Music, Theatre & Dance 12 112 179 - - School of Nursing - 32 261 - 85 College of Pharmacy - 83 - - 85 School of Public Health 146 230 621 1 - Gerald R. Ford School of Public Policy 194 - - - - School of Social Work - - 694 - - Joint Programs by two Schools/Colleges - - 75 - -
Grand Total, Graduate Students 3,227 5,383 4,818 4 2,749

Chapter 5 – Graduate Academic & Professional Degree Students (11th Edition) 51
Graduate academic and professional tuition and required fees vary by program. 5.2.1 Graduate Academic and Professional Degree Tuition and Required Fees, per Semester, 2017-18.
School/College Graduate Academic, per semester Professional, per semester
Program In-State Out-of-State Program In-State Out-of-
State Taubman College of Architecture & Urban Planning
M.S./M.U.P. $14,741 $21,499 M.Arch. $14,741 $21,451
Ph.D. Candidate $6,178 $6,178 Penny W. Stamps School of Art & Design M.F.A $11,566 $22,451
Stephen M. Ross School of Business M.A./Pre-candidate $11,823 $22,513
M.B.A. $31,314 $33,814 Ph.D. Candidate $6,451 $6,451
School of Dentistry M.S./Pre-candidate $8,621 $14,575 D.D.S.
(3 sem./yr.) $13,396 $20,855 Ph.D. Candidate $6,151 $6,151
School of Education M.A./Pre-candidate $11,566 $23,199
Ph.D. Candidate $6,236 $6,236
College of Engineering M.S./Pre-candidate $12,900 $24,111 M.Eng. $13,251 $24,507
Ph.D. Candidate $7,394 $7,394 D.Eng. $8,985 $8,985
School of Environment & Sustainability
M.S./Pre-candidate $11,200 $22,023 Ph.D. Candidate $6,041 $6,041
School of Information Pre-candidate $11,348 $22,742
M.S.I. $11,348 $22,742 Ph.D. Candidate $6,118 $6,118
School of Kinesiology Pre-candidate $12,314 $24,850
Ph.D. Candidate $6,118 $6,118
Law School J.D. $28,586 $30,209
College of Literature, Science, & the Arts
M.A./M.S./ Pre-candidate $11,348 $22,742
Ph.D. Candidate $6,118 $6,118
Medical School M.S./Pre-candidate $11,371 $22,788 M.H.P.E $8,342 $9,100
Ph.D. Candidate $6,249 $6,249 M.D. $18,040 $27,447
School of Music, Theatre & Dance
M.A./M.F.A/ Pre-candidate $11,566 $23,199
M.M./ Spec.M. $11,865 $23,499 A.Mus.D. Candidate $7,571 $7,571
Ph.D. Candidate $6,236 $6,236
School of Nursing M.S./Pre-candidate $11,697 $23,461
Ph.D. Candidate $6,236 $6,236
College of Pharmacy M.S./Pre-candidate $11,348 $22,742
Pharm.D. $13,982 $19,701 Ph.D. Candidate $6,118 $6,118
School of Public Health M.S./Pre-candidate $14,082 $23,160
M.P.H. $14,082 $23,160 Ph.D. Candidate $6,230 $6,230
Gerald R. Ford School of Public Policy M.P.P./M.P.A. $12,833 $23,199
School of Social Work M.S.W $13,583 $21,663
SOURCE: U-M Office of the Registrar.
These cost figures represent the published rates, although many students in these programs receive financial aid, which translates to a lower net price. Unless otherwise indicated, students usually attend school for two semesters per academic year.
Several schools and colleges offer specialized degrees and joint degree programs that are not listed above. The Registrar’s Office posts tuition and fees for these programs at ro.umich.edu/tuition/.

Chapter 5 – Graduate Academic & Professional Degree Students (11th Edition) 52
The inflation-adjusted tuition and required fees (“sticker price”) for both in-state and out-of-state Ph.D. pre-candidacy students increased by nearly 50 percent from FY1998 to FY2018. However, as shown in chart 5.5.1, more than 90 percent of Ph.D. students receive tuition stipends or other financial support. 5.2.2 Graduate Academic Student Tuition and Required Fees, Adjusted for Inflation4,
per Semester, FY1998-2018.
SOURCE: UM Registrar.
The chart represents tuition and required fees for graduate academic students in the College of Literature, Science and the Arts; School of Information; and College of Pharmacy. Rates vary for students enrolled in other graduate academic programs. (See chart 5.2.1)
Effective Fall 2010, tuition and required fees paid by Ph.D. candidates declined by $1,760 per year (dotted line). This reduction occurred at the same time that the U-M instituted a continuous enrollment policy for Ph.D. students.5 The policy calls for these students to register in every fall and winter semester until they complete their degrees, unless they are on approved leaves of absence. The policy is designed to improve the likelihood that students will complete their Ph.D. degrees, without imposing any new financial burden on students or graduate program budgets.
4 Based on the FY2018 U.S. Consumer Price Index (as estimated by the U-M Research Seminar in Quantitative Economics).

Chapter 5 – Graduate Academic & Professional Degree Students (11th Edition) 53
The inflation-adjusted tuition and required fees for the M.B.A. and Law degrees increased more rapidly over the last 20 years than for other professional degrees offered by the U-M. 5.2.3 Graduate Professional Student Tuition and Required Fees, Adjusted for Inflation5,
In-State per Semester, FY1998-2018.
5.2.4 Graduate Professional Student Tuition and Required Fees, Adjusted for Inflation5,
Out-of-State per Semester, FY1998-2018.
SOURCE: UM Registrar.
† Starting in Fall 2011, D.D.S. students paid tuition three times per year instead of two, with the per-semester rate adjusted downward to be comparable with the previous annual total. 5 Based on FY 2018 U.S. Consumer Price Index (as estimated by the U-M Research Seminar in Quantitative Economics).
Chapter 5 – Graduate Academic & Professional Degree Students (11th Edition) 54
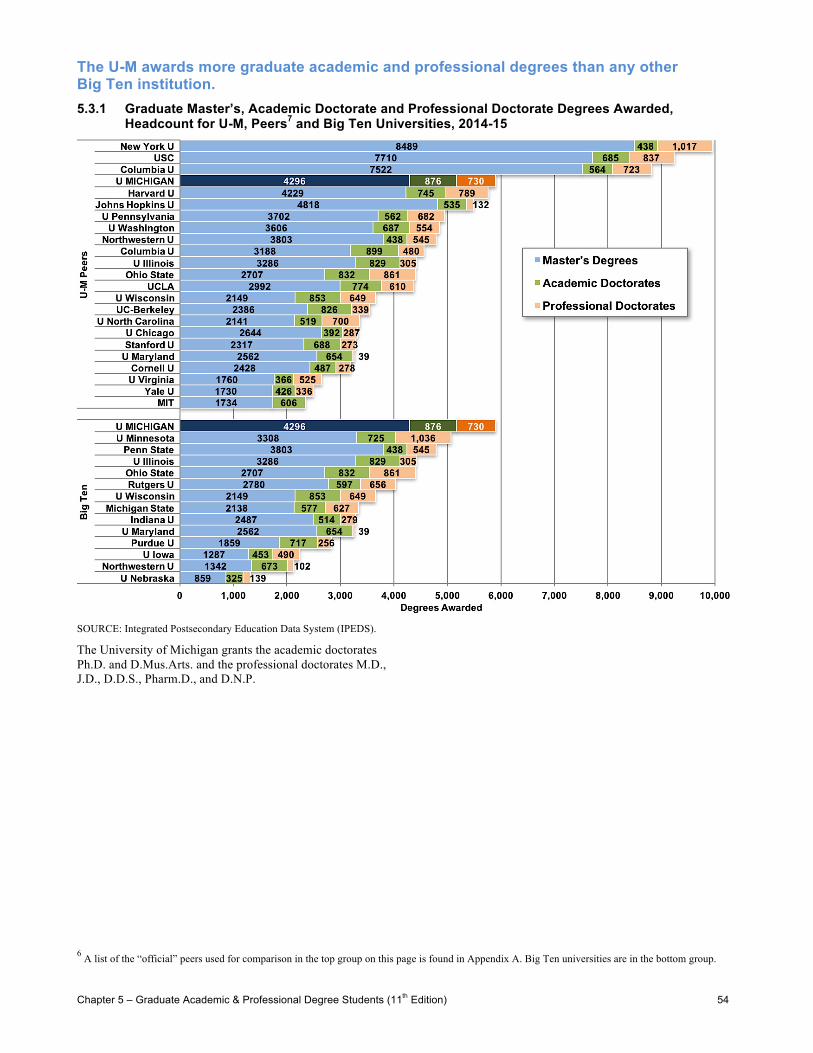
The U-M awards more graduate academic and professional degrees than any other Big Ten institution. 5.3.1 Graduate Master’s, Academic Doctorate and Professional Doctorate Degrees Awarded,
Headcount for U-M, Peers7 and Big Ten Universities, 2014-15
SOURCE: Integrated Postsecondary Education Data System (IPEDS).
The University of Michigan grants the academic doctorates Ph.D. and D.Mus.Arts. and the professional doctorates M.D., J.D., D.D.S., Pharm.D., and D.N.P.
6 A list of the “official” peers used for comparison in the top group on this page is found in Appendix A. Big Ten universities are in the bottom group.

Chapter 5 – Graduate Academic & Professional Degree Students (11th Edition) 55
The U-M is a top producer of STEM Ph.D. graduates compared to its peers. 5.3.2 Ph.D. Degrees Awarded, Headcount (top) and Percent (bottom), by Discipline Group7 for U-M,
Peers and Big Ten Universities, 2014-15.
SOURCE: Integrated Postsecondary Education Data System (IPEDS). 7 A list of disciplines assigned to each group is found in Appendix C.

Chapter 5 – Graduate Academic & Professional Degree Students (11th Edition) 56
In the life sciences, physical sciences and engineering – also known as STEM fields (science, technology, engineering and mathematics) – U-M awarded 574 Ph.D. degrees in 2014-15, more than any of its peers for the academic year. The number of graduates in STEM fields is important because some analyses indicate that the American workforce will need to add about one million more STEM professionals over the next decade than the U.S. will produce at current rates.8
To keep the comparisons consistent between U-M and the other schools included here, we assigned all degree awards for Charts 5.3.2, 5.3.3 and 5.3.4 at the peer and Big Ten universities to the same academic disciplines and professional categories as the U-M uses, even if other schools might assign the programs differently on their campuses.
8 “Engage to Excel: Producing One Million Additional College Graduates with Degrees in Science, Technology, Engineering, And Mathematics,” President’s Council of Advisors on Science and Technology (PCAST), February 2012.

Chapter 5 – Graduate Academic & Professional Degree Students (11th Edition) 57
Half of U-M’s Master’s degrees are in STEM fields. 5.3.3 Academic Master’s Degrees Awarded, Headcount (top) and Percent (bottom),
by Discipline Group9 for U-M, Peers and Big Ten Universities, 2014-15.
SOURCE: Integrated Postsecondary Education Data System (IPEDS). 9 A list of disciplines assigned to each group is found in Appendix C.

Chapter 5 – Graduate Academic & Professional Degree Students (11th Edition) 58
Among the academic Master’s degrees awarded in 2014-15, 2,121 U-M students graduated in the sciences, technology, engineering or mathematics. Among U-M’s peers, only Columbia (2,770) awarded a higher number of Master’s degrees in these fields.
To keep the comparisons consistent between U-M and the other schools included here, we assigned all degree awards for Charts 5.3.2, 5.3.3 and 5.3.4 at the peers and Big Ten universities to the same academic disciplines and professional categories as the U-M uses, even if other schools might assign the programs differently on their campuses.

Chapter 5 – Graduate Academic & Professional Degree Students (11th Edition) 59
The U-M grants a large number of professional degrees compared to most peer universities. 5.3.4 Professional Degrees Awarded, Headcount (top) and Percent (bottom), by Program
for U-M, Peers10 and Big Ten Universities, 2014-15.
SOURCE: Integrated Postsecondary Education Data System (IPEDS). 10 A list of the “official” peers used for comparison in the top group on this page is found in Appendix A. Big Ten universities are in the bottom group.
Chapter 5 – Graduate Academic & Professional Degree Students (11th Edition) 60
The U-M awards degrees in five professional programs: Law, Medicine, Dentistry, Pharmacy, and Nursing Practice (D.N.P.).
The “Other” category includes professional degrees not offered by the U-M, such as in Veterinary Medicine, Optometry, Osteopathic Medicine, Communication Disorders, and a few other specialized health areas.
To keep the comparisons consistent between U-M and the other schools included here, we assigned all degree awards for Charts 5.3.2, 5.3.3 and 5.3.4 at the peers and Big Ten universities to the same academic disciplines and professional categories as the U-M uses, even if other schools might assign the programs differently on their campuses.

Chapter 5 – Graduate Academic & Professional Degree Students (11th Edition) 61
The profile of U-M doctoral student graduation rates in recent years is fairly consistent across the disciplines. Overall, 75 percent of students who enrolled in a doctoral program on the Ann Arbor campus between Spring term 2002 and Winter term 2010 have graduated with a Ph.D. 5.4.1 Academic Doctoral Completion Rates by Discipline Group11, Enrollment Cohorts
2002-11.
SOURCE: Horace H. Rackham School of Graduate Studies.
This chart examines a range of doctoral entry cohorts and shows the number and percent of each cohort that have completed their degrees, or are still enrolled, as of August 31, 2017. Furthermore, a recent report by the Rackham School of Graduate Studies shows that 79 percent of Ph.D. students who first enrolled between 2005 and 2010 have completed their doctoral degrees or are on track to do so in a timely manner.12
11 A list of disciplines assigned to each group is found in Appendix C. 12 "Changes at Rackham help boost doctoral degree completion rate," University Record, May 28, 2015.

Chapter 5 – Graduate Academic & Professional Degree Students (11th Edition) 62
Ninety-one percent of students who enrolled in U-M academic Master’s programs on the Ann Arbor campus from Spring term 2012 through Winter term 2015 have completed their degrees. 5.4.2 Academic Master’s Completion Rates by Discipline Group13, Enrollment Cohorts 2012-15
SOURCE: Horace H. Rackham School of Graduate Studies.
U-M Master’s programs usually require about two years to complete, so the average in the headline does not take into account the completion counts for the Master's students who first enrolled in the Fall 2015 term.
13 A list of disciplines assigned to each group is found in Appendix C.

Chapter 5 – Graduate Academic & Professional Degree Students (11th Edition) 63
Ninety-eight percent of Rackham graduate students pursuing Ph.D. degrees receive financial support from the University. 5.5.1 Funding Support for Rackham Ph.D. Students14, 2016-17.
SOURCE: Horace H. Rackham School of Graduate Studies Student Funding Reports.
Percentages might not sum to 100% due to rounding.
14 A list of disciplines assigned to each group is found in Appendix C.
In all fields of study, a large fraction of academic Ph.D. students receives both tuition grants and a stipend to help cover living expenses. In many cases, students competed successfully for external funding and did not need additional financial support. Stipends may be paid as part of an appointment as a Graduate Student Instructor (GSI), Graduate Student Research Assistant (GSRA), Graduate Student Staff Assistant (GSSA), or as a fellowship.

Chapter 5 – Graduate Academic & Professional Degree Students (11th Edition) 64
Financial support provided to Rackham students pursuing Master’s degrees varies by field of study. 5.5.2 Funding Support for Rackham Master’s Students15, 2016-17.
SOURCE: Horace H. Rackham School of Graduate Studies Student Funding Reports.
Percentages might not sum to 100% due to rounding.
15 A list of disciplines assigned to each group is found in Appendix C.
The five categories of support (No Support, and covering 1%-25%, 26%-50%, 51%-75%, 76%-100% of costs) represent the fraction of the total calculated cost of attendance provided as tuition grants and stipends to students enrolled in Master’s programs. Loans that Master’s students may acquire are not included in these calculations.

Chapter 5 – Graduate Academic & Professional Degree Students (11th Edition) 65
Three-fifths of U-M Ph.D. students graduate without any student loan debt. 5.6.1 Self-reported Cumulative Undergraduate and Graduate Debt by U-M Ph.D. students at
Graduation, by Discipline Group16 for Domestic Students, FY2006-16.
Percent of Ph.D. Graduates without debt
SOURCE: NSF/NIH/USED/USDA/NEH/NASA, Survey of Earned Doctorates.
Fewer than half (40% over the time period shown) of University of Michigan Ph.D. students graduate with student-loan debt that was acquired over the course of their undergraduate and graduate careers. The aggregate averages of Ph.D. graduates with debt by discipline groups vary: Life Sciences (45%), Physical Sciences & Engineering (31%), Social Sciences (49%), Humanities & the Arts (52%).
The issue of student debt remains important to the University of Michigan and higher education overall. Student loan debt presents a serious challenge to scholars just starting their careers, especially for the small number of students in the life sciences, physical sciences and engineering and social sciences who have accumulated student loan debt that exceeds $100,000.
16 A list of the disciplines assigned to each category is in Appendix C.
52%
52
%
56%
57
%
54%
59
%
57%
50
%
50%
55
%
55%
67
%
73%
71
%
67%
67
%
67%
67
%
68%
72
%
69%
69
%
52%
49
%
55%
58
%
49%
55
%
47%
55
%
51%
51
%
47%
47
%
46%
42
%
52%
47
%
51%
51
%
52%
52
%
39%
48
%

Chapter 5 – Graduate Academic & Professional Degree Students (11th Edition) 66
After adjusting for inflation17, the level of student loan debt for M.D. graduates is high, but somewhat stable over the last several years. D.D.S. graduates have exhibited an increase in total debt after a three-year drop, while debt has steadily increased for J.D. graduates. 5.6.2 Graduate Professional Students’ Self-reported Debt at Graduation, by Program, 2006-16.
SOURCE: School Dean or Financial Aid Office.
Between 80 and 90 percent of professional degree graduates have student loan debt when they complete their programs. For all programs, the debt averages are calculated based only on students with student-loan debt.
The debt acquired by professional students is a matter of national concern. For instance, the likelihood of incurring sizeable debt to attend a professional school may contribute to the relatively small proportion of under-represented minorities enrolled in these programs at the University (see Chart 8.6.1).
17 Based on the FY2016 U.S. Consumer Price Index.

Chapter 5 – Graduate Academic & Professional Degree Students (11th Edition) 67
A large fraction of Ph.D. graduates in the physical sciences and engineering go into private or non-profit sector jobs. Ph.D. graduates in the other discipline groups tend to move more toward higher education positions. 5.7 Placement Outcomes for U-M Ph.D. Students, by Discipline Group18, FY2004-17.
SOURCE: Survey of Academic Departments by Rackham Graduate School.
Blue shades represent higher education positions, reds indicate post-doctoral or other post-graduate training, greens are positions outside of higher education, and the grays represent unknown activity or not currently employed.
18 A list of disciplines assigned to each group is found in Appendix C.
More than half of academic Ph.D. graduates in the biological and health sciences enter post-doctoral training during the first year following graduation. As time since graduation passes, many of the post-docs move into academic positions in higher education or take jobs in industry, government or the non-profit sector.
About the same number of academic Ph.D. graduates in the physical sciences and engineering initially take a position outside of academia as enter post-doctoral training. After five or more years after graduation, they are employed in industry, government or the non-profit sector, or entering academic positions.

Chapter 5 – Graduate Academic & Professional Degree Students (11th Edition) 68
5.7 Placement outcomes for U-M Ph.D. Students, by Discipline Group19, FY2004-17 (continued).
SOURCE: Survey of Academic Departments by Horace H. Rackham School of Graduate School.
Blue shades represent higher education positions, reds indicate post-doctoral or other post-graduate training, greens are positions outside of higher education, and the grays represent unknown activity or not currently employed.
19 A list of disciplines assigned to each group is found in Appendix C.
Ph.D. graduates in the humanities and arts are less likely to pursue postdoctoral training than their counterparts in other disciplines. About one-fourth of humanities and arts Ph.D. graduates are on the tenure track initially, and the fraction doubles by ten years post-graduation.
More than two-fifths of academic Ph.D. graduates in the social sciences enter a higher education position during the first year following graduation, with about two-thirds of these on the tenure-track. By five years after graduation, about half of U-M’s social science Ph.D. graduates have tenure-track positions, and another 20 percent hold non-tenure-track positions at a college or university.

Chapter 5 – Graduate Academic & Professional Degree Students (11th Edition) 69
U-M Ph.D. programs are attractive to students from all geographic locales. 5.8.1 Geographic Origins of U-M Ph.D. Recipients, Headcount (top) and Percent (bottom)
by Discipline Group20, FY2006-16.
SOURCE: NSF/NIH/USED/USDA/NEH/NASA, Survey of Earned Doctorates.
The large number of international students enrolled in physical science and engineering Ph.D. programs is not a surprise, given the attractiveness of these kinds of programs. According to a 2012 National Science Foundation report, international students comprise 30 percent of U.S. graduate
science and engineering programs21. For the decade displayed here, international students make up 49 percent of total enrollment in U-M physical science and engineering Ph.D. programs.
20 A list of disciplines assigned to each group is found in Appendix C. 21 InfoBrief, National Center for Science and Engineering Statistics, May 2012, NSF 12-317.

Chapter 5 – Graduate Academic & Professional Degree Students (11th Edition) 70
A comparison of geographic origins (5.8.1) and destinations (below) of U-M Ph.D. students illustrates that a large proportion of international students remain in the U.S. after graduation. 5.8.2 Geographic Destinations of U-M Ph.D. Recipients, Headcount (top) and Percent (bottom)
by Discipline Group22, FY2006-16.
SOURCE: NSF/NIH/USED/USDA/NEH/NASA, Survey of Earned Doctorates.
22 A list of disciplines assigned to each group is found in Appendix C.

Chapter 5 – Graduate Academic & Professional Degree Students (11th Edition) 71
U-M law, medicine and dentistry students pass their licensing exams at very high rates. 5.9.1 Pass Rates for Four States’ Bar (Law) Examinations by U-M Law School Graduates, 2012-16.
SOURCE: Registrar, U-M Law School
5.9.2 Pass Rates for U.S. Medical Licensing Examination by U-M Medical Students, FY2012-16.
SOURCE: Registrar, Medical School.
The U.S. Medical Licensing Examination is administered by the National Board of Medical Examiners in several parts: Step I exam at the end of the second year of medical school, both Step 2 exams (CK=Clinical Knowledge, CS=Clinical
Skills) during the fourth year of medical school, and Step 3 exam 1-2 years after graduation. The pass rates are computed based on first-time takers of each segment.
5.9.3 Pass Rates for Northeast Regional Board Examination by U-M D.D.S. Students, 2012-16.
SOURCE: School of Dentistry.
Pass rates for the Northeast Regional Board Examination are computed for graduating U-M D.D.S. students who have passed all components of the “curriculum integrated format” examination prior to graduation.
(California data not available for 2016.)

REMOVE FROM PDF BEFORE POSTING