chapter 5 – glazing properties -...
TRANSCRIPT

Chapter5–GlazingPropertiesBuildingEnergyEfficiencyTechnicalGuidelineforPassiveDesign (Draft1)
CK Tang

Page 2 of 13
Foreword This document is produced as part of Component 4, Building Sector Energy Efficiency Program
(BSEEP) by CK Tang ([email protected]) and Nic Chin ([email protected]).
The views expressed in this document, which has been produced without formal editing, are those
of the authors and do not necessarily reflect the views of neither JKR nor UNDP. Comments and
opinions from readers are encouraged and please email it to either [email protected] or
[email protected] or comment at our Facebook page: www.facebook.com/bseepc4
CK Tang
August 23, 2012

Page 3 of 13
TableofContents5 Glazing Properties ........................................................................................................................... 4
5.1 Introduction ............................................................................................................................ 4
5.2 Key Recommendations ........................................................................................................... 4
5.3 The Solar Spectrum ................................................................................................................. 5
5.4 Glazing Terminologies ............................................................................................................. 6
5.4.1 Visible Light Transmission (VLT) ...................................................................................... 6
5.4.2 Solar Heat Gain Coefficient (SHGC) or g‐value ................................................................ 6
5.4.3 Light to Solar Gain Ratio (LSG) ........................................................................................ 6
5.4.4 U‐value (W/m²K) ............................................................................................................. 7
5.5 Glazing Technologies for Energy Efficiency ............................................................................. 7
5.5.1 Single Glazing Low‐E........................................................................................................ 7
5.5.2 Double Glazing Low‐E ..................................................................................................... 7
5.6 Energy Simulation ................................................................................................................... 7
5.6.1 Reduction of Glazing Area ............................................................................................... 7
5.6.2 Reduction of Solar Heat Gain Coefficient (SHGC) ........................................................... 9
5.6.3 Reduction of U‐value in Glazing .................................................................................... 10
5.7 The MS1525 OTTV ................................................................................................................. 10
5.7.1 Replacement of SC with SHGC in OTTV ......................................................................... 12
5.7.2 Using OTTV to Estimate Energy Reduction ................................................................... 12

Page 4 of 13
5 GlazingProperties
5.1 IntroductionIn recent years, a number of local buildings in Malaysia have been built using simple single clear
glazing for a ‘transparent’ building look, clearly unaware (or not troubled) that the use of such
glazing selection increases the air‐conditioning load of the building significantly causing high energy
use and increased capital cost of the air‐conditioning system. These buildings highlighted that there
are architects that are not aware of the changes in glazing technology that allowed such transparent
building to be constructed energy efficiently without compromising on the ‘transparent’ look of the
building.
The selection of correct glazing properties can help to increase energy efficiency in the building and
yet provide the ‘desired look’ of the building. Right glazing selection can reduce the cooling load in
building, provides better comfort while allowing smaller air‐conditioning system to be used, saving
investment cost. In addition, selection of right glazing also influence the potential of daylight
harvesting in building that will reduce electrical lights usage that saves a significant amount of
energy in building, as well as providing an improved thermal comfort and visual comfort
environment to the building occupants.
Finally, many architects today understood the need to have low solar heat gain coefficient (SHGC) to
reduce heat gain in building and high visible light transmission (VLT) to promote daylight harvesting.
However, not many understood the relationship between SHGC and VLT due to different glazing
technology and mechanism used. This, among many issues with regards to glazing properties
selection, is addressed in this chapter.
5.2 KeyRecommendationsThe most important factor to consider in this climate zone for glazing selection, in terms of energy
efficiency, is the solar heat gain coefficient (SHGC). The lower the SHGC value, the better it is
because it means that less solar heat would enter the building through the glazing.
Another important factor to consider in glazing selection for energy efficiency is the visible light
transmission (VLT) of the glazing. The VLT of glazing will determine the amount of daylight that is
possible to be harvested. In Chapter 4, it was shown that glazing with VLT below 20% is deemed too
dark for daylight harvesting. In addition, higher VLT does not necessary mean more daylight
harvesting. It was also shown in Chapter 4 that glazing with higher VLT values will require better
daylight reflection system be in place to distribute the daylight evenly for better efficiency gain.
The ratio of VLT over SHGC provides a term called light to solar gain ratio (LSG). Single glazing
without low‐e properties has LSG values of 0.5 to 1.0 depending on the colour of the glazing. Single
glazing with low‐e properties has typical LSG values of 1.05 to 1.25. High performance, double
glazing with low‐e properties has typical LSG values of 1.6 to 2.0.
It is recommended not to use double glazing with LSG values less than 1.5, because the marginal cost
of having double glazing with LSG value above 1.5 is relatively low once double glazing is selected to
be used in the 1st place.
Page 5 of 13
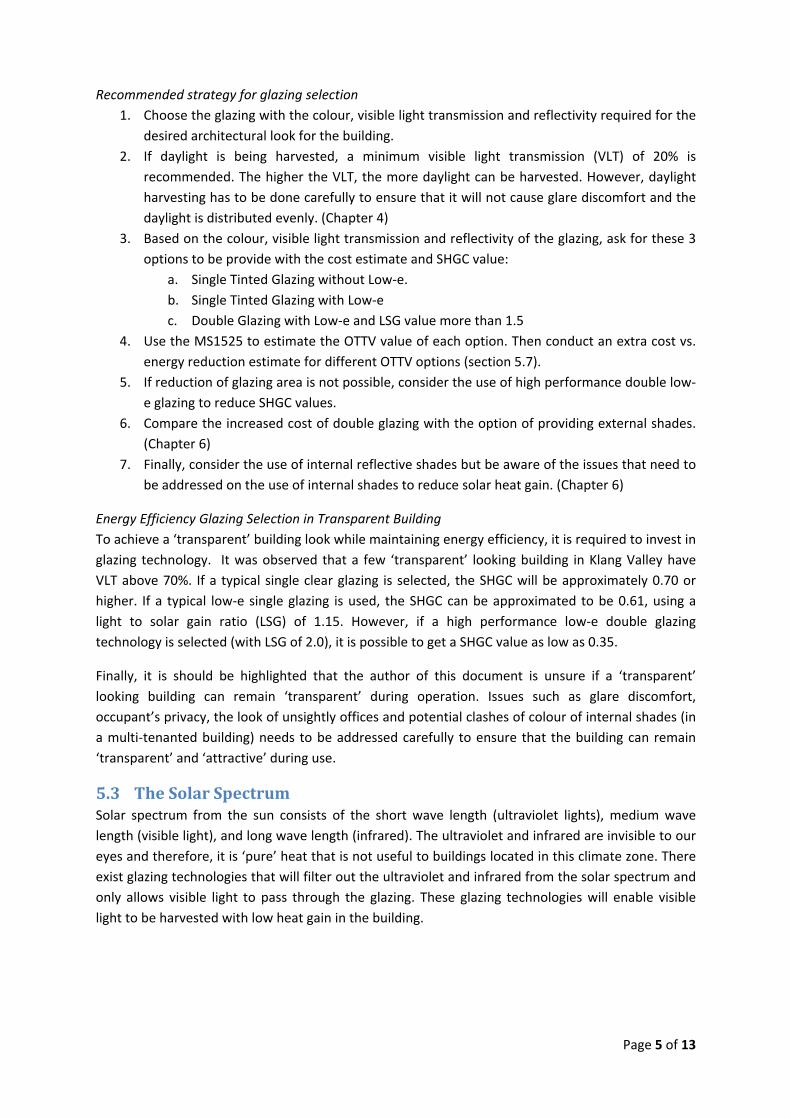
Recommended strategy for glazing selection
1. Choose the glazing with the colour, visible light transmission and reflectivity required for the
desired architectural look for the building.
2. If daylight is being harvested, a minimum visible light transmission (VLT) of 20% is
recommended. The higher the VLT, the more daylight can be harvested. However, daylight
harvesting has to be done carefully to ensure that it will not cause glare discomfort and the
daylight is distributed evenly. (Chapter 4)
3. Based on the colour, visible light transmission and reflectivity of the glazing, ask for these 3
options to be provide with the cost estimate and SHGC value:
a. Single Tinted Glazing without Low‐e.
b. Single Tinted Glazing with Low‐e
c. Double Glazing with Low‐e and LSG value more than 1.5
4. Use the MS1525 to estimate the OTTV value of each option. Then conduct an extra cost vs.
energy reduction estimate for different OTTV options (section 5.7).
5. If reduction of glazing area is not possible, consider the use of high performance double low‐
e glazing to reduce SHGC values.
6. Compare the increased cost of double glazing with the option of providing external shades.
(Chapter 6)
7. Finally, consider the use of internal reflective shades but be aware of the issues that need to
be addressed on the use of internal shades to reduce solar heat gain. (Chapter 6)
Energy Efficiency Glazing Selection in Transparent Building
To achieve a ‘transparent’ building look while maintaining energy efficiency, it is required to invest in
glazing technology. It was observed that a few ‘transparent’ looking building in Klang Valley have
VLT above 70%. If a typical single clear glazing is selected, the SHGC will be approximately 0.70 or
higher. If a typical low‐e single glazing is used, the SHGC can be approximated to be 0.61, using a
light to solar gain ratio (LSG) of 1.15. However, if a high performance low‐e double glazing
technology is selected (with LSG of 2.0), it is possible to get a SHGC value as low as 0.35.
Finally, it is should be highlighted that the author of this document is unsure if a ‘transparent’
looking building can remain ‘transparent’ during operation. Issues such as glare discomfort,
occupant’s privacy, the look of unsightly offices and potential clashes of colour of internal shades (in
a multi‐tenanted building) needs to be addressed carefully to ensure that the building can remain
‘transparent’ and ‘attractive’ during use.
5.3 TheSolarSpectrumSolar spectrum from the sun consists of the short wave length (ultraviolet lights), medium wave
length (visible light), and long wave length (infrared). The ultraviolet and infrared are invisible to our
eyes and therefore, it is ‘pure’ heat that is not useful to buildings located in this climate zone. There
exist glazing technologies that will filter out the ultraviolet and infrared from the solar spectrum and
only allows visible light to pass through the glazing. These glazing technologies will enable visible
light to be harvested with low heat gain in the building.

Page 6 of 13
Figure 5.1: Solar Spectrum Components
5.4 GlazingTerminologiesFor the tropical climate, where harvesting daylight would improve the energy efficiency of the
building significantly, the following terminologies are relevant:
5.4.1 VISIBLELIGHTTRANSMISSION(VLT)This is the total amount of visible light that passes through the glazing. Some part of the light would
also be reflected and absorbed by the glazing. The higher the VLT, the more daylight harvesting
opportunity there is. It is recommended to match the daylight harvesting strategy to the selection of
VLT of the glazing. In general, glazing with VLT less than 10% looks very dull from within the building
due to the lack of daylight in the building itself.
5.4.2 SOLARHEATGAINCOEFFICIENT(SHGC)ORG‐VALUEThis is the total amount of solar heat that passes through the glazing. The lower the value, the better
it is for tropical climate because less solar heat is transferred into the building. In single glazing, the
lowest SHGC achievable is approximately 0.2 with VLT values less 10%. Due to the low VLT, it may
not be desirable to use such glazing. However, in high performance low‐e double glazing, it is
possible to get SHGC lower than 0.15 with VLT of 25% or higher.
The term "SHGC" is relatively new and is intended to replace the term "shading coefficient (SC)."
While the terms are related, the shading coefficient of glass is defined as the ratio of the solar heat
gain through a given glazing as compared to that of clear, 1/8 inch single pane glass.
5.4.3 LIGHTTOSOLARGAINRATIO(LSG)LSG is the ratio between the visible light transmissions to the solar heat gain coefficient. The higher
this number is, the better it is for buildings where daylight is harvested.
%%
Single glazing without low‐e properties has typical LSG values of 0.5 to 1.0.
Single glazing with low‐e properties has typical LSG values of 1.05 to 1.3.

Page 7 of 13
High performance double glazing with low‐e properties has typical LSG values of 1.5 to 2.0.
5.4.4 U‐VALUE(W/M²K)The U‐value of a glazing is a measure of conduction heat gain through the glazing unit. However, the
U‐value of glazing has a comparatively small influence on the building energy consumption in
tropical climate as compared to the VLT, SHGC and LSG properties of the glazing. For the tropical
climate, it is recommended to select glazing based on VLT, SHGC and LSG values, while keeping the
U‐value as a by‐product of the selection process, because, in this climate, a good glazing selection
based on VLT, SHGC and LSG would typically improves the U‐value of the glazing, except for normal
single glazed tinted glazing. In this climate, it is not economically justifiable to select glazing based on
U‐values alone. However, if the selection of glazing based on VLT, SHGC and LSG gives a better U‐
value, then it is better for the building.
5.5 GlazingTechnologiesforEnergyEfficiencyA good glazing technology has advantage over external shading because a good glazing will reduce
solar heat gain from both direct and diffuse solar radiation, while external shading largely reduces
direct radiation and has only a small influence on heat gain from diffuse radiation (Chapter 6).
Glazing technology has improved significantly over the last 10 years. These are common
technologies in glazing available today to reduce energy consumptions in building:
5.5.1 SINGLEGLAZINGLOW‐EThese are hard coated metallic coating on surfaces of glazing that can be exposed to indoor climate.
The metallic coating on the inside surface reduces the emissivity of the glazing by 50% or more,
thereby reducing the heat that is radiated into the internal spaces. These glazing will provide better
comfort condition to the building occupants due to its lower radiant heat and will indirectly allow
the air‐conditioning temperature to be raised to maintain comfort condition. It is not difficult to find
single glazing low‐E products with LSG between 1.0 and 1.3.
5.5.2 DOUBLEGLAZINGLOW‐EThese are soft coated metallic coating on the surfaces of glazing that cannot be exposed. These
coatings have to be protected in between glazing. These metallic coatings on the inside surface
reduces the emissivity of the glazing by 95% or more, thereby reducing the heat that is radiated to
the internal spaces. It is not difficult to find double glazing low‐E products with LSG between 1.6 and
2.0.
5.6 EnergySimulationEnergy simulation was conducted to derive an approximate estimate of energy and peak load
reduction of reducing window area and the selection of good glazing properties for each orientation.
These estimates are provided as a guide for quick design checks by architects, engineers and building
owners to estimate the cost saving of implementing these energy efficiency features.
5.6.1 REDUCTIONOFGLAZINGAREAChapter 4 showed that from a purely energy efficiency point of view, glazing area should be reduced
as long as it does not affect the uniformity of daylight distribution in building. A table below is
provided below providing the peak cooling load and energy reduction from the reduction of glazing
area in the various orientation of the building. These values are derived from an assumption that
single glazing with SHGC value of 0.75 is used. Glazing with lower SHGC value is not provided in this

Page 8 of 13
study because the glazing area in building is normally decided without consideration of the
properties of the glazing used. It is only after the design of the glazing area has been decided; the
properties of the glazing would then be selected. Therefore, it is proposed to use this table below
only as a reference for architects to decide to add or reduce glazing area for different facade
orientation of the building.
Orientation North South East West
Energy Reduction (per year) Per Glazing Area Reduction (kWh/m2 of glazing area reduced)
88.60 81.07 136.11 101.62
*RM Reduction (per year) Per Glazing Area Reduction (RM/m2 of glazing area reduced)
31.01 28.38 47.64 35.57
**Peak Cooling Load Reduction Per Glazing Area Reduction (kW/m2 of glazing area reduced)
214.50 132.74 344.70 266.02
Table 5.6.1.1: Energy and Peak Load Impact of Reducing of Glazing Area
*A simplified energy tariff of RM 0.35 per kWh is used.
** Only applicable for buildings with glazing area distributed evenly on all orientation.
The peak cooling load reduction provided in the table above is only valid on the assumption that the
building glazing areas are distributed rather evenly on all the orientation. If for example, West
orientation glazing area is 200% more than the glazing area on other areas, reducing glazing area on
North, South and East will not reduce peak cooling load of the building. This is because the west
orientation is dominating the peak heat gain of the building.
Example 1. Use of Table 5.6.1.1 Base Design of East Façade as a Glazing Area of: 2,000 m² Revised Design of East Façade has a Glazing Area of: 1,700 m² Calculations: East Façade Glazing Area Reduction = 2,000 m² ‐ 1,700 m² = 300 m² Table 5.1, East Façade: Energy Reduction of 136.11 kWh/m² of glazing reduction. Energy Saved per year due to Reduction of Glazing Area on the East Façade: 300 m² x 136.11 kWh/m² = 40,833 kWh/year, Providing a saving of RM 14,291.55 per year. Example 2. Use of Table 5.6.1.1 Base Design of South Façade as a Glazing Area of: 1,500 m² Revised Design of South Façade has a Glazing Area of: 1,950 m² Calculations: South Façade Glazing Area Addition = 1,950 m² ‐ 1,500 m² = 450 m² Table 5.1, South Façade: Energy Reduction of 81.07 kWh/m² of glazing reduction. Energy Increase per year due to Addition of Glazing Area on the South Façade: 450 m² x 81.07 kWh/m² = 36,481.50 kWh/year, Providing an increase of RM 12,768.52 per year.

Page 9 of 13
5.6.2 REDUCTIONOFSOLARHEATGAINCOEFFICIENT(SHGC)The lower the value of SHGC for the window, the less heat is transferred into the building. However,
in a single glazing, the lowest SHGC achievable today is approximately 0.2 and it has to be a dark
glazing with low visible light transmission (VLT less than 10%). Selection of such dark glazing for a
building today may make the building seems old‐fashioned from the outside and not desirable on
the inside due to the lack of daylight within the building. However, it is possible to find high
performance double glazing with low‐e that achieves SHGC of 0.15 or lower and yet has a visible
light transmission (VLT) of 25% or higher. In short, it is possible to select a double glazing that is
cooler (as compared to single glazing) and yet provides decent daylight harvesting opportunity for
the building. It should be noted that actual performance varies between glazing manufacturers and
colour selection.
A table is provided below to estimate the energy and peak load reduction of using glazing with
reduced SHGC value.
Orientation North South East West
Energy Reduction (per year) Per Glazing Area Per SHGC Reduction (kWh/m2.shgc of glazing area)
115.54 100.69 150.14 130.56
*RM Reduction (per year) Per Glazing Area Reduction Per SHGC Reduction (RM/m2.shgc of glazing area reduced)
40.44 35.24 52.55 45.70
**Peak Cooling Load Reduction Per Glazing Area Per SHGC Reduction (kW/m2.shgc of glazing area )
267.86 144.14 310.24 355.82
Table 5.6.2.1 Energy and Peak Load Impact of Reducing of SHGC, in Single Glazing
*A simplified energy tariff of RM 0.35 per kWh is used.
** Only applicable for buildings with glazing area distributed evenly on all orientation.
The peak cooling load reduction provided in the table above is only achievable on the assumption
that the building glazing areas are distributed rather evenly on all the orientation. If for example,
West orientation glazing area is 200% more than the glazing area on other areas, reducing glazing
area on North, South and East will not reduce peak cooling load of the building. This is because the
west orientation is dominating the peak heat gain of the building.
Energy reduction of SHGC in double glazing is higher than single glazing (where the base building
assumption is still using a single glazing) and the table below provides the savings achievable of
using double glazing instead of single glazing.
Orientation North South East West
Energy Reduction (per year) Per Glazing Area Per SHGC Reduction (kW/m2.shgc of glazing area )
158.64 141.97 215.45 171.84
*RM Reduction (per year) Per Glazing Area Reduction Per SHGC Reduction (RM/m2.shgc of glazing area reduced)
55.53 49.69 75.41 60.14
**Peak Cooling Load Reduction Per Glazing Area Per SHGC Reduction (kW/m2.shgc of glazing area )
437.19 294.23 562.83 478.55
Table 5.6.2.2: Energy and Peak Load Impact of Reducing of SHGC, in Double Glazing
*A simplified energy tariff of RM 0.35 per kWh is used.
** Only applicable for buildings with glazing area distributed evenly on all orientation.

Page 10 of 13
Example 3. Use of Table 5.6.2.1 & Table 5.6.2.2 Base Design. North Façade: 1,500 m², Single Glazing, SHGC 0.75 East Façade: 1,200 m², Single Glazing, SHGC 0.75 Revised Design. North Façade: 1,500 m², Single Glazing, SHGC 0.40, Additional Cost: RM 30/m² of glazing area. East Façade: 1,200 m², Double Glazing, SHGC 0.20, Additional Cost: RM 250/m² of glazing area. Calculations: North Façade: SHGC Reduction = 0.75 – 0.40 = 0.35 Energy Reduction Table 5.2 for single glazing: 115.54 kWh/m².shgc Energy Reduction per Year: 115.54 kWh/m².shgc x 0.35 x 1,500 m² = 60,658.50 kWh/year Providing a saving of RM 21,230.48/year Total Additional Cost (RM): RM 30/m² x 1,500 m² = RM 45,000 Simple Payback = RM 45,000 / RM 21,230.48 = 2.1 years. East Façade: SHGC Reduction = 0.75 – 0.20 = 0.55 Energy Reduction Table 5.3 for double glazing: 215.45 kWh/m².shgc Energy Reduction per Year: 215.45 kWh/m².shgc x 0.55 x 1,200 m² = 142,197 kWh/year Providing a saving of RM 49,768.95/year Total Additional Cost (RM): RM 250/m² x 1,200 m² = RM 300,000 Simple Payback = RM 300,000 / RM 49,768.95 = 6.0 years.
5.6.3 REDUCTIONOFU‐VALUEINGLAZINGReduction of glazing U‐value by switching from single glazing to double glazing will also reduce the
SHGC slightly because 2 panes of glass is now used instead of 1. The additional pane of glass will
reflect and absorb some of the solar radiation and is considered in this study. The result of this study
shows that energy reduction due to the U‐value reduction in glazing is significantly small as
compared to the reduction of glazing area and SHGC provided by Tables 5.1 to 5.3.
Orientation All
Energy Reduction (per year) Per Glazing Area Per U‐value Reduction (kWh/m2.u‐value reduction)
4.24
*RM Reduction (per year) Per Glazing Area Reduction Per SHGC Reduction (RM/m2.u‐value reduction)
1.48
**Peak Cooling Load Reduction Per Glazing Area Per U‐value Reduction (kW/m2.u‐value reduction)
13.93
Table 5.6.3.1: Energy and Peak Load Impact of Reducing U‐value in Glazing
*A simplified energy tariff of RM 0.35 per kWh is used.
** Only applicable for buildings with glazing area distributed evenly on all orientation.
5.7 TheMS1525OTTVThe Malaysian Standard available from Sirim, MS1525, provides a method to calculate the Overall
Thermal Transmission Value (OTTV) of a building fabric. The original form of OTTV was developed for

Page 11 of 13
ASHRAE Standard 90 in 19751 and refined again in 19802. The OTTV constants were derived from
energy simulation studies, where in the 1970s, is only in the domain of universities and research
centers. In summary, the OTTV provided a mean of estimating the energy load of a building fabric
system without requiring the use of energy simulation tools, enabling it to be used by any architects
and engineers to make estimates of average cooling load in building due to building fabric choices.
The OTTV is defined by ASHRAE as the average chiller cooling load gained due to the choice of
building fabric (excluding the roof) based on the condition outside (weather) and a ‘typical’ condition
inside an office building. Today, ASHRAE 90 has since discarded OTTV, in favor of energy simulation.
This is because energy simulation is now accessible by almost all architects and engineers as
compared to the 1980s. Moreover, the OTTV was found to be inaccurate for climates having
different seasons (colder winter and warmer summer) or different air‐conditioning hours.3
Despite these disadvantages, the OTTV do offers a simple solution to give reasonably good estimates
of heat gained into the building due to solar radiation through the window, conduction through the
wall and conduction through the window. The OTTV formula in MS1525 (2007) is reproduced below
as a reference.
SC) x x WWRCF x (194U(WWR)6UWWR)(1α15)(W/m OTTVi fw2
Where,
WWR is the window‐to‐gross exterior wall area ratio for the orientation under consideration;
is the solar absorptivity of the opaque wall;
Uw is the thermal transmittance of opaque wall (W/m2 K);
Uf is the thermal transmittance of fenestration system (W/m2 K);
CF is the solar correction factor; as in MS1525 (2007) Table 4; and
SC is the shading coefficient of the fenestration system.
Orientation CF
North 0.90
Northeast 1.09
East 1.23
Southeast 1.13
South 0.92
Southwest 0.90
West 0.94
Northwest 0.90
Table 5.7.1: MS1525, Table 4. Solar correction factors
1 ASHRAE Standard 90 ProjectCommittee. 'Energy Conservationin New Building Design. ASHRAE Standard: 90-1975." AmericanSocietyof Heating,Refrigerationand Air ConditioningEngineers,Inc., Atlanta,GA, 1975 2 ASHRAE Standard 90 ProjectCommittee. 'Energy Conservation in New Building Design. ASHRAE Standard: 90A-1980, 90B-1975, 90C-1977." American Society of Heating, Refrigeration and Air ConditioningEngineers,Inc., Atlanta,GA, 1980. 3 S. Chirarattananon and J. Taveekun. 2004. “An OTTV-based energy estimation model for commercial buildings in Thailand. Energy and Building, Vol. 36, Issue 7, July, pp 680-689.

Page 12 of 13
5.7.1 REPLACEMENTOFSCWITHSHGCINOTTVThe term shading coefficient or SC was proposed by the scientific communities in recent years to be
discarded in favor of SHGC, solar heat gain coefficient, because the definition of SC is not sufficiently
specific enough for industry use, while the definition of SHGC is simple and definite. In general, SHGC
can be approximated from SC using this equation: SHGC = 0.87 x SC. Replacing the SC with SHGC in
the OTTVi equation in MS1525 will yield the new equation below.
SHGC) x x WWRCF x (223U(WWR)6UWWR)(1α15)(W/m OTTVi fw2
Where,
WWR is the window‐to‐gross exterior wall area ratio for the orientation under consideration;
is the solar absorptivity of the opaque wall;
Uw is the thermal transmittance of opaque wall (W/m2 K);
Uf is the thermal transmittance of fenestration system (W/m2 K);
CF is the solar correction factor; as in MS1525 (2007) Table 4; and
SHGC is the solar heat gain coefficient of the fenestration system.
5.7.2 USINGOTTVTOESTIMATEENERGYREDUCTIONThe OTTV equation itself can be used to estimate annual energy reduction in office building due to
the differences in façade design. The definition of OTTV by ASHRAE 90, as the average chiller cooling
load of a typical office building for the entire year is the exact explanation on how OTTV can be used
to estimate cooling load reduction.
In summary, the energy saved due to cooling load reduction (or addition) of a building in Malaysia
due to change in OTTV can be estimated using this equation below:
1000
Where,
ER is the energy reduction per year (kWh/year)
OTTV1 is the computed OTTV based on option 1 (W/m²)
OTTV2 is the computed OTTV based on option 2 (W/m²)
Aw is the area of walls (inclusive of glazing areas) (m²)
SCOP is the Air‐Conditioning System Coefficient of Performance
Hac is the Hours of air‐conditioning per year (approximately 2700 hours)
This equation above is valid for buildings using Constant Air Volume (CAV) system and is a good
approximation for buildings using Variable Air Volume (VAV) system. The SCOP can be approximated
using these recommended values: 2.8 for split‐unit air‐conditioning system, 4.0 for a centrifugal
based chill water system. More accurate SCOP can be approximated by your air‐conditioning system
designer based on the equipment used.
5.7.2.1 CorrectSolarFactorUsedinMS1525?A study made in 2006, showed that the average solar factor of the test reference year weather data
is significantly lower than the average solar factor used by the MS1525 (2007) OTTV formulation,

Page 13 of 13
160 W/m² vs. 194 W/m² respectively.4 These differences are due to the fact that the original MS1525
OTTV solar factor was derived from a couple of days measurement made on vertical surface in
Penang in the 1980s, while the Test Reference Year (TRY) is based on hourly analysis of solar
radiation in Subang (Chapter 2).
In addition, it was presented by the Malaysian Building Integrated PhotoVoltaic (MBIPV) project that
Penang received a higher yearly solar irradiance (~1850 kWh/m²) (approximately 23% more) than
the Klang Valley (~1500 kWh/m²) where Subang is located.5 Meanwhile, the measured solar factor of
194 W/m² in Penang is 21% higher than the solar factor of 160 W/m² in Subang derived from the
test reference year weather data. In summary, the information provided by MBIPV project seems to
indicate that both solar factor are correct for its own location. However, further studies are
recommended to validate these observations.
The correct solar factor will yield the correct computation of solar heat gain in building. It is highly
recommended that further research should be conducted to establish the correct solar factors to be
used in the MS1525.
Chart 5.7.2.1.1: Average Solar Factor6
_______________________________End of Chapter 5____________________________________
4 CK Tang, Dr. K.S. Kannan, Ole Blashev Olesen, Steve A. Lojuntin, Dr. BG Yeoh, A Review of the OTTV Formulation in the Support of Energy Efficiency Code for Non-domestic building, MS 1525, May 2006, Prepared for the Danida program in Malaysia (2004-2006). 5 Ir. Ahmad Hadri Haris, MBIPV Project: Catalyzing Local PV Market, Finance & Investment Forum on PV Technology, 17th March 2008, Kuala Lumpur Tower 6 CK Tang, Dr. K.S. Kannan, Ole Blashev Olesen, Steve A. Lojuntin, Dr. BG Yeoh, A Review of the OTTV Formulation in the Support of Energy Efficiency Code for Non-domestic building, MS 1525, May 2006, Prepared for the Danida program in Malaysia (2004-2006).
194
160
0
50
100
150
200
250
Current OTTV based on PenangMeasured
Subang TRY
W/m2
Average Solar Factor