chapter 5. applications for heterogeneous catalysis 5.pdf · heterogeneous catalysis is a vital...
TRANSCRIPT

66
Chapter 5. Applications for Heterogeneous Catalysis Looking inside catalyst extrudates with Time-Resolved Surface-
Enhanced Raman Spectroscopy (TR-SERS) Harvey, C.E.1, Iping Petterson, I.E.,2 Weckhuysen, B.M.1, Gooijer, C.2, Ariese, F.2, Mank, A.J.G.1,3 Appl. Spec. 2012 1 Debye Institute for Nanomaterials Science, Utrecht University, Universiteitsweg 99, 3584 CG Utrecht, The Netherlands; 2 Biomolecular Analysis and Spectroscopy, LaserLaB, VU University, De Boelelaan 1083, 1081 HV Amsterdam, The Netherlands; 3 Department of Molecular and Structural Analysis, Philips Innovation Services, High Tech Campus 11, Eindhoven, The Netherlands

67
5.1 Abstract
Raman spectroscopy is one of the major characterization methods employed over the last few
decades as a non-destructive technique for the study of heterogeneous catalysts and related
catalytic reactions. However, the promise of practical applicability on millimetre-sized catalyst
bodies, such as extrudates, has not been fulfilled completely. Large fluorescence signals and the
highly scattering nature of the extrudates often hamper its practical usage. Different approaches
to overcome this problem were examined, including the use of Time Resolved Raman
Spectroscopy (TRRS), Spatially Offset Raman Spectroscopy (SORS), Surface Enhanced Raman
Spectroscopy (SERS), and combinations of these techniques. This paper demonstrates that
especially TRRS can provide chemical information at depth within catalyst bodies, overcoming
fluorescence background signals and allowing for visualisation of analytes at different depths. It
also examines the application of Time Resolved SERS within catalyst bodies to gain insight into
localised activity. With these options a wider applicability of Raman spectroscopy for industrial
catalysis research becomes within reach.
Keywords: Heterogeneous catalysis; depth profiling; Time Resolved Raman Spectroscopy
(TRRS); Spatially Offset Raman Spectroscopy (SORS); Surface Enhanced Raman Spectroscopy
(SERS).
5.2 Introduction
Heterogeneous catalysis is a vital field of research for many industries; it has been estimated that
90% of all chemical processes use heterogeneous catalysis, encompassing important industrial
reactions from oil cracking, synthesis of transportation fuels, to the production of
plastics.1 Catalytic solids in industrial reactors are often used under high pressure, where if the
catalyst does not have a high mechanical stability it can compact and lead to blockages in the
system. For this reason, porous catalyst support materials, such as Al2O3, TiO2 and SiO2, are
often shaped into extrudates, which present a high surface area for catalytic reactivity, whilst
retaining high mechanical stability under pressure.2-4 It is of particular interest in catalysis to
determine whether reactants and products, as well as the catalytic activity and selectivity, are
evenly distributed within catalyst bodies. Equally important is the extent to which the activity of
the catalyst bodies is hindered by the deposition of by-products within the extrudates.5,6
68
A range of invasive and non-invasive techniques, encompassing UV-Vis-NIR, infrared
spectroscopy (IR), Raman spectroscopy (RS), magnetic resonance imaging (MRI) and others,
has been utilised in the past to visualise catalyst preparation methods. At the same time, RS, MRI
and X-ray techniques have been used to gain insight into in-situ processes in extrudates.7-9 These
techniques have divulged important information about the dispersion of the active sites within an
extrudate, enabling studies of catalytic reactions on extrudates. However, non-invasive in-situ
measurements for single catalyst extrudates, allowing the monitoring of a reaction below the
surface, have thus far only been done by MRI, as well as Diagonally Offset Raman Spectroscopy
(DORS) (a particular excitation geometry of Spatially Offset Raman Spectroscopy) to study the
preparation of Mo/Al2O3 catalyst bodies.9,10
RS is especially attractive as it provides valuable structural information, while the
technique is non-destructive and does not require invasive sampling. It has been used to study
chemical reactions on the surface of catalyst bodies,11-13 but a major problem in characterizing
real extrudates is the large fluorescence background often encountered in catalytic solids. This
makes analysis inside extrudates extremely challenging, especially since the pellet material is
normally highly scattering. Surface Enhanced Raman Spectroscopy (SERS), Spatially Offset
Raman Spectroscopy (SORS), and Time Resolved Raman Spectroscopy (TRRS) are all
advanced Raman techniques that have been introduced, in part, to overcome the problem of
fluorescence interference in a variety of applications.14-20 Through signal enhancement and
selectivity for material in the bulk versus the surface, these methods could also help in studying
the inside of catalyst extrudates in more detail.
SERS is an effect related to contact of the analyte with roughened metal surfaces or metal
nanoparticles that enhances the signal by a factor of 106 or more. The enhancement is based on
both physical and chemical phenomena.14,15,21 SERS also effectively ‘quenches’ the fluorescence
of the adsorbed material by an increase in non-radiative decay when the molecule is in direct
contact with the metal, which process is in competition with the radiative decay that gives
fluorescence.22 For in-situ measurements, selection of either Au or Ag SERS particles and
selection of the appropriate excitation wavelength can be applied to avoid interference with the
catalytic process. It will also be possible in future studies to utilise shell-isolated nanoparticles
(SHINs) as chemically inert SERS probes.23
69
SORS allows depth measurements by applying a spatial offset between the excitation
point and the Raman collection point.18 Scattering by opaque material causes a diffuse
distribution of photons at depth, so a detector positioned at a location offset to the excitation
point receives a relatively greater proportion of photons from deeper within the sample.
Applying a spatial offset means that less signal is collected from the location at which the beam
enters the sample, and thereby reduces the interference from fluorescence produced at the surface
of the sample. Recently it has been shown that SERS used in combination with SORS can
provide selectively enhanced depth measurements through diffusive surface layers for
biomedical applications.24-26
Time Resolved Raman Spectroscopy (TRRS) by means of a Kerr gate16 or an intensified
CCD camera20,27-29 offers an alternative for sub-surface analysis inside a strongly scattering
sample. With this approach the distinction between Raman photons emanating from the surface
versus those generated inside the sample is made on the basis of their distribution in time. A
picosecond (ps) laser pulse is used to excite the sample in backscattering geometry. Due to the
random walk of photons in a dispersive medium, photons from inside the material will take
longer to arrive at the detector. The use of a short detector gate allows selective collection of
Raman photons from a certain depth within the sample, and eliminates a considerable amount of
fluorescent background from the surface as well as from the bulk.17,19,20
Combinations of SERS, SORS and TRRS are also possible. Previous work has shown
that a slight improvement of the selectivity for photons from the bulk vs. the surface can be
achieved by combining TR detection with a SORS excitation geometry.27,29 However, the
majority of fluorescence background reduction in TR-SORS is provided by the time gating rather
than the spatial offset.27,29 Adding TR detection to SERS has the potential to be the basis of a
selective, sensitive and versatile tool for the study of chemical reactions in numerous
applications as well. In this work, it is examined whether any of the above options can visualise
the content in the core of an intact extrudate.
A model system is used that is representative for a catalytic system: styrene synthesis
with γ-Al2O3 as the catalyst.30,31 The different components of this relevant reaction (Figure 5.1)
are added to γ-Al2O3 catalyst bodies as they are used in production. The spatial distribution of
the starting compound (i.e., 1-phenylethanol) and product (i.e., styrene) is not known under
normal catalytic conditions, but is likely to be highly overlapping. To test the strengths of the

70
various advanced Raman approaches, we chose to distribute these compounds unevenly within
the catalyst body in a core vs. shell distribution model. Such systems are realistic in catalytic
applications5, and in doing so it is possible to determine not only the fluorescence suppression
efficiency, but also the spatial selectivity of the different Raman approaches.
+ H2O Figure 5.1. Schematic showing the structures of reactant and product; 1-phenylethanol is
dehydrated to styrene, using γ-Al2O3 as the active catalyst material.
The spectral interference in this reaction normally comes from the formation of highly
fluorescent polycyclic aromatic hydrocarbons, which are typical reaction by-products. Here,
benzo[a]pyrene (BaP) is chosen as a typical example. The fluorescent lifetimes of these by-
products are generally such that TRRS can significantly reduce their contribution in the Raman
spectra, regardless of their distribution within the sample. It should be noted that when
fluorescent by-products are distributed throughout the bulk, SORS will not be as suitable, as the
weak Raman signal will still be overwhelmed by fluorescence, irrespective of the spatial offset.
Although in this study fluorescent interference from BaP only originates from the outer shell of
the sample, the extrudate gives a significant luminescent background by itself. This creates a
realistic situation in which multiple sources of fluorescence interference are present.
To study the contribution of SERS enhancement, a second model system was used. Again
an uneven core vs. shell analyte distribution was used, in which the core of the γ-Al2O3 extrudate
was impregnated with rhodamine 6G (Rh6G), the golden standard for SERS enhancement.32 It
should be noted that for many other compounds, including 1-phenylethanol and styrene, the
enhancement factors with Ag nanoparticles are often much lower or more challenging to
obtain.33-35
5.3 Experimental section
Instrumentation
TRRS experiments were carried out with a system similar to the setup described in prior
publications27, and is schematically shown in Figure 5.2. A tuneable Ti:sapphire laser (Coherent
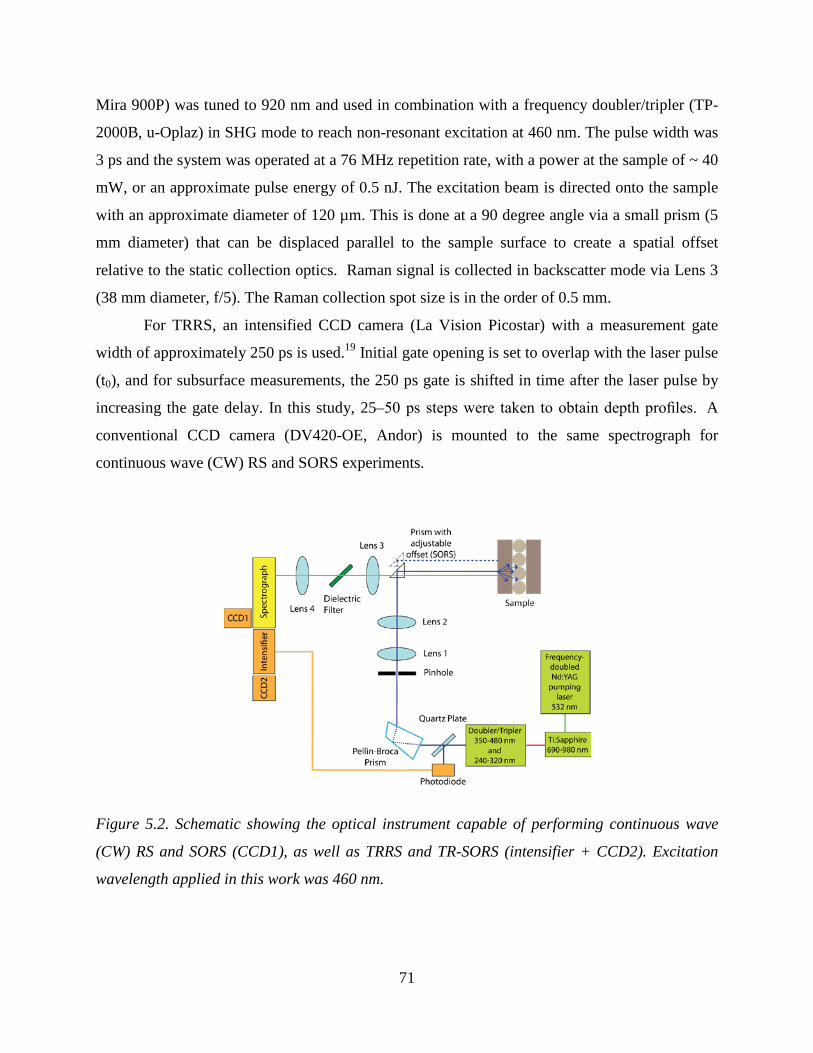
71
Mira 900P) was tuned to 920 nm and used in combination with a frequency doubler/tripler (TP-
2000B, u-Oplaz) in SHG mode to reach non-resonant excitation at 460 nm. The pulse width was
3 ps and the system was operated at a 76 MHz repetition rate, with a power at the sample of ~ 40
mW, or an approximate pulse energy of 0.5 nJ. The excitation beam is directed onto the sample
with an approximate diameter of 120 µm. This is done at a 90 degree angle via a small prism (5
mm diameter) that can be displaced parallel to the sample surface to create a spatial offset
relative to the static collection optics. Raman signal is collected in backscatter mode via Lens 3
(38 mm diameter, f/5). The Raman collection spot size is in the order of 0.5 mm.
For TRRS, an intensified CCD camera (La Vision Picostar) with a measurement gate
width of approximately 250 ps is used.19 Initial gate opening is set to overlap with the laser pulse
(t0), and for subsurface measurements, the 250 ps gate is shifted in time after the laser pulse by
increasing the gate delay. In this study, 25–50 ps steps were taken to obtain depth profiles. A
conventional CCD camera (DV420-OE, Andor) is mounted to the same spectrograph for
continuous wave (CW) RS and SORS experiments.
Figure 5.2. Schematic showing the optical instrument capable of performing continuous wave
(CW) RS and SORS (CCD1), as well as TRRS and TR-SORS (intensifier + CCD2). Excitation
wavelength applied in this work was 460 nm.
72
Materials
Chemicals used: Styrene (Acros, 99%); 1-phenylethanol (Aldrich, 97%); trans-stilbene (Fluka,
96%); benzo[a]pyrene (BaP) (Acros, 98%); ethanol (Interchema, 100%); rhodamine 6G (Sigma,
95%); MilliQ ultrapure water (18.2 MOhm.cm); silver nitrate (Sial, 99+%) and trisodium citrate
dihydrate (Acros, 99%).
Ag nanoparticles were synthesized using method c of Lee and Meisel, 1982.36 The
nanoparticles were centrifuged at 3,300 RCF for 30 min, after which the supernatant was
discarded and the particles were re-dispersed to 10× the initial concentration in demi-water.
The γ-Al2O3 extrudate pellets are "Al 3996 R" from Harshaw (bulk density 0.5-0.75
g/cm3, specific surface 200 m2/g, total pore volume approximately 0.69 cm3/g); the cylindrical
hollow extrudate pellet is 3 mm in diameter, with a cavity of 1 mm diameter in the centre. This
cavity is filled with γ-Al2O3 extrudate spheres of Engelhard; the diameter of the spheres is 0.7
mm and their optical diffusivity is that of the pellet.
Model systems
The model systems consist of combinations of impregnated catalytic extrudate pellet and
spheres. Incipient wetness impregnation was carried out by contacting a certain volume of liquid
with the alumina pellets or spheres by Finn pipette just sufficient to completely fill the pores of
the alumina support oxide. Small alumina spheres with high porosity were used in order to
improve the dispersion of the analytes, and particularly the Ag nanoparticles, in the centre of the
system.
In the first model system, a hollow γ-Al2O3 pellet is impregnated with 200 µL 1-
phenylethanol (as purchased) as a first-layer marker, in addition to pre-treatment with 200 µL
BaP (1 µM) to provide a realistic fluorescence background, as mentioned previously. The laser
wavelength applied (460 nm) excites the dried BaP aggregates, resulting in a typical broadband
fluorescence background. The hollow cavity of the pellet is filled with γ-Al2O3 spheres that were
first each impregnated with 10 µL styrene (as purchased) as a marker of the internal layer, in
order to have distinct chemical signals from different layers of the sample. By illuminating the
cylindrical pellet from the side, we effectively have a 3-layer sample in which the 1st and 3rd
layer are the same (1-phenylethanol and BaP), and the core of the pellet gives a different
chemical signature (styrene).

73
Figure 5.3. A) shows an enlarged model of the hollow Al2O3 pellets packed with Al2O3 spheres
(sliced side view); and B) is a photo of the hollow Al2O3 pellet and an Al2O3 sphere, where the
scale bar in the bottom left corner is equivalent to 1 mm.
To examine the possibility of using SERS as a supporting method, a variation of this system
(model system 2) is used, in which the styrene in the centre is replaced by Rh6G, in the presence
of SERS active Ag nanoparticles (5 µL). Ag was distributed evenly over the spheres and allowed
to dry before the addition of sufficient Rh6G to completely saturate the sphere (10 µL at 10 µM,
effectively reducing the analyte concentration by a factor of 105compared to model sample 1).
5.4 Results and Discussion
Raman spectroscopy and SORS of catalytic extrudates
Model system 1 was characterized by CW RS, CW SORS and TRRS, and the results are
compared in Figures 5.4 and 5.5. The CW RS measurements, summarized in Figure 5.4, provide
a Raman spectrum consisting of 1-phenylethanol peaks with styrene peaks on a fluorescent
background. Part of the fluorescence could have been avoided by applying long-wavelength
excitation, but for this study 460 nm excitation was chosen as a worst-case scenario. In applying
a spatial offset of 1 or 2 mm, the absolute intensity of the Raman signal and the fluorescence
decrease to roughly the same extent (see inset for background subtracted spectrum of the 2 mm
SORS measurement).

74
Figure 5.4. CW RS and CW SORS measurements (offsets 1 and 2 mm) of model system 1: a
catalytic pellet impregnated with 1-phenylethanol and BaP, with Al2O3 spheres impregnated with
styrene. Insert shows the SORS 2 mm measurement with a background subtraction applied.
Time Resolved Raman of extrudates
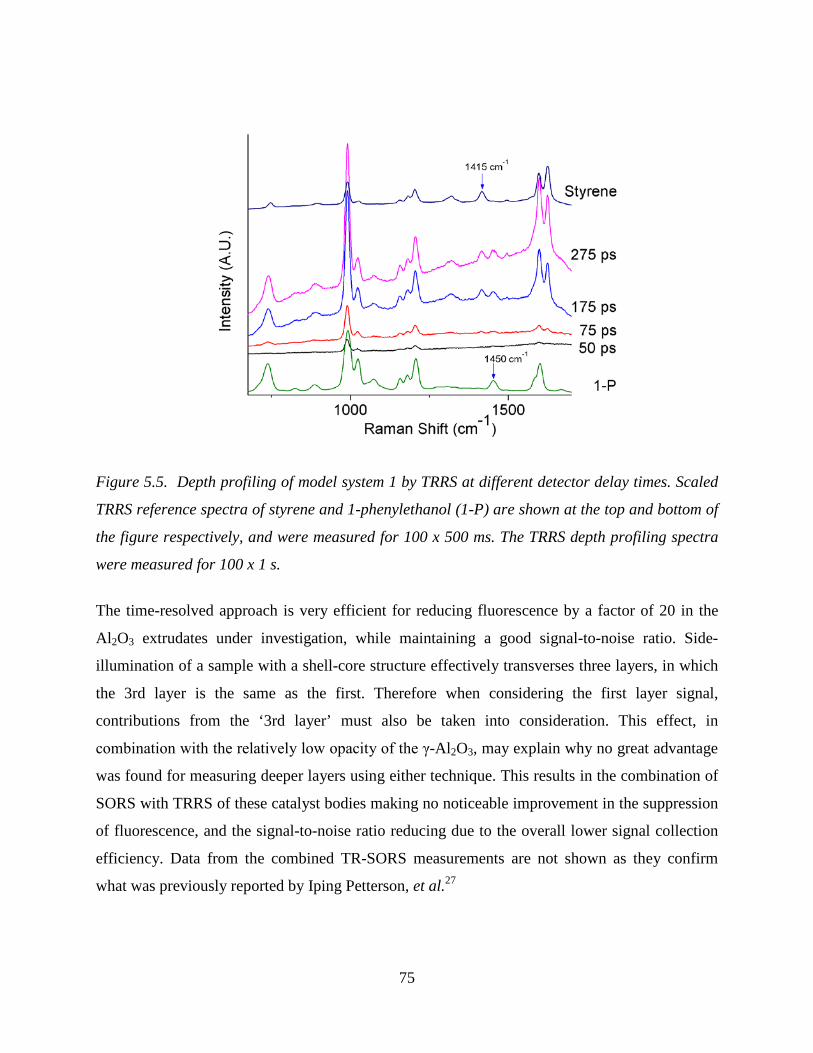
The TRRS measurements of the same sample, shown in Figure 5.5, are taken at various detector
delay times and show that the 1-phenylethanol becomes visible immediately after the laser pulse.
The signal is initially very low. When using a delay of 75 ps the Raman signal from styrene
appears. While 1-phenylethanol and styrene share many of the strongest Raman bands (990 cm-1,
1025 cm-1 and 1596 cm-1), differences in the spectra with increasing delay time can be seen by
observing some of the weaker peaks. Most notable are a shift from 738 cm-1 to 748 cm-1, the
changing relative intensities of the bands at 1415 cm-1 and 1450 cm-1, and the appearance of a
band at 1624 cm-1. Increasing the delay time results in an absolute increase in the signal of
styrene with a relatively low fluorescence contribution.
75
Figure 5.5. Depth profiling of model system 1 by TRRS at different detector delay times. Scaled
TRRS reference spectra of styrene and 1-phenylethanol (1-P) are shown at the top and bottom of
the figure respectively, and were measured for 100 x 500 ms. The TRRS depth profiling spectra
were measured for 100 x 1 s.
The time-resolved approach is very efficient for reducing fluorescence by a factor of 20 in the
Al2O3 extrudates under investigation, while maintaining a good signal-to-noise ratio. Side-
illumination of a sample with a shell-core structure effectively transverses three layers, in which
the 3rd layer is the same as the first. Therefore when considering the first layer signal,
contributions from the ‘3rd layer’ must also be taken into consideration. This effect, in
combination with the relatively low opacity of the γ-Al2O3, may explain why no great advantage
was found for measuring deeper layers using either technique. This results in the combination of
SORS with TRRS of these catalyst bodies making no noticeable improvement in the suppression
of fluorescence, and the signal-to-noise ratio reducing due to the overall lower signal collection
efficiency. Data from the combined TR-SORS measurements are not shown as they confirm
what was previously reported by Iping Petterson, et al.27

76
The TRRS method provides a realistic solution for fluorescence suppression in the model
sample. To obtain an improved spatial resolution despite the small size and optical opacity of
catalyst extrudates, TRRS can be combined with SERS to selectively enhance the core signal.
The combination with SERS will also allow the study of analytes at significantly lower
concentrations, as would be common in a catalytic system. This option is explored with the
second model system in which styrene is replaced by Rh6G in the presence of Ag nanoparticles.
SE-SORS of extrudates
Figure 5.6. CW SERS and CW SE-SORS measurements (offsets 1 and 2 mm) of model system 2:
a catalytic pellet impregnated with 1-phenylethanol and BaP, with Al2O3 spheres impregnated
with Rh6G and Ag nanoparticles. Insert shows the 2 mm offset SE-SORS measurement with a
background subtraction applied.
Measurements of model system 2 using CW SERS and SE-SORS are shown in Figure 5.6. A
mixture of Raman peaks from the first and second layers is visible on a fluorescent background.
Performing background subtractions of these spectra reveals that a Raman signal from both the
1-phenylethanol in the outer layer and the Rh6G in the core of the sample can be seen.
It should be noted that the addition of SERS particles does more than enhance the Raman
signal for the location where they are added. There is a potential negative effect as well: the light

77
absorption by the SERS particles limits the number of photons that can penetrate and escape
from the catalyst body, especially when they are far below the surface.37 This is particularly
evident in the SE-SORS measurement with 2 mm offset, which shows a significant overall signal
reduction. It is clear that a balance needs to be sought between absorption and enhancement, but
the availability of both Au and Ag nanoparticles for SERS, combined with excitation wavelength
selection allows some experimental design flexibility.
TR-SERS of extrudates
In Figure 5.7 we explore the effect of the addition of SERS to TRRS characterization of the
model system. The resulting spectra are to be compared with those obtained with CW detection
(Figure 5.6). In line with the data shown in Figures 5.4 and 5.5, the results are a considerably
improved fluorescence reduction for TR-SERS over the SE-SORS measurements.
Figure 5.7. Depth profiling by TR-SERS: A series of time-resolved spectra of model system 2. On
the bottom of the figure is a scaled reference spectrum of 1-phenylethanol (1-P) and on the top a
reference spectrum of a 10 µM Rh6G solution in the presence of Ag nanoparticles. Spectra were
measured for 50 x 1 s and reference spectra for 100 x 500 ms.

78
These results clearly show that with similar fluorescence reduction (~10×) more selective
analysis is possible for the core of the extrudate via the addition of Ag nanoparticles. This is
particularly promising as until now TRRS has mainly been used for detecting the major
components in a sample.27-29 Here it is shown that, via SERS signal enhancement, realistic
scenarios with lower analyte concentrations can be tackled with the same approach. Time-
resolved analysis provides fluorescence reduction from the surface and bulk, and can be
combined with SERS enhancement to selectively enhance weaker signals at depth within catalyst
extrudates.
Effect of sample composition and refractive index matching
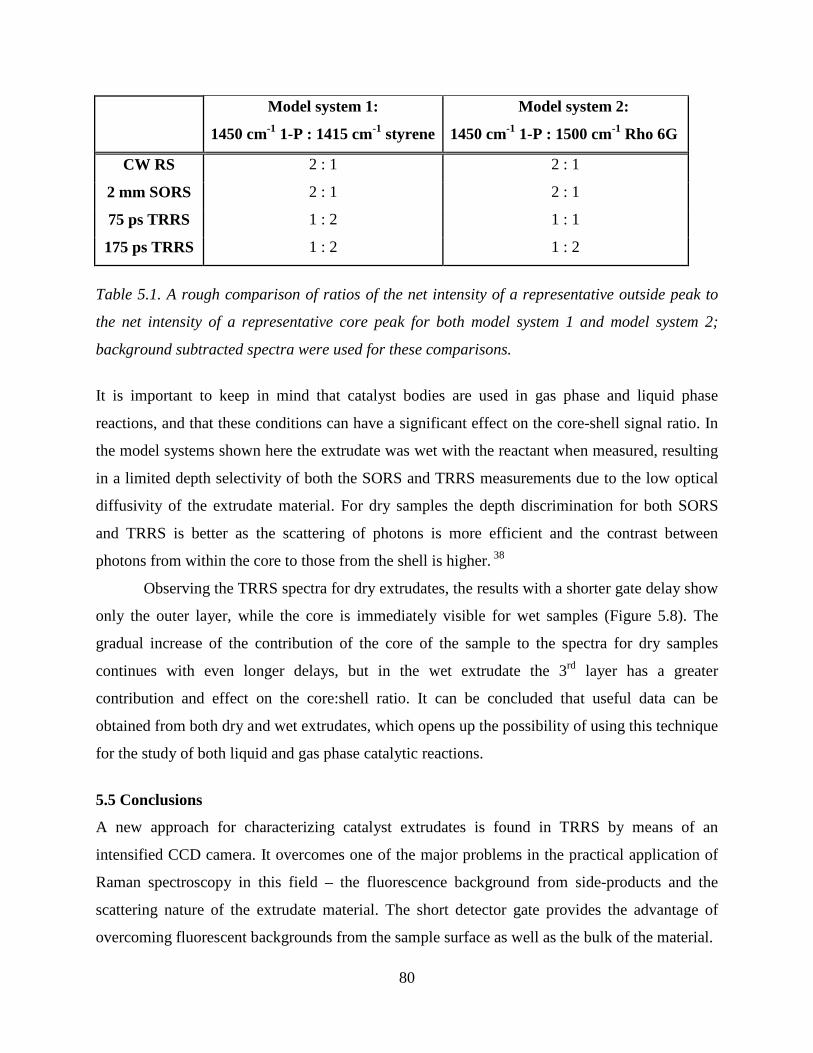
A rough comparison of ratios of representative peaks from the shell and core of the sample
shows little or no change in selectivity of signal from shell vs. core with SORS (Table 5.1). In
both model systems 1 and 2 this ratio for the 2 mm SORS measurements is 2:1.
Figure 5.8. Comparison of ratios of core to shell as measured by TRRS of a wet extrudate and a
dry extrudate. The signal ratios change with an increasing delay time.
An increase in selectivity for deeper layers is generally expected with a spatially offset
measurement of diffusely scattering samples. However, in this case the relative contributions
from each layer remain approximately 2:1. Several factors likely contribute to this result,
79
including the relatively low scattering properties of the impregnated catalyst body, the small
diameter of the extrudate, as well as the core-shell structure of the sample.
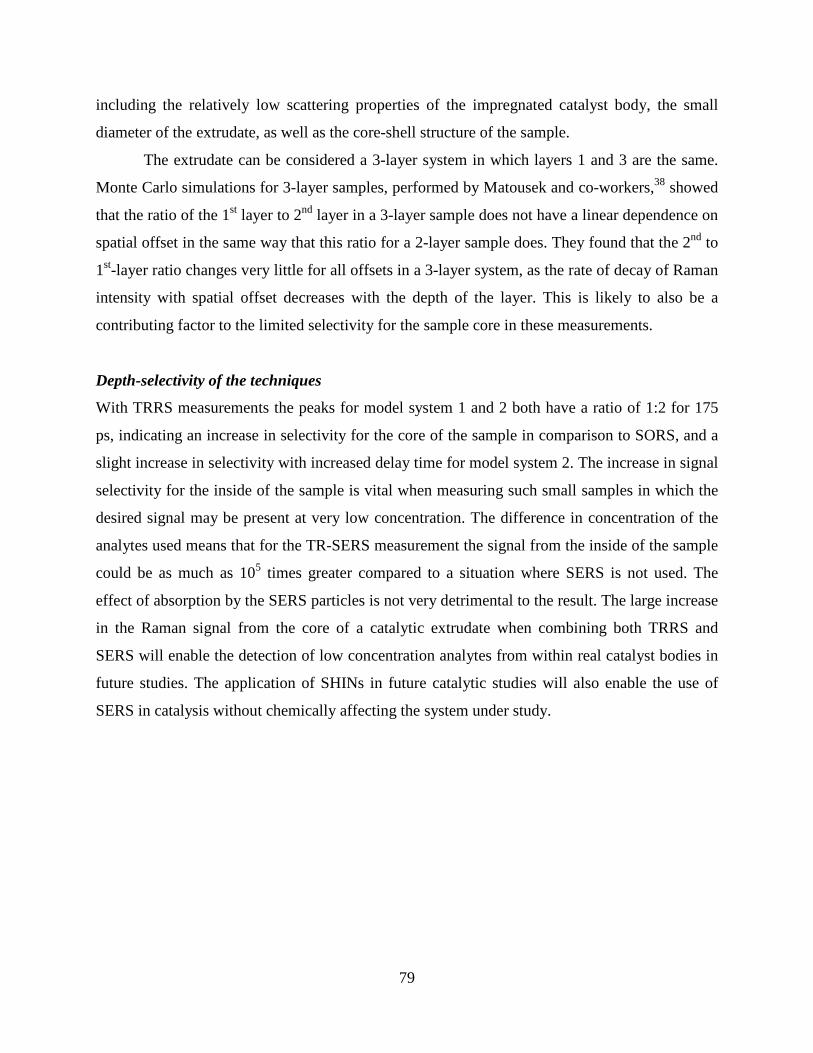
The extrudate can be considered a 3-layer system in which layers 1 and 3 are the same.
Monte Carlo simulations for 3-layer samples, performed by Matousek and co-workers,38 showed
that the ratio of the 1st layer to 2nd layer in a 3-layer sample does not have a linear dependence on
spatial offset in the same way that this ratio for a 2-layer sample does. They found that the 2nd to
1st-layer ratio changes very little for all offsets in a 3-layer system, as the rate of decay of Raman
intensity with spatial offset decreases with the depth of the layer. This is likely to also be a
contributing factor to the limited selectivity for the sample core in these measurements.
Depth-selectivity of the techniques
With TRRS measurements the peaks for model system 1 and 2 both have a ratio of 1:2 for 175
ps, indicating an increase in selectivity for the core of the sample in comparison to SORS, and a
slight increase in selectivity with increased delay time for model system 2. The increase in signal
selectivity for the inside of the sample is vital when measuring such small samples in which the
desired signal may be present at very low concentration. The difference in concentration of the
analytes used means that for the TR-SERS measurement the signal from the inside of the sample
could be as much as 105 times greater compared to a situation where SERS is not used. The
effect of absorption by the SERS particles is not very detrimental to the result. The large increase
in the Raman signal from the core of a catalytic extrudate when combining both TRRS and
SERS will enable the detection of low concentration analytes from within real catalyst bodies in
future studies. The application of SHINs in future catalytic studies will also enable the use of
SERS in catalysis without chemically affecting the system under study.
80
Model system 1:
1450 cm-1 1-P : 1415 cm-1 styrene
Model system 2:
1450 cm-1 1-P : 1500 cm-1 Rho 6G
CW RS 2 : 1 2 : 1
2 mm SORS 2 : 1 2 : 1
75 ps TRRS 1 : 2 1 : 1
175 ps TRRS 1 : 2 1 : 2
Table 5.1. A rough comparison of ratios of the net intensity of a representative outside peak to
the net intensity of a representative core peak for both model system 1 and model system 2;
background subtracted spectra were used for these comparisons.
It is important to keep in mind that catalyst bodies are used in gas phase and liquid phase
reactions, and that these conditions can have a significant effect on the core-shell signal ratio. In
the model systems shown here the extrudate was wet with the reactant when measured, resulting
in a limited depth selectivity of both the SORS and TRRS measurements due to the low optical
diffusivity of the extrudate material. For dry samples the depth discrimination for both SORS
and TRRS is better as the scattering of photons is more efficient and the contrast between
photons from within the core to those from the shell is higher. 38
Observing the TRRS spectra for dry extrudates, the results with a shorter gate delay show
only the outer layer, while the core is immediately visible for wet samples (Figure 5.8). The
gradual increase of the contribution of the core of the sample to the spectra for dry samples
continues with even longer delays, but in the wet extrudate the 3rd layer has a greater
contribution and effect on the core:shell ratio. It can be concluded that useful data can be
obtained from both dry and wet extrudates, which opens up the possibility of using this technique
for the study of both liquid and gas phase catalytic reactions.
5.5 Conclusions
A new approach for characterizing catalyst extrudates is found in TRRS by means of an
intensified CCD camera. It overcomes one of the major problems in the practical application of
Raman spectroscopy in this field – the fluorescence background from side-products and the
scattering nature of the extrudate material. The short detector gate provides the advantage of
overcoming fluorescent backgrounds from the sample surface as well as the bulk of the material.

81
The small size and core-shell nature of many extrudates complicate depth specificity of
TRRS, but there is potential for 3D characterization of thicker samples. For extrudates the
combination of TRRS with SERS is an option to selectively characterize a region in the material
using locally applied SERS nanoparticles. The combination of time-resolution and SERS
provides additional spatial selectivity within the catalytic body, but the size of this effect depends
on the actual enhancement factor and the loss of signal due to light absorption. The enhancement
factor strongly relates to the chemistry of the analyte and how it interacts with the SERS particles
and is therefore something that needs to be evaluated for each application. The detrimental effect
of absorption on signal intensity can be limited by choosing the right type and concentration of
SERS nanoparticles and selecting a suitable excitation wavelength.
Acknowledgements
B.M.W. gratefully acknowledges financial support from the Netherlands Research School
Combination-Catalysis (NRSC-C). The authors thank Mathijs Zandbergen, Karen Faulds and
Duncan Graham for interesting discussions on SORS and SERS, and Joost Buijs for technical
support.
5.6 References
1 Dumesic, J.A., Huber, G.W., and Boudart, M. Principles of Heterogeneous Catalysis. In: G. Ertl, G., Knozinger,H., Schuth, F., Weitkamp, J., editors. Handbook of Heterogeneous Catalysis. Weinheim, Germany: Wiley-VCH, 2nd Ed, 1997, Chap. 1, 1–14.
2 Perego, C. and Villa, P. Catalyst preparation methods. Catal. Today, 1997, 34: 281–305.
3 Geus, J.W. Production of Supported Catalysts by Impregnaton and (Viscous) Drying. In: Regalbuto, J., editor. Catalyst Preparation Science and Engineering. Boca Raton, US: CRC Press. Chap. 15, 341–372.
4 Weckhuysen, B.M. Space and Time-Resolved Spectroscopy of Catalyst Bodies. In: K.P. de Jong, editor. Synthesis of Solid Catalysts. Weinheim, Germany: Wiley-VCH, 2009. Chap. 10, 201–216.
5 Iglesia, E., Soled, S., and Baumgartner, J. Synthesis and Catalytic Properties of Eggshell Cobalt Catalysts for the Fischer-Tropsch Synthesis. J. Catal., 1995, 153: 108–122.
6 Bartholomew, C.H. Mechanisms of catalyst deactivation. App. Cat., A, 2001, 212(1): 17–60.
82
7 Espinosa-Alonso, L., Beale, A.M., and Weckhuysen, B.M. Profiling Physicochemical Changes within Catalyst Bodies during Preparation: New Insights from Invasive and Noninvasive Microspectroscopic Studies. Acc. Chem. Res., 2010, 43(9): 1279–1288.
8 Beale, A.M., Jacques, S.D.M., and Weckhuysen, B.M. Chemical imaging of catalytic solids with synchrotron radiation. Chem. Soc. Rev., 2010, 39: 4656–4672.
9 Lysova, A.A. and Koptyug, I.V. Magnetic resonance imaging methods for in situ studies in heterogeneous catalysis. Chem. Soc. Rev., 2010, 39: 4585–4601.
10 Zandbergen, M.W., Jacques, S.D.,Weckhuysen, B.M., and Beale, A.M. Chemical Probing within Catalyst Bodies by Diagonal Offset Raman Spectroscopy. Angew. Chem. Int. Ed., 2012, 51(4): 957–960.
11 Banares, M.A. Operando methodology: combination of in situ spectroscopy and simultaneous activity measurements under catalytic reaction conditions. Catal. Today, 2005, 100: 71–77.
12 Bruckner, A. Looking on Heterogeneous Catalytic Systems from Different Perspectives: Multitechnique Approaches as a New Challenge for In Situ Studies. Catal. Rev. Sci. Eng., 2003, 45(1): 97–150.
13 Wachs, I.E. and Roberts, C.A. Monitoring surface metal oxide catalytic active sites with Raman spectroscopy. Chem. Soc. Rev., 2010, 39: 5002–5017.
14 Le Ru, E.C. and Etchgoin, P.G. A quick overview of surface-enhanced Raman spectroscopy. In: Principals of Surface-Enhanced Raman Spectroscopy and related plasmonic effects. Amsterdam, The Netherlands: Elsevier, 2009. Chap 1, 1–25. 15 McNay, G., Eustace, D., Smith, W.E., Faulds, K., and Graham, D. Surface-Enhanced Raman Scattering (SERS) and Suface Enhanced Resonance Raman Scattering (SERRS): A Review of Applications. Appl. Spectrosc., 2011, 65(8): 825–837.
16 Matousek, P., Everall, N., Towrie, M., and Parker, A.W. Depth profiling in diffusely scattering media using Raman spectroscopy and picosecond Kerr gating. Appl. Spectrosc., 2005, 59(2):200–205.
17 Matousek, P., Towrie, M., Stanley, A., and Parker, A.W. Efficient rejection of fluorescence from Raman spectra using picosecond Kerr gating. Appl. Spectrosc., 1999, 53(12): 1485–1489.
18 Matousek, P., Clark, I.P., Draper, E.R.C., Morris, M.D., Goodship, A.E., Everall, N., Towrie, M., Finney, W.F., and Parker, A.W., Subsurface Probing in Diffusely Scattering Media Using Spatially Offset Raman Spectroscopy. Appl. Spectrosc., 2005, 59(4):393–400.
19 Efremov, E.V., Buijs, J.B., Gooijer, C., and Ariese, F., Fluorescence rejection in resonance Raman spectroscopy using a picosecond-gated intensified charge-coupled device camera. Appl. Spectrosc., 2007, 61(6): 571–578.

83
20 Ariese, F., Meuzelaar, H., Kerssens, M.M., Buijs, J.B., and Gooijer, C. Picosecond Raman spectroscopy with a fast intensified CCD camera for depth analysis of diffusely scattering media. Analyst, 2009, 134(6): 1192–1197.
21 Kim, H., Kosuda, K.M., Van Duyne, R.P., and Stair, P.C. Resonance Raman and surface- and tip-enhanced Raman spectroscopy methods to study solid catalysts and heterogeneous catalytic reactions. Chem. Soc. Rev., 2010, 39(12): 4820–44.
22 Meyer, S.S., Le Ru, E.C., and Etchegoin, P.G. Quantifying Resonant Raman Cross Sections with SERS. J. Phys. Chem. A, 2010, 114:5515–5519.
23 Li, J-F., Li, S-B., Anema, J.R., Yang, Z-L., Huang, Y-F., Ding, Y., Wu, Y-F., Zhuo, X-S., Wu, D-Y., Ren, B., Wang, Z-L., and Tian, Z-Q. Synthesis and Charachterization of Gold Nanoparticles Coated with Ultrathin and Chemically Inert Dielectric Shells for SHINERS Applications. Appl. Spectrosc., 2011, 65(6): 620–626.
24 Stone, N., Faulds, K., Graham, D., and Matousek, P. Prospects of deep Raman spectroscopy for noninvasive detection of conjugated surface enhanced resonance Raman scattering nanoparticles buried within 25 mm of mammalian tissue. Anal. Chem., 2010, 82: 3969–3973.
25 Stone, N., Kerssens, M., Lloyd, G.R., Faulds, K., Graham, D., and Matousek, P. Surface enhanced spatially offset Raman spectroscopic (SESORS) imaging – the next dimension. Chem. Sci., 2011, 2: 776–780.
26 Yuen, J.M., Shah, N.C., Walsh Jr, J.T., Glucksberg, M.R., and Van Duyne, R.P. Transcutaneous Glucose Sensing by Surface-Enhanced Spatially Offset Raman Spectroscopy in a Rat Model. Letters Anal. Chem., 2010, 82(20): 8382–8385.
27 Iping Petterson, I.E., Dvořák, P., Buijs, J.B., Gooijer, C., and Ariese, F. Time-resolved spatially offset Raman spectroscopy for depth analysis of diffusely scattering layers. Analyst, 2010, 135(12): 3255–3259.
28 Iping Petterson, I.E., López-López, M., García-Ruiz, C., Gooijer, C., Buijs, J.B., and Ariese,F. Noninvasive detection of concealed explosives: depth profiling through opaque plastics by time resolved Raman spectroscopy. Anal. Chem., 2011, 83: 8517–8523.
29 Cletus, B., Olds, W.E.L. Izake, E.L., Sundarajoo, S., Fredericks, P.M., and Jaatinen, E. Combined time- and space-resolved Raman spectrometer for the non-invasive depth profiling of chemical hazards. Anal. Bioanal. Chem., 2012, 403(1): 255–263. 30 van Broekhoven, J.A., and Mesters, C.M. Process for the preparation of styrene. US Patent 20090062584. Filed 2008. Issued 2009.
31 Lange, J-P. and Otten, V. Dehydration of phenyl-ethanol to styrene: zeolite catalysis under reactive distilliation. J. Catal., 2006, 238: 6–12.

84
32 Harvey, C.E., van Schrojenstein Lantman, E.M., Mank, A.J.G., and Weckhuysen, B.M. An Integrated AFM-Raman instrument for studying heterogeneous catalytic systems: a first showcase. Chem. Commun., 2012, 48: 1742–1744.
33 McHugh, C.J., Kennedy, A.R., Smith, W.E., and Graham, D. TNT stilbene derivatives as SERRS active species. Analyst, 2007, 132(10): 986–988.
34 Yajima, T., Yingying Yu, Y., and Futamata, M. Closely adjacent gold nanoparticles linked by chemisorption of neutral rhodamine 123 molecules providing enormous SERS intensity. Phys. Chem. Chem. Phys., 2011, 13(27): 12454–12462.
35 Freunscht, P., Van Duyne, R.P., and Schneider, S. Surface-enhanced Raman spectroscopy of trans-stilbene adsorbed on platinum- or self-assembled monolayer-modified silver film over nanosphere surfaces. Chem. Phys. Lett., 1997, 281(12): 372–378.
36 Lee, P. and Meisel, D. Adsorption and surface-enhanced Raman of dyes on silver and gold sols. J. Phys. Chem., 1982, 86: 3391–3395.
37 Everall,N., Hahn, T., Matousek, P., Parker, A.W., and Towrie, M. Photon migration in Raman spectroscopy. Appl. Spectrosc., 2004, 58(5): 591–597.
38 Matousek, P., Morris, M.D., Everall, N., Clark, I.P., Towrie, M., Draper, E., Goodship, A. and Parker, A.W. Numerical simulations of subsurface probing in diffusely scattering media using spatially offset Raman spectroscopy. Appl. Spectrosc., 2005, 59(12): 1485–1492.