chapter 4 supervised visitation -...
TRANSCRIPT
CHAPTER 4: SUPERVISED VISITATION
4.1 INTRODUCTION AND APPROACH
Supervised visitation is one of the core strategies implemented in the second ProtectOhio Waiver Demonstration. While visits between parents and their children in foster care are a required part of most out‐of‐home placement arrangements, the ProtectOhio approach seeks to enhance the parent‐child interaction in order to increase the likelihood and the speed of reunification.
The majority of children in out‐of‐home care have a case plan goal of reunification, usually with one or both birth parents. For these children, child welfare agencies are required to provide opportunities for regularly scheduled visits with their families. This contact is considered essential to maintaining and enhancing parent‐child relationships (Haight, Kagle, & Black, 2003) as well as to promoting attachment and adjustment (McWay & Mullis, 2004). In addition to affecting relationships and child behavior, frequent contact with parents while in out‐of‐home care has been found to be related to certain outcomes such as the length of time children spend in care as well as to the number of placements they experience (Cantos, Gries, & Slis, 1997; Perkins & Ansey, 1998).
When children are placed outside of the home, a visitation plan is developed detailing how often visits are to occur, with whom, and whether visits are to be supervised by a child welfare agency staff member. If there are safety concerns with a visiting parent, visits are supervised. In addition to ensuring safety, supervised visits provide an opportunity for child welfare professionals to observe and document parent‐child interaction.
While frequency, supervision, and documentation are important aspects of visiting, they do not ensure a productive visit. Special attention needs to be given to the actual activities which parents and children share during the visit. Families may need assistance interacting with their children in a positive way. The effectiveness, enjoyment and overall quality of visits can be increased by assessing the developmental needs of children and parents; this may potentially result in visits which are thoughtfully planned and structured (Mapp, 2002; Loar, 1998). With the appropriate support, visits can be therapeutic, aid in the establishment and strengthening of the parent‐child relationship, help parents gain confidence in looking after their child and meeting their child’s needs, aid in the identification and assessment of potentially stressful situations between parent and child, and be used as a tool to help evaluate the family’s progress toward goals (Ohio Caseload Analysis Initiative in Partnership with ProtectOhio Initiative, 2005).
Unfortunately, not all eligible children in foster care in Ohio are receiving regularly scheduled visits which offer such explicit opportunities for learning and growth. Resource constraints such as staff availability, space availability, and transportation needs may prevent consistent visiting.
The following chapter provides information on the implementation and development of the ProtectOhio supervised visitation strategy as it has taken shape in a subset of the demonstration counties. Visitation structure and practices are compared across demonstration and comparison
CHAPTER 4: SUPERVISED VISITATION 115 | P a g e
counties. Lastly, the study team presents findings on child outcomes related to participation in the strategy.
4.1.1 Defining the Supervised Visitation Strategy
The supervised visitation strategy is a structured intervention aimed at improving short and long‐term outcomes for children in placement. Relevant potential outcomes include shorter time between child removal and the initiation of parent/child visitation, reduced time in placement for the child, increased likelihood of exit to reunification, and fewer subsequent case openings following the closure of a case.
4.1.1.1 Choosing the Strategy
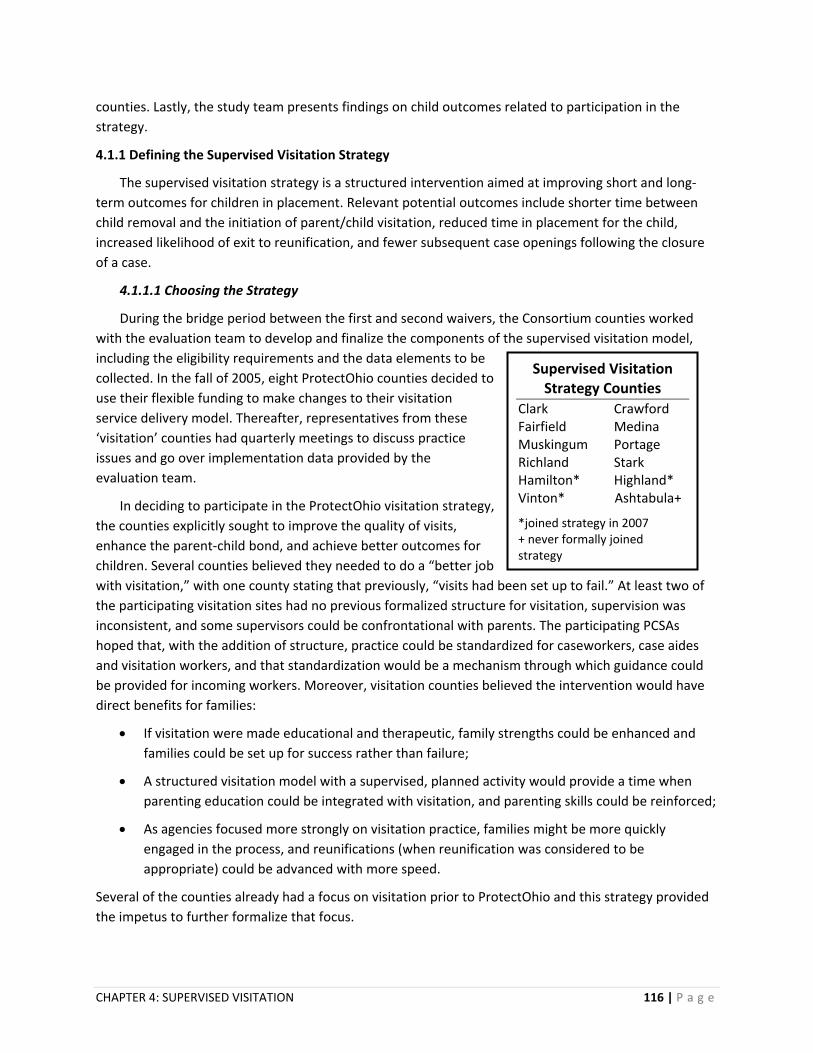
During the bridge period between the first and second waivers, the Consortium counties worked with the evaluation team to develop and finalize the components of the supervised visitation model, including the eligibility requirements and the data elements to be collected. In the fall of 2005, eight ProtectOhio counties decided to use their flexible funding to make changes to their visitation service delivery model. Thereafter, representatives from these ‘visitation’ counties had quarterly meetings to discuss practice issues and go over implementation data provided by the evaluation team.
In deciding to participate in the ProtectOhio visitation strategy, the counties explicitly sought to improve the quality of visits, enhance the parent‐child bond, and achieve better outcomes for children. Several counties believed they needed to do a “better job with visitation,” with one county stating that previously, “visits had been set up to fail.” At least two of the participating visitation sites had no previous formalized structure for visitation, supervision was inconsistent, and some supervisors could be confrontational with parents. The participating PCSAs hoped that, with the addition of structure, practice could be standardized for caseworkers, case aides and visitation workers, and that standardization would be a mechanism through which guidance could be provided for incoming workers. Moreover, visitation counties believed the intervention would have direct benefits for families:
Richland Stark Hamilton* Highland* Vinton* Ashtabula+
*joined strategy in 2007 + never formally joined strategy
Supervised Visitation Strategy Counties
Clark Crawford Fairfield Medina Muskingum Portage
• If visitation were made educational and therapeutic, family strengths could be enhanced and families could be set up for success rather than failure;
• A structured visitation model with a supervised, planned activity would provide a time when parenting education could be integrated with visitation, and parenting skills could be reinforced;
• As agencies focused more strongly on visitation practice, families might be more quickly engaged in the process, and reunifications (when reunification was considered to be appropriate) could be advanced with more speed.
Several of the counties already had a focus on visitation prior to ProtectOhio and this strategy provided the impetus to further formalize that focus.
CHAPTER 4: SUPERVISED VISITATION 116 | P a g e

In 2007, an additional three counties opted to participate in the visitation strategy. Ashtabula, not an official visitation strategy participant, nonetheless adapted its visitation practice to the ProtectOhio model and elected to provide data to the study team. Therefore, for the purposes of this report, Ashtabula is regarded as a visitation site, bringing the total number of visitation counties to twelve.
4.1.1.2 Strategy Components
The model for the supervised visitation intervention consists of five components (see text box). The first two components promote consistent and frequent visiting, based on the belief that children receiving a higher “dosage” of the intervention will have better outcomes. For some visitation counties, this represents an increase in what was typically occurring before strategy implementation. The third component is that all visits should be supervised by agency staff so that staff can interact with the family and ensure that activities are planned and completed. The fourth component seeks to ensure that age‐appropriate activities are planned for the visit and completed by the child and his or her caregiver. This component is the central and defining feature of the visitation strategy. It means that formal activities should be planned in advance in order to create a learning environment by, for example, videotaping and working directly with parents immediately after a visit, conducting pre‐visit planning with the parent so expectations are clear, designing a discrete activity with the goal of enhancing the parent/child relationship, and/or providing feedback during the visit. The last component ensures not only that the child is spending time with a parent, but that the parent is available to participate in the planned activity.
4.1.1.3 Characteristics of Eligible Population
There are five eligibility requirements for children who are meant to be served through the supervised visitation strategy (see text box). In designing the strategy, counties agreed to target children under 12, theorizing that younger children are more likely to benefit from efforts to engage the parents in structured activities. Visitation counties may nonetheless choose to include older children in their
enhanced visitation strategy, since all children in foster care receive visits from parents, if indeed reunification is the goal. Targeting the younger children simply focuses the strategy. The second eligibility criterion is to target children placed in agency foster homes. This is largely a practical consideration, in order to facilitate supervision activities and data collection; foster homes directly recruited and trained by the PCSA are also generally supervised
by the caseworkers, whereas children in network foster care may be monitored and supervised by staff of the networks. A few counties subsequently agreed to include children in network homes if the PCSA was providing the visitation services. A further strategy requirement was that the reason for the child’s
Supervised Visitation Components
1. Visits should occur weekly 2. Visits should last at least one hour 3. Visits are supervised 4. Activities are planned and completed 5. At least one parent attends the visit
Supervised Visitation Population
1. Children must be 12 or under 2. Children should be placed in agency foster
homes 3. A child’s reason for being placed is abuse or
neglect 4. Children have a case plan goal of reunification 5. Children have a new case opening since
implementation of the strategy
CHAPTER 4: SUPERVISED VISITATION 117 | P a g e

placement should be abuse and neglect; children with other placement reasons such as dependency or delinquency may receive visitation, but it was decided they would not be included in the evaluation of the strategy; typically, such children are over 12. A case plan goal of reunification was a further requirement because the strategy aims to improve the parent‐child relationship in order to speed the return home. Finally, it was decided that children should have a new case occurring after the implementation of the supervised visitation strategy. This last requirement ensured that children did not begin visitation under one approach and then switch to another, thereby complicating evaluation efforts.
4.1.2 Logic Model and Key Research Questions
The following logic model was developed cooperatively by the evaluation team and practitioners participating in quarterly workgroups. The outputs below were derived using language articulated by PCSA staff. Although these impacts are not easily measured, they are considered by visitation counties to be important products of the intervention. Counties also had input into the listed outcomes; these changes illustrate what the visitation counties are striving to achieve.
Outcomes
Shorter time between placement and first visit Shorter length of stay in out‐of‐home care during a case episode Fewer new placement episodes within a case episode More exits to reunification Shorter case episodes Fewer subsequent substantiated CAN reports Fewer placement moves within a case episode
Activities Provide weekly, supervised, visits of at least 1 hour in length. Visits are attended by at least one parent, or a caregiver seeking reunification. Through planned, structured, parent‐child activities, parents are taught strategies they can take home with them.
Outputs
Families have enhanced problem‐solving skills and improved parenting skills.
Children have an increased sense of stability and safety.
Quality of parent‐child relationship is improved, as well as that of the whole family.
PCSA can make a quicker
decision to go for reunification vs. permanency.
Families move from supervised to unsupervised visits more
quickly.
CHAPTER 4: SUPERVISED VISITATION 118 | P a g e

Three key research questions arise from this logic model and are addressed in this report:
• How is supervised visitation implemented in the participating counties?
• How does practice in the visitation counties differ from that in non‐strategy demonstration sites and in the comparison counties?
• How do children involved in supervised visitation fare, in terms of immediate and short‐term outcomes, compared to children served in comparison counties (receiving standard visitation)?
4.1.3 Evaluation Methods
The study team gathered information about supervised visitation practice from a variety of sources, at both the case‐level and the county level. Two case‐level sets of quantitative data were used to assess the impact of the strategy on child outcomes. The first set is ACCESS/SIS data gathered directly by PCSA staff. For each supervised visit which occurred in the visitation counties, PCSA staff entered data on nine items (Table 4.1) ‐‐ three visit attendance variables and six visit detail variables. The earliest visit was held in September 2005 and the most recent was held in December 2009. Over the course of this four‐year period, the visitation strategy counties provided visitation services to 2,206 children; of the 38,975 scheduled visits entered into the database, some 30,661 of them occurred and were supervised. For an overview of how these numbers break down by individual visitation county, see Table 4.3.
Table 4.1: ACCESS/SIS Data Collected for Supervised Visitation
Attendance Variables
• Who was scheduled to attend the visit?
• Did this person attend the visit?
• Did the attendee’s visit end early?
Visit Detail Variables
• Where did the visit take place?
• How long did the visit last?
• Who supervised the visit?
• How was the visit supervised?
• Were there siblings at the visit?
• Was there a planned activity?
The second source of case‐level quantitative information is the state administrative data system,
SACWIS (formerly FACSIS, in the first two years of the strategy). The study team received case‐level data on elements such as allegation disposition dates, placement dates, and incident report dates. Through analysis of these data sets the study team evaluated the impact of the strategy on child‐level outcomes; these analyses are reported in Section 4.5.
To complement the analysis of case‐level data, the study team gathered substantial amounts of information at the county level. Much of this information is qualitative in nature, offering valuable insight into the context in which outcomes occur and a fuller understanding of the process and development of the strategy. In all, three waves of qualitative supervised visitation data have been
CHAPTER 4: SUPERVISED VISITATION 119 | P a g e

collected during the second waiver period. These data come from interviews and focus groups with providers and parents as well as observations of supervised visits:
• 2006: The study team conducted structured open‐ended telephone interviews with management and visitation staff familiar with visitation practice in their respective counties. Interviews were completed in 27 counties, including visitation counties, other demonstration counties, and comparison counties.
• 2007: The study team made site visits to the 12 visitation counties, conducting interviews with visitation supervisors and workers, holding focus groups (in eight of the counties), and observing supervised visits (15 visits in seven of the counties).
• 2009: Two separate data collection activities occurred during the year. The first was a web‐based survey circulated to representatives of each of the 18 demonstration and 17 comparison counties (Appendix B.4). They answered questions about specific visitation practices. County representatives included Executive Directors, administrators, supervisors and other management staff. Additionally, the study team made site visits to all evaluation counties to conduct observations of supervised visits and to interview parents following the observation. (The observation protocol and interview guide are in Appendix B.5 and B.6 respectively.) This resulted in 40 visit observations in 26 counties (11 visitation counties, five other demonstration counties, and 10 comparison counties). Thirty‐seven of these observations were followed by parent interviews.
In conducting the analysis of the county‐level data, the study team consistently used a qualitative rubric for expressing differences between small groups of cases, where statistical testing is inappropriate or unfeasible: “substantial” for differences in percentages exceeding 50 points, “moderate” for differences in percentages of between 35‐50 points, and “slight” or “somewhat” for percentage differences of between 20‐34 points.
4.1.4 Organization of the Chapter
This chapter is organized around the three research questions noted above. The first two sections describe how the strategy has been implemented in the participating counties. Section 4.2 discusses activities at the county level, while Section 4.3 presents a more detailed view of the strategy through the lens of actual supervised visits. Section 4.4 summarizes county level differences. Section 4.5 covers outcomes analyses. In the next section, we examine practice differences at the county level, comparing the 12 visitation counties, the other six demonstration counties, and the 17 comparison counties.
4.2 COUNTY‐LEVEL PROCESS TO BRING VISITATION STRATEGY TO FULL IMPLEMENTATION
This section provides a county‐level perspective of the steps visitation counties have taken to bring the strategy to full implementation. We provide descriptions and contrasts for some of the more notable changes initiated by the visitation counties, together with descriptions of the barriers encountered during the process of implementation.
As described in the logic model above, strategy counties agreed to provide a minimum of one, one‐hour visit each week to families. Visits were to be attended by at least one parent or caregiver seeking
CHAPTER 4: SUPERVISED VISITATION 120 | P a g e
reunification, with the view that, through planned, structured and supervised activities, parents could be mentored to improve parenting skills and learn approaches to parenting that could ultimately be used at home.
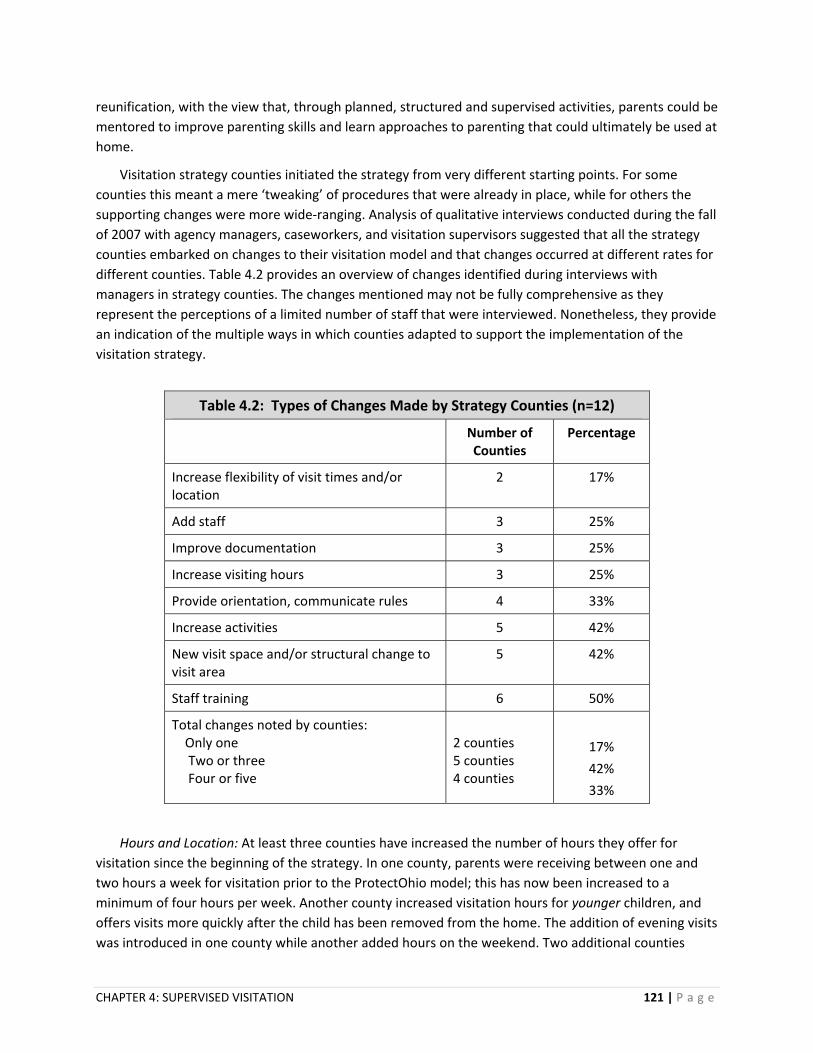
Visitation strategy counties initiated the strategy from very different starting points. For some counties this meant a mere ‘tweaking’ of procedures that were already in place, while for others the supporting changes were more wide‐ranging. Analysis of qualitative interviews conducted during the fall of 2007 with agency managers, caseworkers, and visitation supervisors suggested that all the strategy counties embarked on changes to their visitation model and that changes occurred at different rates for different counties. Table 4.2 provides an overview of changes identified during interviews with managers in strategy counties. The changes mentioned may not be fully comprehensive as they represent the perceptions of a limited number of staff that were interviewed. Nonetheless, they provide an indication of the multiple ways in which counties adapted to support the implementation of the visitation strategy.
Table 4.2: Types of Changes Made by Strategy Counties (n=12)
Number of Counties
Percentage
Increase flexibility of visit times and/or location
2 17%
Add staff 3 25%
Improve documentation 3 25%
Increase visiting hours 3 25%
Provide orientation, communicate rules 4 33%
Increase activities 5 42%
New visit space and/or structural change to visit area
5 42%
Staff training 6 50%
Total changes noted by counties: Only one Two or three Four or five
2 counties 5 counties 4 counties
17%
42%
33%
Hours and Location: At least three counties have increased the number of hours they offer for visitation since the beginning of the strategy. In one county, parents were receiving between one and two hours a week for visitation prior to the ProtectOhio model; this has now been increased to a minimum of four hours per week. Another county increased visitation hours for younger children, and offers visits more quickly after the child has been removed from the home. The addition of evening visits was introduced in one county while another added hours on the weekend. Two additional counties
CHAPTER 4: SUPERVISED VISITATION 121 | P a g e
specifically noted that the speed with which visits are initiated has increased. The PCSA has been able to make these changes in part because it has hired more staff to perform these activities.
One of the smaller counties decided to change the way in which it offered visitation by bringing all the families together in the early evening once weekly for visitation. In this way, they expected that families would be able to learn from one another, would understand that the structuring of the visitation period was “not something to be thought of as a ‘vendetta’ against the family,” and expected this in turn to reduce the barriers between the family and the system.
Documentation: Some counties noted the need for improved documentation. In these counties, visits can now be tracked over time in a more efficient and consistent manner. While some sites mention that they already had good internal systems of communication in place, for others this increase in standardization and comprehensiveness of reporting allows caseworkers to have a clearer understanding of what is happening during visitation, and allows them to go to court with more neutral information about the parents’ level and quality of participation in visitation sessions. For at least one county, the report is now completed after each visit and lists the parents’ strengths, any concerns the monitor may have and incidents (if any) that have occurred during the visit.
Visitation space: Several counties made structural changes to the areas in which visits occur or changed centers entirely. For example, upon initiation of the strategy, one county changed visit locations to a new center entirely. Previously, they had used a small room with a one‐way mirror. There had been no toys or items in the room for families to use and further, all the workers used the same room thus making evening visitation slots extremely difficult for families to schedule. This county moved the visitation site to a house and provided materials, such as craft supplies and toys, for the families to use. This in turn was expected to make the visitation experience more family‐centered.
Activities: The introduction of a structured activity is integral to the new visitation model; it affords families the opportunity to bond with their child(ren) by engaging and interacting with them more closely around a set task or activity. It also affords teaching opportunities whereby workers can be hands‐on and staff can help redirect and model behaviors for parents.
Orientation: Some counties have established an orientation with parents prior to their first supervised visit. The visitation workers try to make the orientation phone call to the parent within 24 hours of the family being referred to them in order to set up the first visit and to give parents an overview of what to expect when visitation starts. PCSA staff suggests that it is important that parents know the rules prior to the start of visitation so they are less likely to inadvertently break them. Parents are also told at the beginning of the visitation process that a structured activity is an expectation. In some cases counties now expect parents to sign guidelines and feel that this leads to fewer ‘blow‐ups.’ Further, the parents feel like they are contributing to their outcome because they have goals. This is important to parents’ motivation and feelings of accomplishment.
Staff: The hiring of visitation staff has been important in bringing consistency to the visitations, and for the extension of available hours. One county added two new full‐time visitation monitors. In some cases, the new staff had more specialized training, which benefited all staff involved in visitation. Prior to strategy implementation, one county noted that workers would have an assortment of ideas about
CHAPTER 4: SUPERVISED VISITATION 122 | P a g e

what should occur during a visit, and different opinions about the quality of the visit after it had ended, but with the addition of specialist staff, these inconsistencies have been reduced.
Trainings: Six counties mentioned trainings that have occurred since the implementation of the visitation strategy. These have included training films, worker shadowing and trainings regarding the importance of neutrality. In some instances legal information was given together with information on how to fill out the relevant paperwork. One specific ProtectOhio training focused on best practice. In general however, trainings have tended to be relatively minimal. This may be due in part to the perception that visitation supervisors used and/or hired by some counties tend to have prior expertise with families. Nonetheless, at least one visitation supervisor mentioned a desire for more training on safety and specific mental health disorders such as bipolar disorder and attention deficit disorder.
Additionally, for several counties, a change in agency philosophy about the importance of visitation resulted in more discussion with parents about visit expectations than had been conducted prior to strategy implementation. By adopting the use of structured activities, counties adopted a more hands on, therapeutic approach. There was also more emphasis placed on working toward case plan goals with parents during visitation. At least two of the counties began providing formal orientation to visitation for parents. During this orientation, agency rules are now presented in addition to explanations of the visitation program, reasons for supervision and the aims of the activities component. Rather than a mere monitoring of visits, this new approach to visitation, at its best, means structured activities can provide a vehicle whereby parent mentoring can occur, and feedback can be provided to the parent so that parenting skills can be reinforced over time. County staff believe that this can send parents the message that the agency wants the family to regain custody thereby also positively influencing the parents’ own motivation.
4.2.1 Barriers to Implementation
Most counties encountered at least one barrier to smooth implementation of the supervised visitation strategy. Examples of some of the major implementation barriers mentioned by counties include:
• Staff resistance. This was an initial barrier for some counties. Not all workers were committed to the ProtectOhio model because they felt it was “just another thing” they would be responsible for. This apprehension was borne out in some counties where workload initially increased for caseworkers because they did much of the supervision.
• Lack of visit space. Lack of visit space was also mentioned as a barrier. This was a particular problem for some counties when trying to increase the number of visits because of competition for the same after‐school and weekend hours.
• Activity planning. The concept of the activity component was unclear for many staff, with little agreement across the counties as to what was meant by ‘activity.’ Further, some counties had difficulty determining who would be responsible for the planning of the activity, staff or parents.
As the intervention matured, counties tackled these challenges in various ways and with varying degrees of success. While some common mechanisms have been used across counties to enhance visitation, individual strategy counties have naturally chosen to focus on bolstering areas which they believe offer the most opportunity for improvement. This is further explored in the following section.
CHAPTER 4: SUPERVISED VISITATION 123 | P a g e

Summary: Visitation counties began the strategy from very different starting points; thus, the number and degree of change made varied from county to county. Changes which multiple counties reported making included: new visit space or structural changes to visit areas, adding staff, training and orientation, increasing visiting hours and activities, and increasing flexibility of visit times and/or location. Several counties reported a change in agency philosophy regarding the importance of visitation.
Most counties encountered barriers in implementing the visitation strategy. Barriers included staff resistance, lack of visit space, and the varying definitions of the ‘activity’ component to visitation.
4.3 IMPLEMENTATION RESULTS AT THE CASE‐LEVEL
This section discusses case‐level information gathered on each supervised visit conducted in the visitation counties. We report the volume and nature of the visitation activity across the 12 participating sites, and we examine patterns across the four key components ‐‐ visit location, visit supervision, visit duration and, finally, the defining feature of the visitation model, planned structured activities.
To examine implementation, the study team assessed data recorded by visitation strategy counties for each visit. Table 4.3 provides information regarding the number of children served by the ProtectOhio visitation strategy from the strategy start date through to the last transmittal of data by the respective counties. As expected, this number varies by county depending on the size of the county and the date when the county entered the strategy. In all, 2,206 children have been served under this strategy and have received 30,661 supervised visits.
CHAPTER 4: SUPERVISED VISITATION 124 | P a g e
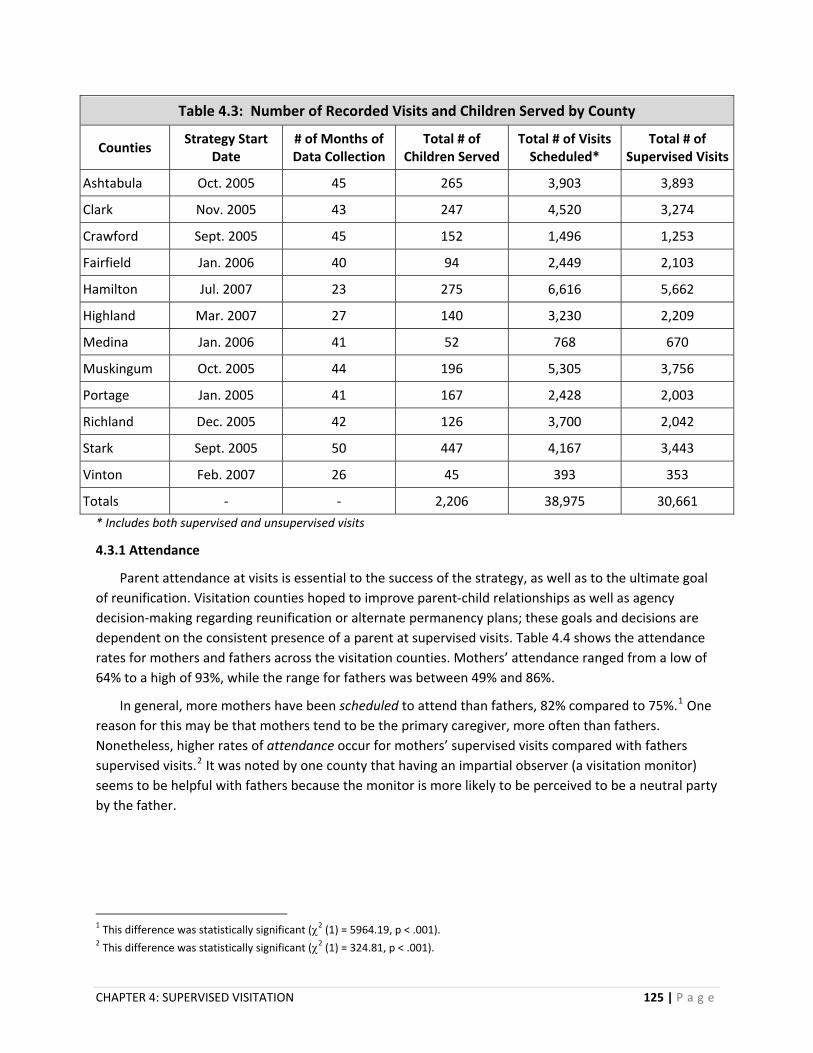
Table 4.3: Number of Recorded Visits and Children Served by County
Counties Strategy Start
Date # of Months of Data Collection
Total # of Children Served
Total # of Visits Scheduled*
Total # of Supervised Visits
Ashtabula Oct. 2005 45 265 3,903 3,893
Clark Nov. 2005 43 247 4,520 3,274
Crawford Sept. 2005 45 152 1,496 1,253
Fairfield Jan. 2006 40 94 2,449 2,103
Hamilton Jul. 2007 23 275 6,616 5,662
Highland Mar. 2007 27 140 3,230 2,209
Medina Jan. 2006 41 52 768 670
Muskingum Oct. 2005 44 196 5,305 3,756
Portage Jan. 2005 41 167 2,428 2,003
Richland Dec. 2005 42 126 3,700 2,042
Stark Sept. 2005 50 447 4,167 3,443
Vinton Feb. 2007 26 45 393 353
Totals ‐ ‐ 2,206 38,975 30,661
* Includes both supervised and unsupervised visits
4.3.1 Attendance
Parent attendance at visits is essential to the success of the strategy, as well as to the ultimate goal of reunification. Visitation counties hoped to improve parent‐child relationships as well as agency decision‐making regarding reunification or alternate permanency plans; these goals and decisions are dependent on the consistent presence of a parent at supervised visits. Table 4.4 shows the attendance rates for mothers and fathers across the visitation counties. Mothers’ attendance ranged from a low of 64% to a high of 93%, while the range for fathers was between 49% and 86%.
In general, more mothers have been scheduled to attend than fathers, 82% compared to 75%.1 One reason for this may be that mothers tend to be the primary caregiver, more often than fathers. Nonetheless, higher rates of attendance occur for mothers’ supervised visits compared with fathers supervised visits.2 It was noted by one county that having an impartial observer (a visitation monitor) seems to be helpful with fathers because the monitor is more likely to be perceived to be a neutral party by the father.
1 This difference was statistically significant (χ2 (1) = 5964.19, p < .001). 2 This difference was statistically significant (χ2 (1) = 324.81, p < .001).
CHAPTER 4: SUPERVISED VISITATION 125 | P a g e

Table 4.4: Rate of Parent Attendance at Visit
Counties
# of Supervised Visits Mothers
Were Scheduled to
Attend
% of Mothers’ Supervised
Scheduled Visits Attended by Mothers
# of Supervised Visits Father Scheduled to
Attend
% of Fathers’ Supervised
Scheduled Visits Attended by
Father
Rate at which Children had No
Visit when Supervised Visit
had been Scheduled *
Ashtabula 3,212 82% 1,691 73% 20%
Clark 3,538 79% 1836 66% 19%
Crawford 1,214 87% 749 75% 12%
Fairfield 1,783 89% 922 82% 11%
Hamilton 6,058 84% 1,944 80% 15%
Highland 2,672 66% 1,593 70% 32%
Medina 698 90% 146 84% 9%
Muskingum 4,292 74% 2239 71% 25%
Portage 2,107 83% 1,276 78% 15%
Richland 2,619 64% 1,307 49% 35%
Stark 3,499 87% 1,291 84% 11%
Vinton 256 93% 133 86% 6%
TOTAL 31,948 82% 15,127 75% 18%
*Includes visits scheduled with parents and other adults such as relatives etc. The visit cancellation could be due to visitor or agency cancellation, visitor or child illness, or visitor no‐show.
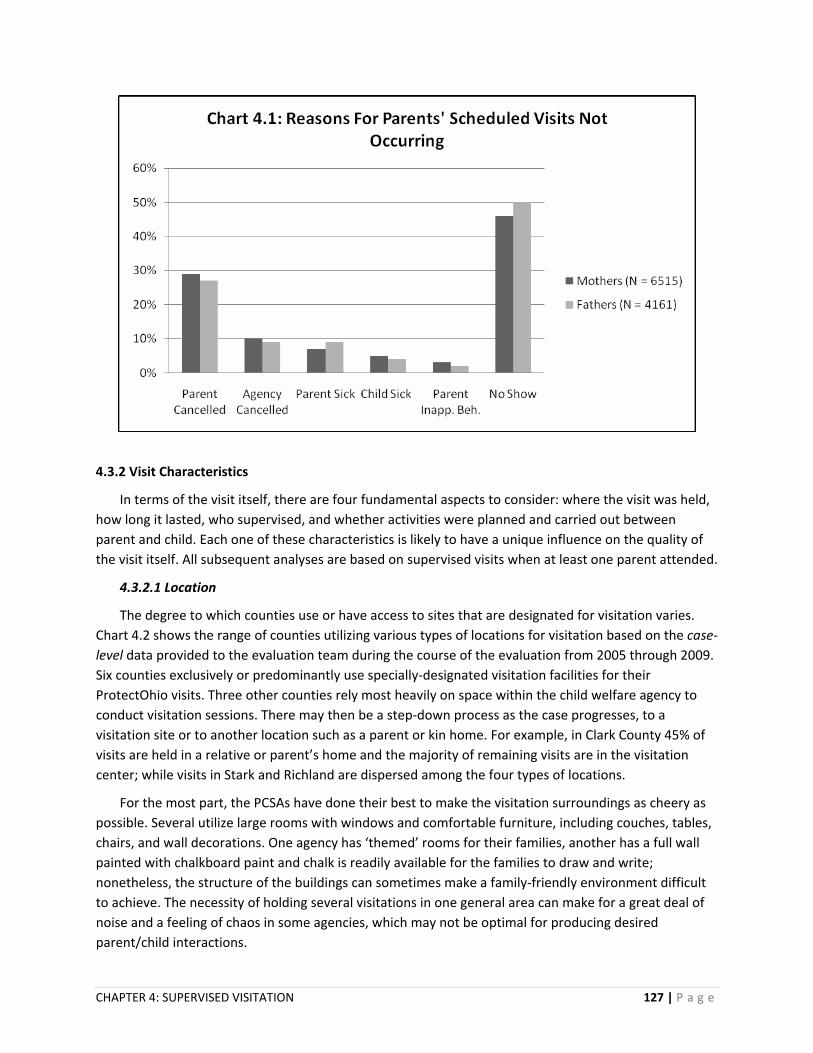
When Visits Fail to Occur: Visits can fail to occur for a variety of reasons that can include the visitor or agency cancelling the visit, the visitor or child being ill on the day of the visit, the agency cancelling the visit because of a parent’s inappropriate behavior, or because the parent fails to appear. Chart 4.1 provides a visual representation of the percentage of cancelled visits that fall into each of the described categories for mothers and fathers separately, across all visitation counties. The patterns shown for mothers and fathers are very similar. There were no notable deviations from this general pattern when examining differences among the visitation counties.
CHAPTER 4: SUPERVISED VISITATION 126 | P a g e
4.3.2 Visit Characteristics
In terms of the visit itself, there are four fundamental aspects to consider: where the visit was held, how long it lasted, who supervised, and whether activities were planned and carried out between parent and child. Each one of these characteristics is likely to have a unique influence on the quality of the visit itself. All subsequent analyses are based on supervised visits when at least one parent attended.
4.3.2.1 Location
The degree to which counties use or have access to sites that are designated for visitation varies. Chart 4.2 shows the range of counties utilizing various types of locations for visitation based on the case‐level data provided to the evaluation team during the course of the evaluation from 2005 through 2009. Six counties exclusively or predominantly use specially‐designated visitation facilities for their ProtectOhio visits. Three other counties rely most heavily on space within the child welfare agency to conduct visitation sessions. There may then be a step‐down process as the case progresses, to a visitation site or to another location such as a parent or kin home. For example, in Clark County 45% of visits are held in a relative or parent’s home and the majority of remaining visits are in the visitation center; while visits in Stark and Richland are dispersed among the four types of locations.
For the most part, the PCSAs have done their best to make the visitation surroundings as cheery as possible. Several utilize large rooms with windows and comfortable furniture, including couches, tables, chairs, and wall decorations. One agency has ‘themed’ rooms for their families, another has a full wall painted with chalkboard paint and chalk is readily available for the families to draw and write; nonetheless, the structure of the buildings can sometimes make a family‐friendly environment difficult to achieve. The necessity of holding several visitations in one general area can make for a great deal of noise and a feeling of chaos in some agencies, which may not be optimal for producing desired parent/child interactions.
CHAPTER 4: SUPERVISED VISITATION 127 | P a g e
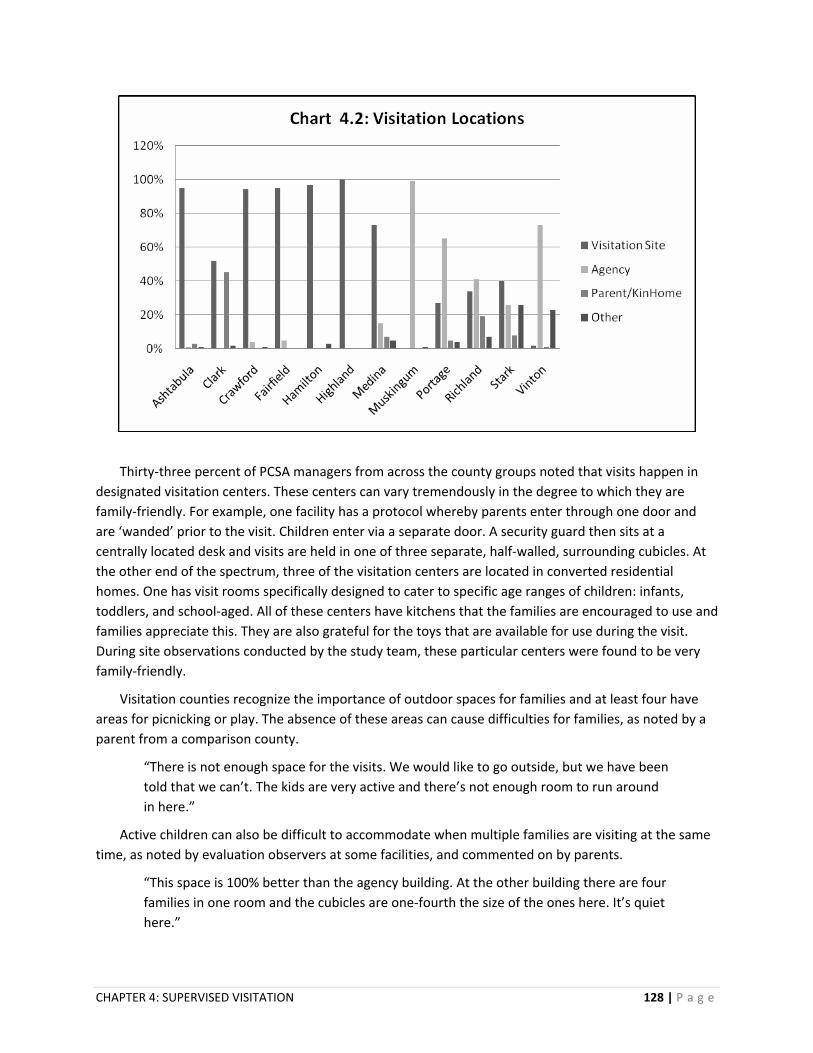
Thirty‐three percent of PCSA managers from across the county groups noted that visits happen in
designated visitation centers. These centers can vary tremendously in the degree to which they are family‐friendly. For example, one facility has a protocol whereby parents enter through one door and are ‘wanded’ prior to the visit. Children enter via a separate door. A security guard then sits at a centrally located desk and visits are held in one of three separate, half‐walled, surrounding cubicles. At the other end of the spectrum, three of the visitation centers are located in converted residential homes. One has visit rooms specifically designed to cater to specific age ranges of children: infants, toddlers, and school‐aged. All of these centers have kitchens that the families are encouraged to use and families appreciate this. They are also grateful for the toys that are available for use during the visit. During site observations conducted by the study team, these particular centers were found to be very family‐friendly.
Visitation counties recognize the importance of outdoor spaces for families and at least four have areas for picnicking or play. The absence of these areas can cause difficulties for families, as noted by a parent from a comparison county.
“There is not enough space for the visits. We would like to go outside, but we have been told that we can’t. The kids are very active and there’s not enough room to run around in here.”
Active children can also be difficult to accommodate when multiple families are visiting at the same time, as noted by evaluation observers at some facilities, and commented on by parents.
“This space is 100% better than the agency building. At the other building there are four families in one room and the cubicles are one‐fourth the size of the ones here. It’s quiet here.”
CHAPTER 4: SUPERVISED VISITATION 128 | P a g e

Not surprisingly, cleanliness of the visit location is important to parents too. An older stand‐alone visitation site used by one of the visitation counties was reportedly ‘not kid friendly,’ in poor condition, and had visit rooms that were hard to monitor because of their location on different floors; this building was closed in 2007, replaced by two locations ‐‐ a visitation center at the agency, and an off‐site contracted space and agency. At the second location, parents are offered parenting classes each day for 12 weeks. Additionally, once a week when children come to the center, instructors at the center observe children interacting with their parents and provide feedback to those parents.
4.3.2.2 Supervision
One of the key components of the visitation strategy is that visits need to be monitored by someone from the PCSA; when this happens, the interaction between the parent and child can be observed and constructive feedback can be provided.
Some counties rely on a variety of staff within their agencies to supervise visits. For example, while one county typically uses caseworkers to supervise visits, it also uses family support workers, other caseworkers, their foster care coordinator, and even administrators. Family support workers can be helpful because they might be visiting the home and will have some background knowledge and understanding of the parents. The county acknowledges; however, that it is sometimes challenging to use caseworkers for supervision because families tend to ask inappropriate questions about their case during visits. When the visitation strategy was first developed, counties believed that having designated visitation supervisors would improve the visitation experience. Some of the advantages visitation counties described are listed below:
• They are an independent neutral party therefore families trust them more (4 counties).
• It gives the caseworker time for other issues (3 counties).
• They provide less biased documentation (2 counties).
• They have a different perspective on the case (1 county).
• They have more time to teach and mentor parents (1 county).
• They are better trained in supervision of visits (1 county).
However, in several ways, having designated visitation supervisors is less straight forward than originally envisioned:
• Caseworkers cannot see how families are interacting (5 counties).
• Sometimes the caseworkers do not inform the visit supervisor about case details or when a family is scheduled (2 counties).
• Caseworkers cannot report as confidently in court (2 counties).
• Visit supervisors are not as familiar with the case and what to look for (1 county).
• Families might try to get away with things that are not acceptable to the caseworker (1 county).
• May provide less stability for the child than having the consistency of a caseworker (1 county).
These issues perhaps explain some of the variation in who supervises visits among visitation counties.
CHAPTER 4: SUPERVISED VISITATION 129 | P a g e

Case‐level visitation data offers more detail about how counties vary in their choice of supervisors. For visitation strategy counties, nearly half (48%) of all visits were monitored by dedicated visitation workers, another quarter (28%) by case aides, 20% by case workers, and the remaining 5% of visits were monitored by others such as kin. Chart 4.3 shows how this plays out across counties. Four counties rely almost solely on visitation workers to provide supervision; in another five, caseworkers provide a substantial amount of the supervision for families; and case aides are heavily used in five of the counties.
The type of person responsible for supervising the visit is moderately related to the location of the
visit.3 Visits occurring at visitation sites are more likely to be supervised by visitation supervisors, whereas those visits held at agency sites are more likely to be supervised by case aides. Indeed, close to 90% of the visits that are supervised by a visitation supervisor occur at a visitation site. On the other hand, caseworkers supervise at both visitation sites (54% of visits) and at the agency (30%).
4.3.2.3 Visit Duration
The length of each visit, in association with the frequency of family visits, is part of the dosage component of the supervised visitation model. It is hypothesized that longer visits allow for more parent‐child interaction as well as more time for structured activities to be completed. Across visitation counties, less than 2% of visits lasted for less than one hour, while 39% lasted between one to two hours, 55% lasted between two to three hours and 4% of visits were greater than three hours. This indicates that, in large measure, visitation counties were able to meet the visitation model component of having visits last at least one hour. Table 4.5 shows the variation in visit length among the 12
3 (χ2 (9) = 12158.57, p < .001; Cramer’s V = .38)
CHAPTER 4: SUPERVISED VISITATION 130 | P a g e

visitation counties. Only one of the counties provides a substantial number of visits that are three or more hours long. This may be due in part to the relatively large percentage of their visits that occur in the family or kin home. Nonetheless, at least four other counties far outstripped the expectations of the model by typically providing visits that were two or more hours in length.
Table 4.5: Duration of Visits by County (n=28,007)
Counties < 1 hour 1 to 2 hours 2 to 3 hours >3 hours
Ashtabula (n=2990) 6% 86% 7% 0%
Clark (n=3111) 1% 9% 70% 21%
Crawford (n=1199) 1% 88% 10% 0%
Fairfield (n=1966) 2% 64% 34% 0%
Hamilton (n=5346) 0% 4% 94% 3%
Highland (n=2076) 0% 9% 84% 7%
Medina (n=656) 4% 64% 31% 1%
Muskingum (n=3728) 1% 21% 75% 3%
Portage (n=1954) 2% 85% 12% 1%
Richland (n=1525) 2% 37% 55% 5%
Stark (n=3121) 1% 46% 50% 2%
Vinton (n=335) 2% 81% 17% 0%
Further analyses also suggest a small but significant relationship between who supervises the visit
and the duration of the visit for parents.4 The relationship between supervisor type and length of visit is depicted in Chart 4.4. Visitation workers and case aides are more likely to hold visits between two and three hours long, whereas the visits supervised by caseworkers tend to be between one and two hours. Indeed, nearly 60% of visits supervised by a caseworker were between one to two hours whereas more than 60% of visits supervised by a visitation supervisor were between two to three hours long. This may not be surprising, given the workload associated with being a caseworker. It may nonetheless point to the advantages of using visitation workers to supervise visits.
4 χ2 (9) = 1822, p < .001; Cramer’s V =.15
CHAPTER 4: SUPERVISED VISITATION 131 | P a g e
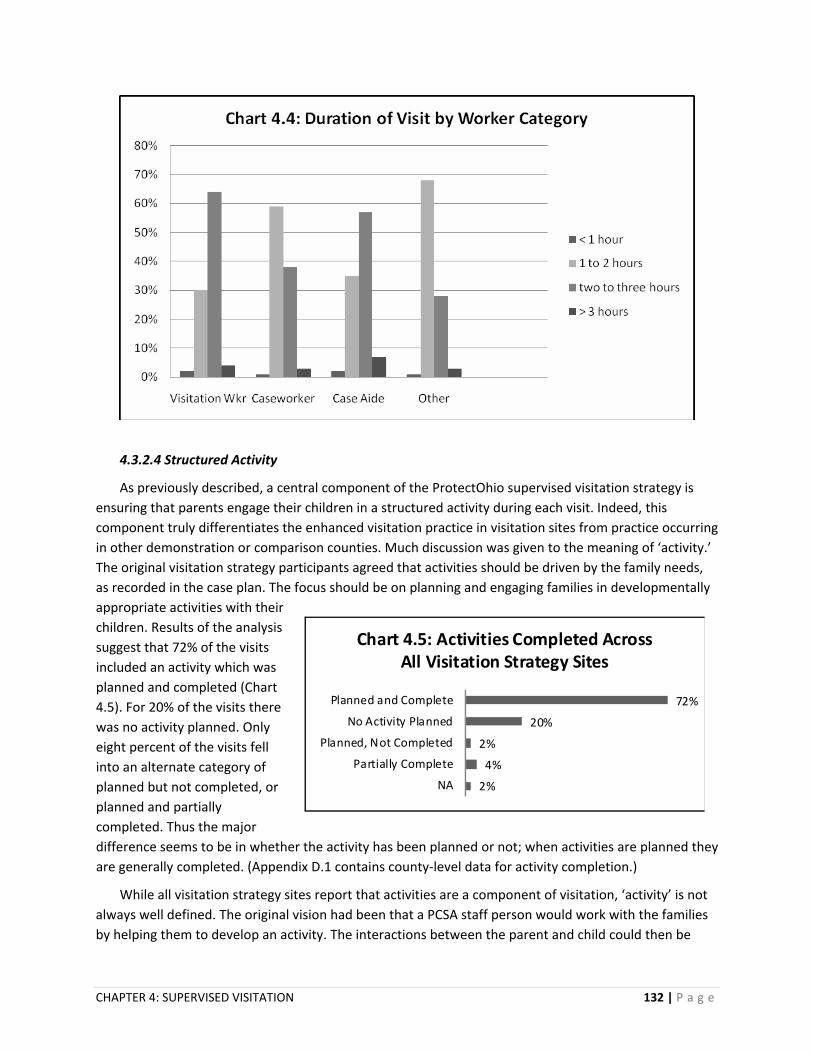
4.3.2.4 Structured Activity
As previously described, a central component of the ProtectOhio supervised visitation strategy is ensuring that parents engage their children in a structured activity during each visit. Indeed, this component truly differentiates the enhanced visitation practice in visitation sites from practice occurring in other demonstration or comparison counties. Much discussion was given to the meaning of ‘activity.’ The original visitation strategy participants agreed that activities should be driven by the family needs, as recorded in the case plan. The focus should be on planning and engaging families in developmentally appropriate activities with their children. Results of the analysis suggest that 72% of the visits included an activity which was planned and completed (Chart 4.5). For 20% of the visits there was no activity planned. Only eight percent of the visits fell into an alternate category of planned but not completed, or planned and partially completed. Thus the major difference seems to be in whether the activity has been planned or not; when activities are planned they are generally completed. (Appendix D.1 contains county‐level data for activity completion.)
2%
4%
2%
20%
72%
NA
Partially Complete
Planned, Not Completed
No Activity Planned
Planned and Complete
Chart 4.5: Activities Completed Across All Visitation Strategy Sites
While all visitation strategy sites report that activities are a component of visitation, ‘activity’ is not always well defined. The original vision had been that a PCSA staff person would work with the families by helping them to develop an activity. The interactions between the parent and child could then be
CHAPTER 4: SUPERVISED VISITATION 132 | P a g e

observed and feedback could be provided to the parent so they could develop their parenting and nurturing skills. Nonetheless, in general, when counties are asked to describe the activities their families engage in, they provide lists of items such as board games, coloring, cards, crafts, homework, dress‐up, and books that may be available to their families. Several also mention outdoor play areas. It may be that the family playing a board game together, for example, is more than what might have done prior to the visitation strategy implementation but little is said about how the activity is structured and planned to tackle family issues that are of concern.
However, several people interviewed indicated that the structured activity has been successful in some cases.
• One supervisor stated “there is always a pre‐conference and post‐meeting with the parent. At the pre‐meeting they often pick out an activity from the selection (offered).”
• A supervisor in another county explained how some unique activities have occurred: she helped a parent plan “a very successful off‐site visit to the zoo.”
• Finally, in the case of one particular mother with mental challenges, the visitation supervisor works with the mother at the end of each visit to plan an activity for the next visit.
While most activities (54%) were chosen by parents alone, 42% of visit activities were planned by the parent in collaboration with the agency staff and 4% by agency staff alone. One worker commented that parents were more likely to complete an activity when they chose it for themselves. However, the likelihood of the activity being planned and completed may in fact also depend on the person supervising the visit. Analyses suggested that of all the visits in which an activity had been planned and completed, 58% had been supervised by a visitation specialist, while 20% had been supervised by a case aide and 19% by a caseworker (Chart 4.6).
CHAPTER 4: SUPERVISED VISITATION 133 | P a g e

Interviewees were quick to point out that the completion of a structured activity may be a lofty standard for some families. As one county suggested, the full completion of the activity may not be the most important aspect of the visit so long as the parent and child are interacting in a positive manner. Further, another county suggested that activities are more likely to be completed as the case progresses, because at the beginning of the case “families have so much going on.” They feel it may take a couple of visits before the family feels comfortable enough to focus their energies on engaging in an activity.
Who plans the activity can depend very much on the county philosophy. For example, one visitation supervisor reported that she plans approximately 70% of the activities. At the other end of the spectrum, another county suggests that parents are responsible for activity planning and the supervisor only prompts when they feel it necessary. Yet another county expressed that if the parent and child pick the activity together, they are more likely to complete it than if the worker were to choose for them, hence the visit supervisor asks them what they want to do and then follows their lead.
Parents perceive themselves to have varying levels of success with the planned structured activity. This is reflected in the mixed responses gathered during parent interviews conducted by the study team:
• One young father sadly remarked “I don’t plan anything because it never works out.”
• One mother commented that the structured activities are helpful because “things go smoother, and it takes the guess work out of it.”
• Another commented “Yes. It is good because we are interacting rather than him just sitting there and me staring at him.”
The variation in these responses perhaps points to the need for visitation supervisors with a high level of expertise and skill. This sentiment is evident in other comments of parents interviewed during site visits.
• “Staff is real good at their jobs. I can come to them with questions and they give good advice.”
• “We both like to play games, so we can do that and it gives us time to talk about things. After every visit, the facilitator sits down and gives me feedback. It is helpful.”
• One mother described how the visitation supervisor gave her tips so that she could help her older child with homework while still managing to keep an eye on her two year old.
As further evidence of the value of skilled supervisors, during observations of supervised visits, study team members watched as a supervisor provided direction and feedback to parents of a young baby, explaining aspects of child development and pointing out things to the parents about their baby’s development that they may not otherwise have noticed. Indeed feedback to parents from the visitation supervisor was seen as an integral component by at least four of the visitation counties initially implementing the strategy. In county interviews, feedback was said to occur after each visit. One site actually videotapes family interactions in order that parents can watch the tape after the visit and be complimented and critiqued.
Program Development. In terms of change over time, the study team was interested in exploring whether counties have changed in the degree to which activities are planned and completed; counties
CHAPTER 4: SUPERVISED VISITATION 134 | P a g e

with less than 1,000 visits in all were not used in this analysis. For the remaining counties the first 25% of visits conducted during the strategy period were compared with the last 25% of visits. This was done individually for each county. Chart 4.7 shows that only one county has decreased in the extent to which activities are planned and completed whereas seven have improved over time. This suggests that many of the visitation counties have taken seriously the model’s focus on activities, and have worked to increase parents’ planning and use of specific activities with their children.
Summary: Section 4.3 examines case‐level information on supervised visits conducted in the visitation counties. Four key components are discussed: visit location, visit supervision, visit duration, and planned structured activities:
Visit Location: For the most part PCSAs have made an effort to make the visitation surroundings as cheery as possible although the degree of “family‐friendliness” varies. Six counties use designated visitation centers for visits, three others rely mostly on space within agency offices, and the other three utilize various visit locations.
Visit Supervision: Nearly half of all visits which occurred in visitation counties were monitored by visitation workers. Several counties rely on a variety of staff within their agencies to supervise visits.
Visit Duration: Visitation counties were able to meet the visitation model component of having visits last at least an hour. Ninety‐eight percent of visits across visitation counties lasted one hour or more.
Planned Structured Activities: Across all visitation counties, 72% of visits included an activity which was planned and completed. Though all visitation counties include activities as a component of visitation, counties vary in their definition of ‘activity’ as well as in their processes of planning them.
CHAPTER 4: SUPERVISED VISITATION 135 | P a g e
4.4 COUNTY‐LEVEL PRACTICE DIFFERENCES
Using qualitative interview data gathered from managers in 2009, this section examines county‐level practice differences, comparing the 12 visitation counties, the remaining six demonstration counties, and 17 comparison counties. In addition, findings are summarized from the visit observations conducted by the study team in 2009. Mirroring the previous section, the comparison begins with an examination of visit locations, followed by a comparative examination of supervisor types, visit frequency and duration, followed by comparisons regarding the activity component. This section finishes with an overview of the barriers counties face in making sure visits occur.
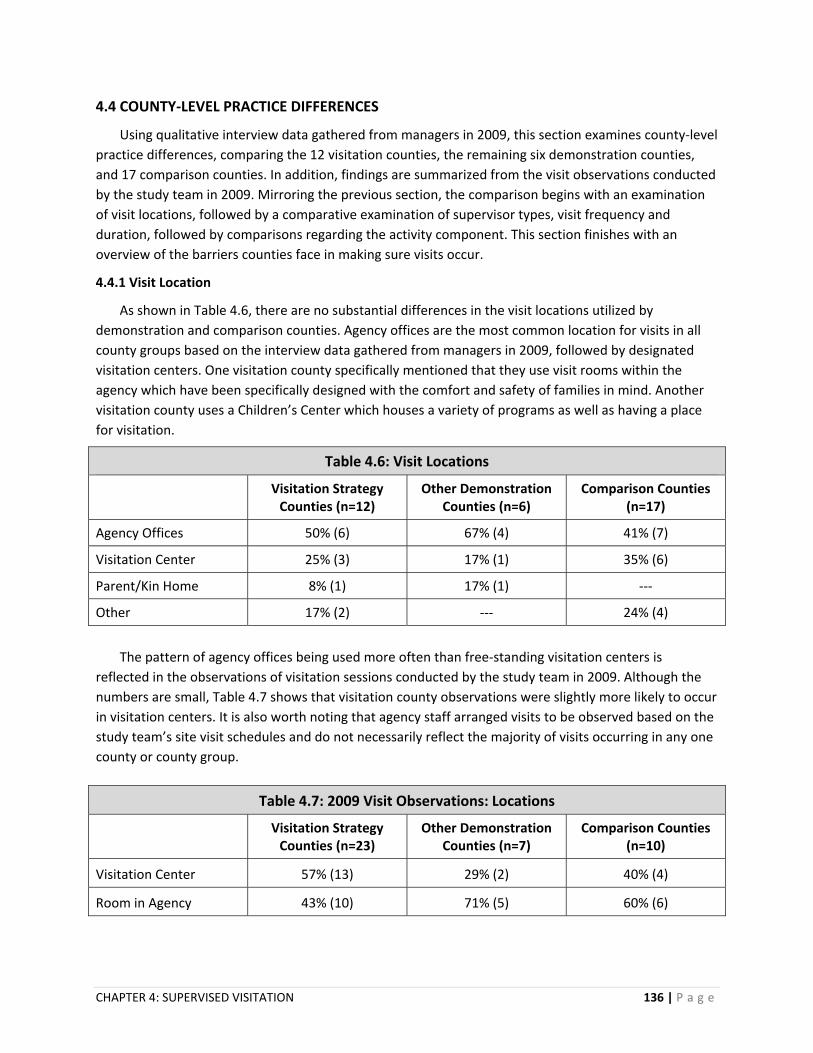
4.4.1 Visit Location
As shown in Table 4.6, there are no substantial differences in the visit locations utilized by demonstration and comparison counties. Agency offices are the most common location for visits in all county groups based on the interview data gathered from managers in 2009, followed by designated visitation centers. One visitation county specifically mentioned that they use visit rooms within the agency which have been specifically designed with the comfort and safety of families in mind. Another visitation county uses a Children’s Center which houses a variety of programs as well as having a place for visitation.
Table 4.6: Visit Locations
Visitation Strategy Counties (n=12)
Other Demonstration Counties (n=6)
Comparison Counties (n=17)
Agency Offices 50% (6) 67% (4) 41% (7)
Visitation Center 25% (3) 17% (1) 35% (6)
Parent/Kin Home 8% (1) 17% (1) ‐‐‐
Other 17% (2) ‐‐‐ 24% (4)
The pattern of agency offices being used more often than free‐standing visitation centers is
reflected in the observations of visitation sessions conducted by the study team in 2009. Although the numbers are small, Table 4.7 shows that visitation county observations were slightly more likely to occur in visitation centers. It is also worth noting that agency staff arranged visits to be observed based on the study team’s site visit schedules and do not necessarily reflect the majority of visits occurring in any one county or county group.
Table 4.7: 2009 Visit Observations: Locations
Visitation Strategy Counties (n=23)
Other Demonstration Counties (n=7)
Comparison Counties (n=10)
Visitation Center 57% (13) 29% (2) 40% (4)
Room in Agency 43% (10) 71% (5) 60% (6)
CHAPTER 4: SUPERVISED VISITATION 136 | P a g e

4.4.2 Visit Supervision
Table 4.8 illustrates the differences between county groups in terms of the categories of workers designated to supervise visits. Comparison counties are somewhat more likely to utilize caseworkers assigned to the case (53%) than are demonstration counties. Conversely, demonstration counties utilize case aides moderately more often to supervise visits than do the comparison sites. The ability of ProtectOhio counties to utilize non‐casework staff to supervise visits may be influenced by the availability of flexible funds, which has allowed more staff to be hired. This not only takes some of the burden off caseworkers but also means that families need to call just one person in order to set up a visit and coordinate transportation. Further, non‐casework staff with special expertise may be hired to ‘help families identify their own strengths and needs,’ in building parent/child relationships.
Table 4.8: Visit Supervisors
All Demonstration Counties (n=18)
Comparison Counties (n=17)
Case/Family Aide 56% (10) 18% (3)
Caseworker Assigned to Case 22% (4) 53% (9)
Visitation Worker 11% (2) 29% (5)
Other 11% (2) ‐‐‐
Supervisor types present in visitation observations fundamentally reflected this pattern; the majority
of visits observed in visitation counties were supervised by visitation workers, in other demonstration counties by case aides, and in comparison counties by caseworkers. Additionally, the study team paid close attention to supervisors’ roles during and after supervised visits. The study team particularly noted the interactions between supervisors and parents during visits, as well as whether or not feedback was provided directly after the visit. Regardless of supervisor type, visit supervisors interacted with families slightly more in visitation counties than in comparison counties. Visit supervisors were also slightly more likely to provide feedback in visitation counties than in comparison counties (Table 4.9).
Table 4.9: 2009 Visit Observations: Supervisor Participation and Feedback
Visitation Strategy Counties (n=23)
Other Demonstration Counties (n=7)
Comparison Counties (n=10)
Supervisor Directed Activity or Participated
54% (12) 57% (4) 30% (3)
Feedback Given by Supervisor
30% (7) 14% (1) 10% (1)
CHAPTER 4: SUPERVISED VISITATION 137 | P a g e

4.4.3 Visit Frequency and Duration
No substantial differences appear between visitation counties, other demonstration sites and comparison counties in the number of visits children are receiving (Table 4.10). All counties reported that they provide at least the minimum of one visit per week for children. Twenty‐five percent of strategy counties report that visits regularly occur more than once per week for children.
Table 4.10: Visit Frequency For Children
Visitation Strategy Counties (n=12)
Other Demonstration Counties (n=6)
Comparison Counties (n=16)
More Than Once Per Week 25% (3) 17% (1) 19% (3)
Once Per Week 75% (9) 83% (5) 81% (13)
PCSA staff stressed the importance of providing more frequent visitation for families with infants to
promote bonding between parent and child. Indeed, across all three county groups, infants appear to receive more visits than older children. It is interesting to note that managers from four of the visitation counties reported visits with infants occur just once weekly, a rate very similar to that of comparison counties; and in direct contrast to other demonstration counties which all report that visitation services are provided more often than once a week for families with infants (Table 4.11).
Table 4.11: Visit Frequency For Infants
Visitation Strategy Counties (n=12)
Other Demonstration Counties (n=6)
Comparison Counties (n=15)
More Than Once Per Week 67% (8) 100% (6) 80% (12)
Once Per Week 33% (4) ‐‐‐ 20% (3)
In addition to the frequency of the visits, the study team also examined the length of supervised
visits. Table 4.12 shows that, in 50% of visitation counties, visits generally last more than one hour; this is consistent with the case‐level data shown above in Table 4.5, where we see that six counties predominantly have visits that last two hours or more, and the other six have visits of at least one hour but less than two hours. In contrast, 83% of the other demonstration counties and 76% of the comparison counties state that visits generally last more than an hour. Observational data supported this finding for visitation and demonstration counties, but the comparison county observed visits tended to last just one hour. The difference between visitation counties and the other groups seems contrary to the intent of the visitation strategy, and may bear further examination.
CHAPTER 4: SUPERVISED VISITATION 138 | P a g e

Table 4.12: Visit Duration
Visitation Strategy Counties (n=12)
Other Demonstration Counties (n=6)
Comparison Counties (n=17)
More Than One Hour 50% (6) 83% (5) 76% (13)
Approximately One Hour 50% (6) 17% (1) 24% (4)
Counties noted that, while the average length of the visit may be one hour, length of visits will vary
from case to case, with visits being more than one hour for newer cases while for older cases visits are ‘at least an hour,’ and that some visits are scheduled up to three and a half hours. Another visitation county reported that it tries to have four hours of visits a week minimum, but the length of the visit will vary case by case; some families will have two 2‐hour visits, other families may have a 4‐hour visit over the weekend.
4.4.4 Structured Activities
Because having a structured activity is the core difference between standard visitation and the ProtectOhio model, it is important to examine differences by county groups in their use of this model component. Table 4.13 suggests that one area in which visitation counties tend to differ from other demonstration and comparison counties is in their focus on activities during the visit. All the visitation counties indicate having a planned activity whereas only nine of the 17 comparison counties report having this component to their visitation models.
Table 4.13: Structured Activities
Visitation Strategy Counties (n=12)
Other Demonstration Counties (n=6)
Comparison Counties (n=17)
Activity 100% (12) 33% (2) 53% (9)
No Activity ‐‐‐ 67% (4) 47% (8)
The original concept had been to use visitation as an opportunity to engage parents and children
around a common activity in order to enhance the time parent and child spend together. Counties have suggested that the activity could then be used as a ‘training opportunity for parents’, a time when parents can ‘learn to play and interact with children’, and a time when supervisors can ‘reinforce good parenting skills.’ Counties have adhered to this philosophy in a variety of ways thus, of interest, is the variation regarding the counties’ definitions of activity. For example several counties encourage parents to bring food and snacks with them to the visit. Accordingly, resources are provided for parents by these counties such that food can be warmed and families can eat together. One visitation county is notable in that they have used Title IV‐E Waiver funds to offer dinner during their once‐weekly visitation period; this is viewed as an opportune time for families to eat around a table together providing staff an opportunity to work with parenting issues around food.
CHAPTER 4: SUPERVISED VISITATION 139 | P a g e
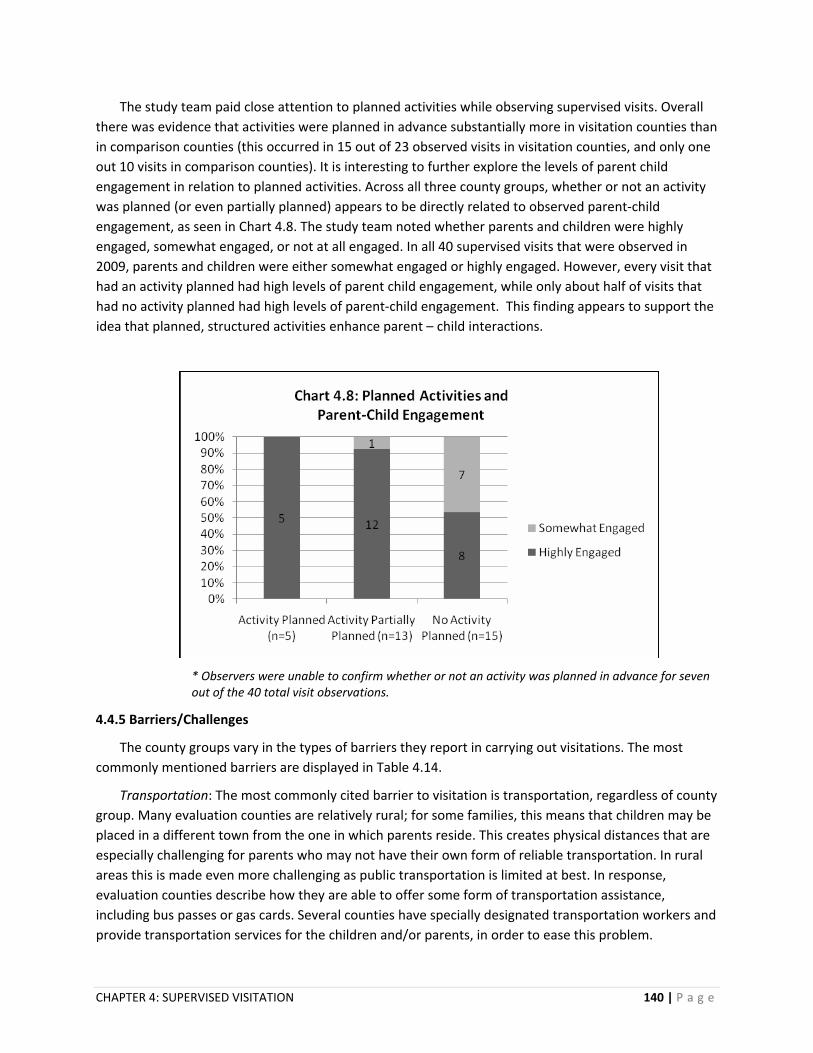
The study team paid close attention to planned activities while observing supervised visits. Overall there was evidence that activities were planned in advance substantially more in visitation counties than in comparison counties (this occurred in 15 out of 23 observed visits in visitation counties, and only one out 10 visits in comparison counties). It is interesting to further explore the levels of parent child engagement in relation to planned activities. Across all three county groups, whether or not an activity was planned (or even partially planned) appears to be directly related to observed parent‐child engagement, as seen in Chart 4.8. The study team noted whether parents and children were highly engaged, somewhat engaged, or not at all engaged. In all 40 supervised visits that were observed in 2009, parents and children were either somewhat engaged or highly engaged. However, every visit that had an activity planned had high levels of parent child engagement, while only about half of visits that had no activity planned had high levels of parent‐child engagement. This finding appears to support the idea that planned, structured activities enhance parent – child interactions.
* Observers were unable to confirm whether or not an activity was planned in advance for seven out of the 40 total visit observations.
4.4.5 Barriers/Challenges
The county groups vary in the types of barriers they report in carrying out visitations. The most commonly mentioned barriers are displayed in Table 4.14.
Transportation: The most commonly cited barrier to visitation is transportation, regardless of county group. Many evaluation counties are relatively rural; for some families, this means that children may be placed in a different town from the one in which parents reside. This creates physical distances that are especially challenging for parents who may not have their own form of reliable transportation. In rural areas this is made even more challenging as public transportation is limited at best. In response, evaluation counties describe how they are able to offer some form of transportation assistance, including bus passes or gas cards. Several counties have specially designated transportation workers and provide transportation services for the children and/or parents, in order to ease this problem.
CHAPTER 4: SUPERVISED VISITATION 140 | P a g e

Table 4.14: Barriers to Visitation
Visitation Strategy Counties (n=12)
Other Demonstration Counties (n=6)
Comparison Counties (n=17)
Transportation 58% (7) 83% (5) 76% (13)
Parent Motivation 58% (7) 50% (3) 35% (6)
Alcohol and Drug Related Challenges
25% (3) ‐‐‐ 41% (7)
Staffing 17% (2) 83% (5) 12% (2)
Parent/Child Schedules 17% (2) ‐‐‐ 6% (1)
Parent Motivation: Seven of the 12 visitation counties mentioned parent motivation as a barrier to
visitation, a slightly higher proportion than in the comparison county group. However, this may really be a reflection of visitation counties (and other demonstration counties) having an increased sensitivity due to the waiver focus on supervised visitation and the central dynamic of parent motivation. Indeed, visitation counties have attempted to ameliorate lack of motivation by concentrating on providing quicker visitation after placement, in the hope of bolstering and sustaining motivation. Nonetheless, lack of parent motivation can occur for multiple reasons. As a worker from one county stated:
“Visits are stressful, hard emotionally on parent and child, parents feel guilty, it’s traumatic for the child to come and go. When parents start to know that they are not going to reunify, they stop showing up.”
Challenges Related to Alcohol and Drug Use: Parents may be difficult to engage or re‐engage in the visitation process when they have alcohol‐ and drug‐related issues. One manager noted that parents with substance abuse problems are less likely to show up for visits than other families. One barrier to visitation can occur when parents screen positive to drugs prior to the visit. Parents may also fail to appear for a visit because they are afraid of being tested. Perhaps in response to some of these problems, one of the demonstration counties has created what it describes as a more “family‐friendly” criterion for visitation; this agency allows the parent to visit even if they have tested ‘dirty’ for drugs provided they are not obviously under the influence.
Staffing: Staffing levels are of constant concern in the current economic climate; recent funding cuts have meant significant cuts in PCSA staff; resulting in overloaded case workers and visitation staff.
Parent/Child Schedules: Staff reductions can mean less flexibility of visitation hours. This in itself may impact the parents’ ability to visit their children because parents often do not have flexible work schedules.
Summary: Section 4.4 examines county‐level practice differences between visitation counties, other demonstration counties, and comparison counties. Five aspects of supervised visitation are considered:
Visit Location: As described by managers, there are no substantial differences in the visit locations utilized by demonstration counties. Nonetheless, observational data suggests that visitation counties visits occurred more often in visitation centers. This coincides with results from case‐level data.
CHAPTER 4: SUPERVISED VISITATION 141 | P a g e
Visit Supervisors: Demonstration counties utilize case aides more often to supervise visits while comparison counties are more likely to utilize caseworkers. The ability of ProtectOhio counties to utilize non‐caseworker staff to supervise visits may be influenced by the availability of flexible funds, which has allowed more staff to be hired.
Visit Frequency and Duration: There is no substantial difference between the three county groups in the number of visits children are receiving. All counties reported that they provide at least the minimum of one visit per week for children.
Structured Activities: Having a planned, structured activity is the primary difference between standard visitation and the ProtectOhio model. Every visitation county indicates having a planned activity as a part of their visitation model, while only nine of the 17 comparison counties report having this component.
Barriers and Challenges to Visitation: Across all three county groups, transportation was reported as the most common barrier to visitation. ProtectOhio counties have reported bus passes, gas cards, and specially designated transportation workers as ways in which they are assisting families in order to address this barrier.
4.5 VISITATION OUTCOMES ANALYSIS
Counties involved in the Supervised Visitation strategy expect that by improving the quality of the visitation experience, and by specifically facilitating a supervised activity component, both parents and children will achieve positive outcomes in several areas. The following section provides the results of analyses examining the effects of the visitation strategy on key outcomes identified in the Supervised Visitation logic model (section 4.1.2).
4.5.1 Analytic Methods
Using an Intent‐to‐Treat (ITT) approach, all children eligible to receive Supervised Visitation in the visitation counties were compared with similar children in the other demonstration and comparison counties. This comparison was made regardless of whether children were formally identified as having been served through the Supervised Visitation strategy, and regardless of a county’s fidelity to the Visitation strategy. By taking this approach, one can potentially gain a better understanding of how a change in agency policy is likely to impact children and families across a system rather than the degree to which change might occur as a function of the fidelity with which the intervention has been applied to individuals. Analyses focused on differences and similarities among the three groups of counties, with some additional attention given to differences among demographic sub‐groups and corresponding strategy and/or waiver effects.
To create comparable populations of children in each of the three county groups, the study team made a series of strategic decisions. The outcomes of interest required us to have four critical types of data: 1) a complete case episode, defined by a ‘start date’ and a ‘stop date’ designating the time the child’s case was actively being served by the PCSA; 2) a set of placement episodes5 within that case 5 For the purposes of these analyses a placement episode is defined as the period of time a child is in agency custody. This is also known as a substitute care episode or substitute care spell in some literatures.
CHAPTER 4: SUPERVISED VISITATION 142 | P a g e

episode, each defined by a placement start date and a placement discharge date; 3) a set of placement spans6 within placement episodes, each defined by a placement span start date and a placement span stop date, and 4) a series of maltreatment reports, including date of initial report and date and nature of disposition of investigation (i.e. substantiated, indicated or unsubstantiated).
Using SACWIS data, the study team identified the first completed case episode for all children within the visitation, other demonstration, and comparison counties. However, due to the complications in the changeover from FACSIS to SACWIS, and the disparity in available information between the two systems, we determined that the most reliable proxy for an official ‘case open’ date would be the date when the investigation of maltreatment was completed; it is generally at that point that a PCSA decides whether or not to transfer the case to ongoing services or to close it. Specifically, we utilized the incident disposition date that immediately preceded an episode close date within our designated window of time as our proxy for a case episode open date.
Further, the study team conducted a series of data manipulations on the original SACWIS dataset in order to ensure that all placement episodes were nested, based on their open and closed dates, within appropriate case episodes. We took a similar approach in order to ensure that placement spans fell within appropriate placement episodes. Finally, we limited the set of ITT cases to those with a substantiated or indicated disposition; lacking any more conclusive way to determine whether a case actually transferred to ongoing services, we decided to focus on cases with confirmed reports, all the while recognizing that this definition brings into the analysis some cases that did not, in fact, transfer to ongoing services. Given the above decisions, the visitation outcome analysis includes 5,774 cases which represent the child’s first closed case episode, opening on July 1, 2005 or later and closing on or prior to October 30, 2009.
To address any concerns about the comparability of the resulting ITT populations, the study team examined two demographic characteristics that could potentially impact child‐level outcomes. In particular, we compared the children in the three county groups on age and racial composition. Because child level outcomes likely differ according to the child’s developmental stage, we categorized individuals by age into those who were infants (365 days or younger at placement), children (aged between one and 12 years of age at placement), and adolescents (13 years of age and older at placement). As seen in Table 4.15, the majority of children were between the ages of one and 12. Nonetheless, children within age categories were relatively evenly distributed between visitation, other demonstration and comparison counties, thus minimizing any potential bias that might occur.
6 A placement span describes the specific living arrangement the child experiences, for example a specific foster care home. A child may experience multiple placement spans during one placement episode, but may also experience more than one placement episode during a case episode.
CHAPTER 4: SUPERVISED VISITATION 143 | P a g e

Table 4.15: Age Characteristics Across County Types
Visitation Strategy Counties (n=1810)
Other Demonstration Counties (n=1387)
Comparison Counties (n=2577)
Infants 15% 19% 18%
Children 63% 57% 62%
Adolescents 22% 24% 20%
Table 4.16 provides the racial proportions across county types.7 These were very similar for visitation and comparison counties although for other demonstration counties there was a slightly larger proportion of Black children and a slightly smaller proportion of White/Other8 children. Nonetheless, since the primary comparison was between the visitation and comparison counties, this difference was not considered to be of major concern.
Table 4.16: Racial Characteristics Across County Types Visitation Strategy
Counties (n=1810) Other Demonstration Counties (n=1387)
Comparison Counties(n=2577)
Black 26% 40% 29%
White/Other 74% 60% 71%
4.5.2 Outcomes Results
The following section provides the results of the analyses of six outcomes hypothesized to be impacted by the Supervised Visitation strategy: length of stay in out‐of ‐home care during a case episode, the number of placement episodes within a case episode, case exits to permanency, length of case episode, the number of subsequent case openings following a previous case closure, and the number of moves the child experienced during out‐of‐home care. All analyses are based on the first closed case episode during the relevant time period (earliest date occurring in July 2005 and latest October 2009). Sub‐analyses investigated outcome differences by age and race. In order to conduct statistical tests, the study team used the group means to examine differences and associations; however, because the mean is sensitive to outliers, we also report the median9 where appropriate to provide an alternate view of the distribution.
4.5.2.1 Length of Stay in Out of Home Care
Counties involved in the visitation strategy expected that children would experience a shorter period of time in out‐of‐home care during the case episode, compared to those in other demonstration or comparison counties. In order to test whether this was the case, the study team summed the number
7 Those children who were identified as Black within SACWIS were placed within their own category. Children who were identified as White in SACWIS were combined with all other races to form a second race category: White/Other. 8 Four percent of the category White/Other were comprised of those children who were not categorized as White in the state data system. 9 The median is a measure of central tendency representing the middle value for an ordered set of values.
CHAPTER 4: SUPERVISED VISITATION 144 | P a g e

of days within each placement episode10 (falling within the larger case episode). The average length of time in out‐of‐home care for visitation, other demonstration, and comparison counties were shown to be 227, 215, and 220 days respectively; however, no significant differences were found to exist between county groups.
The study team also explored whether there was a difference in length of stay in out‐of‐home care for children in different age categories by county group. Initial analyses suggested that there was a difference in length of care according to age (infants = 242 days; children = 205 days; adolescents = 250 days), but this difference was similar across all county types. In other words, we found no significant differences attributable to the implementation of the visitation strategy (which would have been evident with differences between visitation and comparison counties) nor were there significant differences associated with participation in the Title IV‐E Waiver (which would have been evident by differences between all demonstration and comparison counties).
Finally, we explored strategy and/or waiver effects related to the length of stay in out‐of‐home care by race. Once again, no significant differences emerged as a function of the county type.
4.5.2.2 Number of Placement Episodes Within a Case Episode
The study team next investigated the number of placement episodes (within the first case episode) that children experienced during the second waiver. Visitation strategy counties expected that the implementation of the visitation strategy would lead to fewer new placement episodes within a case episode. However, analyses revealed no significant differences across county types (visitation = 1.08; other demonstration = 1.09; comparison = 1.08). This finding is perhaps not surprising because 92% of the cases experienced only one placement episode, 7% experienced two placement episodes and less than 1% had three or more placement episodes. Similarly, no significant differences were found when exploring potential differences by age category and race across county groups.
4.5.2.3 Permanency Types
Supervised Visitation counties expected that the implementation of the strategy would result in more reunifications. Chart 4.9 provides an overview of the permanency destinations of children at the time of the case closing. As shown, for all county groups, the majority of children were reunified, regardless of age. The next most common type of exit after a case closing was to kin. Between one and two percent of all children within each county type were adopted and between six to ten percent of children fell into the category of ‘other.’11
10 A placement episode is defined as the period of time a child is in agency custody. This is different from placement spans which describe the specific placement resources the child experiences, for example multiple different foster care homes. Thus, a child may experience multiple placement spans during one placement episode, but may also experience more than one placement episode during a case episode. 11 Relatives and guardianships were combined to form the category: kin. Institutionalization, child died, emancipation, and runaway were combined with the SACWIS category, Other.
CHAPTER 4: SUPERVISED VISITATION 145 | P a g e

Further analysis suggests a small, but nonetheless significant12 strategy effect; children in the visitation counties were more likely to exit custody to kin and less likely to be reunified than children in the comparison counties. Further analyses suggest that this strategy effect ‐ the propensity for children in visitation counties to exit custody to kin rather than to exit custody to reunification ‐ was stronger for Black13 than for White/Other14 races. Additional analyses showed that this strategy effect held within each age category ‐ infants, children and adolescents were more likely to be placed with kin than reunified when served by visitation counties.
4.5.2.4 Case Episodes15
Participation in the Supervised Visitation strategy was expected to contribute to shorter case episodes for families. As Table 4.17 indicates, case‐level analysis offers support for this hypothesis. The study team found a significant16 difference in case episode length among the three county groups. Specifically, children served in visitation counties had significantly shorter case episodes than those in comparison counties, 490 days compared to 533 days. Children in visitation counties also experienced case episodes that were an average of 19 days shorter than children in other demonstration counties; it is important to note, however, that this difference was not statistically significant. Other demonstration counties’ case episodes averaged 24 days less than case episodes in the comparison counties group, a finding that came close to significance.17 Further investigation suggested that these differences appear
12 χ2(1) = 56.05, p < .001. Cramer’s V =.14 13 χ2(1) = 55.68, p < .001. Cramer’s V =.21 14 χ2(1) = 49.54, p < .001. Cramer’s V =.13 15 See page 29 for a full description of how the case episode start date was operationalized. 16 F (2) = 11.45, p < .001. 17 p = .062
CHAPTER 4: SUPERVISED VISITATION 146 | P a g e

to be related to county size: the length of case episodes in metropolitan visitation counties were 161 days shorter than comparison metropolitan counties suggesting that metropolitan visitation counties were driving the difference in episode length.
Table 4.17: Length of First Case Episode For All Children Across Groups
Visitation Strategy Counties (n=1810)
Other Demonstration Counties (n=1387)
Comparison Counties (n=2577)
Average Length of First Case Episode *
490 (SD18 = 257) 509 (SD = 314) 533 (SD = 315)
Median Length of First Case Episode
459 451 489
Interpretation: The shorter case episodes experienced by families in visitation counties may have been a result of the additional information visitation supervisors could provide to judges when in court with the families, regarding the types of interactions families engaged in during their visits. It may also have been a result of the additional information that supervisors could provide to caseworkers about families’ interactions during the visit and the progress being made, thus perhaps helping to alleviate concerns that might otherwise have been held (as described in the qualitative analyses).
The study team conducted a second set of analyses to examine the length of case episode across county types by race (Black versus White/Other). The results suggested a significant19 interaction between race and county group: the length of case episode for Black versus White/Other races differed significantly by county group (see Chart 4.10). On average, the length of stay for Black children in comparison counties was longer than it was for their counterparts in the visitation or other demonstration county groups.
18 SD=Standard Deviation 19 F (2) = 10.92, p < .001.
CHAPTER 4: SUPERVISED VISITATION 147 | P a g e

These differences were also reflected in the median scores for each county by race as shown in table 4.18. The values follow a similar pattern to the pattern seen in Chart 4.10. This clearly merits further exploration in order to fully understand and interpret.
Table 4.18: Median Length of First Case Episode in Days For All Children Across Groups
Visitation Strategy Counties (n=1810)
Other Demonstration Counties (n=1387)
Comparison Counties
(n=2577)
Black: Median Length of First Case Episode
457 441 547
White/Other: Median Length of First Case Episode
461 456 476
The study team next focused on the length of episode by age category. The average case episode
length for infants, children and adolescents was 496, 505, and 536 days, respectively. Case episodes for infants,20 children21 and adolescents22 in visitation counties were an average of 45, 43 and 47 days less than case episodes for their similarly aged counterparts in comparison counties. These differences were significant.
20 t(651.65) = 2.17, p < .05 21 t(2693.84) = 3.98, p < .001 22 t(908.21) = 2.39, p < .05
CHAPTER 4: SUPERVISED VISITATION 148 | P a g e

Table 4.19 shows the median length of the first case episodes across county groups by age categories. The overall pattern of scores is similar to the one shown in chart 4.11; however, the median lengths of case episodes are somewhat shorter across age categories and county groups, and is likely a closer representation of the experience of most children within each category across county groups.
Table 4.19: Median Length of First Case Episode in Days by Age Group Across County Groups
Visitation Strategy Counties (n=1810)
Other Demonstration Counties (n=1387)
Comparison Counties
(n=2577)
Infants 428 454 456
Children 457 427 500
Adolescents 475 512 498
4.5.2.5 Subsequent Case Openings
In order to understand whether there were differences in the rates of subsequent case openings between visitation, other demonstration and comparison counties, the study team ran two sets of analyses. The first set investigated differences in rates of subsequent case opening within six months of the previous case closing; only those cases that closed at least six months prior to October 30, 2009 were examined for a subsequent case opening (N = 4,755). The second set of analyses explored differences in rates of subsequent case opening within 12 months of the previous case closing; this analysis included 3,707 cases that had closed at least 12 months prior to October 30, 2009.
CHAPTER 4: SUPERVISED VISITATION 149 | P a g e

For subsequent case opening within a six‐month period of time after the previous case closed, the average rate across all counties was approximately four percent. No significant differences were found between visitation, other demonstration, and comparison counties in rates of subsequent case opening, nor were any significant differences found by race, or age categories across county types. For subsequent case opening within a 12 month period of time, the average rate across all counties was between one and two percent. Once again there were no significant differences across the county groups in rates of subsequent case opening, nor were any differences found when examining race or age categories across county groups.
The above results indicate that children, regardless of race or age, were just as safe as they would have been had the intervention not occurred.
4.5.2.6 Number of Moves While in State Care
Providing children with more frequent and structured supervised visits in the 12 visitation strategy counties was expected to reduce the number of moves a child experiences. To investigate this, the study team computed the number of moves experienced by children during their first case episode by calculating the number of placement changes for each child23. But first, to eliminate emergency placements from the count of moves, we removed any initial placement span lasting 3 days or less. Table 4.20 provides an overview of the results of these analyses.
Table 4.20: Number of Moves Experienced by Children in Care Across All County Types
Visitation Counties (n=1598)
Other Demonstration Counties (n=1289)
Comparison Counties (n=2343)
Mean 1.34 (SD = 1.51) 1.36 (SD = 1.74) 1.23 (SD = 1.53)
Median 1 1 0
Minimum 0 0 0
Maximum 8 19 13
% of Children Experiencing More Than 3 Moves
4% 9% 7%
There was a significant difference in the number of moves experienced across all age groups among
the county types.24 Focused analyses suggested children in visitation and demonstration counties experienced more moves than those in comparison counties. Nonetheless, as can be seen in Table 4.18 above, children tended to experience relatively few moves while in care so this finding may have little substantive meaning.
Age and race sub‐groups did not fare differently in the three county group; no statistical differences were found.
23 To eliminate emergency placements from the count of moves, we removed any initial placement span lasting three days or less from the count of number of moves. Across the three county groups, a total of 538 children had only one span and that span was three days or less in duration. These cases were removed from the analyses. 24 F(2) = 3.55, p < .05
CHAPTER 4: SUPERVISED VISITATION 150 | P a g e

Summary: The Intent‐to‐Treat analysis of children in the three county groups – visitation, other demonstration, and comparison counties – revealed some significant differences associated with the Supervised Visitation strategy.
• The major difference appeared in the length of case episode. Those children served by visitation counties had significantly shorter case episodes that those served by comparison counties. This was particularly evident for Black children, where the average length of stay was 575 days in comparison counties versus 472 days in visitation counties.
• No differences were found in rates of subsequent case opening at six and 12 months between county types after a previous case closure indicating that the intervention had not compromised child safety.
• An unexpected finding for the visitation counties was that children served within visitation counties were less likely to be reunified upon exiting custody but, rather, were more likely to be placed with kin when compared with children in the comparison counties.
• Another unexpected finding was that children in visitation counties and demonstration counties experienced statistically speaking, more moves than those in comparison counties. Nonetheless the difference may not be meaningful in practical terms since the average number of moves across all county types was only one.
4.6 SUMMARY
This chapter has presented a wide range of information about supervised visitation practice in the 12 participating counties, and has compared visitation county activitieswhich occur in the other five demonstration counties and in tcomparison sites. Several interesting findings have emerged. First, within the 12 visitation counties, over 30,000 supervised visits have been held during the waiver, for over 2000 children. These visits more often included mothers than fathers, moreoften occurred in special visitation facilities than in PCSA officeand generally met the model guidelines for duration and frequency (at least one hour long, at least once per week). In addition, the role of visit supervisor was fairly evenly divided between dedicated visitation workers and other agency staff, with the former more likely to monitor longer visits than caseworkers did. Regardinthe centerpiece of the supervised visitation strategy, structured activities, nearly three‐quarters of visitsfeatured planned & completed activities, and visits monitored by dedicated visitation workers were even more likely to have a planned & completed activity. Finally, there is some evidence that the visitation strategy has matured in at least half of the participating counties: visits held late in the waivperiod were somewhat more likely to include planned & completed activities than were visits condearly in the waiver.
to ‘standard’ visitation activities he
s,
g
er ucted
0 10
Significant Impact
Chart 4.12: Impact on Overall Agency Practice
When examining practice differences between demonstration and comparison counties, two interesting contrasts are evident. With regard to visit supervisors, comparison counties were somewhat more likely to use caseworkers than were demonstration sites; and demonstration counties (including
CHAPTER 4: SUPERVISED VISITATION 151 | P a g e

the visitation counties) were moderately more likely to use case aides than were comparison sites. In terms of using structured activities, analysis revealed a more dramatic difference: visitation counties were substantially more likely to help parents engage in structured activities with their children, compared to the other demonstration sites and to the comparison sites.
These straightforward differences among the visitation counties and between the visitation counties and other county groups describe an emerging discipline of stronger engagement of parents to enhance child outcomes. Following is the testimony of managers and administrators in the participating counties, as they reflected on the impact of the supervised visitation strategy on their county:
“[The supervised visitation strategy] allows us to spend that cash on services and needs we normally would not be able to. It is tremendously effective. Our staff likes to know that those resources are there.”
“We have seen a good number of parents go from watching their children play, to learning how to engage with them in play and truly begin to enjoy their relationship and time together.”
“[Parents] have come to view visitation as a learning and teaching opportunity and not a time to ‘catch’ someone doing something wrong.”
All visitation counties indicated that the strategy has had a positive impact on their practice, and four counties say this impact has been significant (Chart 4.12). Overall, counties report that there has been an increase in the number of hours each week that are offered for visitation. Structured activities have been implemented in association with the support from dedicated visitation monitors. This has been instrumental in helping families to interact in more healthy ways and in easing some of the burden on caseworkers.
The outcomes analyses suggested that case episodes25 were shorter for Supervised Visitation counties, particularly for Black children. These findings may be a result of the structured activities component and the support from visitation monitors as they observed and interacted with families. Further, no differences were found in rates subsequent case openings at six and 12 months after a previous case close between Supervised Visitation counties, other demonstration or comparison counties after exiting custody, indicating that the intervention had not compromised child safety. Nonetheless, one unexpected finding was that children served within visitation counties were less likely than to be reunified but more likely to be placed with kin when compared with those in comparison counties. This finding may merit further research.
Demonstration county administrators also spoke about their plans and concerns for the future of the visitation strategy. When asked how committed they are to the continuation of the strategy if Title IV‐E flexible funding ends, two‐thirds report that the strategy itself will continue without change; nonetheless, two thirds also report that internal adjustments will need to be made in order to sustain continuation. Necessary modifications will likely include a significant loss of staff, an increase in workload, a reduction in visit frequency and some families will lose the benefits of a structured activity. One county even suggested that they might have to move to unsupervised visits earlier than they would otherwise.
25 See page 29 for a full description of how the case episode start date was operationalized.
CHAPTER 4: SUPERVISED VISITATION 152 | P a g e