chapter 4 socio-economic profile of sample households...
TRANSCRIPT

101
Chapter 4
Socio-Economic Profile of Sample Households in Punjab
4.1 About Punjab
The Punjab state is situated in the northwestern side of India. It is bounded on the
north by the state of Jammu & Kashmir, on the east by Himachal Pradesh and the Union
Territory of Chandigarh, on the south by Haryana and Rajasthan, and on the west by
Pakistan. Chandigarh is the administrative capital of Punjab. Most of Punjab is a fertile
plain. Towards the southeast of Punjab one finds semi-arid and desert landscape and in
the northeast there is a belt of undulating hills at the foot of the Himalayas. Four rivers,
the Ravi, Beas, Sutlej and Ghaggar flow across the state in a southwesterly direction.
They have numerous small and seasonal tributaries. In addition, Punjab is watered by an
extensive canal system. Agriculture is the main occupation of the people of Punjab and
forms the backbone of the state economy. Since independence, over 6 decades, the state
has earned its epithet "Granary of India" through the enterprising spirit, and untiring toil
of its people. The state is the first to translate agricultural technology into the "Green
Revolution", recording highest growth rate in food production. Punjab state, with only
1.54 per cent of geographical area of the country, produced 20 per cent of wheat, 9 per
cent of rice and 14 per cent of cotton of the total produce of these crops in the country.
Punjab is first in average per hectare yield of rice, wheat and cotton in the country
(Economics Survey of Punjab, 2006-07).
Punjab leads in the manufacture of machine tools, hand tools, printing
machinery, textiles, auto parts, electrical switchgear, fertilizers, starch and processing of
sugar and pine oil. These products have made a good position in the market across the
world. Punjab provides more than 75 per cent of the country's requirement for bicycles,
sewing machines, hosiery and sports goods. The state has over 2.04 lakh of small and
medium industries and about 600 large-scale industries (Economics Survey of Punjab,
2006-07).
According to Economic Survey of Punjab (2008-09) the State Domestic Product
(SDP) at 1999-2000 prices is Rs. 85,125.40 crore during 2005-06 which increased to Rs.
97,325.13 crore in 2007-08. The overall economy of Punjab has shown a growth rate in
102
SDP of 4.5 per cent during 2005-06 and 7.32 and 6.54 per cent during 2006-07 and
2007-08 respectively. The per capita income has been estimated at Rs. 28487 in 2005-06,
and 30,041 and 31,439 during 2006-07 and 2007-08 respectively. Since the base year
1999-2000 the structural composition of the State’s economy has witnessed progressive
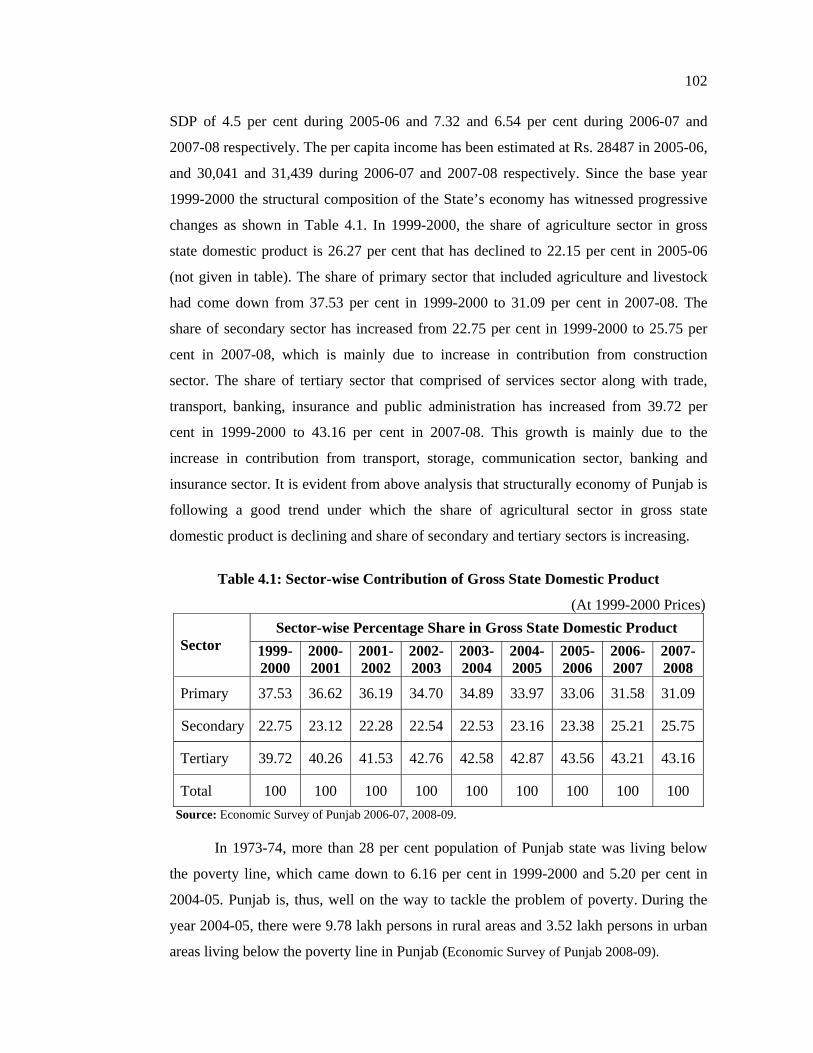
changes as shown in Table 4.1. In 1999-2000, the share of agriculture sector in gross
state domestic product is 26.27 per cent that has declined to 22.15 per cent in 2005-06
(not given in table). The share of primary sector that included agriculture and livestock
had come down from 37.53 per cent in 1999-2000 to 31.09 per cent in 2007-08. The
share of secondary sector has increased from 22.75 per cent in 1999-2000 to 25.75 per
cent in 2007-08, which is mainly due to increase in contribution from construction
sector. The share of tertiary sector that comprised of services sector along with trade,
transport, banking, insurance and public administration has increased from 39.72 per
cent in 1999-2000 to 43.16 per cent in 2007-08. This growth is mainly due to the
increase in contribution from transport, storage, communication sector, banking and
insurance sector. It is evident from above analysis that structurally economy of Punjab is
following a good trend under which the share of agricultural sector in gross state
domestic product is declining and share of secondary and tertiary sectors is increasing.
Table 4.1: Sector-wise Contribution of Gross State Domestic Product
(At 1999-2000 Prices) Sector-wise Percentage Share in Gross State Domestic Product
Sector 1999- 2000
2000-2001
2001-2002
2002-2003
2003-2004
2004-2005
2005- 2006
2006-2007
2007-2008
Primary 37.53 36.62 36.19 34.70 34.89 33.97 33.06 31.58 31.09
Secondary 22.75 23.12 22.28 22.54 22.53 23.16 23.38 25.21 25.75
Tertiary 39.72 40.26 41.53 42.76 42.58 42.87 43.56 43.21 43.16
Total 100 100 100 100 100 100 100 100 100 Source: Economic Survey of Punjab 2006-07, 2008-09.
In 1973-74, more than 28 per cent population of Punjab state was living below
the poverty line, which came down to 6.16 per cent in 1999-2000 and 5.20 per cent in
2004-05. Punjab is, thus, well on the way to tackle the problem of poverty. During the
year 2004-05, there were 9.78 lakh persons in rural areas and 3.52 lakh persons in urban
areas living below the poverty line in Punjab (Economic Survey of Punjab 2008-09).

103
To tackle the problem of poverty, different schemes of central government for
rural as well as urban areas, such as Swaranjayanti Gram Swarozgar Yojana, Sampoorna
Gramin Rozgar Yojana, National Food for Work Programme, Swarna Jayanti Shahari
Rozgar Yojana etc. are in operation in the state.
4.2 Sample Districts and Blocks of Punjab
The administrative division of the state is into 20 districts, viz. Amritsar,
Jalandhar, Kapurthala, Nawanshahr, Ludhiana, Patiala, Fatehgarh Sahib, Tarn Taran,
Sangrur, Hoshiarpur, Gurdaspur, Ropar, Mohali, Bathinda, Mansa, Faridkot, Moga,
Muktsar, Ferozepur and Barnala. Agro-climatically, Punjab may be divided into three
parts: Alluvial Plains, Hilly Sub-mountainous Strip, and Sandy Region. For the purpose
of the present study, one district is selected from each region. As a result, Jalandhar
district from alluvial plains, Hoshiarpur district from sub-mountainous region and
Bathinda district from sandy region is selected as discussed in the methodology.
This chapter is divided into three sections. In the first section, a comparative
analysis of the districts, which are selected for the purpose of the study, is taken on the
basis of secondary data collected from different sources. In the second section, socio-
economic profile of the sample households is discussed on the basis of primary data
collected from field study. Third section is related with the general characteristics of self-
help groups which are surveyed for the purpose of this study.
Section-I
4.3 Location of the Sample Districts
4.3.1 Jalandhar
Jalandhar district is located almost in the middle of Punjab. This is the intensively
irrigated plain area between the Beas and Sutlej rivers. Jalandhar was the capital of
Punjab from India's independence (1947) until Chandigarh was built in 1953 and now it
is headquarter of one of the revenue divisions of Punjab. Jalandhar is situated at 71o-31'
east longitudes and 30o-33' north latitude at a distance of 146 km from the state capital,
Chandigarh. It is at a distance of 350 km from New Delhi on Delhi-Amritsar highway.
The nearest airport is at Amritsar at a distance of 90 km. The city, which has major road
and rail connections, is a market for agricultural products. Manufactures include sports

104
goods, leather goods, wood products and textiles. It is surrounded by Ludhiana district in
east, Kapurthala in west, Hoshiarpur in north and Ferozepur in south.
Figure 4.1: Location of the Sample Districts in the Map of Punjab
4.3.2 Hoshiarpur
Hoshiarpur district is located in the northeast part of the state. It falls in the
Jalandhar revenue division and is situated in Doaba region of the state. The district is
sub-mountainous and there are stretches of river Beas in northwest. It lies between 30o-9'
and 32o-05' north latitude and 75o-32' and 76o-12' east longitudes. It shares common
boundaries with Jalandhar and Kapurthala districts in southwest, Gurdaspur district in
the northwest, and Kangra & Una districts of Himachal Pradesh state in the northeast.
4.3.3 Bathinda
Bathinda district, the heart of Malwa region, is situated in the in the Southwestern
region of the state and is far away from the Shivalik hills in the north. It forms part of
Faridkot revenue division and is situated between 29o-33' & 30o-36' north latitude and
74o-38' and 75o-46' east longitude. The district is surrounded by Sangrur and Mansa
districts in the east, Moga in the northeast, Faridkot & Muktsar districts in the northwest,

105
and Sirsa & Fatehabad districts of Haryana state in the south. The soil of the district is
mostly sandy. It is close to the Thar desert of Rajasthan and also far away from the major
rivers that run through the state. Therefore, climatically, the district remains very hot in
summer.
4.4 Administrative Divisions of the Districts
The administrative division of the state is into 20 districts, 72 tehsils and 141
blocks. Table 4.2 shows the administrative divisions of the districts selected for the
study.
The Jalandhar district consists of five tehsils/subdivisions Jalandhar-I, Jalandhar-
II, Nakodar, Phillaur and Shahkot. The district is divided into ten development blocks,
Jalandhar East, Jalandhar West, Bhogpur, Adampur, Nakodar, Shahkot, Phillaur,
Nurmahal, Lohian and Rurka Kalan.
Hoshiarpur district consists of four tehsils/subdivisions, viz. Hoshiarpur, Dasuya,
Mukerian and Garhshankar. The district is divided into ten development blocks, viz.
Hoshiarpur-I, Hoshiarpur-II, Bhunga, Tanda, Dasuya, Mukerian, Talwara, Hajipur,
Mahilpur and Garhshankar.
District Bathinda is divided into three Tehsils Bathinda, Rampura Phul and
Talwandi Sabo. These tehsils have been further divided into eight blocks, namely
Bathinda, Sangat, Nathana, Rampura, Phul, Maur, Bhagta Bhaika and Talwandi Sabo.
Table 4.2: Administrative Divisions of the Selected Districts
Name of District No. of Tehsils No. of Blocks Jalandhar 05 10 Hoshiarpur 04 10 Bathinda 03 08 Punjab 72 141
Source: Statistical Abstract of Punjab 2006. 4.5 Area and Population
Total area of Punjab is 50,362 square kilometers as per 2001 census. Punjab
occupies 1.54 per cent of the total geographical area of the country. Table 4.3 shows the
total area and population as per 2001 census. According to 2001 census population of the
state is 2.44 crores which is 2.03 crores as per 1991 census. The rate of growth of
population is 1.82 per cent per annum as per census 2001. Two third (66.1 per cent) of
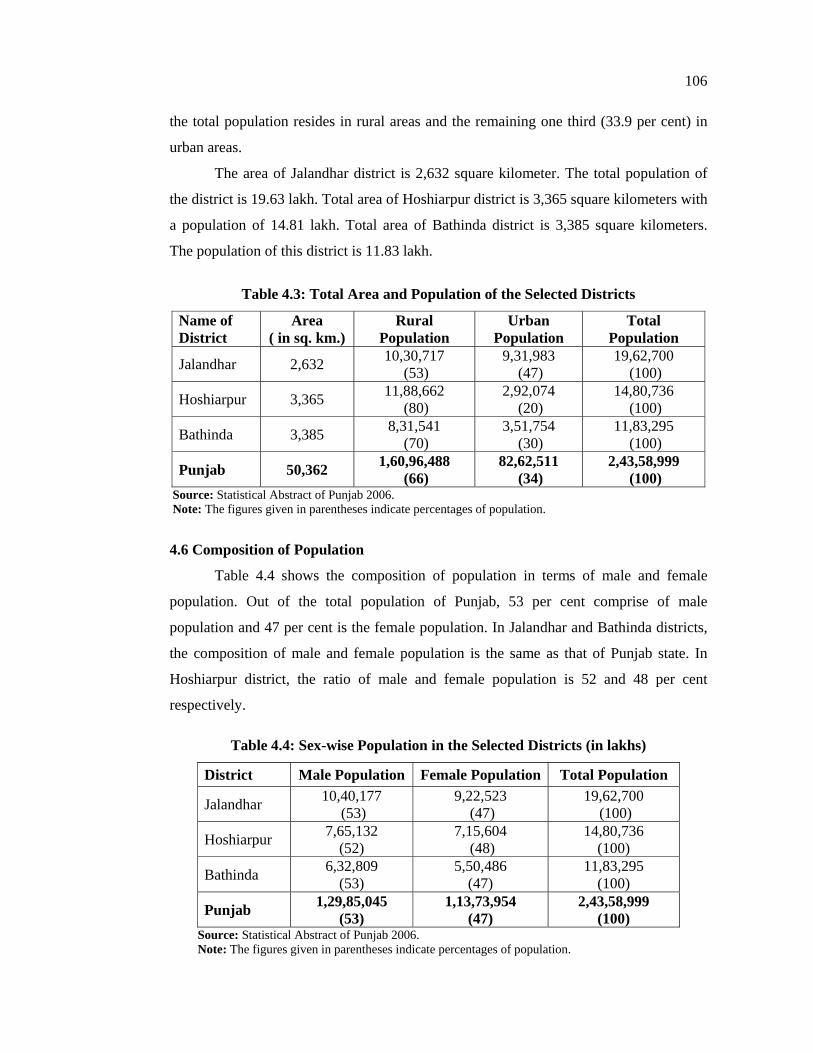
106
the total population resides in rural areas and the remaining one third (33.9 per cent) in
urban areas.
The area of Jalandhar district is 2,632 square kilometer. The total population of
the district is 19.63 lakh. Total area of Hoshiarpur district is 3,365 square kilometers with
a population of 14.81 lakh. Total area of Bathinda district is 3,385 square kilometers.
The population of this district is 11.83 lakh.
Table 4.3: Total Area and Population of the Selected Districts
Name of District
Area ( in sq. km.)
Rural Population
Urban Population
Total Population
Jalandhar 2,632 10,30,717 (53)
9,31,983 (47)
19,62,700 (100)
Hoshiarpur 3,365 11,88,662 (80)
2,92,074 (20)
14,80,736 (100)
Bathinda 3,385 8,31,541 (70)
3,51,754 (30)
11,83,295 (100)
Punjab 50,362 1,60,96,488 (66)
82,62,511 (34)
2,43,58,999 (100)
Source: Statistical Abstract of Punjab 2006. Note: The figures given in parentheses indicate percentages of population.
4.6 Composition of Population
Table 4.4 shows the composition of population in terms of male and female
population. Out of the total population of Punjab, 53 per cent comprise of male
population and 47 per cent is the female population. In Jalandhar and Bathinda districts,
the composition of male and female population is the same as that of Punjab state. In
Hoshiarpur district, the ratio of male and female population is 52 and 48 per cent
respectively.
Table 4.4: Sex-wise Population in the Selected Districts (in lakhs)
District Male Population Female Population Total Population
Jalandhar 10,40,177 (53)
9,22,523 (47)
19,62,700 (100)
Hoshiarpur 7,65,132 (52)
7,15,604 (48)
14,80,736 (100)
Bathinda 6,32,809 (53)
5,50,486 (47)
11,83,295 (100)
Punjab 1,29,85,045 (53)
1,13,73,954 (47)
2,43,58,999 (100)
Source: Statistical Abstract of Punjab 2006. Note: The figures given in parentheses indicate percentages of population.

107
4.7 Sex Ratio
Table 4.5 highlights the district-wise sex ratio for the years 1991 and 2001. In
Punjab, the sex ratio is 876 which shows that for every 1000 males the number of
females are 876. The sex ratio is low in 2001 as compared to 1991 for Punjab as well as
for Jalandhar and Bathinda districts. Sex ratio is the lowest in Bathinda district and the
highest in Hoshiarpur district.
Table 4.5: Sex Ratio in the Selected Districts
District 1991 2001 Jalandhar 897 887
Hoshiarpur 924 927
Bathinda 884 870
Punjab 882 876 Source: Statistical Abstract of Punjab 2006.
4.8 Literacy
In the statistical abstracts of Punjab, a person who can both read and write with
understanding any of the languages is defined as literate. Table 4.6 shows the sex-wise
literacy rate for urban and rural population. Out of the total population of Punjab, 69.7
per cent are literate in 2001 as compared to 58.51 per cent in 1991. The literacy rate in
urban areas is 79.1 per cent as against 64.7 per cent in rural areas. The rate for male and
female literacy is 75.2 per cent and 63.4 per cent respectively according to 2001 census.
The rate of literacy for Jalandhar, Hoshiarpur and Bathinda districts is 78.0; 81.0 and
61.2 per cent respectively. The literacy rate for rural and urban areas is 73.9 per cent and
82.6 per cent in Jalandhar district, 79.8 per cent and 85.8 per cent in Hoshiarpur district,
and 55.1 per cent and 75.4 per cent in Bathinda district.
Table 4.6: Literacy Rate for Urban and Rural Population in the Selected Districts
Literacy Rate (Percentage) Rural Population Urban Population Total Population District
Male Female Total Male Female Total Male Female TotalJalandhar 79.5 67.9 73.9 85.7 79.0 82.6 82.5 73.1 78.0
Hoshiarpur 85.7 73.7 79.8 89.4 81.8 85.8 86.5 75.3 81.0
Bathinda 62.0 47.3 55.1 81.2 68.7 75.4 67.8 53.7 61.2
Punjab 71.0 57.7 64.7 83.0 74.5 79.1 75.2 63.4 69.7 Source: Statistical Abstract of Punjab 2006. Note: Literacy has been worked out after excluding the children between 0-6 years.

108
4.9 Number of Villages and Towns
Table 4.7 shows the number of villages in the selected districts. There are 12,673
villages in Punjab out of which 12,278 are inhabited and 395 villages are un-inhabited.
In Jalandhar, Hoshiarpur and Bathinda districts there are 950; 1,417; and 284 villages
respectively. In Punjab there are 157 towns out of which 14 are situated in Jalandhar, 12
in Hoshiarpur and 9 in Bathinda district.
Table 4.7: Number of Villages and Towns in the Selected Districts
District Un-inhabited Villages
Inhabited Villages
Total Villages
No. of Towns
Jalandhar 16 934 950 14 Hoshiarpur 31 1,386 1,417 12 Bathinda 04 280 284 09 Punjab 395 12,278 12,673 157
Source: Statistical Abstract of Punjab 2006. 4.10 Occupational Status
4.10.1 Number of Workers and Non-workers
Work is defined as participation in any economically productive activity. Such
participation may be physical or mental in nature. Workers are categorized as main and
marginal workers. Main workers are those who work for the major part of a year, i.e.,
who are engaged in any economically productive activity for 183 days or more during
the year. Marginal workers are those who do not work for a major part of the year, i.e.,
those who work for less than 183 days in a year; and non-workers are those who do not
work for any time in a year. Table 4.8 carries the district-wise data showing workers and
non-workers in Punjab.
Table 4.8: Number of Workers and Non-workers in the Selected Districts (in 2001)
Main Workers Marginal Workers Non-workers Dist. Male Female Total Male Female Total Male Female Total
% age*
Jal. 5,16,905 82,419 5,99,324 41,597 35,914 77,511 4,81,675 8,04,190 12,85,865 34.49
Hsp. 3,41,093 74,030 4,15,123 46,269 51,959 98,228 3,77,770 5,89,615 9,67,385 34.67
Bti. 3,24,536 84,388 4,08,924 24,692 67,051 91,473 2,83,581 3,99,047 6,82,628 42.31
Pun. 64,26,028 14,09,704 78,35,732 5,34,185 7,57,557 12,91,742 60,24,832 92,06,693 1,52,31,525 37.47
Source: Statistical Abstract of Punjab 2006. *Percentage of main and marginal workers in total population. LEGENDS: Jal.= Jalandhar; Hsp.= Hoshiarpur; Bti.= Bathinda; Pun.= Punjab

109
The table explains that among the workers the ratio of male is much higher as
compared to the female. In Punjab, the ratio of main and marginal workers in total
population is 37.47 per cent. However, the figures for Jalandhar, Hoshiarpur and
Bathinda districts are 34.49, 34.67 and 42.31 per cent respectively.
4.10.2 Division of Workers in Different Work Categories
Table 4.9 shows the different categories of main and marginal workers, such as
cultivators, agriculture labourers, workers engaged in household industry, etc. In Punjab,
23 per cent of the workers are doing cultivation, 16 per cent are agricultural labourers, 4
per cent are engaged in household industry and 57 per cent are performing other services.
In all the three districts it is found that large numbers of workers are engaged in
agriculture and very low percentage of workers are involved in household industry.
Table 4.9: Working Population and Work Categories in the Selected Districts
Categories of Main and Marginal Workers District Cultivators Agriculture
Labourers Working in
HH IndustryOther
Services
Total Main and Marginal Workers
Jalandhar 94,511 (14)
74,501 (11)
30,161 (05)
4,77,662 (70)
6,76,835 (100)
Hoshiarpur 1,23,458 (24)
85,383 (17)
14,337 (03)
2,90,173 (56)
5,13,351 (100)
Bathinda 1,49,076 (30)
1,07,437 (21)
15,380 (03)
2,28,774 (46)
5,00,667 (100)
Punjab 20,65,067 (23)
14,89,861 (16)
3,33,770 (04)
52,38,776 (57)
91,27,474 (100)
Source: Statistical Abstract of Punjab 2006. Note: The figures given in parentheses indicate percentages.
4.11 Comparative Study of the Blocks Profile
For the purpose of the study, three blocks from each of these districts are selected
where there are a large number of credit linked SHGs. From Jalandhar district, Jalandhar
East, Jalandhar West and Nakodar blocks are selected. From Hoshiarpur district
Hoshiarpur-I, Garhshankar, Bhunga; and from Bathinda district Bathinda, Sangat and
Nathana blocks are selected. Table 4.10 presents the block-wise total number of villages,
total population, number of families, number of workers and number of literates.

110
Table 4.10: Block-wise Population, Number of Families, Number of Workers and Number of Literates in the Selected Districts
District Block No. of Villages
Total Population
Male Female No. of Families
Agriculture Workers
Non-agriculture Workers
Percentage of Workers in
Population of Block
Number & Percentage of
Literates
Jalandhar East 96 1,26,618 66,225 60,393 23,325 10,421 31,647 33 86,298 (68)
Jalandhar West 144 1,31,024 69,130 61,894 23,850 16,549 30,051 36 86,143 (66)Jalandhar
Nakodar 141 1,60,380 83,504 76,876 28,425 25,915 32,463 36 96,959 (60)
Garhshankar 146 1,60,620 83,522 77,098 31,173 24,536 36,484 38 1,05,592 (66)
Hoshiarpur-1 186 1,42,630 74,376 68,254 26,859 18,188 31,648 35 1,04,208 (73)Hoshiarpur
Bhunga 199 1,29,038 65,794 63,244 24,478 18,720 26,674 35 91,804 (71)
Nathana 32 1,29,025 72,059 56,966 22,648 20,761 35,872 44 72,668 (56)
Sangat 38 1,00,681 52,909 47,772 17,300 29,227 20,201 49 46,314 (46)Bathinda
Bathinda 57 1,68,979 89,821 79,158 29,307 40,091 33,276 43 81,481 (48)Source: Statistical Abstract of Punjab 2006. Note: The figures given in parentheses indicate percentages of literates.

111
The table shows that Jalandhar East block of Jalandhar district consists of 96
villages and the population of the block is 1,26,618 with 68 per cent literacy rate. In this
block, 33 per cent of the population is engaged in agricultural and non-agricultural
occupations.
Jalandhar West block of Jalandhar district consists of 144 villages. The
population of the block is 1,31,024 and 66 per cent of these are literate. Thirty-six per
cent of the population is engaged in agricultural and non-agricultural occupations.
Nakodar block of Jalandhar district consists of 141 villages. The population of
the block is 1,60,380 out of which 52 per cent are male. Sixty per cent of the total
population is literate. Thirty-six per cent of the population is engaged in agricultural and
non-agricultural occupations.
Garhshankar block of Hoshiarpur district consists of 146 villages. The population
of the block is 1,60,620 out of which 52 per cent are male. Sixty-six per cent of the total
population is literate. Thirty-eight per cent of the population is engaged in agricultural
and non-agricultural occupations.
Hoshiarpur-1 block of Hoshiarpur district consists of 186 villages. The
population of the block is 1,42,630 out of which 52 per cent are male. Seventy-three per
cent of the total population is literate. Thirty-five per cent of the population is engaged in
agricultural and non-agricultural occupations.
Bhunga block of Hoshiarpur district consists of 199 villages. The population of
the block is 1,29,038 out of which 51 per cent are male. Seventy-one per cent of the total
population is literate. Thirty-five per cent of the population is engaged in agricultural and
non-agricultural occupations.
Nathana block of Bathinda district consists of 32 villages. The population of the
block is 1,29,025 out of which 56 per cent are male. Literacy rate in the blocks of
Bathinda district is very low as compared to the surveyed blocks of other districts. Fifty-
six per cent of the total population is literate. Forty-four per cent of the population is
engaged in agricultural and non-agricultural occupations.
Sangat block of Bathinda district consists of 38 villages. The population of the
block is 1,00,681 out of which 53 per cent are male. Just 46 per cent of the total
population is literate. Forty-nine per cent population is engaged in agricultural and non-
agricultural occupations.

112
Bathinda block of Bathinda district consists of 57 villages. The population of the
block is 1,68,979 out of which 53 per cent are male. Just 48 per cent of the total
population is literate. Forty-three per cent of the population is engaged in agricultural
and non-agricultural occupations.
Section-II
This section provides an overview of the salient socio-economic characteristics of
the sample households, SHG participants and non-participants covered under the study.
The sample consists of 190 microfinance programme participants from 60 SHGs
operating in Jalandhar, Hoshiarpur and Bathinda districts of Punjab. Similar number of
non-participants are also surveyed from these three districts. In this way, 380
respondents are surveyed in this study.
4.12 Age of the Respondents
According to the guidelines of NABARD, an individual above 18 years can
become a member of an SHG. In the present study, most of the surveyed participants and
non-participants are in the age group of 26 to 40 years. This age group is considered as
the most productive period. Table 4.11 presents the age group of surveyed respondents.
Table 4.11: Age of the Respondents
Participants Non-participants Characteristic Category
Jal. Hsp. Bti. Pun. Jal. Hsp. Bti. Pun.
Below 25 years
06 (07)
02 (03) - 08
(04) 13
(15) 11
(15) 07
(27)31
(16)
26 to 40 years
50 (55)
43 (58)
15 (58)
108 (57)
53 (59)
38 (51)
13 (50)
104 (55)
41 to 60 years
32 (36)
28 (38)
09 (34)
69 (36)
22 (24)
22 (30)
05 (19)
49 (26)
Age-wise Distribution of Sample Units
Above 60 years
02 (02)
01 (01)
02 (08)
05 (03)
02 (02)
03 (04)
01 (04)
06 (03)
Total 90 (100)
74 (100)
26 (100)
190 (100)
90 (100)
74 (100)
26 (100)
190 (100)
Source: Field survey 2008. Note: The figures given in parentheses indicate percentages of participants and non-participants.

113
It is found that among the participants 4 per cent are in the age group below 25
years, 57 per cent in 26-40 years, 36 per cent in 41-60 years and only 3 per cent in above
60 years of age group. Among the non-participants 16 per cent are in the age group of
below 25 years, 55 per cent in 26-40 years, 26 per cent in 41-60 years and 3 per cent in
above 60 years of age group.
4.13 Marital Status of the Respondents
Most of the surveyed women respondents are found married and the proportion
of the unmarried girls and widows is very low. Table 4.12 shows that 89 per cent of the
participants and 81 per cent of the non-participants are married women. The proportion
of widows is 8 per cent for both participants and non-participants. Three per cent of the
participants and 11 per cent of the non-participants are unmarried.
Table 4.12: Marital Status of the Respondents
Participants Non-participants Characteristic Category
Jal. Hsp. Bti. Pun. Jal. Hsp. Bti. Pun.
Married 79 (88)
65 (88)
26 (100)
170 (89)
69 (77)
63 (85)
23 (88)
155 (81)
Widow 07 (08)
08 (11) - 15
(08) 09
(10) 05
(07) - 14 (8) Marital Status
Unmarried 04 (04)
01 (01) - 05
(03) 12
(13) 06
(08) 03
(12) 21
(11)
Total 90 (100)
74 (100)
26 (100)
190 (100)
90 (100)
74 (100)
26 (100)
190 (100)
Source: Field survey 2008. Note: The figures given in parentheses indicate percentages of participants and non-participants.
4.14 Caste of the Respondents
The distribution of the respondents by social group shows that majority of the
participants and non-participants belong to scheduled castes. Table 4.13 shows that 65
per cent of the participants and 78 per cent of the non-participants belong to scheduled
castes. Eight per cent of both participants and non-participants belong to backward class
and 27 per cent of the participants and 14 per cent of the non-participants are from
general category.

114
Table 4.13: Community Characteristics of the Respondents
Participants Non-participants Characteristic Category
Jal. Hsp. Bti. Pun. Jal. Hsp. Bti. Pun.
S.C. 66 (73)
46 (62)
11 (42)
123 (65)
79 (88)
55 (74)
14 (54)
148 (78)
B.C. 07 (08)
05 (07)
04 (16)
16 (08)
04 (04)
08 (11)
04 (15)
16 (8)
Caste-wise Distribution of Sample Units
General 17 (19)
23 (31)
11 (42)
51 (27)
07 (08)
11 (15)
08 (31)
26 (14)
Total 90 (100)
74 (100)
26 (100)
190 (100)
90 (100)
74 (100)
26 (100)
190 (100)
Source: Field survey 2008. Note: The figures given in parentheses indicate percentages of participants and non-participants.
4.15 Educational Status of the Respondents
Most of the participants and non-participants are literate. Table 4.14 shows that
73 per cent of the participants and 66 per cent of the non-participants are literate. Forty-
four per cent of the participants are studied up to middle level, 23 per cent up to matric
and 6 per cent above matric level. Among the non-participants, 38 per cent are qualified
up to middle, 21 per cent up to matric, and 7 per cent above matric level. The study also
reveals that the level of literacy is very low among the Bathinda district participants.
Sixty-one per cent of the participants and 58 per cent of the non-participants in Bathinda
district are found illiterate.
Table 4.14: Educational Status of the Respondents
Participants Non-participants Characteristic Category
Jal. Hsp. Bti. Pun. Jal. Hsp. Bti. Pun.
Illiterate 24 (27)
11 (15)
16 (61)
51 (27)
28 (31)
22 (30)
15 (58)
65 (34)
Up to Middle 34 (38)
41 (56)
07 (27)
83 (44)
34 (38)
33 (44)
05 (19)
72 (38)
Matric 27 (30)
16 (21)
01 (04)
44 (23)
19 (21)
16 (22)
05 (19)
40 (21)
Level of Education
Above Matric 05 (05)
06 (08)
02 (08)
12 (06)
09 (10)
03 (04)
01 (04)
13 (07)
Total 90 (100)
74 (100)
26 (100)
190 (100)
90 (100)
74 (100)
26 (100)
190 (100)
Source: Field survey 2008. Note: The figures given in parentheses indicate percentages of participants and non-participants.

115
4.16 Housing Status of the Respondent Households
4.16.1 Ownership of House
Table 4.15 shows the housing status of the respondents. It is found that almost all
the respondents are living in their own houses. Ninety-nine per cent of the participants
and 97 per cent non-participants live in their own houses and the remaining 1 per cent
and 3 per cent respectively occupy rented houses. None of the participants and non-
participants in Bathinda district are found living in a rented house.
Table 4.15: Ownership of House
Participants Non-participants Ownership
Jal. Hsp. Bti. Pun. Jal. Hsp. Bti. Pun.
Own House 89 (99)
73 (99)
26 (100)
188 (99)
87 (97)
72 (97)
26 (100)
185 (97)
Rented House 01 (01)
01 (01) - 02
(01) 03
(03) 02
(03) - 05 (03)
Total 90 (100)
74 (100)
26 (100)
190 (100)
90 (100)
74 (100)
26 (100)
190 (100)
Source: Field survey 2008. Note: The figures given in parentheses indicate percentages of participants and non-participants.
4.16.2 Condition of House
Table 4.16 shows that most of the respondents live in pucca houses, i.e., 56 per
cent of the participants and 46 per cent of the non-participants live in fully concrete
houses, whereas 36 per cent of the participants and 40 per cent of the non-participants
live in semi-pucca houses. Only 8 per cent of the participants and 14 per cent of the non-
participants occupy kucha houses.
Table 4.16: Condition of House
Participants Non-participants Condition of House Jal. Hsp. Bti. Pun. Jal. Hsp. Bti. Pun.
Pucca 55 (61)
38 (51)
13 (50)
106 (56)
48 (53)
28 (38)
12 (46)
88 (46)
Semi-pucca 32 (36)
26 (35)
11 (42)
69 (36)
34 (38)
33 (44)
09 (35)
76 (40)
Kucha 03 (03)
10 (14)
02 (08)
15 (08)
08 (09)
13 (18)
05 (19)
26 (14)
Total 90 (100)
74 (100)
26 (100)
190 (100)
90 (100)
74 (100)
26 (100)
190 (100)
Source: Field survey 2008. Note: The figures given in parentheses indicate percentages of participants and non-participants.

116
4.17 Amenities Available to the Respondent Households
4.17.1 Drinking Water Facility
The survey reveals that majority of the participants and non-participants have
access to hand pump for clean drinking water and the proportion is highest in Bathinda
district. Table 4.17 exhibits the sources of drinking water used by the respondents. It is
found that 40 per cent of the participants and 41 per cent of the non-participants have
hand pump facility in their houses, whereas in Bathinda district this ratio is 58 per cent
and 54 per cent for the participants and non-participants respectively. Thirty-six per cent
of the participants and 33 per cent of the non-participants get drinking water from the
public water supply tap in their street. However, 22 per cent of the participants and 25
per cent of the non-participants have the public supply of water in their houses.
However, the use of wells as the source of drinking water is very limited among the
respondents.
Table 4.17: Source of Drinking Water
Participants Non-participants Source of Drinking Water Jal. Hsp. Bti. Pun. Jal. Hsp. Bti. Pun.
Hand Pump 29 (33)
32 (43)
15 (58)
76 (40)
37 (41)
26 (35)
14 (54)
77 (41)
Well 01 (01)
02 (03) - 03
(02) - 03 (04) - 03
(01)
Public Supply 30 (33)
05 (07)
08 (31)
43 (22)
23 (26)
18 (24)
06 (23)
47 (25)
Street Tap 30 (33)
35 (47)
03 (11)
68 (36)
30 (33)
27 (37)
06 (23)
63 (33)
Total 90 (100)
74 (100)
26 (100)
190 (100)
90 (100)
74 (100)
26 (100)
190 (100)
Source: Field survey 2008. Note: The figures given in parentheses indicate percentages of participants and non-participants. 4.17.2 Cooking Fuel Used
The respondents were asked about the cooking fuel used by them. The data given
in Table 4.18 shows that majority of the participants, i.e., 46 per cent use both L.P.G. and
other traditional fuels such as wood, coal, dung-cakes etc. as compared to 34 per cent of
the non-participants. But majority of the non-participants, i.e., 49 per cent are dependent
on traditional cooking fuel only as compared to 39 per cent of the participants. The use

117
of only L.P.G. is less among both types of respondents, i.e., 15 per cent and 17 per cent
for the participants and non-participants respectively.
Table 4.18: Cooking Fuel Used
Participants Non-participants Cooking Fuel
Jal. Hsp. Bti. Pun. Jal. Hsp. Bti. Pun.
L.P.G. 17 (19)
08 (11)
03 (11)
28 (15)
11 (12)
17 (23)
04 (15)
32 (17)
Other 29 (32)
32 (43)
14 (54)
75 (39)
47 (52)
38 (51)
09 (35)
94 (49)
Both 44 (49)
34 (46)
09 (35)
87 (46)
32 (36)
19 (26)
13 (50)
64 (34)
Total 90 (100)
74 (100)
26 (100)
190 (100)
90 (100)
74 (100)
26 (100)
190 (100)
Source: Field survey 2008. Note: The figures given in parentheses indicate percentages of participants and non-participants.
4.17.3 Drainage, Toilet and Telephone Facility
The respondents were asked questions about the availability of basic facilities
like drainage, toilet and telephone available at their houses. The results are shown in
Table 4.19.
Table 4.19: Drainage, Toilet and Telephone Facility
Participants Non-participants Type of Facility
Jal. Hsp. Bti. Pun. Jal. Hsp. Bti. Pun.
Yes 90 (100)
72 (97)
20 (77)
182 (96)
87 (97)
68 (92)
15 (58)
170 (89)
Drainage No - 02
(03) 06
(23) 08
(04) 03
(03) 06
(08) 11
(42) 20
(11)
Yes 61 (68)
28 (38)
10 (38)
99 (52)
46 (51)
37 (50)
18 (69)
101 (53)
Toilet No 29
(32) 46
(62) 16
(62) 91
(48) 44
(49) 37
(50) 08
(31) 89
(47)
Yes 43 (48)
27 (36)
14 (54)
84 (44)
39 (43)
27 (36)
09 (35)
75 (39) Telephone/
Mobile No 47
(52) 47
(64) 12
(46) 106 (56)
51 (57)
47 (64)
17 (65)
115 (61)
Source: Field survey 2008. Note: The figures given in parentheses indicate percentages of participants and non-participants.

118
It is found that almost all the participants, i.e., 96 per cent have the drainage
facility at their houses as compared to 89 per cent of the non-participants. It is also found
that drainage facility is maximum in Jalandhar district and minimum in Bathinda district.
Regarding the availability of toilet facility almost half of the respondents, i.e., 52 per
cent of the participants and 53 per cent of non-participants have this facility at their
houses. Forty-eight per cent of the participants and 47 per cent of the non-participants do
not have any type of toilet pit or flush toilet at their houses. Respondents are asked
whether they have the telephone facility (either mobile or landline phone) for
communication with others. The results of the survey provide that 44 per cent of the
participants and 39 per cent of the non-participants have this facility, whereas majority of
them, i.e., 56 per cent of the participants and 61 per cent of non-participants do not have
telephone at their houses.
4.18 Demographic Features of the Respondent Households
4.18.1 Number of Family Members
The family structure of the respondent households is given in Table 4.20. The
table shows that just two per cent of the participants and non-participants have small
families with up to two children. Sixty per cent of the participant households and 58 per
cent of the non-participant households have medium size families with three to five
children. However, 38 per cent of the participants and 40 per cent of the non-participants
have more than six children in their families.
Table 4.20: Number of Family Members
Participants Non-participants No. of Family Members Jal. Hsp. Bti. Pun. Jal. Hsp. Bti. Pun.
Up to 2 02 (02)
02 (03) - 04
(02) 02
(02) 02
(03) - 04 (02)
3-5 57 (63)
45 (61)
12 (46)
114 (60)
52 (58)
42 (57)
17 (65)
111 (58)
6-10 31 (35)
27 (36)
14 (54)
72 (38)
36 (40)
30 (40)
09 (35)
75 (40)
Total 90 (100)
74 (100)
26 (100)
190 (100)
90 (100)
74 (100)
26 (100)
190 (100)
Average Size of Household 5.19 5.05 6.00 5.25 5.30 5.36 5.27 5.32
Source: Field survey 2008. Note: The figures given in parentheses indicate percentages of participants and non-participants.

119
It is also found that in Bathinda district the participants have relatively larger
family sizes as compared to the participants in Jalandhar and Hoshiarpur districts. It is
also found that on average both the participant and non-participant households have
approximately five members in their families. But the average household size is of six
members for the participants in Bathinda district.
4.18.2 Number of Earning Members
The respondents were also asked about the number of earning members in their
families. Table 4.21 shows that in two per cent of the participant households there is no
earning member in their families. Seventy-three per cent of both the participants and
non-participants have up to two earning members in their families. Twenty-two per cent
of the participants and 25 per cent of the non-participants have three to four earning
members. Just three per cent of the participants and two per cent of the non-participants
have more than four earning members in their families. It is found that on an average
both the participants and non-participant households have 2 earning members in their
families.
Table 4.21: Number of Earning Members
Participants Non-participants No. of Earning Members Jal. Hsp. Bti. Pun. Jal. Hsp. Bti. Pun.
No Earning Member
01 (01)
03 (04) - 04
(02) - - - -
1-2 69 (77)
49 (66)
20 (77)
138 (73)
62 (69)
56 (76)
20 (77)
138 (73)
3-4 17 (19)
20 (27)
05 (19)
42 (22)
25 (28)
17 (23)
06 (23)
48 (25)
5 and Above 03 (03)
02 (03)
01 (04)
06 (03)
03 (03)
01 (01) - 04
(02)
Total 90 (100)
74 (100)
26 (100)
190 (100)
90 (100)
74 (100)
26 (100)
190 (100)
Average No. of Earning Members 2.18 2.26 2.27 2.22 2.27 2.08 2.00 2.16
Source: Field survey 2008. Note: The figures given in parentheses indicate percentages of participants and non-participants. 4.18.3 Education of the Children
Table 4.22 shows the education pattern of male and female children of the
respondents. The table reveals that almost all the participant and non-participant women
are equally aware of the importance of schooling of their children.

120
Children of Participants Children of Non-participants
Jalandhar Hoshiarpur Bathinda Punjab Jalandhar Hoshiarpur Bathinda Punjab Age Group (in yrs.)
Sex Total No.
School going
Total No.
School going
Total No.
School going
Total No.
School going
Total No.
School going
Total No.
School going
Total No.
School going
Total No.
School going
M 14 07 (50) 06 3
(50) 13 05 (38) 33 15
(45) 11 05 (45) 13 2
(15) 07 01 (14) 31 08
(26) 0-5
F 10 07 (70) 09 04
(44) 01 - 20 11 (55) 16 11
(69) 18 08 (44) 03 01
(33) 37 20 (54)
M 25 25 (100) 16 15
(94) 08 08 (100) 49 48
(98) 23 22 (96) 20 20
(100) 08 08 (100) 51 50
(98) 6-10
F 15 15 (100) 14 13
(93) 04 04 (100) 33 32
(97) 18 18 (100) 18 16
(89) 09 09 (100) 45 43
(96)
M 53 41 (77) 46 40
(87) 20 14 (70) 119 95
(80) 46 37 (80) 34 27
(79) 09 06 (67) 89 70
(79) 11-17
F 37 37 (100) 30 24
(80) 10 07 (70) 77 68
(88) 35 31 (86) 28 20
(71) 11 06 (55) 74 57
(77)
M 49 08 (16) 32 18
(56) 13 03 (23) 94 29
(31) 57 07 (12) 43 05
(12) 14 01 (07) 114 13
(11) 18-25
F 46 17 (37) 33 14
(42) 11 - 90 31 (34) 42 07
(17) 39 03 (08) 15 02
(13) 96 12 (13)
Source: Field survey 2008. Note: Figures given in parentheses indicate percentages of school going children of participants and non-participants.
Table 4.22: Education Pattern of Children of Participants and Non-participants

121
Almost 100 per cent of the children of both participants and non-participants in
the age group of 6 to 10 years are attending schools. Eighty per cent of the male and 88
per cent of the female children of the participants in the age group of 11 to 17 years are
going to schools as compared to 79 per cent and 77 per cent of the male and female
children of non-participants in this age group. But a difference is found among
participants and non-participants regarding providing higher education to their children.
It is found that 31 per cent of the male and 34 per cent of the female children of the
participants in the age group of 18-25 years are getting higher education as compared to
just 11 per cent and 13 per cent of male and female children of non-participants in this
age group.
4.19 Land Holding Pattern of the Respondent Households
The study found the land ownership status of both participants and non-
participants. Table 4.23 shows that 23 per cent of the participants and 15 per cent of the
non-participants possess irrigated or non-irrigated land. Seventy-seven per cent of the
participants and 85 per cent of the non-participants are landless households.
Table 4.23: Total Value of Land Owned
Participants Non-participants Value of Land Owned Jal. Hsp. Bti. Pun. Jal. Hsp. Bti. Pun. Less than or equal to Rs. 1,00,000 - 02
(03) - 02 (01) - 01
(01) 02
(08) 03
(01)
Rs. 1,00,000 to 2,00,000 01 (01)
05 (07) - 06
(03) - 02 (03) - 02
(01)
Rs. 2,00,000 to 5,00,000 02 (02)
13 (18) - 15
(08) - 03 (04)
03 (11)
06 (03)
Rs. 5,00,000 to 10,00,000
02 (02)
04 (05)
01 (04)
07 (04) - 04
(05) 01
(04) 05
(03)
Above Rs. 10,00,000 02 (02)
04 (05)
07 (27)
13 (07)
06 (07)
05 (07)
02 (08)
13 (07)
Total No. of Households having Land
07 (07)
28 (38)
08 (31)
43 (23)
06 (07)
15 (20)
08 (31)
29 (15)
Total No. of Households not having Land
83 (93)
46 (62)
18 (69)
147 (77)
84 (93)
59 (80)
18 (69)
161 (85)
Total 90 (100)
74 (100)
26 (100)
190 (100)
90 (100)
74 (100)
26 (100)
190 (100)
Average Value of Land Owned (in Rs.) 1,40,000 3,18,243 5,38,461 2,63,947 2,97,778 2,12,838 1,80,769 2,48,684
Source: Field survey 2008. Note: The figures given in parentheses indicate percentages of participants and non-participants.

122
The table also shows the average value of landholding. A perusal of the table
reveals that average value of land owned by participant households is Rs. 2,63,947 and
average value of landholding among the non-participants is Rs. 2,48,684. The ownership
of land holding is least among the participants of Jalandhar district. The average value of
land owned is the highest for Bathinda district participants which is Rs. 5,38,461, more
than double of the average value of land holding by the participants in Punjab.
The table further reveals that just one per cent of both the participants and non-
participants own land of value less than Rs. 1,00,000. Three per cent of the participants
and one per cent of the non-participants have land of value Rs. 1,00,000 to 2,00,000.
Similarly, eight per cent of the participants and three per cent of the non-participants
have land of the value Rs. 2,00,000 to 5,00,000. The table also provides that eleven per
cent of the participants and ten per cent of the non-participants have land of value more
than Rs. 5,00,000. It is also found that in Bathinda district all the landowners possess
land of value more than Rs. 5,00,000 and majority of the landowners have land of value
Rs. 10,00,000 and above.
4.20 Possession of Consumer Durables by the Respondent Households
Both participants and non-participants were asked questions about the possession
of livestock and consumer durables. The responses from the respondents are presented in
Table 4.24. A perusal of the table reveals that approximately 93 per cent of the
participants and 81 per cent of the non-participants possess tables and chairs. Fifty-two
per cent of the participants and 40 per cent of the non-participants have almirahs. Forty-
five per cent of the participants and 32 per cent of the non-participants possess livestock,
such as cow, buffalo, goat, sheep, etc. It is found that the percentage of respondents
possessing livestock is the highest in Bathinda district. Eighty per cent of the participants
own bicycles and 32 per cent of the participants own scooters/motorcycles as compared
to 73 per cent and 29 per cent of the non-participants respectively. Almost all of the
respondents have the ceiling/table fans in their houses. Eighty-four per cent of the
participants and 82 per cent of the non-participants have pressure cookers. Eighty-two
per cent of the participants and 79 per cent of the non-participants possess televisions
and 55 per cent of the participants and 49 per cent of the non-participants own
refrigerators also.

123
Table 4.24: Asset Holding Pattern
Participants Non-participants Name of the Asset Jal. Hsp. Bti. Pun. Jal. Hsp. Bti. Pun.
Table 87 (97)
67 (91)
22 (85)
176 (93)
79 (88)
56 (76)
18 (69)
153 (81)
Chairs 87 (97)
66 (89)
21 (81)
174 (92)
77 (86)
59 (80)
17 (65)
153 (81)
Almirah 46 (51)
38 (51)
14 (54)
98 (52)
40 (44)
24 (32)
12 (46)
76 (40)
Livestock 29 (32)
37 (50)
19 (73)
85 (45)
19 (21)
24 (32)
18 (69)
61 (32)
Bicycle 70 (78)
62 (84)
20 (77)
152 (80)
65 (72)
58 (78)
16 (62)
139 (73)
Scooter/ Motorcycle
29 (32)
20 (27)
11 (42)
60 (32)
24 (27)
24 (32)
07 (27)
55 (29)
Fan 90 (100)
73 (99)
25 (96)
188 (99)
90 (100)
72 (97)
26 (100)
188 (99)
Pressure Cooker
83 (92)
62 (84)
15 (58)
160 (84)
78 (87)
59 (80)
18 (69)
155 (82)
Television 71 (79)
65 (88)
20 (77)
156 (82)
72 (80)
61 (82)
18 (69)
151 (79)
Refrigerator 56 (62)
36 (49)
13 (50)
105 (55)
47 (52)
34 (46)
12 (46)
93 (49)
Source: Field survey 2008. Note: The figures given in parentheses indicate percentages of participants and non-participants.
Section-III
This section explains the general characteristics of SHGs surveyed in this study.
These characteristics include size of group, maturity of group, amount of savings,
number and amount of bank loans received, criteria of dividing bank loans, amount of
loans received by an individual member etc.
4.21 Status of SHGs
Table 4.25 shows the status of SHGs surveyed in this study. For the purpose of
the study, 64 SHGs are surveyed. Out of these, 30 SHGs are selected from different
villages of Jalandhar district, 25 from Hoshiarpur district and 9 from Bathinda district.

124
Three SHG members were interviewed from each of the selected SHGs. In this way,
total 190 group participants are surveyed. It is found that the range of group membership
varies from 9 to 20 members but on average there are 13 members per SHG. In order to
study the impact of microfinance programme over different group durations, both the
young and mature groups are surveyed. The age of groups surveyed varies from 2 to 8
years at the time of the survey.
Table 4.25: General Characteristics of SHGs in the Study Area
Particulars Jalandhar Hoshiarpur Bathinda Punjab Total No. of Groups Surveyed 30 25 09 64
No. of Participants Surveyed 90 74 26 190
Size of SHGs 9-20 10-20 10-15 9-20
Average Number of Members in a Group 13 14 12 13
Range of Group Age (in Years) 2.0-7.5 2.0-7.5 2.5-8.0 2.0-8.0
Source: Field survey 2008. 4.22 Group Saving Fund
4.22.1 Amount of Periodic Savings
Under the microfinance programme group members are required to save regularly
at fixed intervals, generally, every month. The amount of savings is fixed with the
collective decision of all the group members. The study brings out that the members save
between Rs. 20 to Rs. 300 per month. But majority of the members (70 per cent) save Rs.
100 per month.
4.22.2 Total Amount of Group Savings
As the group matures the group savings fund also increases. Table 4.26 shows
the average amount of total savings per group. On an average, the total group savings are
Rs. 54,301; 34,083 and Rs. 30,206 in Jalandhar, Hoshiarpur and Bathinda district
respectively. The average amount of total savings is Rs. 43,129 per group. From the field
survey it is found that 84 SHGs, on attaining the group age of approximately 5 years,
have divided their pre-existing savings fund among the group members and have started
saving afresh with the collective decision of the group members. Perusal of table shows

125
that the average amount of divided savings of 84 groups is Rs. 40,636 per group. This
amount is Rs. 52,002; 39,134 and 5,562 per group for Jalandhar, Hoshiarpur and
Bathinda district respectively.
Table 4.26: Average Amount of Savings per Group
Saving Status Jalandhar Hoshiarpur Bathinda Punjab
Average Amount of Total Savings per Group 54,301 34,083 30,206 43,129
No. of Groups that have Divided their Savings 39 40 05 84
Average Amount of Divided Savings 52,002 39,134 5,562 40,636
Average Age of the Groups which Divided their Savings
4.27 5.06 5.70 4.70
Source: Field survey 2008. 4.23 Group Loans
4.23.1 Number and Amount of Group Loans
Generally, after six months of the formation of the SHG, the group gets the bank
loan of three to four times of the amount saved. The bank loan is divided among the
group members and is repaid in small instalments. The group becomes eligible for a
second loan only when the first loan is fully repaid. Table 4.27 presents the average
number and amount of loans received by the SHGs. The table shows that on an average
the SHGs received 1.63 number of group loans. This value is 1.42 in Jalandhar district,
1.86 in Hoshiarpur and 1.65 in Bathinda district. The average value of group loans
received is Rs. 1,07,163 per group, which is the highest in Jalandhar district (1,15,556)
followed by Hoshiarpur (1,09,192) and Bathinda (75,769) districts.
Table 4.27: Average Number and Amount of Group Loans
Loans Jalandhar Hoshiarpur Bathinda Punjab
Average No. of Loans 1.42 1.86 1.65 1.63
Average Value of Loans (in Rs.) 1,15,556 1,09,192 75,769 1,07,163
Source: Field survey 2008.

126
4.23.2 Sources of Group Loans
Different public and private sector banks are involved in financing the SHGs.
Table 4.28 highlights different sources from which the SHGs get loans. It is found that
all the groups surveyed in the study get loans from commercial banks and co-operative
banks; and there is no share of RRBs in financing these groups. Eighty-nine per cent of
the total SHGs surveyed get loans from commercial banks and the rest 11 per cent from
co-operative banks.
Table 4.28: Source of Group Loans
Type of Bank Jalandhar Hoshiarpur Bathinda Punjab
Commercial Banks 80 (89)
70 (95)
20 (77)
170 (89)
Regional Rural Banks - - - -
Co-operative Banks 10 (11)
04 (05)
06 (23)
20 (11)
Total 90 (100)
74 (100)
26 (100)
190 (100)
Source: Field survey 2008. Note: The figures given in parentheses indicate percentages of participants.
4.23.3 Difficulties Faced to Get Loans
During the field survey group members were asked about the type of difficulties
they faced while getting bank loans. Table 4.29 details the various difficulties faced by
the group members.
Table 4.29: Difficulties Faced in Getting Bank Loans
Source: Field survey 2008. Note: The figures given in parentheses indicate percentages of participants.
Difficulty in Getting Loans Jalandhar Hoshiarpur Bathinda Punjab
Unnecessary Visits to Banks
10 (11)
02 (03)
02 (08)
14 (07)
Large No. of Formalities
11 (12)
14 (19)
02 (08)
27 (14)
Lack of Knowledge - 07
(09) - 07 (04)
No Difficulty 69 (77)
51 (69)
22 (84)
142 (75)
Total 90 (100)
74 (100)
26 (100)
190 (100)
127
Seventy-five per cent of the members responded that their groups did not face
any difficulty while getting bank loans. However, fourteen per cent of the members
complained that they have to do a lot of paper work while getting the bank loans, and
seven per cent of the members said that they have to visit the banks many times either
due to the absence of bank officials or because of their incomplete documents. Four per
cent of the members reported that the process of getting group loans is not difficult but
they faced some problems due to their own lack of knowledge and awareness.
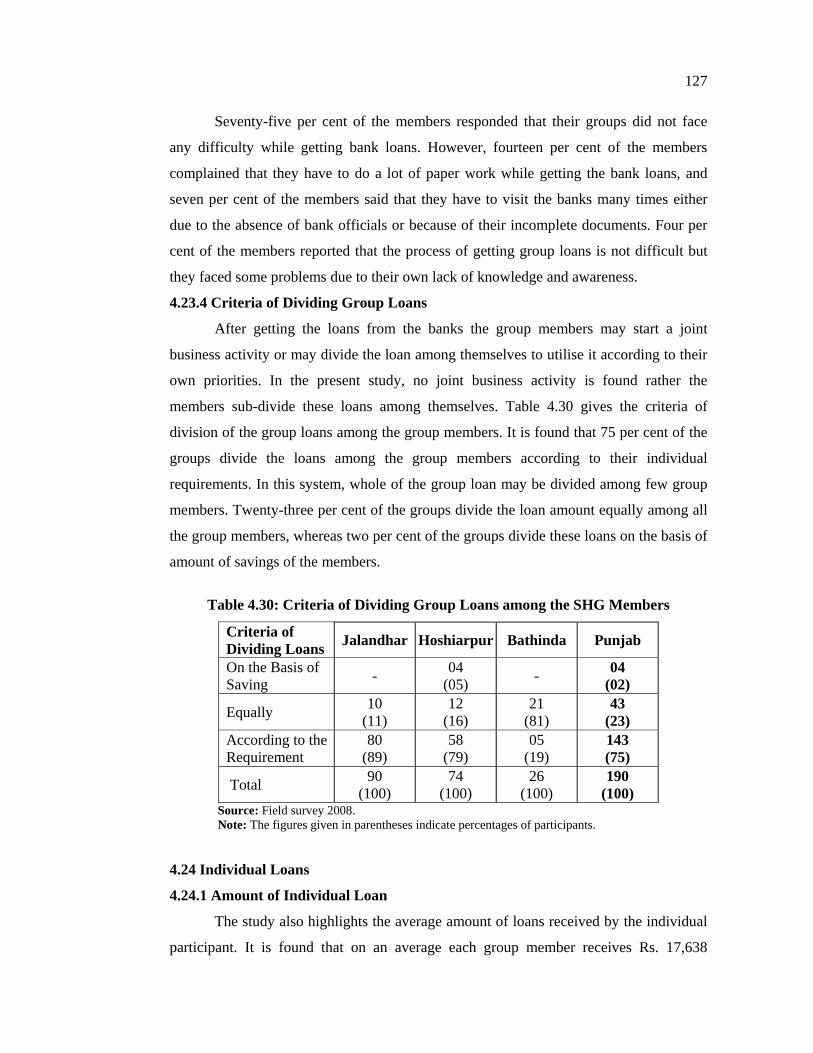
4.23.4 Criteria of Dividing Group Loans
After getting the loans from the banks the group members may start a joint
business activity or may divide the loan among themselves to utilise it according to their
own priorities. In the present study, no joint business activity is found rather the
members sub-divide these loans among themselves. Table 4.30 gives the criteria of
division of the group loans among the group members. It is found that 75 per cent of the
groups divide the loans among the group members according to their individual
requirements. In this system, whole of the group loan may be divided among few group
members. Twenty-three per cent of the groups divide the loan amount equally among all
the group members, whereas two per cent of the groups divide these loans on the basis of
amount of savings of the members.
Table 4.30: Criteria of Dividing Group Loans among the SHG Members
Criteria of Dividing Loans Jalandhar Hoshiarpur Bathinda Punjab
On the Basis of Saving - 04
(05) - 04 (02)
Equally 10 (11)
12 (16)
21 (81)
43 (23)
According to the Requirement
80 (89)
58 (79)
05 (19)
143 (75)
Total 90 (100)
74 (100)
26 (100)
190 (100)
Source: Field survey 2008. Note: The figures given in parentheses indicate percentages of participants. 4.24 Individual Loans
4.24.1 Amount of Individual Loan
The study also highlights the average amount of loans received by the individual
participant. It is found that on an average each group member receives Rs. 17,638
128
amount of group loan. This value is the highest for participants belonging to Hoshiarpur
district (Rs. 21,892) followed by Jalandhar (Rs. 17,229) and Bathinda (Rs. 6,950)
districts.
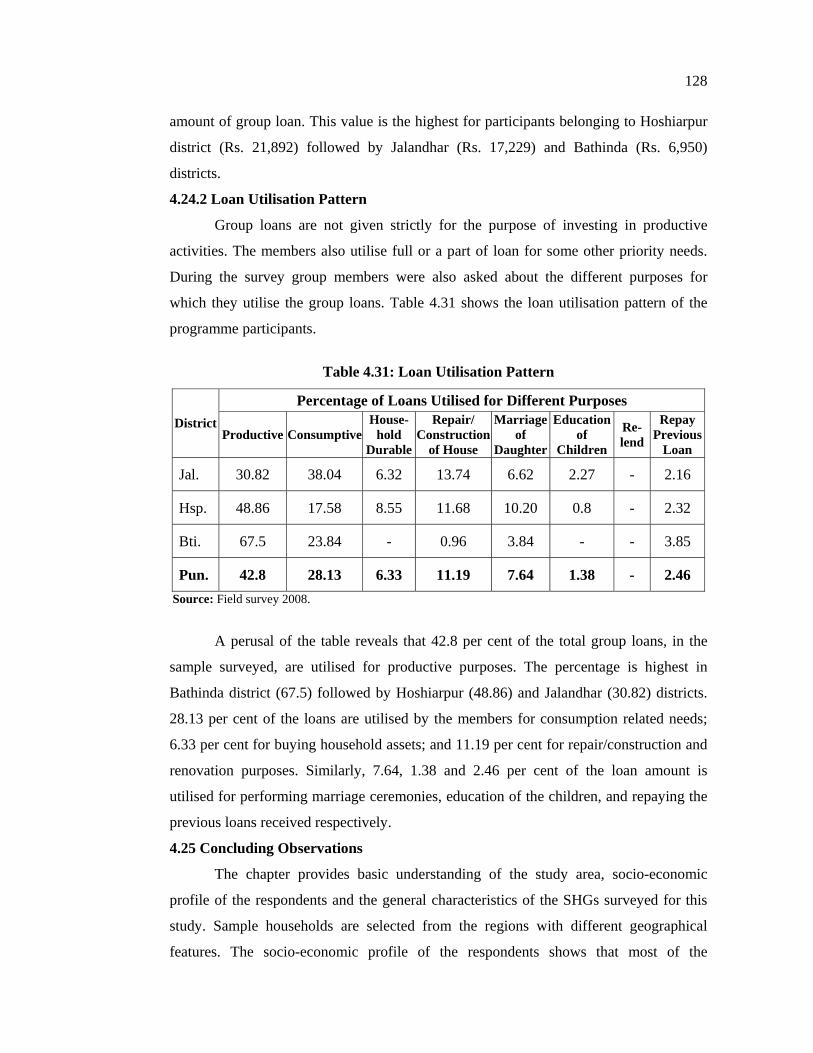
4.24.2 Loan Utilisation Pattern
Group loans are not given strictly for the purpose of investing in productive
activities. The members also utilise full or a part of loan for some other priority needs.
During the survey group members were also asked about the different purposes for
which they utilise the group loans. Table 4.31 shows the loan utilisation pattern of the
programme participants.
Table 4.31: Loan Utilisation Pattern
Percentage of Loans Utilised for Different Purposes District
Productive ConsumptiveHouse-
hold Durable
Repair/ Construction
of House
Marriageof
Daughter
Education of
Children
Re-lend
Repay Previous
Loan
Jal. 30.82 38.04 6.32 13.74 6.62 2.27 - 2.16
Hsp. 48.86 17.58 8.55 11.68 10.20 0.8 - 2.32
Bti. 67.5 23.84 - 0.96 3.84 - - 3.85
Pun. 42.8 28.13 6.33 11.19 7.64 1.38 - 2.46 Source: Field survey 2008.
A perusal of the table reveals that 42.8 per cent of the total group loans, in the
sample surveyed, are utilised for productive purposes. The percentage is highest in
Bathinda district (67.5) followed by Hoshiarpur (48.86) and Jalandhar (30.82) districts.
28.13 per cent of the loans are utilised by the members for consumption related needs;
6.33 per cent for buying household assets; and 11.19 per cent for repair/construction and
renovation purposes. Similarly, 7.64, 1.38 and 2.46 per cent of the loan amount is
utilised for performing marriage ceremonies, education of the children, and repaying the
previous loans received respectively.
4.25 Concluding Observations
The chapter provides basic understanding of the study area, socio-economic
profile of the respondents and the general characteristics of the SHGs surveyed for this
study. Sample households are selected from the regions with different geographical
features. The socio-economic profile of the respondents shows that most of the

129
respondents are SC women in the age group of 26-40 years. Majority of the respondents
are literate and are aware about the importance of education for their children. The
housing status shows that almost all the respondents have their own houses. The group
characteristics show that in order to study the impact of microfinance programme both
young and mature groups are surveyed. The groups get loans mainly from the
commercial banks and utilise these loans for individual purposes rather than starting a
joint business activity. It is also found that loans are utilised both for productive and non-
productive purposes by the group members.