chapter - 4 measuring service quality in healthcare...
TRANSCRIPT
107
CHAPTER - 4
MEASURING SERVICE QUALITY INHEALTHCARE SECTOR
Fourth chapter gives an overview of SERVQUAL model used to measure service
quality in Healthcare sector. The chapter provides the conceptual framework based on
literature review and also explains the key variables, factors and relationships among
theories or models. In this chapter the researcher discussed the concept of service and
dimensions of quality and service quality, failure gaps in service quality, importance of
service quality, measuring service quality by SERVQUAL model, limitations of
SERVQUAL model, Standardizing healthcare quality through hospital accreditations –
World and Indian scenarios in order to give a clear idea about the research area.
108
4.1. INTRODUCTION:
Liberalization, Privatization and Globalization (LPG) has brought unprecedented changes
in the economic, trade and industrial scenario. India is fast moving from a protected
economy to an open market economy and becoming integrated with the world economy.
LPG revolution has exposed various organizations including the service sector to the
challenges of competition, service quality, cost, and the competitive environment. Some
of those unable to cope with the changes may have to face the consequences of survival
of the fittest.
It is generally accepted that the service economy includes the “soft parts” of the economy
consisting of nine industry super sectors – education and health services, financial
activities, government, information, leisure and hospitality, professional and business
services, transportation and utilities, wholesale and retail trade, and other services1.
The Indian economy is the second fastest growing economy in the world with the growth
rate of the GDP at 8.20 percent in the fourth quarter of 20102. The economy of India is
the twelfth largest in the world (GDP of US$1.09 trillion in 2007). India ranks fifteenth
in the service output and it provides employment to around 23 percent of the total
employees in the nation. Service Sector of Indian Economy contributed to around 57.2
percent of India's GDP during 2009-103. “This sector plays a leading role in the
economy of India, and contributed to around 68.6 percent of the overall average growth
1 http://www.bls.gov accessed 25 February 2005; http://encyclopedia.thefreedictionary.com accessed 25Feb, 2005.2 http://www.tradingeconomics.com/india/gdp-growth.3 "Economic Survey 2009–10", Ministry of Finance, Government of India. pp. 294.
109
in GDP between 2002-03 and 2006-074”. “The most important services in the Indian
economy have been health and education. They are one of the largest and most
challenging sectors and hold a key to the country's overall progress. A strong and well-
defined healthcare sector helps to build a healthy and productive workforce as well as
stabilize population5”.
The various service sectors are construction, trade, healthcare, hospitality, transport, food
and beverages services, and communication, social and personal services, insurance,
financing, and other business services.
The service sector contributed the most to the Indian GDP (around 57.2 percent in 2009-
10). The service sector contributed only 15 percent to the India’s GDP in 1950. The
contribution increased from 43.695 percent in 1990-1991 to around 51.16 percent in
1998-1999. The contribution of the service sector has increased rapidly as Information
and communication Technology Enabled Services (ITES) from India and won the
confidence of many global corporations, wanting to lower their operational costs through
process outsourcing. India has a large pool of highly-skilled and educated workers
available at relatively lower cost. So, high quality services from India continue to win
market share across the globe from companies wanting to outsource their non-core
business processes. There is a growing demand as well for business solutions, financial
services and high-tech knowledge processes delivered remotely from South Asian
countries for which relevant expertise are often in short supply in Western nations. This
demand itself spurs the growth of many new forms of ITES. A study by the international
4 http://business.mapsofindia.com/sectors/service.html5 http://business.gov.in/Industry_services/services_sector.php
110
consulting firm McKinsey & Co. estimated that 11 percent of service jobs around the
world could be carried out remotely. In practice, however, McKinsey predicts that the
percentage of service jobs actually “offshore” will prove much more limited, reaching
only 1 percent of all service employment in the developed countries by 2008.6
Today service industries dominate our economy. The service sector accounts for more
than 70 percent of jobs and it is on the rise and expected to reach 85 percent in the near
future. Quality management and quality improvement are mandatory for the success of
the service sector and for our economy. In service industries, it is not enough if the
product meets the functional requirements of the customer, but the employee behaviour
must also meet customer’s expectations and must be of a high standard. Although the
relative importance of technical and functional service quality depends on the nature of
the interaction between employee, customer and technology, both aspects of Service
Quality are important to the customer7.
4.2. SERVICE QUALITY MATTERS:
Evidence in both the manufacturing and services industries indicates that quality is a key
determinant of market share and return on investment as well as cost reduction (Anderson
and Zeithaml 19848; Parasuraman et al. 19859). Two forms of quality are relevant to
service-providing organizations: technical quality and functional quality (Gronroos
6 Diana Farrell, Martha A. Laboissiere, and Jaeson Rosenfied (2005), “Sizing the Emerging Global LabourMarket.” The McKinsey Quarterly, Vol. 3:93-103.7 Tansik, D.A (1990), “Managing Human resources issues for High-Contact Service personnel.” In D.E.Bowen, R.B. Chase, and T.G. Cummings (eds.), Service management effectiveness. Scan Francisco:Jossey-Bass.8 Anderson, C., and C. P. Zeithaml (1984), “Stage of the Product Life Cycle, Business Strategy andBusiness performance”, Academy of Management Journal, Vol. 27: 5.24.9 Parasuraman, A., Zeithaml, V. A., and Berry, L. L. (1985), “A Conceptual Model of Service Quality andIts Implications for Future Research”, Journal of Marketing, Vol. 49 (Fall) 41–50.
111
198410). Technical quality in the healthcare setting is also referred to as quality and it is
defined chiefly on the basis of the technical accuracy of the diagnoses and procedures.
Diverse methods for gauging technical quality have been proposed and are currently in
use in healthcare organizations (Joint Commission for Accreditation of Health Care
Organizations 198711). Since this information is not usually accessible to the
overwhelming public, knowledge of the technical excellence of health care services
remains within the purview of health care professionals and administrators (Bopp
199012).
Functional quality refers to the manner in which the health care service is delivered to the
patient. Since patients are often unable to accurately assess the technical quality of a
health care service, functional quality is usually the primary determinant of patients'
quality perceptions (Donabedian 198013, 198214; Kovner and Smits 197815). There is
growing evidence to suggest that this perceived quality is the single most important
variable influencing consumers' value perceptions. These value perceptions, in turn,
10 Gronroos, C. (1984), “A Service Quality Model and its Marketing implications”, European Journal ofMarketing, Vol. 18, no.4: 36-44.11 Joint Commission for Accreditation of Healthcare Organizations, “Agenda for change (Update)”,Newsletter 1, no. 1 (Sept. 1987): 1-4.12 Bopp, K. D. (1990), “How patients evaluate the quality of ambulatory medical encounters: A marketingperspective.” Journal of Health Care Marketing, Vol. 10, no. 1: 6-15.13 Donabedian, A. (1980), “Explorations in Quality Assessment and Monitoring: The Definition of Qualityand Approaches to its Assessment”, Ann Arbor, MI: Health Administration Press, Vol. 1.14 Donabedian, A. (1982), “Explorations in Quality Assessment and Monitoring: The Criteria and Standardsof Quality”, Ann Arbor, MI: Health Administration Press, Vol. 2.15 Kovner, A. R., and H. L. Smits (1978), “Point of View: Consumer expectations of ambulatory care”,Health care management review, Vol. 3, no. 1: 69-75.
112
affect consumers' intentions to purchase products or services (Bolton and Drew 198816;
Zeithaml 198817).
SERVICE – DEFINED:
Admittedly, the distinction between goods and services is not always perfectly clear.
Despite the confusion, the following definition should provide a sound starting point in
developing an understanding of the differences between goods and services. In general,
goods can be defined as objects, devices, or things, whereas services can be defined as
deeds, efforts, or performances18. Service has been defined as “a social act that occurs
directly between the consumer and representatives of the service corporation”.
A service might be as simple as handling a complaint or as complex as a home mortgage.
Many organizations are pure service business, their products are intangible. Examples
would include education, banking, insurance, defense, municipal services, welfare
services, legal services, health services and so on. The companies have now switched
their competitive focus to the provision of unmatched & unparalleled customer services.
QUALITY – DEFINED:
When the expression “Quality” is used, we usually think in terms of an excellent product
or service that fulfills or exceeds our expectations. These expectations are based on the
intended use and the selling price. Products are determined by its quality. Hence based
16 Bolton, R. N., and J. H. Drew (1988), “A model of perceived service value”, Technical note 88-420.1,Waltham, MA: GTE Laboratories.17 Zeithaml, V. A., L. L. Berry, and A. Parasuraman (1988), “Communication and Control Processes in theDelivery of Service Quality”, Journal of Marketing, Vol. 52, no. 2: 35-48.18 Leonard L. Berry (1980), “Services Marketing Is Different,” Business magazine, pp. 24-29.
113
on observation it is considered elusive. Quality can be quantified as Q = P/E. Where Q =
quality, P = performance and E = expectations.
Quality is a complex phenomenon based on perceptions by individuals with different
perspectives on products and services. These perceptions have been built up through the
past experience of individuals and consumption in various contexts. Survey of literature
reveals that Quality has many definitions, some of them are given below:-
“Quality is conformance to requirements”19 - Philip Crosby
“Quality is fitness for purpose”20 - Dr. Juran
“Quality is a predictable degree of uniformity and dependability, at low cost and suited to
the market”21 - Dr. Edward Deming
“A wide range of factors leading to a notion of Value Addedness”22 - Muller, D. and
Funnell, P.
“Quality does not only mean the quality of product, but also of after sales service, quality
of management, the company itself and the human life”23 - Ishikawa. Kaoru
It is difficult to adequately describe the management of services without considering the
growing emphasis on quality management. The Quality has emerged as a key
competitive component of strategies of service organizations. There are three main
reasons which may account for necessary relevance of quality management24.
19 Crosby, P.B. (1982), “Quality is Free”, The New American Library Inc., New York, USA.20 Juran, J.M. and Gryna, F.M. (1980), “Quality Planning and Analysis – From Product Developmentthrough Use”, McGraw-Hill, New York, USA.21 Deming, W.E. (1982), “Quality, Productivity and Competitive position”, MIT, USA.22 Muller, D. and Funnell, P. (1992), “Exploring Learners’ Perception of Quality”, Paper presented at theAETT Conference on Quality in Education, April 6-8, University of York.23 Ishikawa, K. (1976), “Guide to Quality Control”, Asian Productivity Organization, Tokyo, Japan.24 M.K. Rampal, S.L. Gupta (2009), “Service Marketing concepts, applications and cases”, Galgotiapublishing company, pp. 301-308.
114
Service organizations need to find ways of creating differential advantage by
having better service levels than their competitors.
Increasing level of consumerism and the greater media attention on quality have
meant that service organizations have to be more responsive to quality issues.
There has been exponentially growing sophistication of consumer markets, with
the non price factors of image, product positioning and service delivery process
becoming more important.
Different approaches to quality management can be classified into two categories.
Product attributed approach
Consumer attributed approach
In Product attributed approach customers try to judge the products conformance to
standardized requirements which have been sent by reference to what company managers
think the failure point to be. This approach focuses on - performance, features,
reliability, conformance, durability, serviceability, aesthetics and perceived quality.
The consumer oriented approach may also be termed as user based approach. This
approach starts from the premise that quality lies in the eyes of the beholder. It is
therefore more appropriate to adopt a consumer oriented approach, which recognized that
the holistic process of service delivery has to be controlled by taking into consideration
the expectations and attitudes of service clients. Goods that best satisfy customer
preferences are believed to have high quality.
115
THE DIMENSIONS OF QUALITY:
As customers evaluate quality of a product or service, they consider several different
aspects or dimensions of the product or service25. Those are:
Performance: Primary product characteristics, such as the brightness of the picture.
Features: Secondary characteristics, added features, such as remote control.
Conformance: Meeting specifications or industry standards, workmanship.
Reliability: Consistency of performance over time, average time for the unit to fail.
Durability: Useful life includes repair.
Service: Resolution of problems and complaints, ease of repair.
Response: Human-to-human interface, such as the courtesy of the dealer.
Aesthetics: Sensory characteristics, such as exterior finish.
Reputation: Past performance and other intangibles, such as being ranked fist.
4.3. SERVICE QUALITY:
“Service Quality,” a concept described as elusive and abstract by researchers A.
Parasuraman, Valarie Zeithaml, and Leonard Berry in 1985. From the patient’s
perspective, service quality include perceptions of medical care, but also such seemingly
peripheral concerns as physical facilities, interactions with both medical and paramedical
staff.
Reflecting this understanding A. Parasuraman, Valarie Zeithaml, and Leonard Berry
developed a conceptual model of service quality26 that includes the following
25 David A. Garvin (1988), “Managing Quality: The Strategic and Competitive edge”, New York: FreePress.26 A Parasuraman, Valerie A. Zeithaml, and Leonard L. Berry (1990), “Delivering Quality Service:Balancing Customer Perceptions and Expectations”, New York: The Free Press, pp. 15-36.
116
dimensions: reliability, responsiveness, competence, access, courtesy, communication,
credibility, security, understanding, and tangibles. This hypothetical model of service
quality analyzes it as a construct that is similar to a viewpoint that results from a
comparison between consumer’s service expectations and insights of the performance
they have received on those dimensions.
Service quality has been defined by various researchers in diverse ways. For example,
Bitner, Booms and Mohr27 define service quality as ‘the consumer’s overall impression
of the relative inferiority / superiority of the organization and its services’. While other
researchers Cronin and Taylor28 view service quality as a form of attitude representing a
long-run overall evaluation, Parasuraman, et al. defined service quality as ‘a function of
the differences between expectation and performance along the quality dimensions’. This
has appeared to be consistent with Roest and Pieters’29 definition that service quality is a
relativistic and cognitive discrepancy between experience-based norms and performances
concerning service benefits.
Most experts agree that customer satisfaction is a short-term, transaction-specific
measure, whereas service quality is an attitude formed by long-term, overall evaluation of
performance. Without a doubt, the two concepts of customer satisfaction and service
quality are intertwined. Some believe that customer satisfaction leads to perceived
service quality, while others believe that service quality leads to customer satisfaction. In
27 Bitner, M. J., Booms, B. H., and Mohr, L. A. (1994), “Critical Service Encounters: The EmployeeViewpoint”, Journal of Marketing, Vol. 58(4), 95–106.28 Cronin, J. J., Taylor, S.A.(1994), “SERVPERF versus SERVQUAL: reconciling performance based andperceptions-minus-expectations measurement of service quality”, Journal of Mktg., Vol. 58(1),125–131.29 Roest, H., and Pieters, R. (1997), “The Nomological Net of Perceived Service Quality”, International
Journal of Service Industry Management, Vol. 8(4), 336–351.
117
addition, the relationship between customer satisfaction and service quality and the way
these two concepts relate to purchasing behaviour remains largely unexplained.30
To deliver a consistent set of satisfying experiences that can build into an evaluation of
high quality requires the entire organization to be focused on the task. The needs of the
consumer must be understood in detail, as much the operational constraints under which
the firm operates. Service providers must be focused on quality, and the system must be
designed to support that mission by being controlled correctly and delivering as it was
designed to do. Service quality offers a way of achieving success among competing
services.31
Service quality is a critical element of customer perceptions. In the case of pure services
(e.g., health care, financial services, education), service quality will be the dominant
element in customers’ evaluations. In cases in which customer service or services are
offered in combination with a physical product (e.g., IT services, auto services), service
quality may also be very critical in determining customer satisfaction.
NEED FOR SERVICE QUALITY:
As the physiological contentment of the people got satisfied; there is a demand for more
satisfaction. The phenomenal changes like economical, technological, LPG
(Liberalization, Privatization and Globalization) policies, dawn of Electronic Data
Interchange (EDI) and computer explosion are some of the factors for motivating the
dramatic growth in services. The below figure 4.1 represents some of the services which
30 Cronin, J.J., and Taylor S.A (1992), “Measuring service Quality: A re-examination and extension”,Journal of Marketing, Vol. 56(July), No. 3, pp. 55-68.31 John E.G. Bateson (1995), “Managing Services Marketing”, 3rd Edition. (Fort Worth, TX: The DrydenPress, pp.558-565.
118
has grown due to factors stated above and table gives the cause, effect details. High
intricacy of products requires experts, business internationalization, de-regulation
policies, and expert knowledge. To overcome competition there is a need for specialist
services like consultants and professionals.
By and large there is a shift in thinking. People are influenced towards leisure and
pleasure which created recreational, entertainment services, and travel related services.
Human’s desire to live long has resulted in special health care services like health and
fitness clubs, multi specialty hospitals, nursing homes etc. The list is never-ending but a
general classification of factors contributing towards the growth of services resulting in
Service Quality.
Due to increasing complexity, specialization and competitive nature of business, the
market for business services has boomed. Consequently business services like research,
industrial relation, accountancy, taxation, legal services, healthcare and many others are
in great demand.
In view of changing needs of customers, changing world, changing life style and
technological innovations, the market has become customer service oriented. Therefore,
in service delivery and service management the service quality has become an essential
need in this competitive environment.
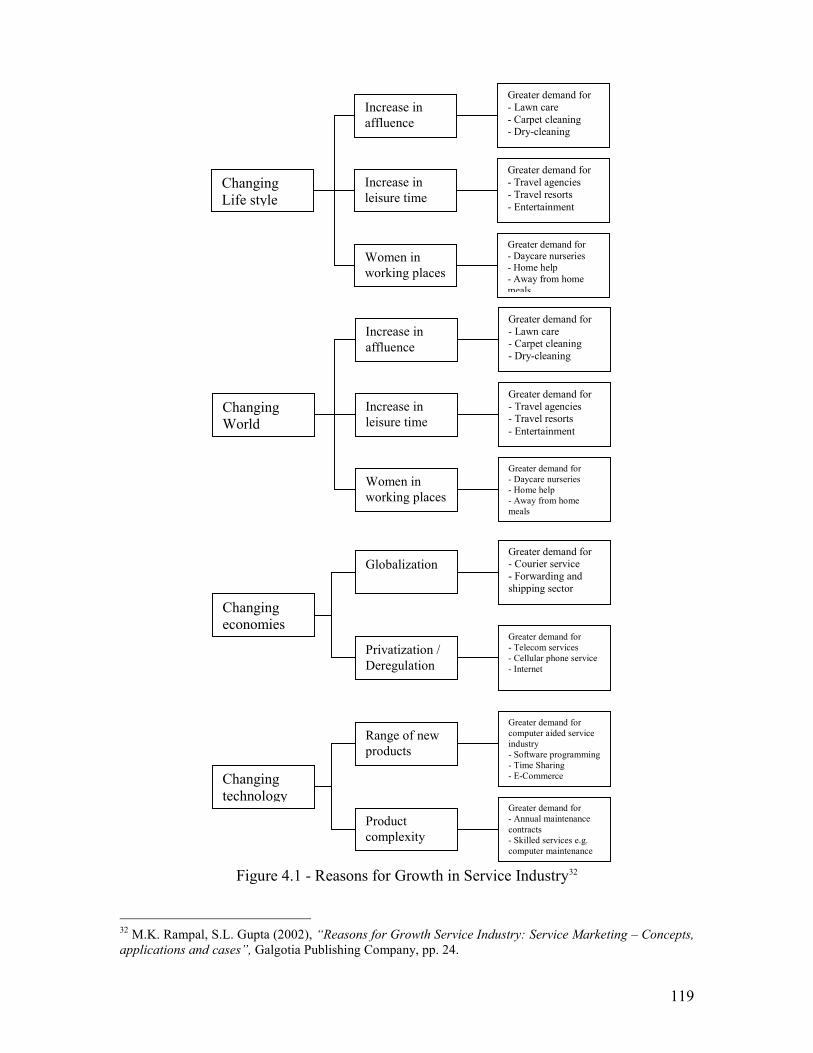
119
Figure 4.1 - Reasons for Growth in Service Industry32
32 M.K. Rampal, S.L. Gupta (2002), “Reasons for Growth Service Industry: Service Marketing – Concepts,applications and cases”, Galgotia Publishing Company, pp. 24.
Changingeconomies
Privatization /Deregulation
GlobalizationGreater demand for- Courier service- Forwarding andshipping sector
Greater demand for- Telecom services- Cellular phone service- Internet
Changingtechnology
Productcomplexity
Range of newproducts
Greater demand forcomputer aided serviceindustry- Software programming- Time Sharing- E-Commerce
Greater demand for- Annual maintenancecontracts- Skilled services e.g.computer maintenance
ChangingWorld
Increase inleisure time
Increase inaffluence
Women inworking places
Greater demand for- Lawn care- Carpet cleaning- Dry-cleaning
Greater demand for- Travel agencies- Travel resorts- Entertainment
Greater demand for- Daycare nurseries- Home help- Away from homemeals
ChangingLife style
Increase inleisure time
Increase inaffluence
Women inworking places
Greater demand for- Lawn care- Carpet cleaning- Dry-cleaning
Greater demand for- Travel agencies- Travel resorts- Entertainment
Greater demand for- Daycare nurseries- Home help- Away from homemeals
120
IMPORTANCE OF SERVICE QUALITY:
The foundation for true loyalty lies in customer satisfaction, for which service quality is a
key input. Highly satisfied or even delighted customers are more likely to become loyal
apostles of a firm33, consolidate their buying with one suppler, and spread positive word
of mouth. Dissatisfaction, in contrast, drives customers away and is a key factor in
switching behaviour. Recent research has even demonstrated that increases in customer
satisfaction lead to increases in stock prices.
The satisfaction-loyalty relationship can be divided into three main zones34: Defection,
indifference, and affection. The zone of defection occurs at low satisfaction levels.
Customers will switch unless switching costs are high or there are no viable or
convenient alternatives. Extremely dissatisfied customers provide an abundance of
negative word of mouth for the service provider. The zone of indifference is found at
intermediate satisfaction levels. Here, customers are willing to switch if they find a
better alternative. Finally, the zone of affection is located at very high satisfaction levels,
where customers may have such high attitudinal loyalty that they do not look for
alternative service providers. Customers who praise the firm in public and refer others to
the firm are described as “apostles.” Thus Customer Satisfaction and Service Quality are
prerequisites of loyalty.
33 Timothy L. Keiningham, Tiffany Perkins-Munn, and Heather Evans (2003), “The Impact of Customersatisfaction on share of wallet in a business-to-Business Environment.” Journal of Service Research, Vol.6, no. 1: 37-50.34 Florian V. Wangenheim (2005), “Post switching Negative Word of Mouth”, Journal of ServiceResearch, Vol. 8, no. 1:67-78.
121
4.4. DEVELOPMENT OF SERVICE QUALITY MODELS:
Deep insights of service quality and the best way to gauge and accomplish it are intensely
debated in service marketing. It has given way to some ‘service quality models’
particularly the ‘Perceived service quality model’35 and the ‘Gaps model’36 which have
emerged and developed in the past two decades.
GRONROOS (1984) PERCEIVED SERVICE QUALITY MODEL:
According to Gronroos35 the service quality experienced by a customer has two
dimensions; namely technical quality and functional quality. Functional quality
describes how the service is delivered and technical quality describes what the customers
received during a service delivery.
The organization’s reflection works as a filter and can thus optimistically or
pessimistically modify the customers’ view of service quality. The model was intended
to offer a conceptual framework to understand the features of service and is not a
measurement model.
He identifies a list of determinants of good service quality and argues that the list needs
to be short but comprehensive for it to be useful for managerial purposes.37 By
expanding the argument, Gronroos38 emphasizes that the following ‘seven criteria of
35 Gronroos, C. (1984), op. cit., pp. 36-44.36 Parasuraman, A., Zeithaml, V.A., and Berry, L.L (1985), op. cit., pp. 41-50.37 Gronroos, C. (2001), “Service Management and Marketing. A Customer relationship managementapproach”, 2nd Edition, West Sussex: John Wiley and Sons, pp 317-325.38 Gronroos, C. (2007), “Service Management and Marketing: Customer management in ServiceCompetition”, 3rd Edition, West Sussex: John Wiley and Sons, pp 262-293.
122
good perceived service quality’ are the determinants that need to be considered when
evaluating the service quality of any organization.
1. Professionalism and Skills.
2. Attitudes and Behaviour.
3. Accessibility and Flexibility.
4. Reliability and Trust worthiness.
5. Service Recovery.
6. Serviscape.
7. Reputation and Credibility.
The above ‘seven criteria of good service quality’ models have comparable
characteristics to the Parasuraman et al. Service Quality model. ‘Ten Determinants of
service quality’ which were recognized from a series of focused group discussions.
SERVQUAL GAPS MODEL/ANALYSIS:
Diagnose Failure Gaps in Service Quality: The Parasuram, Ziethami and Berry
Model (PZB Model)
Given the growth of services in the last decades, many researchers have recognized the
need to develop measures of service quality. One of the most often used measures is the
SERVQUAL based on extensive research in generic determinants of perceived service
quality (Parasuraman, Berry et al. 198539; Parasuraman, Berry et al. 198840; Zeithaml,
39 Parasuraman, A., Zeithaml, V. A., and Berry, L. L. (1985), op. cit., pp. 41–50.40 A Parasuraman, Valerie A. Zeithaml, and Leonard L. Berry (1988), “SERVQUAL: A multiple ItemScale for Measuring Customer Perceptions of Service Quality”, Journal of Retailing, Vol.64 (Spring)12-40.
123
Parasuraman et al. 199041; Parasuraman, Berry et al. 199142; Parasuraman, Berry et al.
199343; Parasuraman, Berry et al. 1994)44. Their model claims that the consumer
evaluates service quality experience as the outcome of the gap between expected and
perceived quality (Service quality = Perception – Expectation). The model emphasizes
on the key requirements for a service provider delivering the expected service quality.
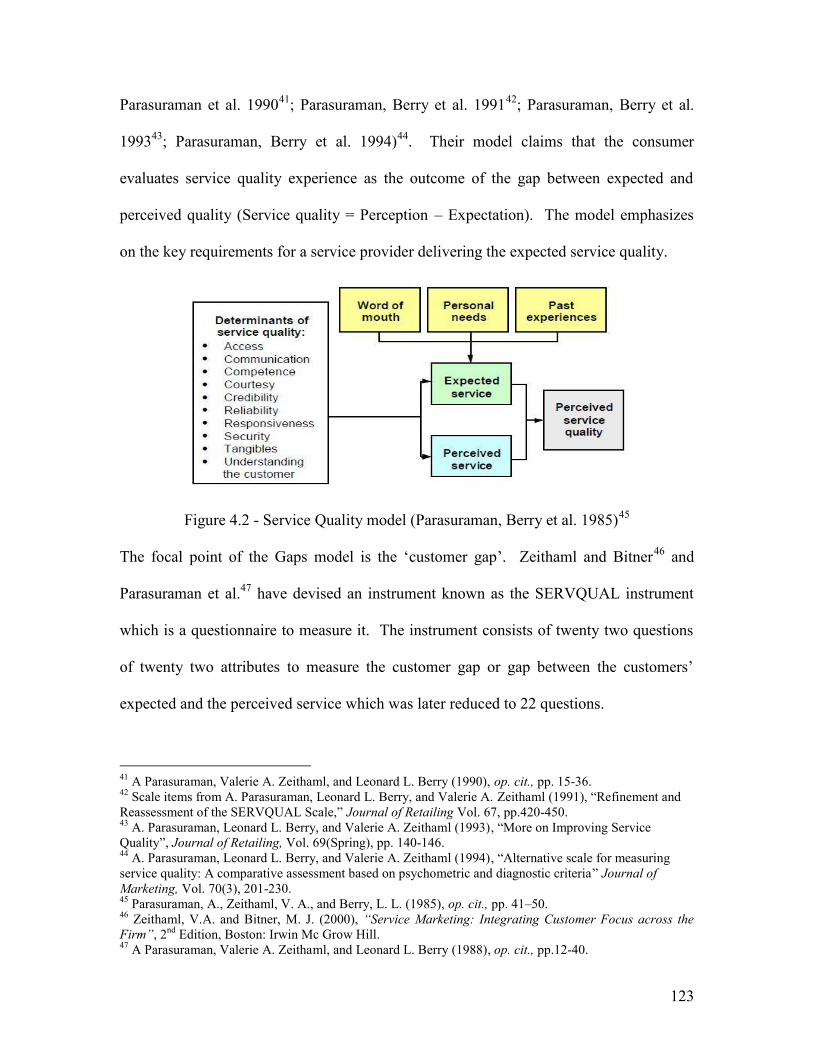
Figure 4.2 - Service Quality model (Parasuraman, Berry et al. 1985)45
The focal point of the Gaps model is the ‘customer gap’. Zeithaml and Bitner46 and
Parasuraman et al.47 have devised an instrument known as the SERVQUAL instrument
which is a questionnaire to measure it. The instrument consists of twenty two questions
of twenty two attributes to measure the customer gap or gap between the customers’
expected and the perceived service which was later reduced to 22 questions.
41 A Parasuraman, Valerie A. Zeithaml, and Leonard L. Berry (1990), op. cit., pp. 15-36.42 Scale items from A. Parasuraman, Leonard L. Berry, and Valerie A. Zeithaml (1991), “Refinement andReassessment of the SERVQUAL Scale,” Journal of Retailing Vol. 67, pp.420-450.43 A. Parasuraman, Leonard L. Berry, and Valerie A. Zeithaml (1993), “More on Improving ServiceQuality”, Journal of Retailing, Vol. 69(Spring), pp. 140-146.44 A. Parasuraman, Leonard L. Berry, and Valerie A. Zeithaml (1994), “Alternative scale for measuringservice quality: A comparative assessment based on psychometric and diagnostic criteria” Journal ofMarketing, Vol. 70(3), 201-230.45 Parasuraman, A., Zeithaml, V. A., and Berry, L. L. (1985), op. cit., pp. 41–50.46 Zeithaml, V.A. and Bitner, M. J. (2000), “Service Marketing: Integrating Customer Focus across theFirm”, 2nd Edition, Boston: Irwin Mc Grow Hill.47 A Parasuraman, Valerie A. Zeithaml, and Leonard L. Berry (1988), op. cit., pp.12-40.
124
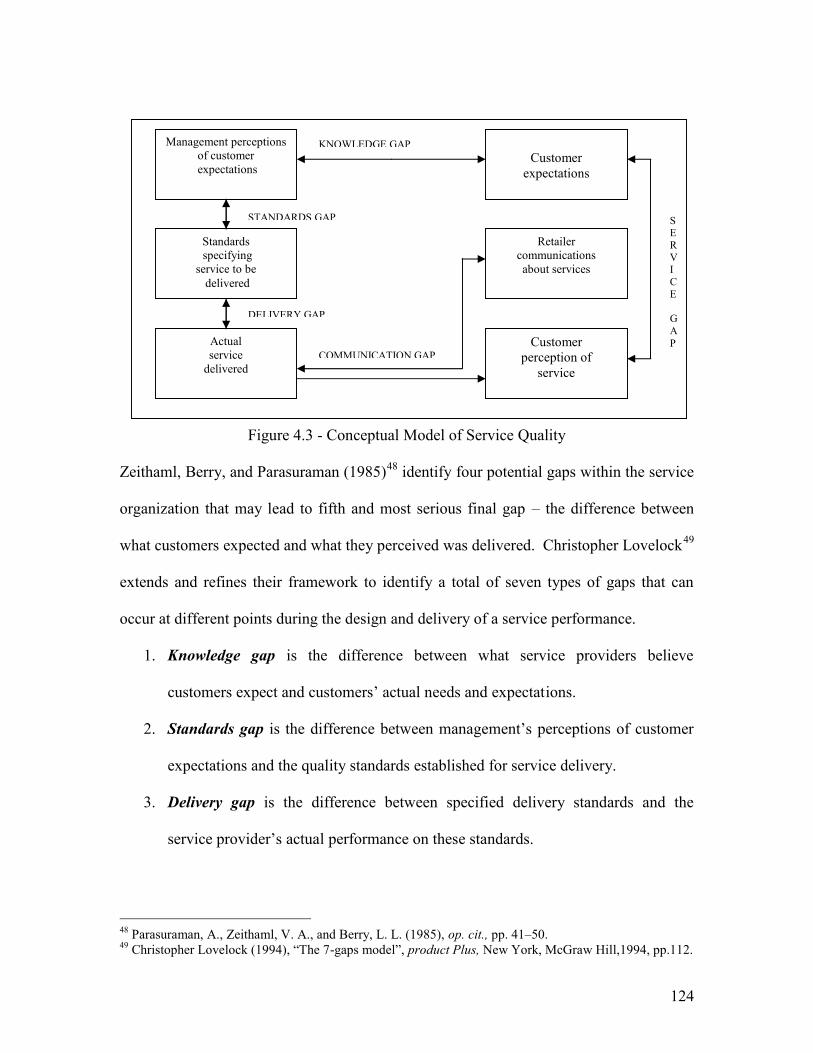
Figure 4.3 - Conceptual Model of Service Quality
Zeithaml, Berry, and Parasuraman (1985)48 identify four potential gaps within the service
organization that may lead to fifth and most serious final gap – the difference between
what customers expected and what they perceived was delivered. Christopher Lovelock49
extends and refines their framework to identify a total of seven types of gaps that can
occur at different points during the design and delivery of a service performance.
1. Knowledge gap is the difference between what service providers believe
customers expect and customers’ actual needs and expectations.
2. Standards gap is the difference between management’s perceptions of customer
expectations and the quality standards established for service delivery.
3. Delivery gap is the difference between specified delivery standards and the
service provider’s actual performance on these standards.
48 Parasuraman, A., Zeithaml, V. A., and Berry, L. L. (1985), op. cit., pp. 41–50.49 Christopher Lovelock (1994), “The 7-gaps model”, product Plus, New York, McGraw Hill,1994, pp.112.
Management perceptionsof customerexpectations
Customerexpectations
Standardsspecifying
service to bedelivered
Actualservice
delivered
Retailercommunicationsabout services
Customerperception of
service
SERVICE
GAP
STANDARDS GAP
DELIVERY GAP
COMMUNICATION GAP
KNOWLEDGE GAP
125
4. Internal communications gap is the difference between what the company’s
advertising and sales personnel think are the product’s features, performance, and
service quality level and what the company is actually able to deliver.
5. Service gap is the difference between what customers expect to receive and their
perceptions of the service that is actually delivered.
Using SERVQUAL, service quality is determined by the overall gap between what was
expected and what was delivered. This means -
Service quality is relative not absolute.
Different customers may perceive the level of service quality differently.
Quality is determined by the customer who has “all the votes”, not by the service
provider.
Service quality can be achieved by either meeting or exceeding expectations.
Or by changing expectations.
7-GAPS MODEL BY CHRISTOPHER LOVELOCK:
Christopher Lovelock identified two more gaps in SERVQUAL model developed by
Parasuraman, Zeithaml, and Berry i.e. Perceptions gap and Interpretation gap.
126
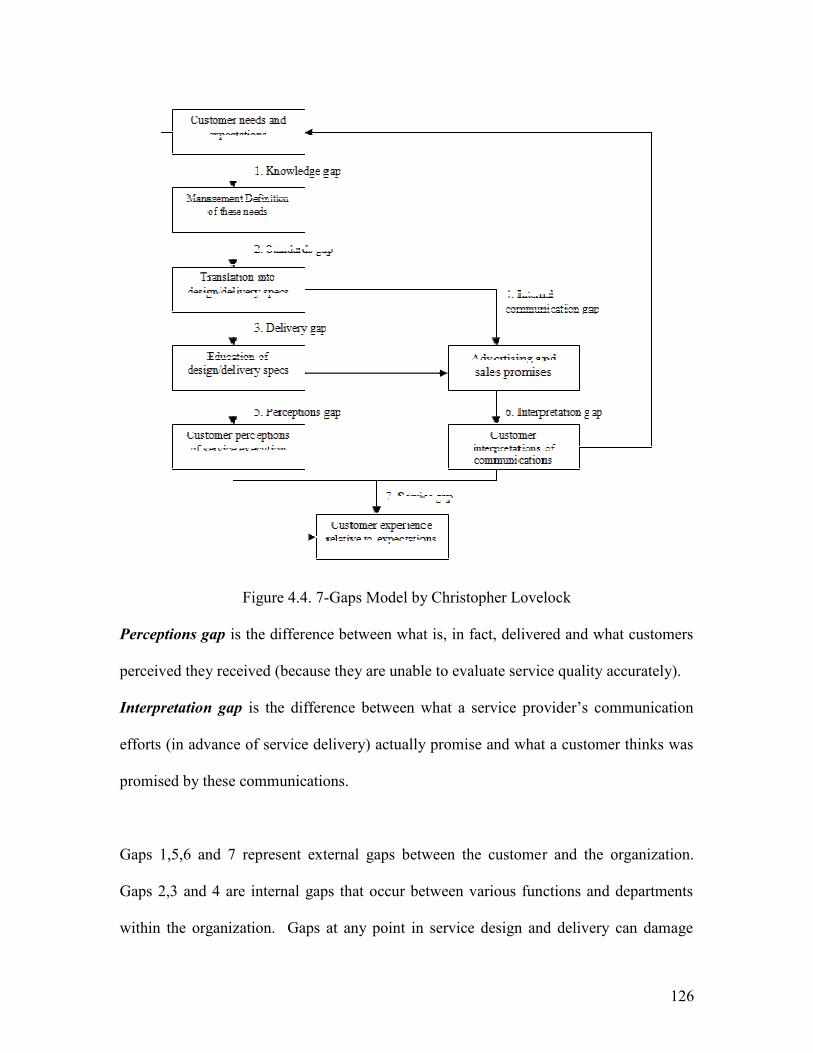
Figure 4.4. 7-Gaps Model by Christopher Lovelock
Perceptions gap is the difference between what is, in fact, delivered and what customers
perceived they received (because they are unable to evaluate service quality accurately).
Interpretation gap is the difference between what a service provider’s communication
efforts (in advance of service delivery) actually promise and what a customer thinks was
promised by these communications.
Gaps 1,5,6 and 7 represent external gaps between the customer and the organization.
Gaps 2,3 and 4 are internal gaps that occur between various functions and departments
within the organization. Gaps at any point in service design and delivery can damage
127
relationships with customers. The service gap no.7 is the most critical; hence the ultimate
goal in improving service quality is to close this gap as much as possible. However, to
achieve this, service organizations usually need to work on closing the other six gaps
depicted in above figure. Improving service quality requires identifying the specific
causes of all the gaps and then developing strategies to close them.
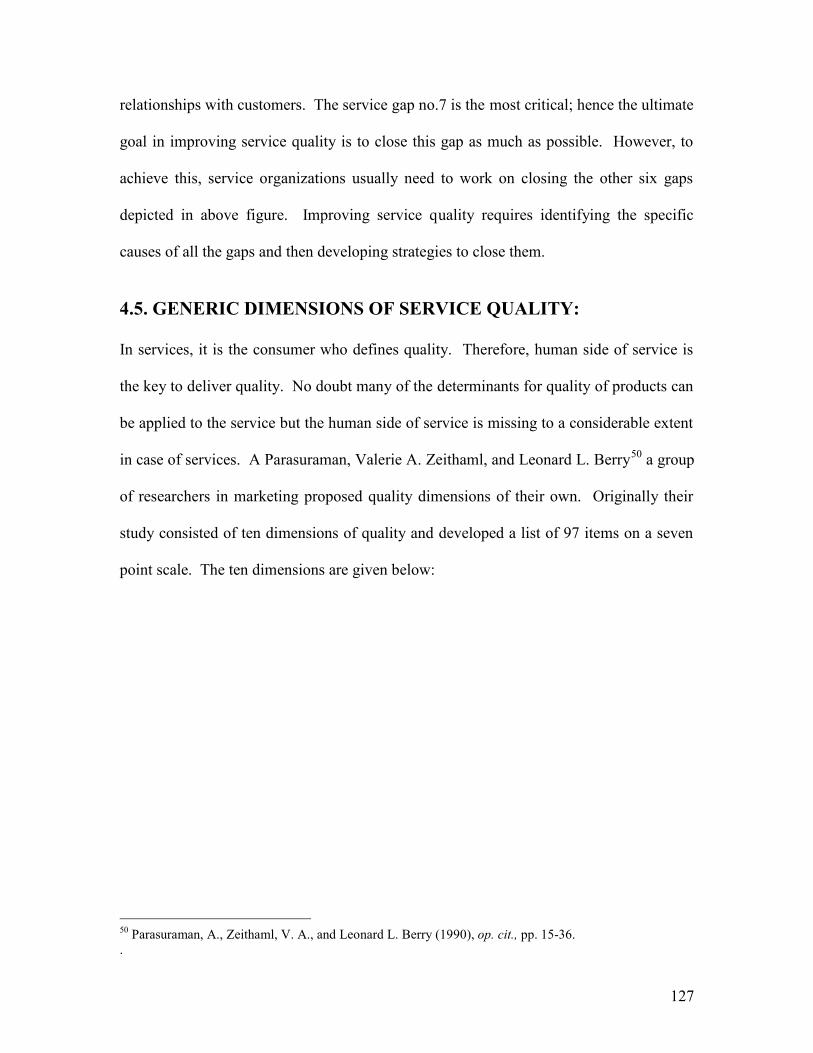
4.5. GENERIC DIMENSIONS OF SERVICE QUALITY:
In services, it is the consumer who defines quality. Therefore, human side of service is
the key to deliver quality. No doubt many of the determinants for quality of products can
be applied to the service but the human side of service is missing to a considerable extent
in case of services. A Parasuraman, Valerie A. Zeithaml, and Leonard L. Berry50 a group
of researchers in marketing proposed quality dimensions of their own. Originally their
study consisted of ten dimensions of quality and developed a list of 97 items on a seven
point scale. The ten dimensions are given below:
50 Parasuraman, A., Zeithaml, V. A., and Leonard L. Berry (1990), op. cit., pp. 15-36..
128
Ten Dimensions (Original model) Five Dimensions (Later Model)
Tangibles Tangibles
Reliability Reliability
Responsiveness Responsiveness
CompetenceCourtesyCredibilitySecurity
Assurance
AccessCommunicationUnderstanding thecustomer
Empathy
Figure 4.5. Dimensions of Service Quality
129
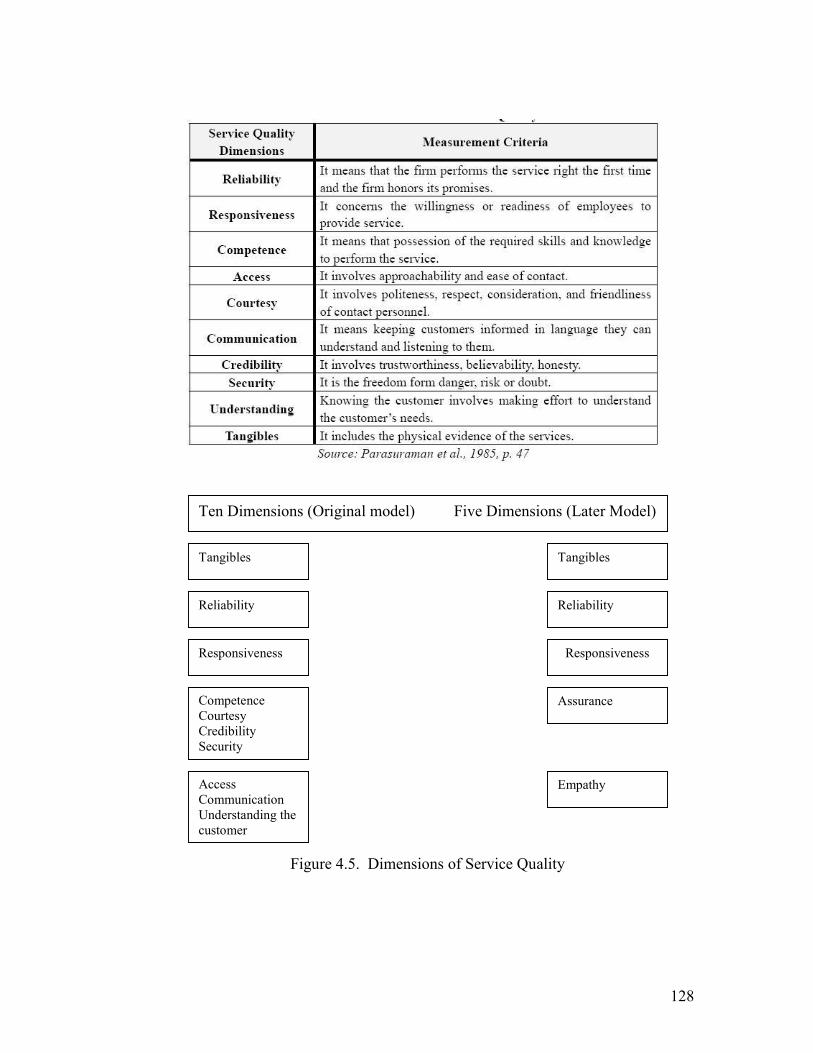
4.6. SERVQUAL:
After testing and subsequent refinement (i.e. factor analysis) the list was pooled into a 22
item questionnaire covering 5 dimensions called SERVQUAL51. SERVQUAL is a
methodology that helps to identify customer perceptions of service quality, which defines
five dimensions of service quality.
51 A Parasuraman, Valerie A. Zeithaml, and Leonard L. Berry (1988), op. cit., pp. 12-40.
Figure 4.6. 22-Item Service Quality
Source: Parasuraman etal., (cited in Kotler and Keller, “Marketing Management”, 12e (Prentice-Hall, 2006) pp.414.
130
Reliability: Doing what they say they will do, on time and to specification.
Assurance: Possession of the required skills to perform the service and also
convey trust, confidence and security.
Tangibles: Include the physical appearance of people and facilities.
Empathy: Showing an understanding of customer needs and provide and
individualized service.
Responsiveness: Willingness to help and respond to individual requirements.
These dimensions represent how consumers organize information about service quality in
their minds52. Research suggests that cultural differences will also affect the relative
importance placed on the five dimensions.
4.7. MEASURING SERVICE QUALITY:
THE SERVQUAL INSTRUMENT / SCALE (QUESTIONNAIRE)
Although measurements of customer satisfaction and service quality are both obtained by
comparing perceptions to expectations, subtle differences between the two concepts are
seen in their operational definitions. While satisfaction compares consumer perceptions
to what consumers would normally expect - service quality compares perceptions to what
a consumer should expect from a firm that delivers high-quality services.
The SERVQUAL instrument has been popularly used in gauging service quality in many
research studies (Babakus and Boller, 199253; Carman, 199054; Cronin and Taylor,
52 Valarie A Zeithaml, Mary Jo Bitner, Dwayne D Gremler (2006), “Service Marketing: Integratingcustomer focus across the firm”, McGraw-Hill companies - 4th edition, pp. 118-119.
131
199255; as cited by Parasuraman et al, 199356). According to Brown, Churchill and Peter
(199357) also the SERVQUAL is accepted instrument measuring of service quality, which
involves the calculation of the difference between expectations and perceptions on a
number of specified determinants. After an evaluation of four alternative service quality
models Brady and Cronin (200158) state that the SERVQUAL instrument appears to be
distinct from the others as it uses one or more determinants to measure the service
quality.
Parasuraman et al. (199459) acknowledged that the SERVQUAL instrument has been
used productively and widely for measuring service quality in many published studies
examining service quality in a variety of contexts, including Banking, Pest control, Dry
cleaning and Fast food (Cronin and Taylor 199260); A Gas and Electricity Company
(Babakus and Boller 199261); Discount and Department Stores (Teas 199362); Hospital
services (Emin Babakus, W. Glynn Mangold 199263).
53 Babakus, E. and Boller, G.W. (1992), “An Empirical Assessment of the SERVQUAL scale”, Journal ofBusiness Research, Vol. 24(3), 253-268.54 Carman, J. M. (1990), “Consumer Perceptins of Service Quality: An Assessment of the SERVQUALdimensions”, Journal of Retailing, Vol. 66(1), 33-55.55 Cronin, J.J. and Taylor, S.A. (1992), op. cit., pp. 55-68.56 A. Parasuraman, Leonard L. Berry, and Valerie A. Zeithaml (1993), op. cit., pp. 140-146.57 Peter, J.P., Churchill, G.A. and Brown, T.J. (1993), “Caution in the Use of Difference Score in ConsumerResearch”, Journal of Consumer Research, Vol. 19(4), 655.58 Brady, M.K. and Cronin, J.J. (2001), “Some new thoughts on conceptualizing perceived service quality:A hierarchical approach”, Journal of Marketing, Vol. 65, 34-49.59 A. Parasuraman, Leonard L. Berry, and Valerie A. Zeithaml (1994), op. cit., pp. 201-230.60 Cronin, J.J., and Taylor S.A (1992), op. cit., pp. 55-68.61 Babakus, E. and Boller, G.W. (1992), op. cit., pp. 253-268.62 Teas, R.K. (1993), “Expectations, Performance, Evaluation, and Consumers’ Perceptions of Quality”,Journal of Marketing, Vol. 57, pp. 18-34.63 Emin Babakus, W. Glynn Mangold (1992), “Adapting the SERVQUAL scale to Hospital services: Anempirical investigation”, Health Service Research.
132
Often used and extremely debated measure of service quality is the SERVQUAL scale.64
According to its developers, SERVQUAL is a diagnostic tool that uncovers a firm’s
broad weaknesses and strengths in the area of service quality. The SERVQUAL
instrument is based on five service quality dimensions include tangibles, reliability,
responsiveness, assurance, and empathy, and they provide the basic “skeleton”
underlying service quality.
A SERVQUAL instrument consists of two sections: a 22-item section that records
customer expectations of excellent firms in the specific service industry, and a second 22-
item section that measures consumer perceptions of a particular company in that service
industry (i.e., the firm being evaluated). Results from the two sections are then compared
to arrive at “gap scores” for each of the five dimensions. The larger the gap, the farther
consumer perceptions are from expectations, and the lower the service quality evaluation.
In contrast the smaller the gap, the higher the service quality evaluation. Customer
expectations are measured on a 7-point scale with the anchor labels of “not at all
essential” and “absolutely essential.” Similarly, customer perceptions are measured on
another 7-point scale with anchor labels of “strongly agree” and “strongly disagree.”
Hence, SERVQUAL is a 44-item scale that measures customer expectations and
perceptions regarding service quality dimensions.
The Tangibles Dimensions
Because of the absence of a physical product, consumers often rely on the tangible
evidence that surrounds the service in forming evaluations. The tangibles dimension of
SERVQUAL compares consumer expectations and the firm’s performance regarding the
64 A. Parasuraman, Leonard L. Berry, and Valerie A. Zeithaml (1988), op. cit., pp. 12-40.
133
firm’s ability to manage its tangibles. A firm’s tangibles consist of a wide variety of
objects such as carpeting, desks, lighting, wall colors, brochures, daily correspondence,
and the appearance of the firm’s personnel. Consequently, the tangibles component in
SERVQUAL is two-dimensional one focusing on equipment and facilities, the other
focusing on personnel and communications materials.
The tangibles component of SERVQUAL is obtained via four expectations questions
(E1-E4) and four perception questions (P1-P4). One should keep in mind that the
expectation questions apply to excellent firms within a particular industry, while the
perception questions relate to a particular organization while investigating. Comparing
the perception scores to the expectation scores provides a numerical variable that
indicates the tangibles gap. The smaller the number, the smaller the gap and the closer
consumer perceptions are to their expectations. The questions that pertain to the tangibles
dimension are as follows:65
Tangibles Expectations
E1. Excellent companies will have modern-looking equipment.
E2. The physical facilities at excellent companies will be visually appealing.
E3. Employees of excellent companies will be neat in appearance.
E4. Materials associated with the service (such as pamphlets or statements) will be
visually appealing in an excellent company.
Tangibles perceptions
P1. XYZ has modern-looking equipment.
65 A. Parasuraman, Leonard L. Berry, and Valerie A. Zeithaml(1991), op. cit., pp.420-450.
134
P2. XYZ’s physical facilities are visually appealing.
P3. XYZ’s employees are neat in appearance.
P4. Materials associated with the service (such as pamphlets or statements) are visually
appealing at XYZ.
The Reliability Dimensions
In general, the reliability dimension reflects the consistency and dependability of a
firm’s performance. Does the firm provide the same level of service time after time, or
does quality dramatically vary with each encounter? Does the firm keep its promises, bill
its customers accurately, keep accurate records, and perform the service correctly the first
time? Nothing can be more frustrating for customers than unreliable service providers.
Consumers perceive the reliability dimension to be the most important of the five
SERVQUAL dimensions. Consequently, failure to provide reliable service generally
translates into an unsuccessful. The questions used to assess the reliability gap are as
follows:
Reliability Expectations
E5. When excellent companies promise to do something by a certain time, they will do
so.
E6. When a customer has a problem, excellent companies will show sincere interest in
solving it.
E7. Excellent companies will perform the service right the first time.
E8. Excellent companies will provide their services at the time they promise to do so.
E9. Excellent companies will insist on error-free records.
135
Reliability perceptions
P5. When XYZ promises to do something by a certain time, it does so.
P6. When you have a problem, XYZ shows a sincere interest in solving it.
P7. XYZ performs the service right the first time.
P8. XYZ provides its services at the time it promises to do so.
P9. XYZ insists on error-free records.
The Responsiveness Dimensions
Responsiveness reflects a service firm’s commitment to provide its services in a timely
manner. As such, the responsiveness dimension of SERVQUAL concerns the
willingness and/or readiness of employees to provide a service. Occasionally, the needs
of the customer are ignored by employees due to their own preoccupation. Obviously,
this is an example of unresponsiveness. The SERVQUAL expectation and perception
items that address the responsiveness gap are as follows:
Responsiveness Expectations
E10. Employees of excellent companies will tell customers exactly when services will be
performed.
E11. Employees of excellent companies will give prompt service to customers.
E12. Employees of excellent companies will always be willing to help customers.
E13. Employees of excellent companies will never be too busy to respond to customer
requests.
136
Responsiveness Perceptions
P10. Employees of XYZ tell you exactly when services will be performed.
P11. Employees of XYZ give you prompt service.
P12. Employees of XYZ are always willing to help you.
P13. Employees of XYZ are never too busy to respond to your requests.
The Assurance Dimensions
SERVQUAL’s assurance dimension addresses the competence of the firm, the courtesy
it extends its customers, and the security of its operations. Competence pertains to the
firm’s knowledge and skill in performing its service. Does the firm possess the required
skills to complete the service on a professional basis?
Courtesy refers to how the firm’s personnel interact with the customer and the customer’s
possessions. As such, courtesy reflects politeness, friendliness, and consideration for the
customer’s property.
Security is also an important component of the assurance dimension. Security reflects a
customer’s feelings that he or she is free from danger, risk, and doubt. The SERVQUAL
items utilized to address the assurance gap are as follows:
Assurance Expectations
E14. The behaviour of employees of excellent companies will instill confidence in
customers.
E15. Customers of excellent companies will feel safe in their transactions.
E16. Employees of excellent companies will be consistently courteous with customers.
137
E17. Employees of excellent companies will have the knowledge to answer customer
questions.
Assurance perceptions
P14. The behaviour of employees of XYZ instills confidence in customers.
P15. You feel safe in your transactions with XYZ.
P16. Employees of XYZ are consistently courteous with you.
P17. Employees of XYZ have the knowledge to answer your questions.
The Empathy Dimensions
Empathy is the ability to experience another’s feelings as one’s own. Empathetic firms
have not lost touch with what it is like to be a customer of their own firm. As such,
empathetic firms understand their customer needs and make their services accessible to
their customers. In contrast, firms that do not provide their customers individualized
attention when requested and that offer operating hours convenient to the firm and not its
customers fail to demonstrate empathetic behaviours. The SERVQUAL empathy
dimension addresses the empathy gap as follows:
Empathy expectations
E18. Excellent companies will give customers individual attention.
E19. Excellent companies will have operating hours convenient to all their customers.
E20. The employees of excellent companies give customers personal attention.
E21. Excellent companies will have the customer’s best interest at heart.
E22. The employees of excellent companies will understand the specific needs of their
customers.
138
Empathy Perceptions
P18. XYZ gives you individual attention.
P19 XYZ companies have operating hours convenient to all its customers.
P20. XYZ employees give you personal attention.
P21. XYZ has your best interests at heart.
P22. Employees of XYZ understand your specific needs.
4.8. LIMITATIONS OF SERVQUAL
Although SERVQUAL has been widely used by service companies, doubts have been
expressed about both its conceptual foundation and methodological limitations.66 Anne
Smith (1995)67 notes that the majority of researchers using SERVQUAL have omitted
from, added to, or altered the list of statements purporting to measure service quality. To
evaluate the stability of the five underlying dimensions when applied to a variety of
different service industries, Gerhard Mels et al.68 analyzed datasets from banks, insurance
brokers, vehicle repair firms, electrical repair firms, and life insurance companies. Their
findings suggest that, in reality, SERVQUAL scores measure only two factors: intrinsic
service quality and extrinsic service quality.
66 Francis Buttle (1996), “SERVQUAL: Review, Critique, Research Agends”, European Journal ofMarketing, Vol. 30, no.1:8-32; Simon S. K. Lam and Ka Shing Woo (1997), “Measuring Service Quality:A Test-Retest Reliability Investigation of SERVQUAL”, Journal of the Market Research Society, Vol. 39:381-393; Terrence H. Witkowski, and Marry F. Wolfinbarger (2002), “Comparative Service Quality:German and American Ratings Across Across Service Settings”, Journal of Business Research, Vol. 55:875-881; Lisa J. Morrison Coulthard (2004), “Measuring Service Quality: A Review and Critique ofResearch Using SERVQUAL”, International Journal of Market Research, Vol. 46, Quarter 4, 479-497.67 Anne M. Smith (1995), “Measuring Service Quality: Is SERVQUAL Now Redundant?” Journal ofMarketing Management, Vol. 11 (Jan/Feb/Apr): 257-276.68 Gerhard Mels, Christo Bosoff, and Denon Nel (1997), “The Dimensions of Service Quality: The OriginalEuropean Perspective Revisited.” The Service Industries Journal, Vol. 17: 173-189.
139
These findings don’t undermine the value of Zeithaml, Berry, and Parasuraman’s
achievement in identifying some of the key underlying constructs in service quality, but
they do highlight the difficulty of measuring customer perceptions of quality, and the
need to customize dimensions and measures to the research context. From the
beginning, its developers have claimed that SERVQUAL is a useful starting point for
measuring service quality and was never presented as “the final answer”. The developers
of SERVQUAL further contend that when used in conjunction with other forms of
measurement, both quantitative and qualitative, SERVQUAL provides a valuable
diagnostic tool for evaluating the firm’s service quality performance. Overall, as was the
case with satisfaction measures, SERVQUAL is most valuable when compared with a
firm’s own past service quality trends and when compared with measures of competitive
service quality performance69.
4.9. STANDARDIZING HEALTHCARE QUALITY:
"Market forces, such as medical tourism, insurance and corporate sector have accelerated
the demand for quality in healthcare services. As a result, there is a growing demand
from consumers for better healthcare as the lack of quality assurance mechanisms limits
their access to appropriate health services - Girdhar J Gyani, CEO National Accreditation
Board for Hospitals & Healthcare providers, India”70. Systematic efforts to improve
quality based findings about the delivery process have been extremely rare. In the studies
which focused its attention on service quality, exposed insufficiency in health care
services and management systems in less developed countries.
69 K. Douglas Hoffman, John E.G. Bateson (2006), “Assessing the Criticisms of SERVQUAL”, Marketingof Services, South Western Cengage Learning, pp. 173-176.70 Asian Hospital & Healthcare Management - www.asianhhm.com.
140
HOSPITAL ACCREDITATION FOR QUALITY ASSURANCE:
Hospital accreditation has been defined as “A self-assessment and external peer
assessment process used by health care organizations to accurately assess their level of
performance in relation to established standards and to implement ways to continuously
improve”71. Critically, accreditation is not just about standard-setting: there are
analytical, counseling and self-improvement dimensions to the process. There are parallel
issues around evidence-based medicine, quality assurance and medical ethics, and the
reduction of medical error is a key role of the accreditation process. Hospital
accreditation is therefore one component in the maintenance of patient safety.
Broadly speaking, there exist two types of hospital accreditation:
1) Hospital and healthcare accreditation which takes place within national borders.
2) International healthcare accreditation.
4.10. QUALITY STANDARDS / ACCREDITATIONS INHEALTHCARE INDUSTRY:
WORLD SCENARIO:
Joint Commission:
The Joint Commission72 is a private sector United States-based non-profit organization.
It is the best known for a large number of active healthcare accreditation groups in the
USA.
The declared mission of this private organization is "To continuously improve the safety
and quality of care provided to the public through the provision of health care
71 http://en.wikipedia.org/wiki/Joint_Commission#History_of_the_Joint_Commission_and_JCI72 www.jointcommission.org/
141
accreditation and related services that support performance improvement in health care
organizations."
It is often believed (erroneously) that The Joint Commission is an American or even a
World public authority, which is not the case. This perception occurs because of the
company's deeming power - "Under 42 U.S.C. §§ 1395bb(a),(b), a hospital that meets
Joint Commission accreditation is deemed to meet the Medicare Conditions of
Participation" (which is a requirement for Medicare reimbursement).
The Joint Commission is therefore virtually a monopoly, enjoying unique statutory
protection in the USA and collecting $113 million in annual revenue, mainly from the
fees it charges US hospitals for evaluating their compliance with federal regulations.
History of the Joint Commission and JCI:
The Joint Commission's predecessor organization was an outgrowth of the efforts of
Ernest Codman, M.D., (December 30, 1869-1940) was a U.S. Physician to promote
hospital reform based on outcomes management in patient care. Codman’s efforts led to
the founding of the American College of Surgeons and its Hospital Standardization
Program. In 1951, a new entity, the Joint Commission on Accreditation of Hospitals
was created by merging of the Hospital Standardization Program with similar ones run by
the American College of Physicians, the American Hospital Association, the American
Medical Association, and the Canadian Medical Association. From 1981 onwards the
company was re-branded as the Joint Commission on Accreditation of Healthcare
142
Organizations (JCAHO, pronounced "jay-co")73. It is now more usually known as The
Joint Commission.
Much more recently, an international offshoot called Joint Commission International,
or JCI, has been founded (1997). This group surveys hospitals outside of the USA, using
a different set of standards to those used to survey US hospitals (see below), and
generates income for the parent company in the USA.
The Joint Commission's Goals and Initiatives:
The company updates its accreditation standards and expands patient safety goals on a
yearly basis, and posts them on its website for all interested persons to review, making
this information and process transparent to all stakeholders ranging from institutions, to
practitioners, to patients and their advocates.
The purpose of The Joint Commission’s National Patient Safety Goals is to promote
specific improvements in patient safety. The Goals highlight problematic areas in health
care and describe evidence and expert-based solutions to these problems. Recognizing
that sound system design is intrinsic to the delivery of safe, high quality health care, the
Goals focus on system-wide solutions, wherever possible74. In reality much of the Joint
Commission's power stems from the fact that in most states of the USA, the organization
functions as a virtual monopoly when it comes to deciding whether or not individual
hospitals are able to participate in the Medicare and Medicaid programs, and this great
power is, accordingly, a major factor in ensuring that hospitals are, in effect, obligated to
73 "The Joint Commission Launches New Brand Identity", The Joint Commission, Retrieved on 2007-07-17, http://www.jointcommission.org/AboutUs/brand.htm. Retrieved 2007-07-17.74 "Introduction to the National Patient Safety Goals", The Joint Commission, Retrieved on 2007-07-17,http://www.jointcommission.org/
143
make use of its services if they wish to earn money from Medicaid and Medicare. The
Joint Commission recognizes the strength of this position, and the opportunities it
presents to the organization; quoting from the Joint Commission's web pages, "The Joint
Commission actively monitors and inspects state legislative and regulatory activities for
the purpose of identifying additional opportunities for state reliance on Joint
Commission accreditation".
International Healthcare Accreditation
With the advent of medical tourism, international healthcare accreditation of hospitals
located in many countries around the world has increasingly grown in importance.
There are other accreditation organizations based in countries other than the USA which
fulfill a similar internationally-orientated role to JCI. These include:
The Canadian Council on Health Services Accreditation or CCHSA
The Trent Accreditation Scheme (Trent Accreditation Scheme or TAS - United
Kingdom)
The Australian Council on Healthcare Standards or ACHS
International Organization for Standards (ISO) – Switzerland
Also The Society for International Healthcare Accreditation, or SOFIHA, is a free-
to-join group providing a forum for discussion and for the sharing of ideas and good
practice by providers of international healthcare accreditation and users of the same.
144
INDIAN SCENARIO:
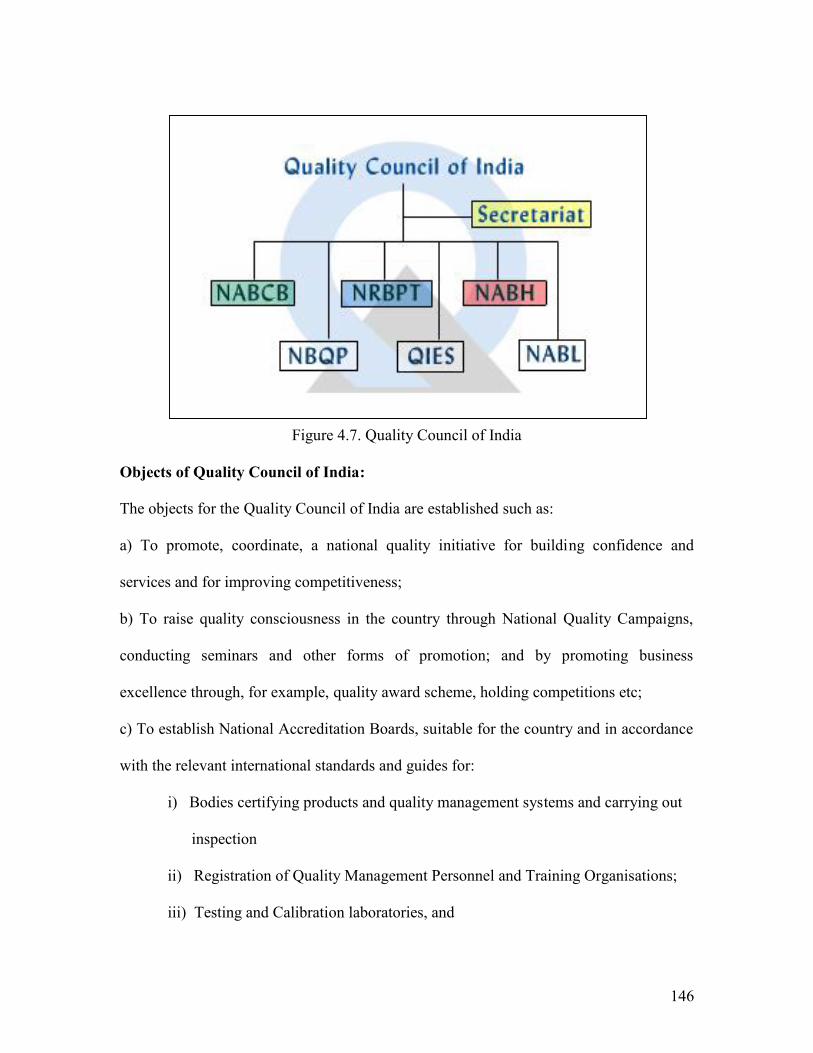
Quality Council of India (QCI)
QCI came into existence in the year of 1997. It is a self-governing body by the
Government of India jointly with the Indian industry to establish and operate
accreditation structure in the area of conformity assessment covering bodies offering
certification, inspection, testing, registration services etc75. The disciplines include;
Environment, Food Safety, Health, Information Security, Occupational Health & Safety,
Quality Management.
QCI is responsible for scrutinize and govern the National Quality Campaign and to
supervise efficient function of the National Information and Enquiry Services. QCI play
a vital role in improving quality competitiveness of Indian products and services. It also
endows with strategic course to the quality movement in the country by setting up
recognition of India conformity assessment system at the global level.
Vision:
“To be among the world’s leading national apex quality facilitation, accreditation and
surveillance organizations, to continuously improve the climate, systems, processes and
skills for total quality”.
75 “National Accreditation Board for Hospitals and Healthcare providers, Standards for Hospital”, 1st
Edition, 2005, Quality Council of India.
145
QCI Mission:
“To help India, achieve and sustain quality and reliability in all areas of life, work,
environment, product and services at individual, organizational, community and societal
levels.”
Structure of QCI:
QCI is governed by a Council of 31 members with equal representations of government,
industry and consumers. Chairman of QCI is appointed by the Prime Ministers office on
recommendation of the government and industry.
Council is the apex body which is responsible for framing the line of action, general
policy, formation and monitoring of various mechanisms of QCI including the
accreditation boards with objective to ensure transparent and credible accreditation
system. The Council through a Governing Body monitors the progress of activities and
appeal mechanisms set by the respective boards.
QCI functions through the executive bodies (boards! committees) that implement the
strategy, policy and operational guidelines set by the Quality Council of India with a
view to achieve international acceptance and recognition of various components
including the accreditation systems.
Each Board has a Chairman nominated by the QCI Chairman. The Boards comprise of
representative volunteer group of stakeholders who guide and pursue the activities and
progress of the respective Boards.
146
Figure 4.7. Quality Council of India
Objects of Quality Council of India:
The objects for the Quality Council of India are established such as:
a) To promote, coordinate, a national quality initiative for building confidence and
services and for improving competitiveness;
b) To raise quality consciousness in the country through National Quality Campaigns,
conducting seminars and other forms of promotion; and by promoting business
excellence through, for example, quality award scheme, holding competitions etc;
c) To establish National Accreditation Boards, suitable for the country and in accordance
with the relevant international standards and guides for:
i) Bodies certifying products and quality management systems and carrying out
inspection
ii) Registration of Quality Management Personnel and Training Organisations;
iii) Testing and Calibration laboratories, and
147
iv) Monitoring and implementation of the above
d) To encourage industrial/applied research and development in the field of quality and
dissemination of its result in relevant publication including professional and trade
journals;
e) To ensure effective functioning of National Information and Enquiry service on
Standards and Quality;
f) To establish an accreditation service for bodies certifying environment and safety
management systems;
g) To encourage the development and third party certification of quality management
systems including environment and safety management systems at the organization level,
for goods and services;
h) To facilitate up gradation of testing and calibration facilities and laboratories and to
encourage the development of a national laboratory accreditation system for global
recognition and for accessibility of measurement and test results;
i) To raise the level of quality training for personnel engaged in quality activities
including assessors;
j) To develop and operate an appeal mechanism to deal with unresolved complaints;
k) To enter into arrangements with similar foreign agencies and develop procedures for
exchange and transfer of technologists and technologies, study tours, training in
specialized areas of quality technology, conducting of joint projects, providing technical
assistance in the establishment of quality consciousness and for other matters consistent
with aims and objectives of Society;
148
l) To collect and disseminate information in regard to research and development besides
industrial matters with regard to quality.
National Accreditation Board for Hospitals and Health Care Providers (NABH)
NABH is a constituent board of QCI76, set up with cooperation of the Ministry of Health
& Family Welfare, Government of India and the Indian Health Industry. This Board will
cater to the much desired needs of the consumers and will set standards for progress of
the health industry. This Board while being supported by all stakeholders including
industry, consumers, government, will have full functional autonomy in its operations.
The NABH standards have been laid down keeping the Indian ethos and working
environment in mind. The main focus of the standards is on patient, employee, visitor
and environment safety. These standards are at par with the standards laid down for
accreditation of hospitals elsewhere in the developed and developing countries. These
standards are applicable to multidisciplinary hospitals and single specialty hospitals
providing secondary, tertiary and quaternary levels of health / medical care. They are not
applicable to primary health care institutions and rural hospitals. All the standards are
core standards and no optional standards have been laid down. The compliance with
these standards indicates that the hospital has patient, staff and is environment friendly.
76 “National Accreditation Board for Hospitals and Healthcare providers: A Guide Book to NABHStandards on Hospital Accreditation”, First Edition, August 2006.