chapter 4 experimental programme for...
TRANSCRIPT
57
CHAPTER 4
EXPERIMENTAL PROGRAMME FOR THE
DETERMINATION OF THE OPTIMAL PERCENTAGE OF
FLY ASH
4.1 INTRODUCTION
For the experimentations, concrete of grade M20 was adopted. For
the above specified grade of concrete, mix proportion was arrived by Indian
Standard method of mix design and it is as follows:
1 : 1.464 : 3.210 and water-cement ratio 0.5
Concrete specimens cast adopting the above mix proportion using
Ordinary Portland Cement (OPC) for the study of various mechanical, micro
structural and durability properties were considered as control specimens. In
this proportion, the content of cement was partly replaced by fly ash with
increments of 5% by weight of cement upto 30% and similar specimens as
that of the control specimens were cast for each percentage increment of fly
ash and tested to determine the properties of fresh and hardened fly ash
blended cement concrete including its micro structural and durability
properties.
4.2 TESTS ON FRESH CONCRETE
4.2.1 Slump Test
To measure the consistency of concrete and certain factors
contributing to workability, this common test was performed for all the
58
batches of concrete with various percentages of fly ash and by observing the
manner in which the concrete slumped, it was compared with that of the
control concrete without fly ash.
4.2.2 Compacting Factor Test
Compacting factor test was performed to measure the inherent
characteristics of the concrete which relates very close to the workability
requirements of concrete particularly for concrete mixes of very low
workability and mixes that are relatively dry and insensitive to slump test.
4.2.3 Vee Bee Consistometer Test
This test was ideally suited for very dry concrete mixes whose
slump values were unable to be determined by slump test and it was
performed in the laboratory to measure indirectly the workability of the
various concrete mixes. The time taken in seconds for the conical concrete
specimen to assume full cylindrical shape as observed through a transparent
glass disc by vibrating the concrete was noted as Vee Bee Degree.
4.2.4 Setting Time of Concrete by Penetration Resistance
Setting times of concrete mixes without and with various
percentages of fly ash were determined as per IS: 8142 -1976. Spring
reaction-type penetration resistance apparatus graduated from 50 N to 600 N
and needle of 16mm2 bearing area were used. The penetration resistance was
calculated from the force required to cause 25mm depth of penetration of the
needle divided by the bearing face area of the needle. The results of each trial
were plotted with penetration resistance in N/mm2 as the ordinate and elapsed
time in minutes as the abscissa. Times of initial and final setting were
determined from the curves plotted for each concrete mix at which penetration
resistances were 3.43 N/mm2 (35 kgf/cm2) and 26.97 N/mm2 (275 kgf/cm2)
respectively.
59
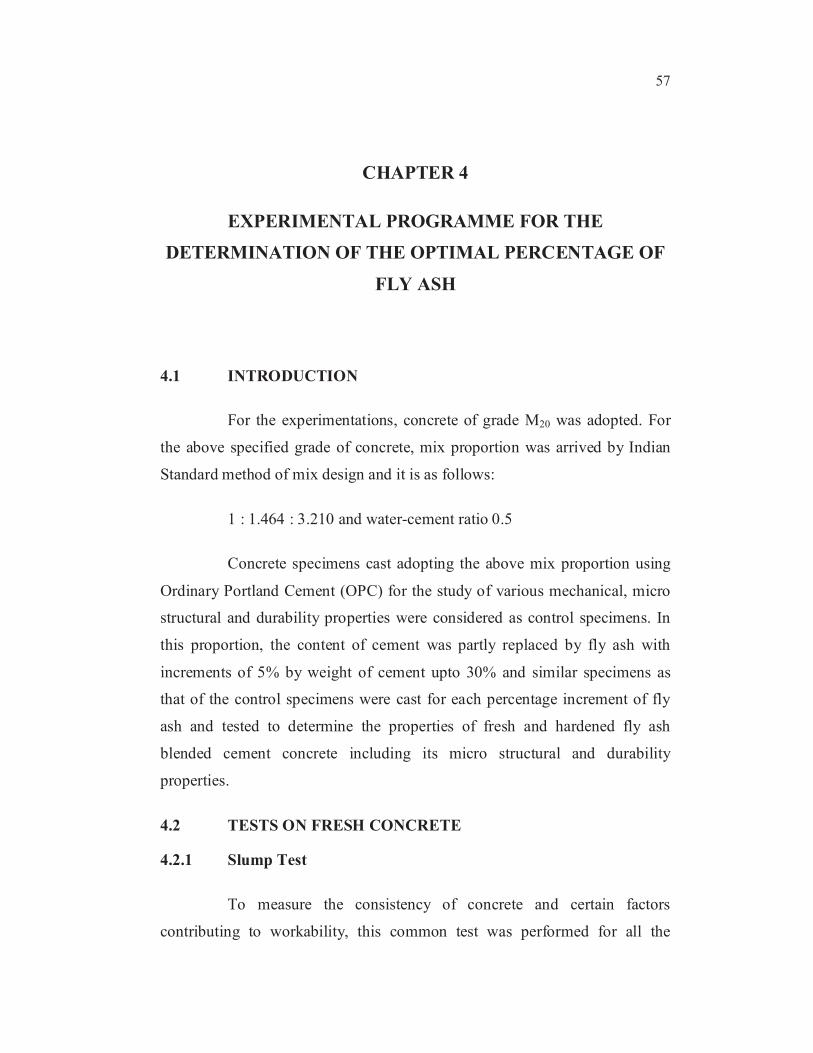
4.3 RESULTS OF THE FRESH CONCRETE TESTS
The values obtained from the various tests performed on the fresh
concrete mixes are tabulated below
Table 4.1 Test values of fresh concrete mixes
S.
No.Identification
Slump
‘mm’
Compacting
factor
Vee
Bee
Time
‘secs’
Final
setting
time
‘minutes’
1CM - Control mix
(without fly ash)62 0.88 6 260
2 FA 5 (fly ash 5%) 66 0.89 5 290
3 FA 10 (fly ash 10%) 73 0.91 5 310
4 FA 15 (fly ash 15%) 78 0.92 4 325
5 FA 20 (fly ash 20%) 82 0.94 3 340
6 FA 25 (fly ash 25%) 86 0.95 3 360
7 FA 30 (fly ash 30%) 89 0.95 2 380
Figure 4.1 Variation in slump values
60
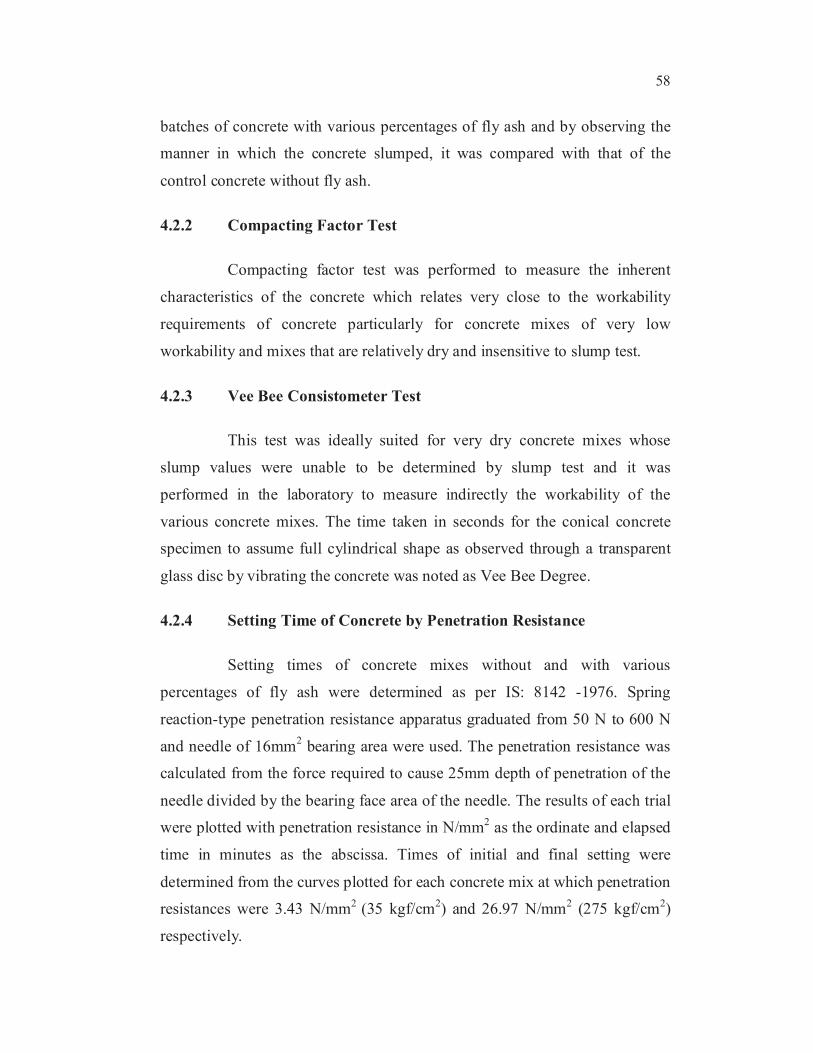
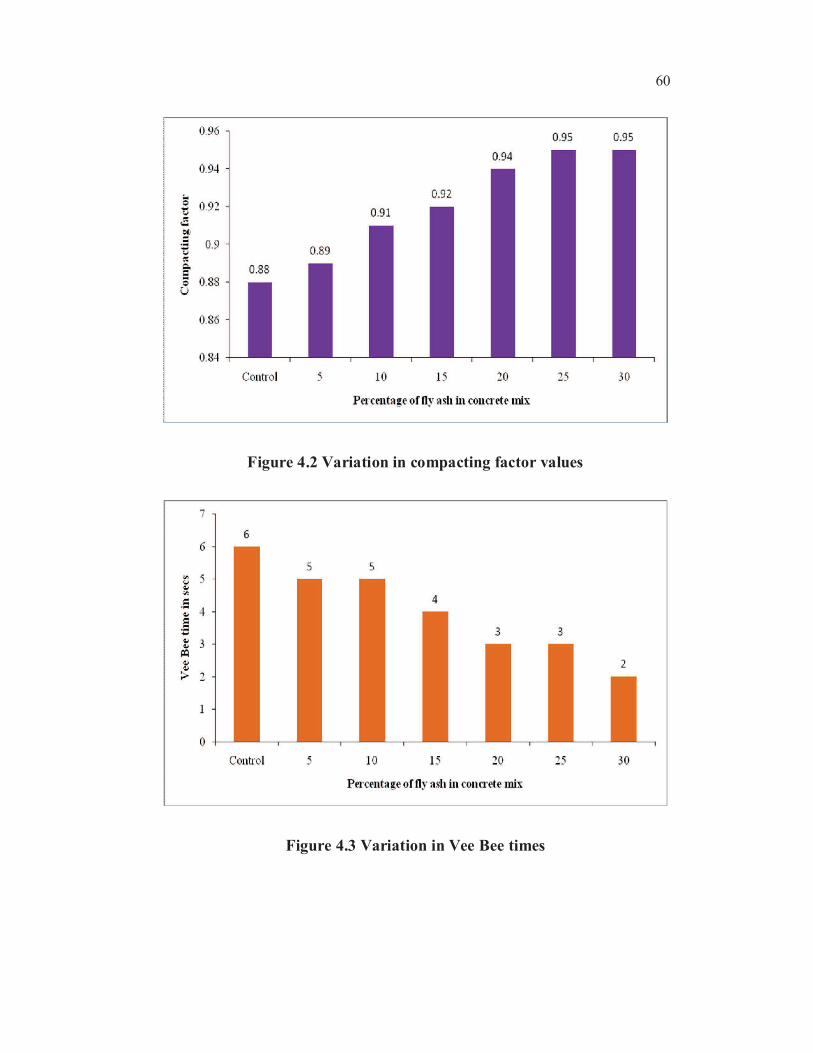
Figure 4.2 Variation in compacting factor values
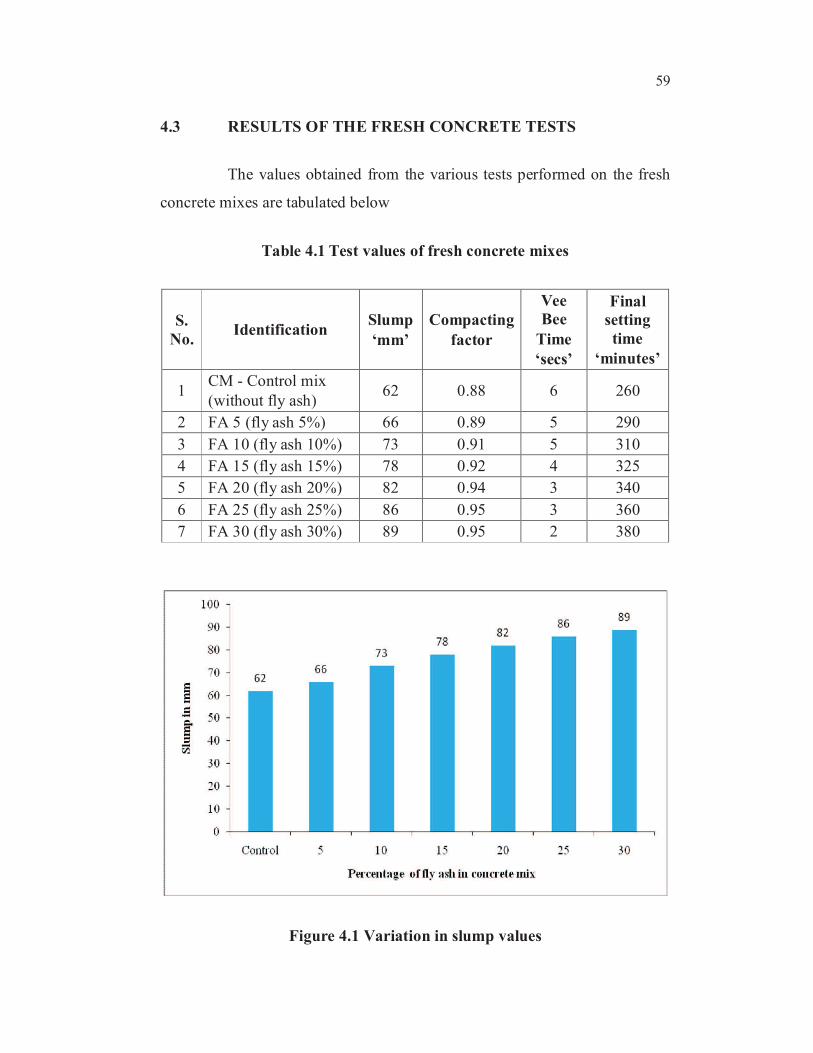
Figure 4.3 Variation in Vee Bee times
61
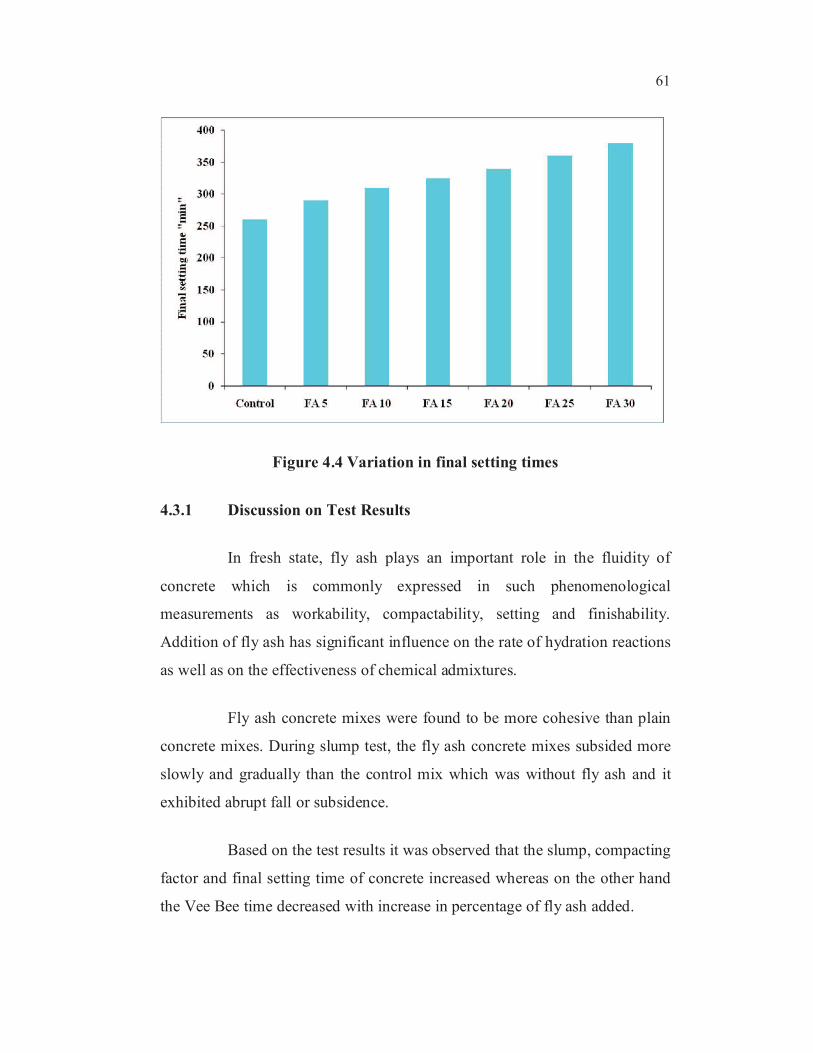
Figure 4.4 Variation in final setting times
4.3.1 Discussion on Test Results
In fresh state, fly ash plays an important role in the fluidity of
concrete which is commonly expressed in such phenomenological
measurements as workability, compactability, setting and finishability.
Addition of fly ash has significant influence on the rate of hydration reactions
as well as on the effectiveness of chemical admixtures.
Fly ash concrete mixes were found to be more cohesive than plain
concrete mixes. During slump test, the fly ash concrete mixes subsided more
slowly and gradually than the control mix which was without fly ash and it
exhibited abrupt fall or subsidence.
Based on the test results it was observed that the slump, compacting
factor and final setting time of concrete increased whereas on the other hand
the Vee Bee time decreased with increase in percentage of fly ash added.
62
All the above findings indicate that with increase in percentage of
fly ash as partial replacement of cement in concrete increase the workability
of concrete. Though the increase in workability was initially high with
incremental increase of fly ash percentages, it was observed that the rate of
increase in workability gradually decreased later on even though the
incremental increase in fly ash percentage was constant.
Electron microscope photographs have shown that the particles in
fly ash occur as solid spheres of silica glass and are so fine and their sizes
range from < 1 µm to 100 µm. Majority of the particles are of 20 µm only.
Since the surface areas of the particles are also high they contribute to the
increase in workability with increase in their percentages. Hence due to the
increase in fluidity and mobility of the fly ash blended fresh concrete, there
was increase in final setting time of the concrete also.
4.4 MECHANICAL STRENGTH TESTS
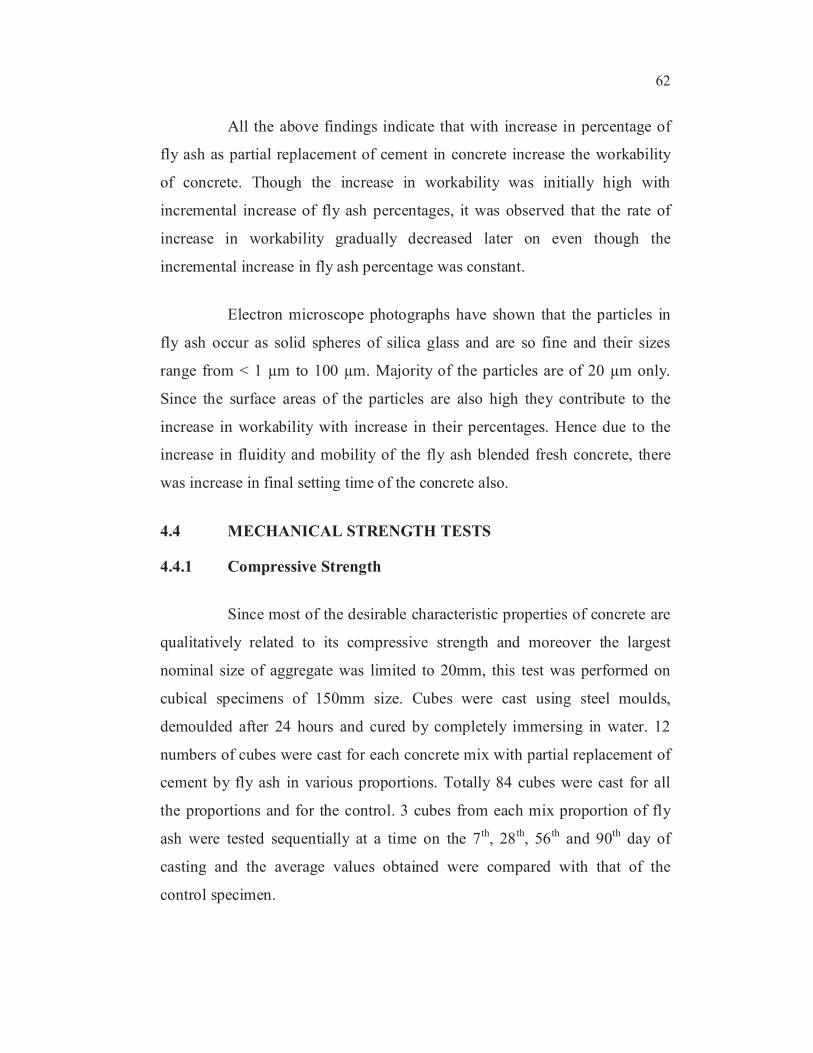
4.4.1 Compressive Strength
Since most of the desirable characteristic properties of concrete are
qualitatively related to its compressive strength and moreover the largest
nominal size of aggregate was limited to 20mm, this test was performed on
cubical specimens of 150mm size. Cubes were cast using steel moulds,
demoulded after 24 hours and cured by completely immersing in water. 12
numbers of cubes were cast for each concrete mix with partial replacement of
cement by fly ash in various proportions. Totally 84 cubes were cast for all
the proportions and for the control. 3 cubes from each mix proportion of fly
ash were tested sequentially at a time on the 7th, 28th, 56th and 90th day of
casting and the average values obtained were compared with that of the
control specimen.
63
Figure 4.5 Compression test on concrete cubes
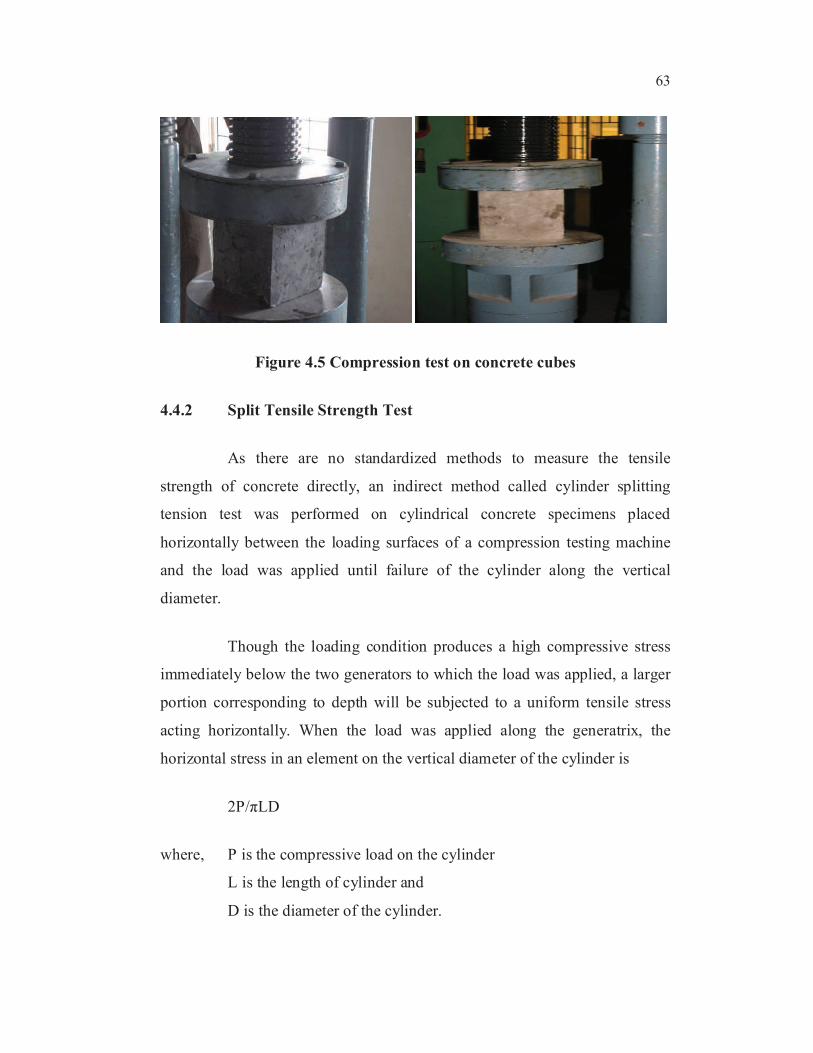
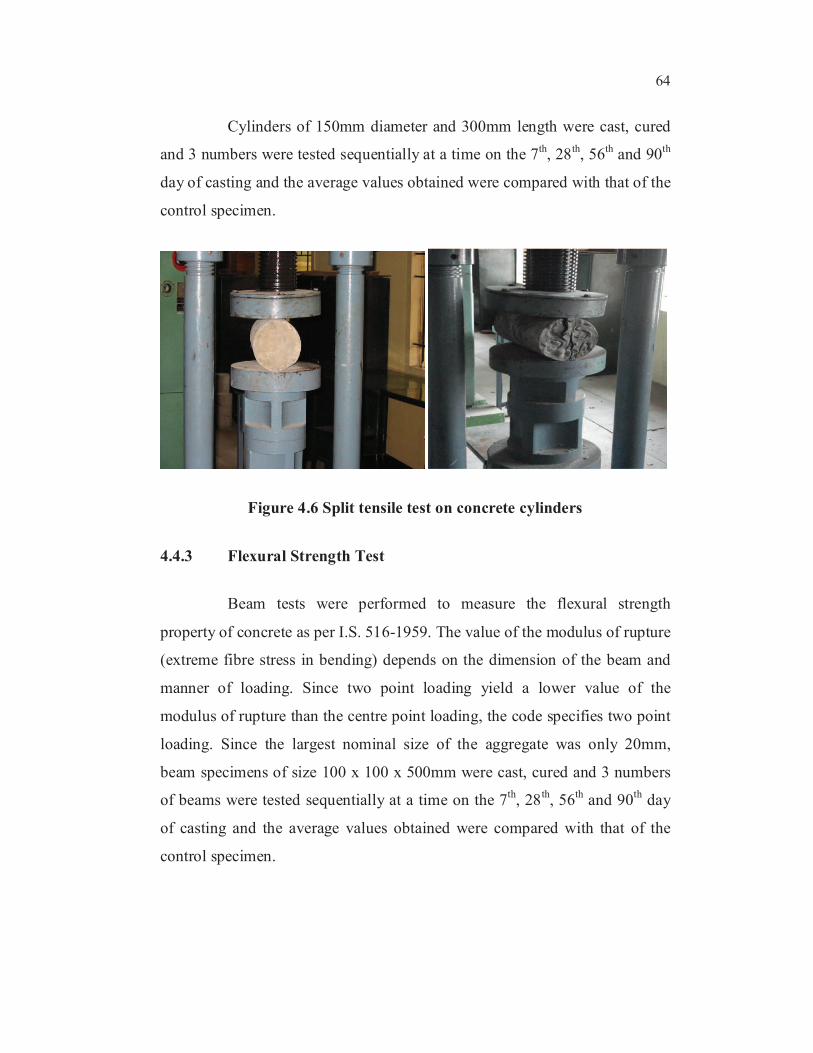
4.4.2 Split Tensile Strength Test
As there are no standardized methods to measure the tensile
strength of concrete directly, an indirect method called cylinder splitting
tension test was performed on cylindrical concrete specimens placed
horizontally between the loading surfaces of a compression testing machine
and the load was applied until failure of the cylinder along the vertical
diameter.
Though the loading condition produces a high compressive stress
immediately below the two generators to which the load was applied, a larger
portion corresponding to depth will be subjected to a uniform tensile stress
acting horizontally. When the load was applied along the generatrix, the
horizontal stress in an element on the vertical diameter of the cylinder is
2P/ LD
where, P is the compressive load on the cylinder
L is the length of cylinder and
D is the diameter of the cylinder.
64
Cylinders of 150mm diameter and 300mm length were cast, cured
and 3 numbers were tested sequentially at a time on the 7th, 28th, 56th and 90th
day of casting and the average values obtained were compared with that of the
control specimen.
Figure 4.6 Split tensile test on concrete cylinders
4.4.3 Flexural Strength Test
Beam tests were performed to measure the flexural strength
property of concrete as per I.S. 516-1959. The value of the modulus of rupture
(extreme fibre stress in bending) depends on the dimension of the beam and
manner of loading. Since two point loading yield a lower value of the
modulus of rupture than the centre point loading, the code specifies two point
loading. Since the largest nominal size of the aggregate was only 20mm,
beam specimens of size 100 x 100 x 500mm were cast, cured and 3 numbers
of beams were tested sequentially at a time on the 7th
, 28th, 56
th and 90
th day
of casting and the average values obtained were compared with that of the
control specimen.
65
The expression adopted for calculating the modulus of rupture:
fb = (P x L)/(b x d2)
P = maximum load in ‘N’ applied to the specimen
L = length in ‘mm’ of the span on which the specimen was
supported
b = measured width of the specimen in ‘mm’
d = measured depth of the specimen in ‘mm’
IS 456 – 2000 specifies following relationship between the
compressive strength and flexural strength. As per the code, flexural strength
= 0.7ckf , where fck is the characteristic compressive strength of concrete in
N/mm2.
4.4.4 Bond Strength Test
Bond strength refers to the adhesive force between steel and
concrete. The roughness of the steel surface and the compressive strength of
concrete are the primary factors that influence bond strength. Also bond
strength is a function of specific surface of gel. The cement used in this
experimentation consisted of higher percentage of C2S thereby giving higher
specific surface of gel and higher bond strength. Moreover with inclusion of
fly ash replacing cement partially, the percentage of C2S increased leading to
still higher specific surface of gel and bond strength.
4.5 RESULTS OF THE MECHANICAL STRENGTH TESTS
The values obtained from the various mechanical tests performed
on the hardened concrete specimens are tabulated below
66
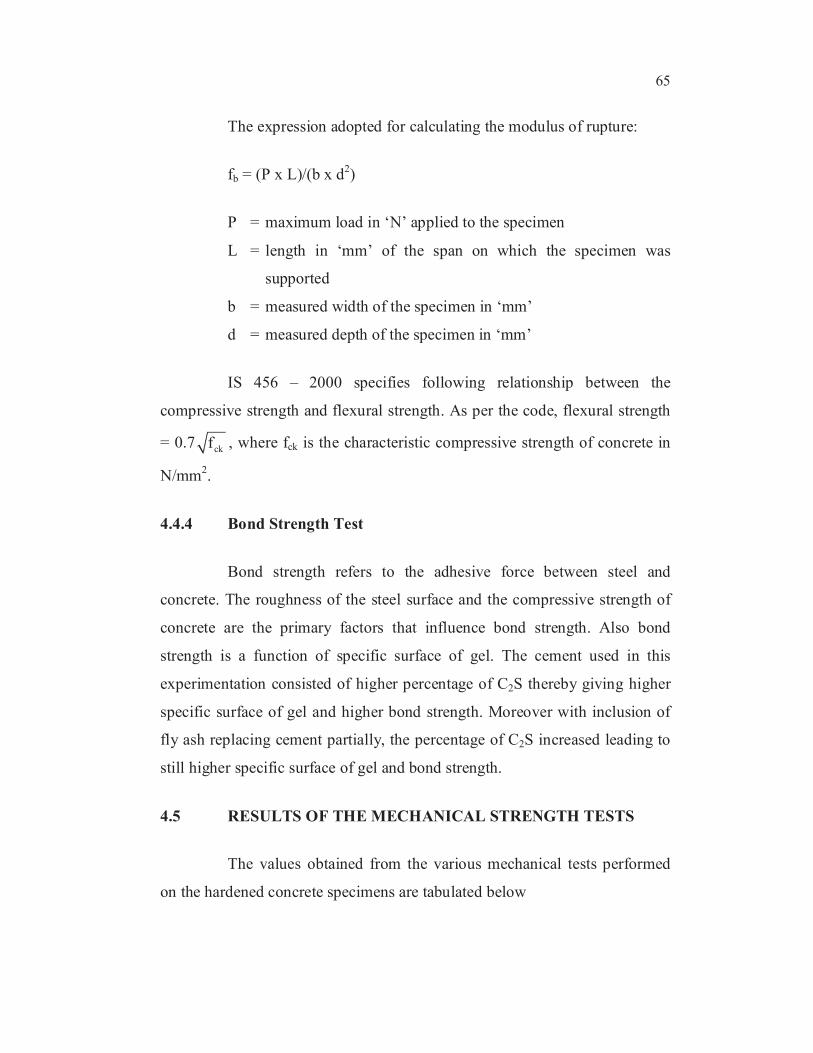
Table 4.2 Compressive strength of concrete cubes
S.
No.Identification
7 Days
N/mm2
28 Days
N/mm2
56 Days
N/mm2
90 Days
N/mm2
1CM - Control mix
(without fly ash)16.31 26.53 28.00 28.89
2 FA 5 (fly ash 5%) 15.11 26.22 27.38 28.58
3 FA 10 (fly ash 10%) 14.35 25.51 27.82 29.02
4 FA 15 (fly ash 15%) 14.18 25.06 28.53 30.18
5 FA 20 (fly ash 20%) 14.22 25.55 28.88 31.64
6 FA 25 (fly ash 25%) 14.60 25.91 29.29 32.35
7 FA 30 (fly ash 30%) 13.87 24.84 27.91 28.84
Table 4.3 Split tensile strength of concrete cylinders
S.
No.Identification
7 Days
N/mm2
28 Days
N/mm2
56 Days
N/mm2
90 Days
N/mm2
1CM - Control mix
(without fly ash)1.68 3.03 4.31 4.62
2 FA 5 (fly ash 5%) 1.50 2.94 4.20 4.55
3 FA 10 (fly ash 10%) 1.38 2.83 4.10 4.49
4 FA 15 (fly ash 15%) 1.27 2.79 4.17 4.58
5 FA 20 (fly ash 20%) 1.22 2.76 4.23 4.61
6 FA 25 (fly ash 25%) 1.14 2.74 4.29 4.65
7 FA 30 (fly ash 30%) 1.11 2.67 4.24 4.61
67
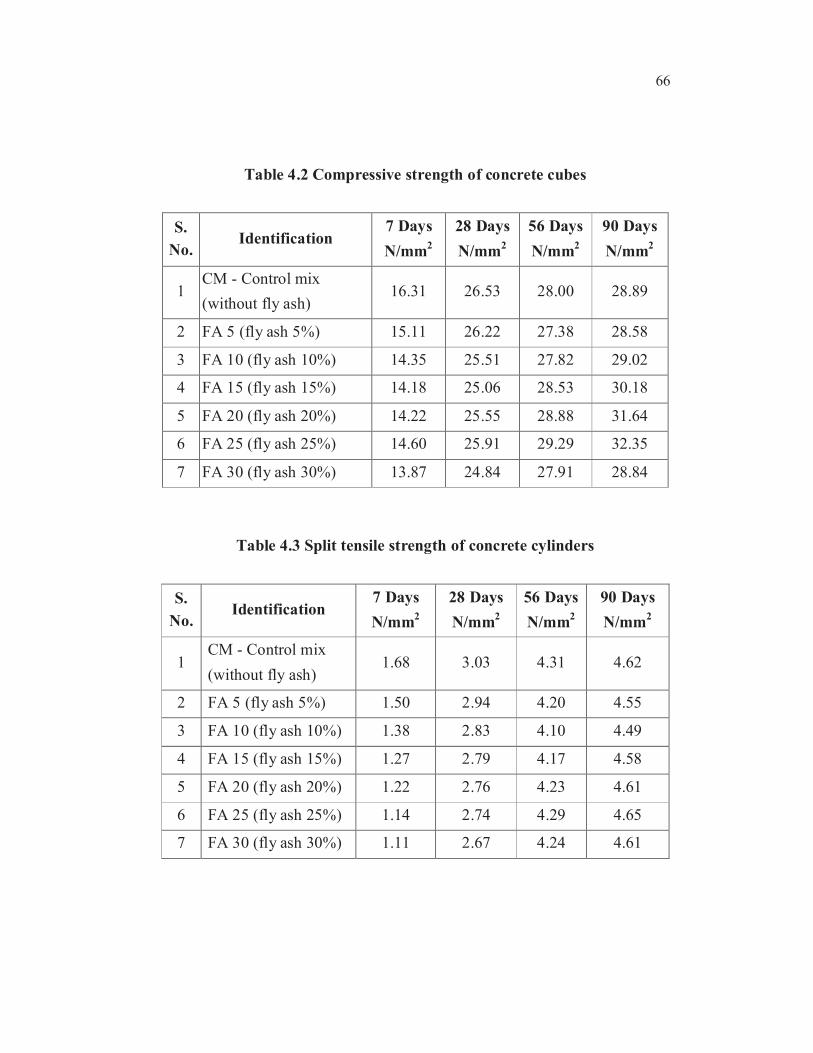
Table 4.4 Flexural strength of concrete beams
S. No. Identification7 Days
N/mm2
28 Days
N/mm2
56 Days
N/mm2
90 Days
N/mm2
1CM - Control mix
(without fly ash)3.20 5.60 7.20 8.00
2 FA 5 (fly ash 5%) 3.20 5.40 7.00 7.80
3 FA 10 (fly ash 10%) 3.00 5.60 6.80 8.00
4 FA 15 (fly ash 15%) 2.80 5.80 7.00 8.40
5 FA 20 (fly ash 20%) 2.40 4.60 7.40 8.60
6 FA 25 (fly ash 25%) 2.40 4.40 7.60 9.20
7 FA 30 (fly ash 30%) 2.20 4.40 7.20 8.00
Table 4.5 Bond strength of concrete containing various FA percentages
S.
No.Identification
7 Days
N/mm2
28 Days
N/mm2
56 Days
N/mm2
90 Days
N/mm2
1CM - Control mix
(without fly ash)2.85 4.51 4.95 5.10
2 FA 5 (fly ash 5%) 2.76 4.45 4.94 5.12
3 FA 10 (fly ash 10%) 2.53 4.43 4.97 5.16
4 FA 15 (fly ash 15%) 2.39 4.35 4.99 5.18
5 FA 20 (fly ash 20%) 2.20 4.30 5.06 5.19
6 FA 25 (fly ash 25%) 2.11 4.22 5.06 5.19
7 FA 30 (fly ash 30%) 2.09 4.31 5.00 5.15
68
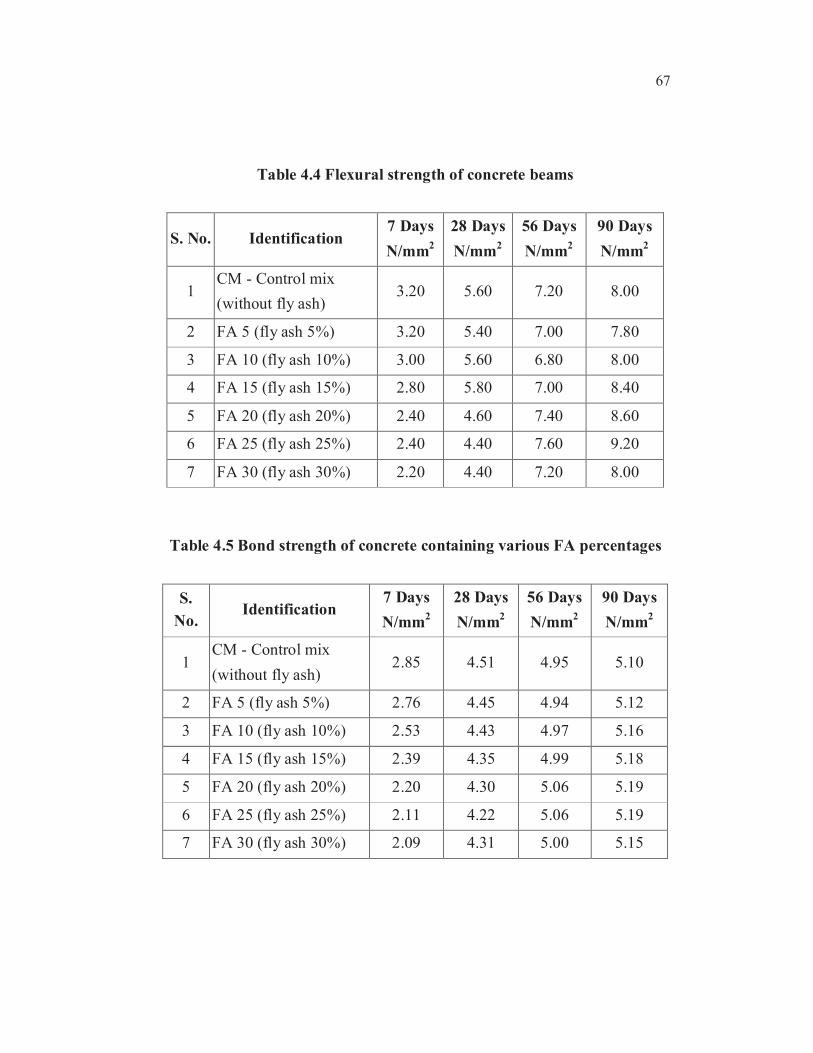
Figure 4.7 Graphical representation of compressive strength gain
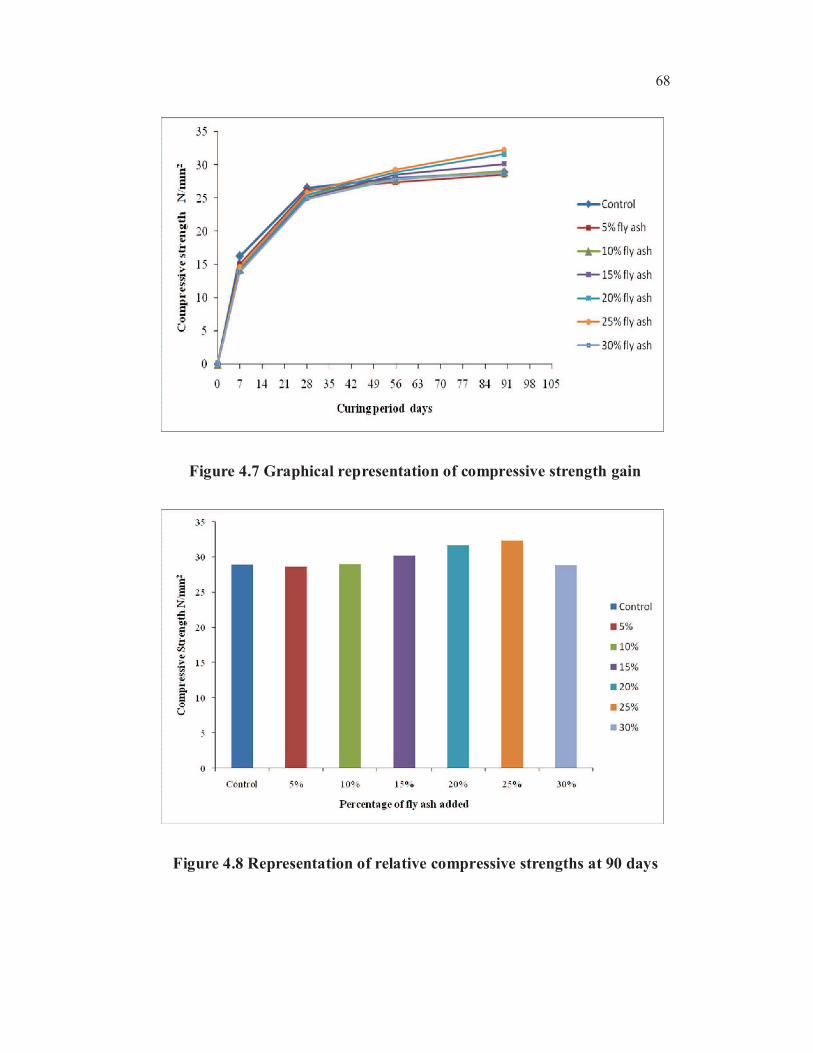
Figure 4.8 Representation of relative compressive strengths at 90 days
69
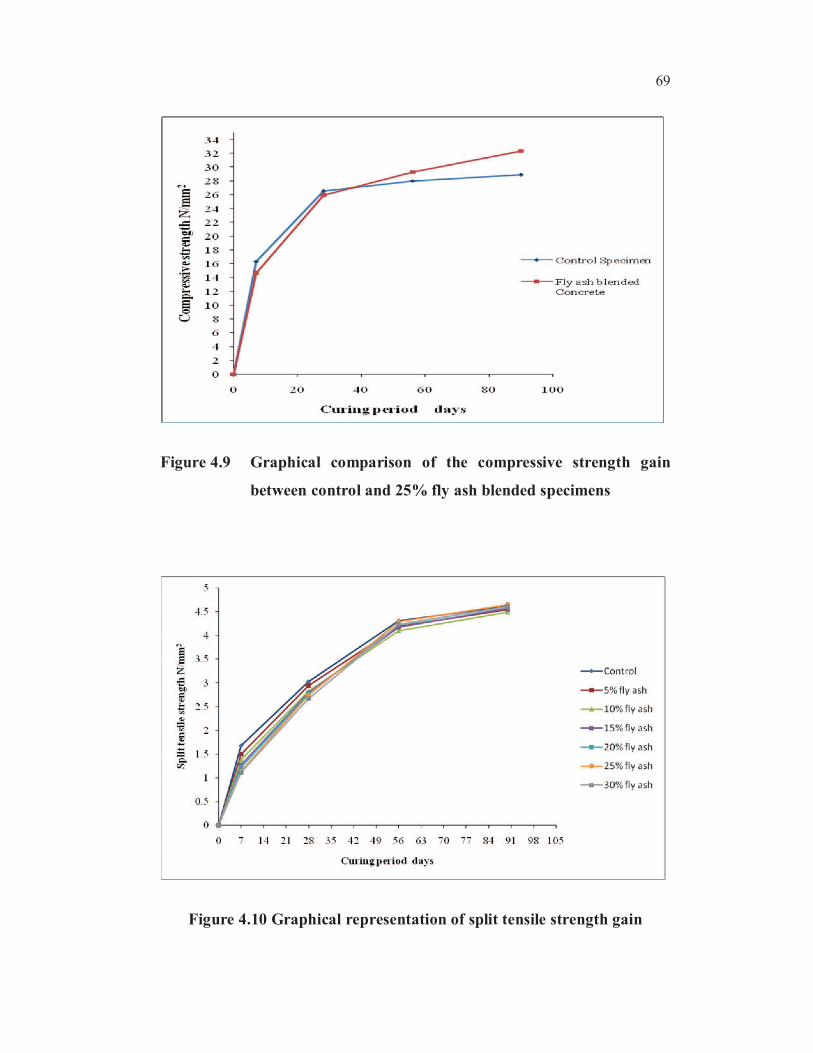
Figure 4.9 Graphical comparison of the compressive strength gain
between control and 25% fly ash blended specimens
Figure 4.10 Graphical representation of split tensile strength gain
70
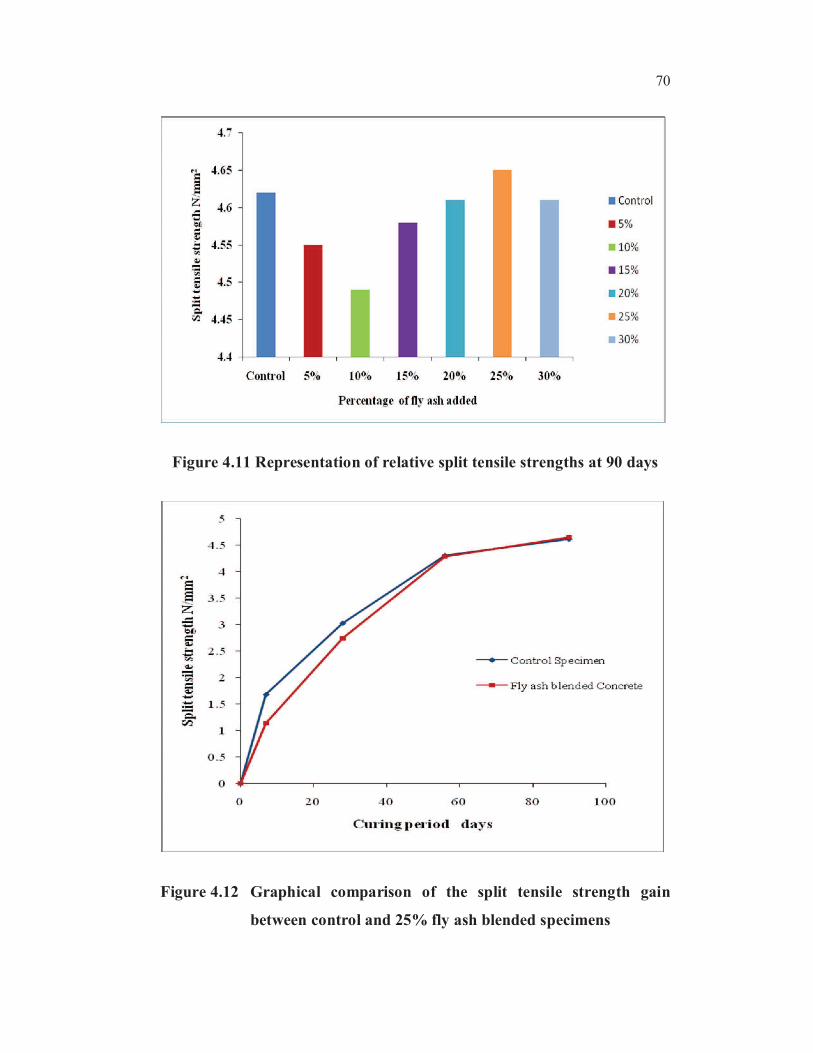
Figure 4.11 Representation of relative split tensile strengths at 90 days
Figure 4.12 Graphical comparison of the split tensile strength gain
between control and 25% fly ash blended specimens
71
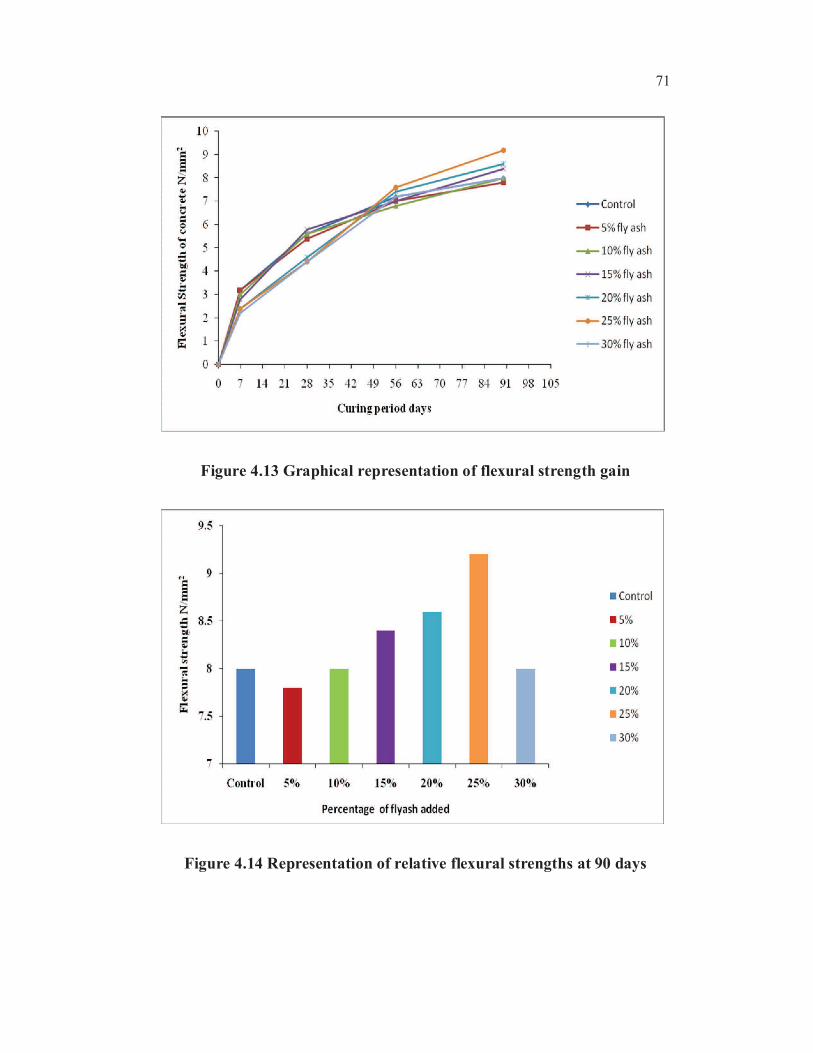
Figure 4.13 Graphical representation of flexural strength gain
Figure 4.14 Representation of relative flexural strengths at 90 days
72
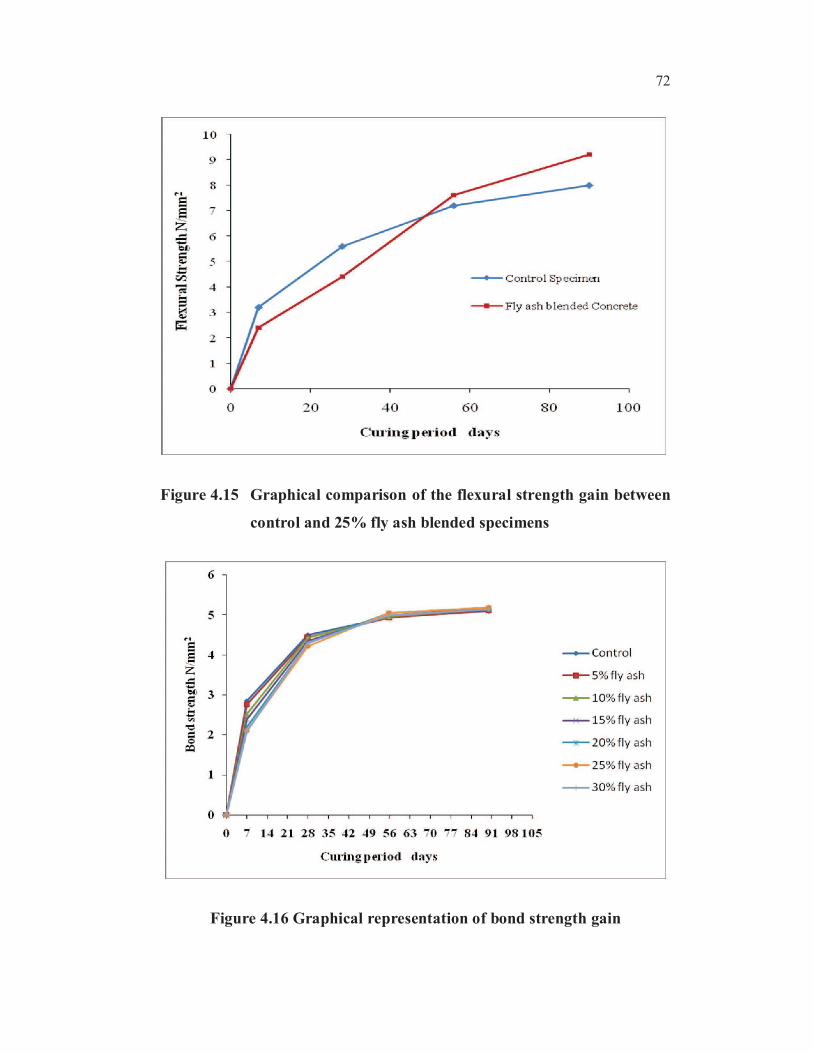
Figure 4.15 Graphical comparison of the flexural strength gain between
control and 25% fly ash blended specimens
Figure 4.16 Graphical representation of bond strength gain
73
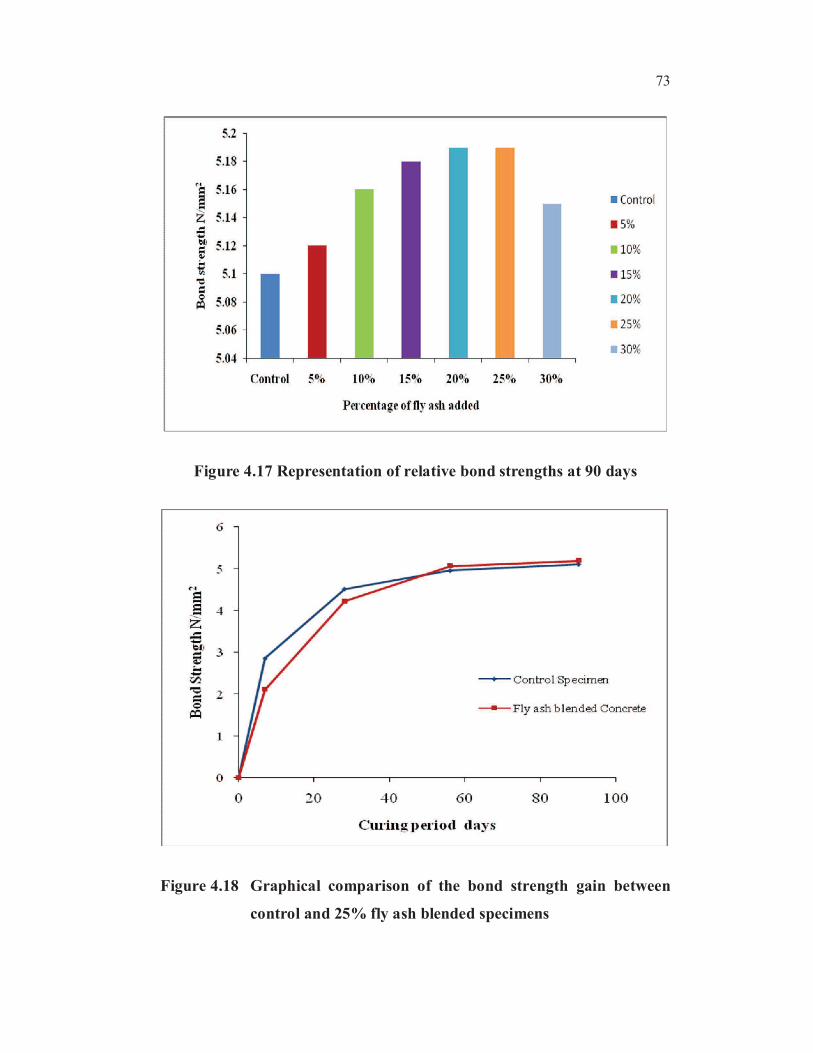
Figure 4.17 Representation of relative bond strengths at 90 days
Figure 4.18 Graphical comparison of the bond strength gain between
control and 25% fly ash blended specimens

74
4.5.1 Discussion on Test Results
Fly ash, when used in concrete upto certain proportions contributes
to the mechanical strength of concrete due to its pozzolanic reactivity.
However, since the pozzolanic reaction proceeds slowly, the initial
mechanical strengths of fly ash concrete tends to be lower than that of the
concrete without fly ash.
This phenomenon was observed in all the mechanical strength tests
performed until the 28 days strength. But later on, when the next set of
specimens where tested on the 56th day of casting, there was a change in the
trend. There was slight increase in compressive, flexural and bond strengths
particularly for 20 % blended fly ash concrete. The split tensile strengths of
the cylinders cast with 20 % fly ash almost attained the same values as that of
the control specimens. This change in trend continued and ultimately the 90
days strength of all the specimens in all the specified tests clearly over took
the strength values attained by normal concrete without fly ash. The effect
was more pronounced in 20 % replacement of fly ash concrete. This is due to
the continued pozzolanic reactivity taking place in the blended cement
hydration development at the curing cessation time. Hence concrete
developed greater strength at later age exceeding that of concrete without fly
ash. Pozzolanic reaction can only proceed in the presence of water or enough
moisture should be available for long time. Therefore fly ash concrete require
longer curing period. Hence to achieve this, the specimens were continuously
cured by complete immersion in water.
4.6 TESTS FOR EVALUATING MICRO STRUCTURAL
PROPERTIES
4.6.1 Water Absorption Test
Concrete cubes of 150mm size were cast along with each
proportion of mix. Three cubes were cast for the control mix and for each
75
percentage of fly ash added exclusively to determine the absorption of water.
Special care was taken to see that the cubes were free from observable cracks,
fissures and shattered edges.
The cube specimens after 90 days of water curing were dried in an
oven at temperature of around 100 to 110 C for 24 hours. The specimens
were allowed to cool in dry air and weighed. This procedure was repeated
until the difference between the two successive readings did not exceed 0.5%
of the lowest weight obtained. This weight was designated as A.
The weighed cube specimens were then immersed in water
approximately at about 20-25 C for 48 hours. The saturated weights of the
specimens were taken. Again the specimens were soaked in water for 24
hours and the weights of the specimens were taken once again to check if the
weights taken after 48 hours and 72 hours were not greater than 0.5% of the
heavier weight. The final surface dry weight was designated as B.
Percentage of water absorption: (B – A) /A x 100
A : Weight of the oven dried concrete specimen.
B : Weight of the surface dried concrete specimen after immersion.
The coefficient of water absorption as per ASTM C 642-97 was
also determined since it is a measure of water permeability
Coefficient of water absorption, Ka = {(Q/A)2}x1/t
Ka = Coefficient of water absorption
Q = Quantity of water absorbed by the oven dried specimen in
time t
A = Total surface area of concrete through which water penetrates
76
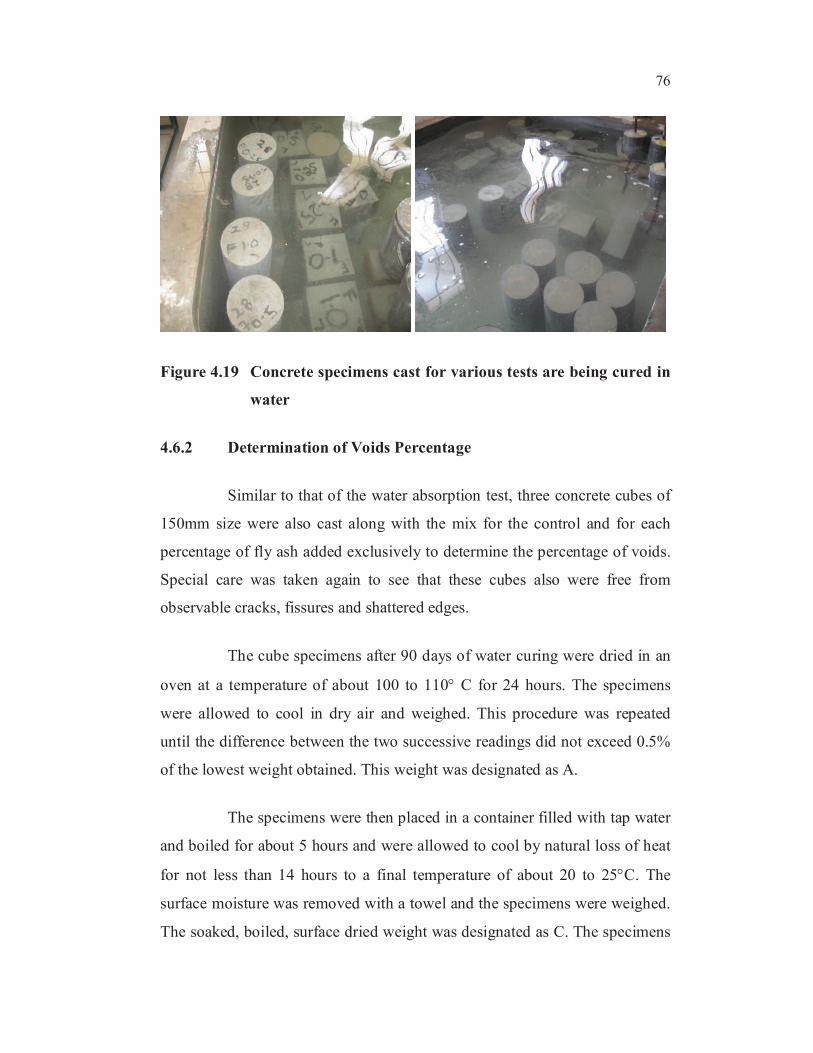
Figure 4.19 Concrete specimens cast for various tests are being cured in
water
4.6.2 Determination of Voids Percentage
Similar to that of the water absorption test, three concrete cubes of
150mm size were also cast along with the mix for the control and for each
percentage of fly ash added exclusively to determine the percentage of voids.
Special care was taken again to see that these cubes also were free from
observable cracks, fissures and shattered edges.
The cube specimens after 90 days of water curing were dried in an
oven at a temperature of about 100 to 110 C for 24 hours. The specimens
were allowed to cool in dry air and weighed. This procedure was repeated
until the difference between the two successive readings did not exceed 0.5%
of the lowest weight obtained. This weight was designated as A.
The specimens were then placed in a container filled with tap water
and boiled for about 5 hours and were allowed to cool by natural loss of heat
for not less than 14 hours to a final temperature of about 20 to 25 C. The
surface moisture was removed with a towel and the specimens were weighed.
The soaked, boiled, surface dried weight was designated as C. The specimens
77
were then suspended by a wire in water and the weights were taken. This
weight was designated as D.
Percentage of voids = (C – A)/(C – D) x 100.
where A - Weight of the oven dried concrete sample.
C - Weight of the surface dried concrete sample in air after
immersion and boiling
D - Weight of the concrete sample in water after immersion and
boiling.
4.6.3 Effective Porosity and Bulk Density
For determination of effective porosity of 90 days water cured
concrete samples, specimens of size 83mm diameter and 50mm thick were
cast and used. The specimens after curing were surface dried, weighed and
then kept in an oven at 105 C for 48 hours in order to completely evaporate
the moisture content present in the concrete. After weighing the oven dried
specimen and determining its bulk volume, the effective porosity was
determined by the relation
Effective porosity (%) = {(B-A)/V}x100
where B - saturated mass of the surface dry specimen in air after
immersion
A - mass of oven dried specimen in air
V - Bulk volume of the specimen
Bulk density values of the control concrete and for each percentage
of fly ash added were also determined.
78
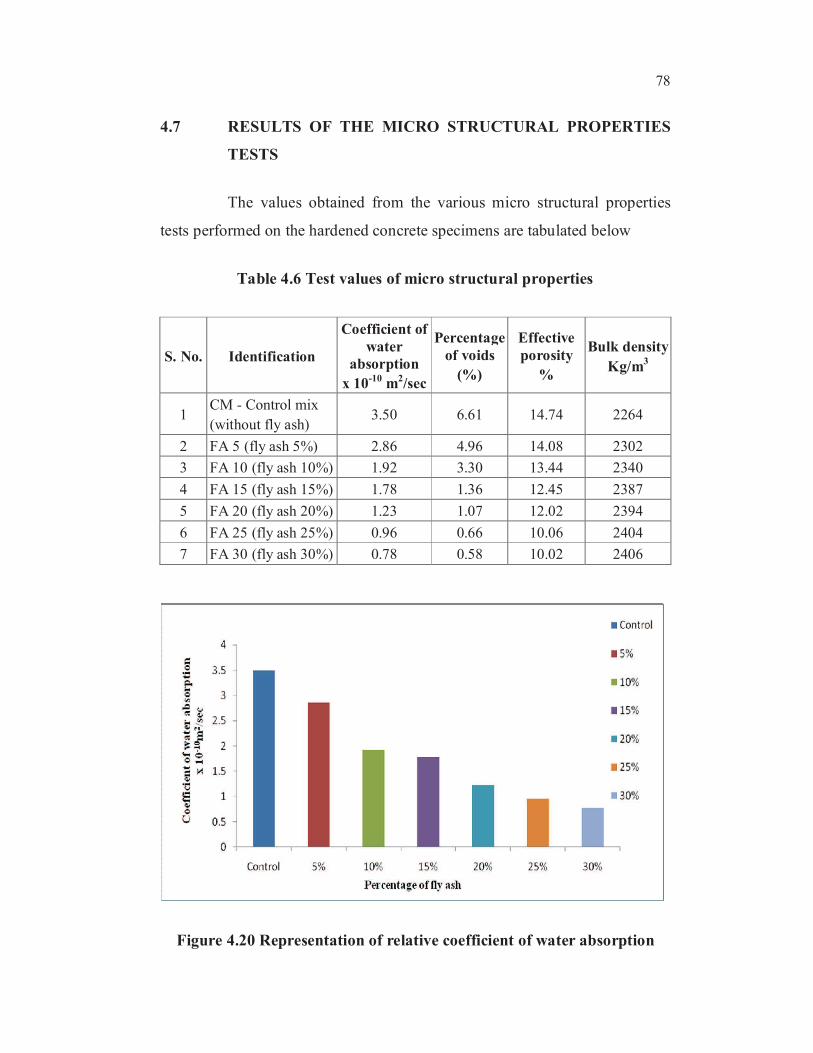
4.7 RESULTS OF THE MICRO STRUCTURAL PROPERTIES
TESTS
The values obtained from the various micro structural properties
tests performed on the hardened concrete specimens are tabulated below
Table 4.6 Test values of micro structural properties
S. No. Identification
Coefficient of
water
absorption
x 10-10
m2/sec
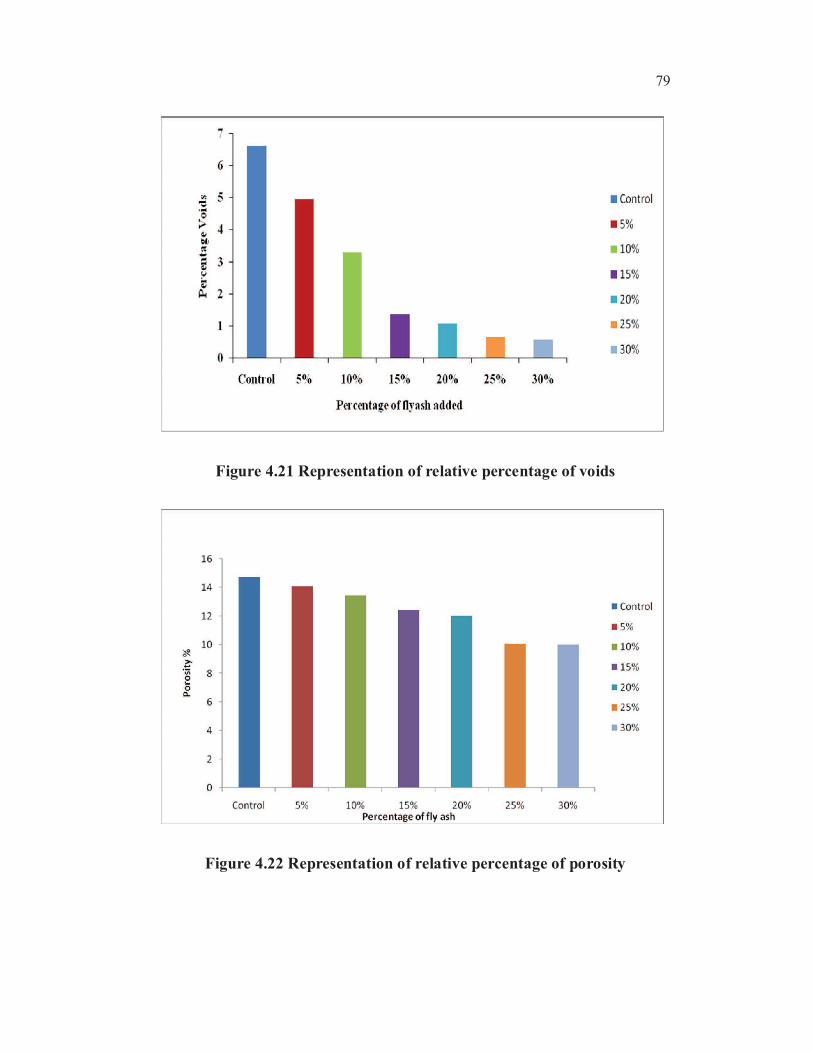
Percentage
of voids
(%)
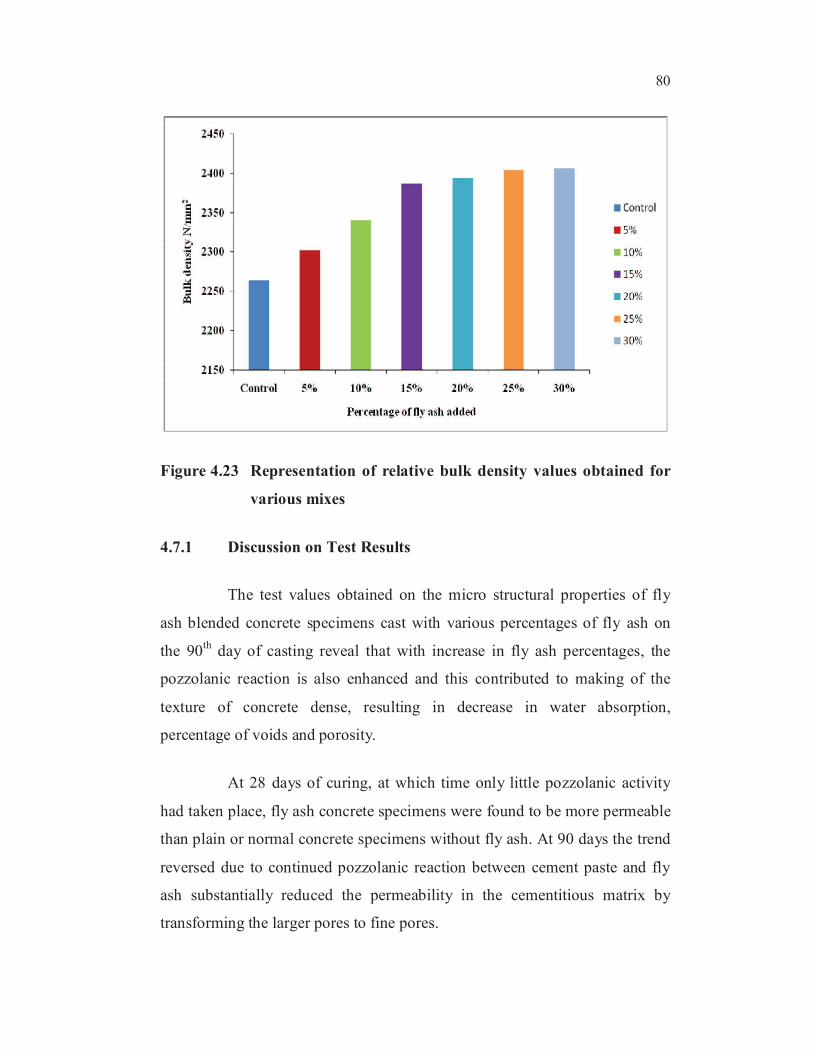
Effective
porosity
%
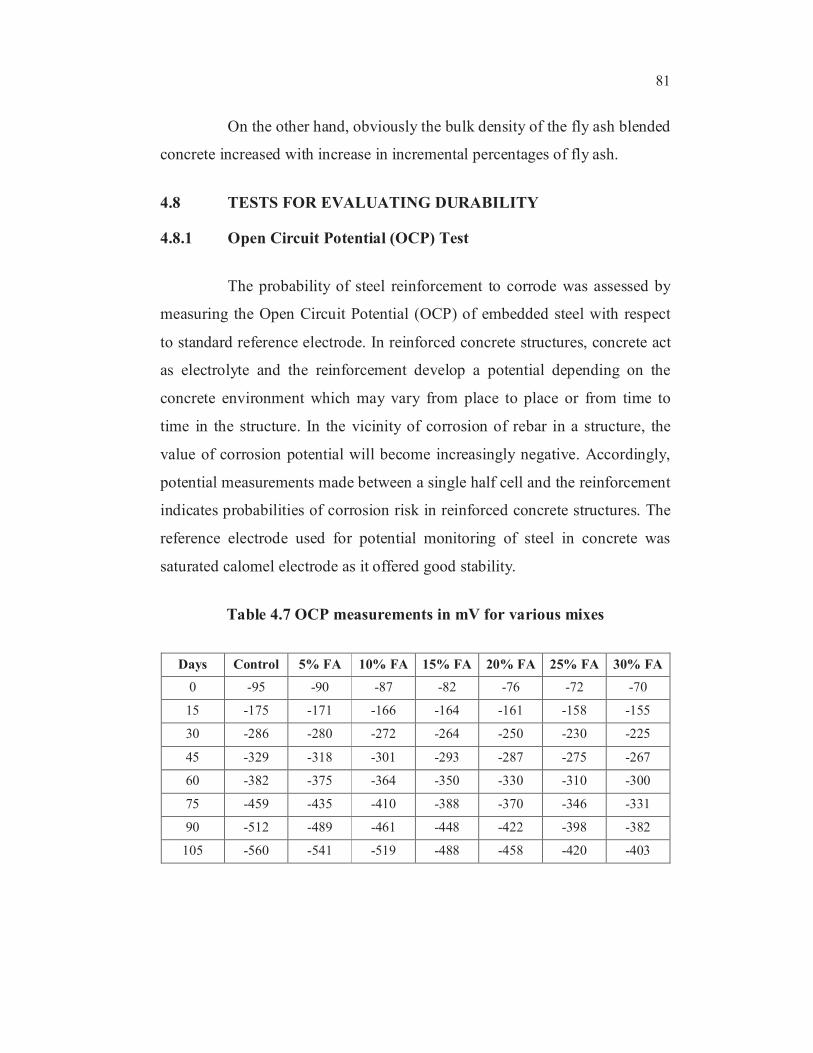
Bulk density
Kg/m3
1CM - Control mix
(without fly ash)3.50 6.61 14.74 2264
2 FA 5 (fly ash 5%) 2.86 4.96 14.08 2302
3 FA 10 (fly ash 10%) 1.92 3.30 13.44 2340
4 FA 15 (fly ash 15%) 1.78 1.36 12.45 2387
5 FA 20 (fly ash 20%) 1.23 1.07 12.02 2394
6 FA 25 (fly ash 25%) 0.96 0.66 10.06 2404
7 FA 30 (fly ash 30%) 0.78 0.58 10.02 2406
Figure 4.20 Representation of relative coefficient of water absorption
79
Figure 4.21 Representation of relative percentage of voids
Figure 4.22 Representation of relative percentage of porosity
80
Figure 4.23 Representation of relative bulk density values obtained for
various mixes
4.7.1 Discussion on Test Results
The test values obtained on the micro structural properties of fly
ash blended concrete specimens cast with various percentages of fly ash on
the 90th
day of casting reveal that with increase in fly ash percentages, the
pozzolanic reaction is also enhanced and this contributed to making of the
texture of concrete dense, resulting in decrease in water absorption,
percentage of voids and porosity.
At 28 days of curing, at which time only little pozzolanic activity
had taken place, fly ash concrete specimens were found to be more permeable
than plain or normal concrete specimens without fly ash. At 90 days the trend
reversed due to continued pozzolanic reaction between cement paste and fly
ash substantially reduced the permeability in the cementitious matrix by
transforming the larger pores to fine pores.
81
On the other hand, obviously the bulk density of the fly ash blended
concrete increased with increase in incremental percentages of fly ash.
4.8 TESTS FOR EVALUATING DURABILITY
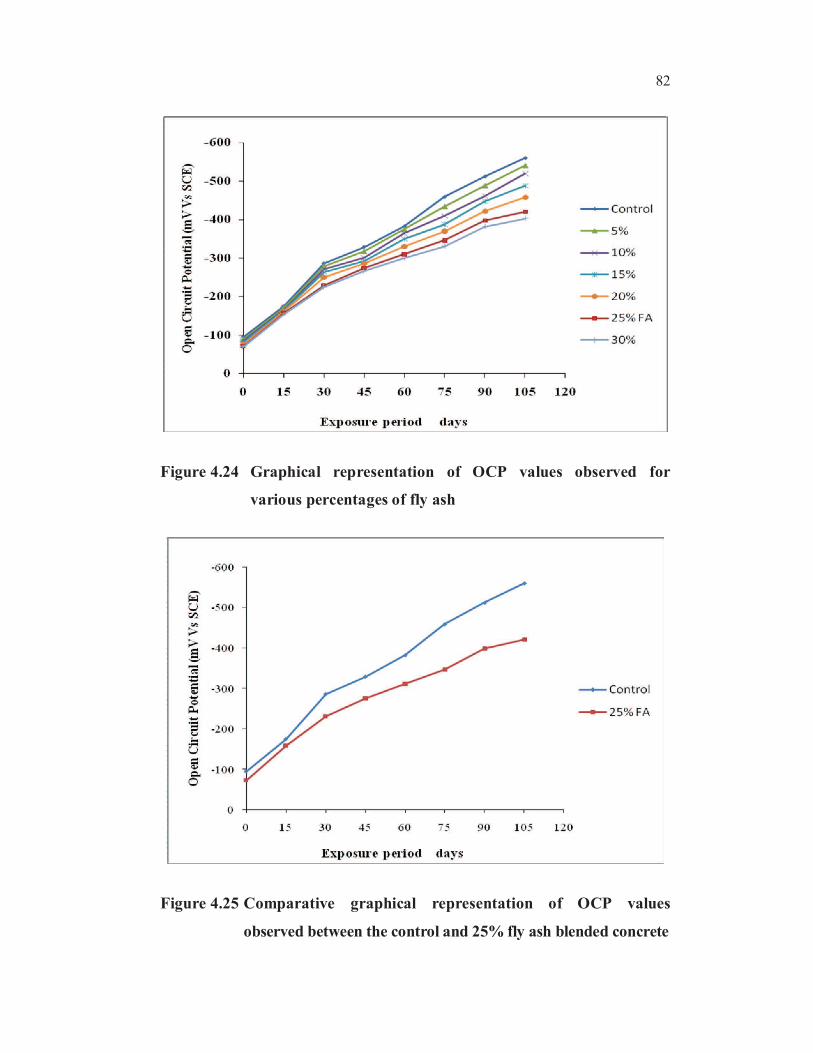
4.8.1 Open Circuit Potential (OCP) Test
The probability of steel reinforcement to corrode was assessed by
measuring the Open Circuit Potential (OCP) of embedded steel with respect
to standard reference electrode. In reinforced concrete structures, concrete act
as electrolyte and the reinforcement develop a potential depending on the
concrete environment which may vary from place to place or from time to
time in the structure. In the vicinity of corrosion of rebar in a structure, the
value of corrosion potential will become increasingly negative. Accordingly,
potential measurements made between a single half cell and the reinforcement
indicates probabilities of corrosion risk in reinforced concrete structures. The
reference electrode used for potential monitoring of steel in concrete was
saturated calomel electrode as it offered good stability.
Table 4.7 OCP measurements in mV for various mixes
Days Control 5% FA 10% FA 15% FA 20% FA 25% FA 30% FA
0 -95 -90 -87 -82 -76 -72 -70
15 -175 -171 -166 -164 -161 -158 -155
30 -286 -280 -272 -264 -250 -230 -225
45 -329 -318 -301 -293 -287 -275 -267
60 -382 -375 -364 -350 -330 -310 -300
75 -459 -435 -410 -388 -370 -346 -331
90 -512 -489 -461 -448 -422 -398 -382
105 -560 -541 -519 -488 -458 -420 -403
82
Figure 4.24 Graphical representation of OCP values observed for
various percentages of fly ash
Figure 4.25 Comparative graphical representation of OCP values
observed between the control and 25% fly ash blended concrete
83
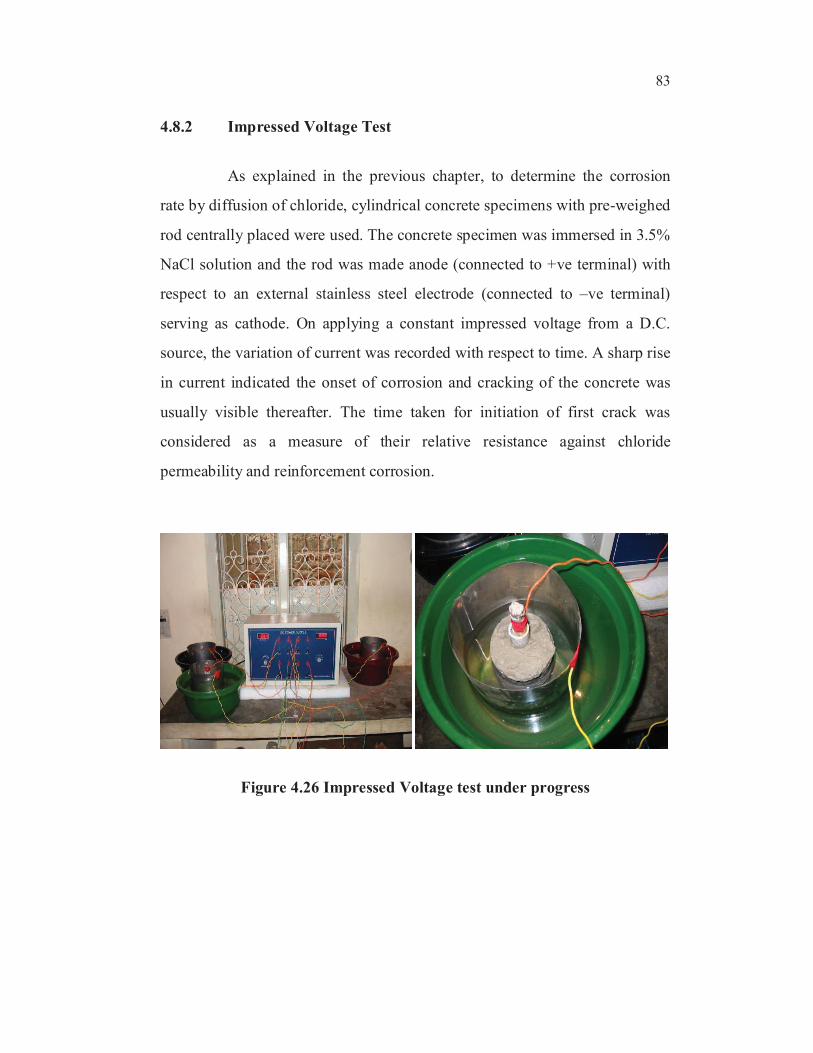
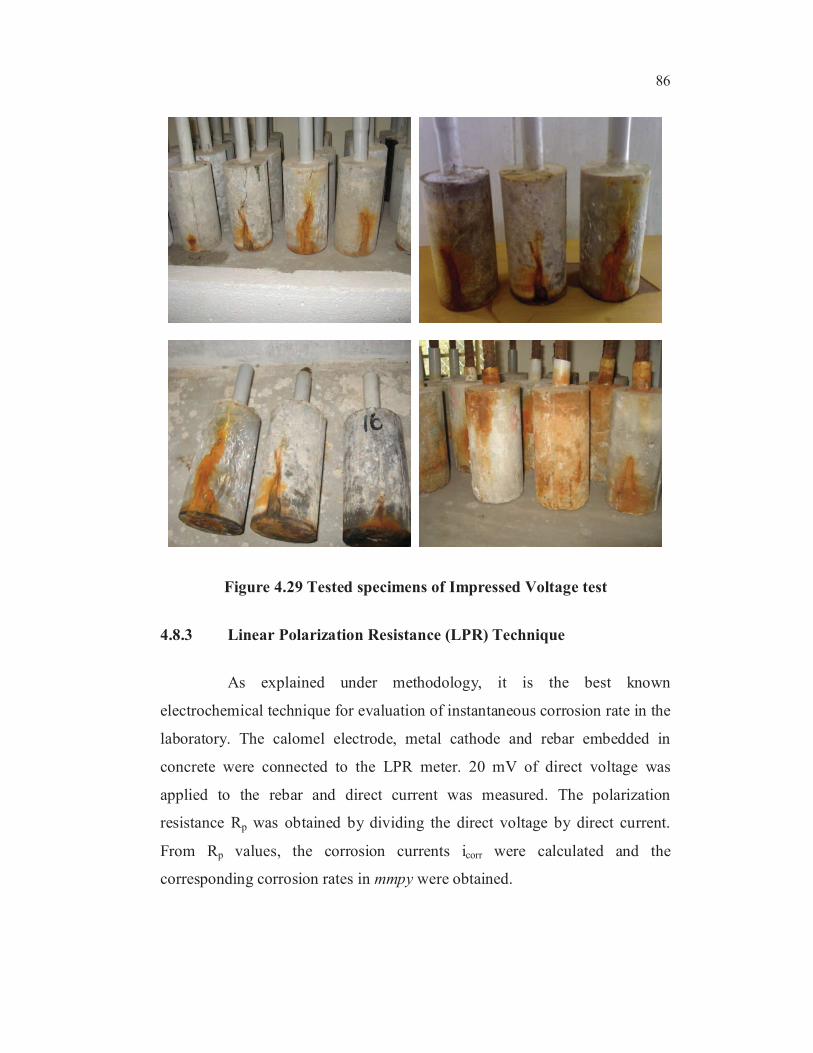
4.8.2 Impressed Voltage Test
As explained in the previous chapter, to determine the corrosion
rate by diffusion of chloride, cylindrical concrete specimens with pre-weighed
rod centrally placed were used. The concrete specimen was immersed in 3.5%
NaCl solution and the rod was made anode (connected to +ve terminal) with
respect to an external stainless steel electrode (connected to –ve terminal)
serving as cathode. On applying a constant impressed voltage from a D.C.
source, the variation of current was recorded with respect to time. A sharp rise
in current indicated the onset of corrosion and cracking of the concrete was
usually visible thereafter. The time taken for initiation of first crack was
considered as a measure of their relative resistance against chloride
permeability and reinforcement corrosion.
Figure 4.26 Impressed Voltage test under progress
84
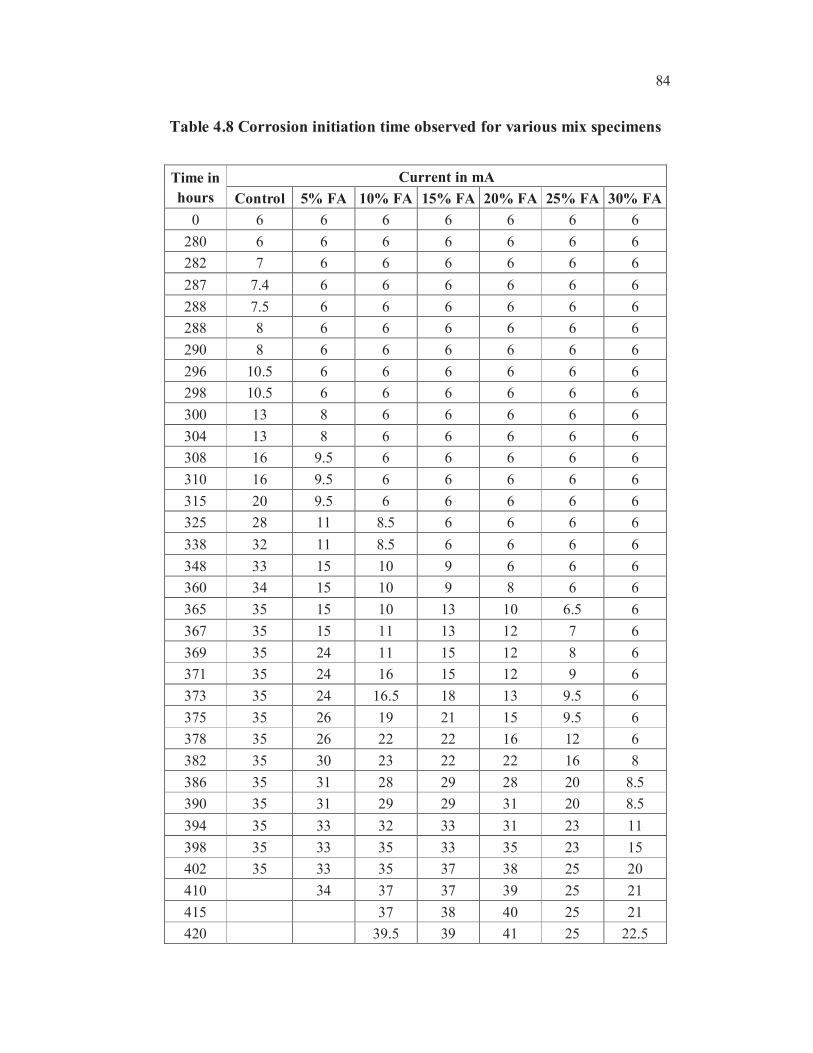
Table 4.8 Corrosion initiation time observed for various mix specimens
Time in
hours
Current in mA
Control 5% FA 10% FA 15% FA 20% FA 25% FA 30% FA
0 6 6 6 6 6 6 6
280 6 6 6 6 6 6 6
282 7 6 6 6 6 6 6
287 7.4 6 6 6 6 6 6
288 7.5 6 6 6 6 6 6
288 8 6 6 6 6 6 6
290 8 6 6 6 6 6 6
296 10.5 6 6 6 6 6 6
298 10.5 6 6 6 6 6 6
300 13 8 6 6 6 6 6
304 13 8 6 6 6 6 6
308 16 9.5 6 6 6 6 6
310 16 9.5 6 6 6 6 6
315 20 9.5 6 6 6 6 6
325 28 11 8.5 6 6 6 6
338 32 11 8.5 6 6 6 6
348 33 15 10 9 6 6 6
360 34 15 10 9 8 6 6
365 35 15 10 13 10 6.5 6
367 35 15 11 13 12 7 6
369 35 24 11 15 12 8 6
371 35 24 16 15 12 9 6
373 35 24 16.5 18 13 9.5 6
375 35 26 19 21 15 9.5 6
378 35 26 22 22 16 12 6
382 35 30 23 22 22 16 8
386 35 31 28 29 28 20 8.5
390 35 31 29 29 31 20 8.5
394 35 33 32 33 31 23 11
398 35 33 35 33 35 23 15
402 35 33 35 37 38 25 20
410 34 37 37 39 25 21
415 37 38 40 25 21
420 39.5 39 41 25 22.5
85
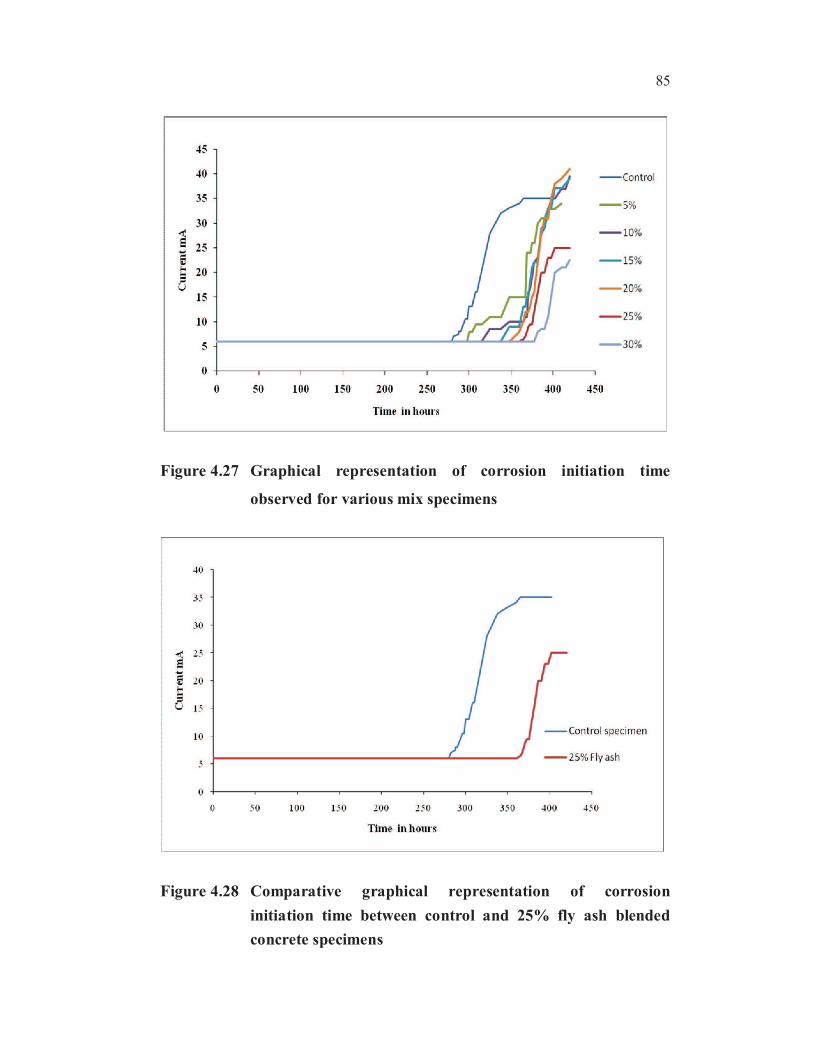
Figure 4.27 Graphical representation of corrosion initiation time
observed for various mix specimens
Figure 4.28 Comparative graphical representation of corrosion
initiation time between control and 25% fly ash blended
concrete specimens
86
Figure 4.29 Tested specimens of Impressed Voltage test
4.8.3 Linear Polarization Resistance (LPR) Technique
As explained under methodology, it is the best known
electrochemical technique for evaluation of instantaneous corrosion rate in the
laboratory. The calomel electrode, metal cathode and rebar embedded in
concrete were connected to the LPR meter. 20 mV of direct voltage was
applied to the rebar and direct current was measured. The polarization
resistance Rp was obtained by dividing the direct voltage by direct current.
From Rp values, the corrosion currents icorr were calculated and the
corresponding corrosion rates in mmpy were obtained.
87
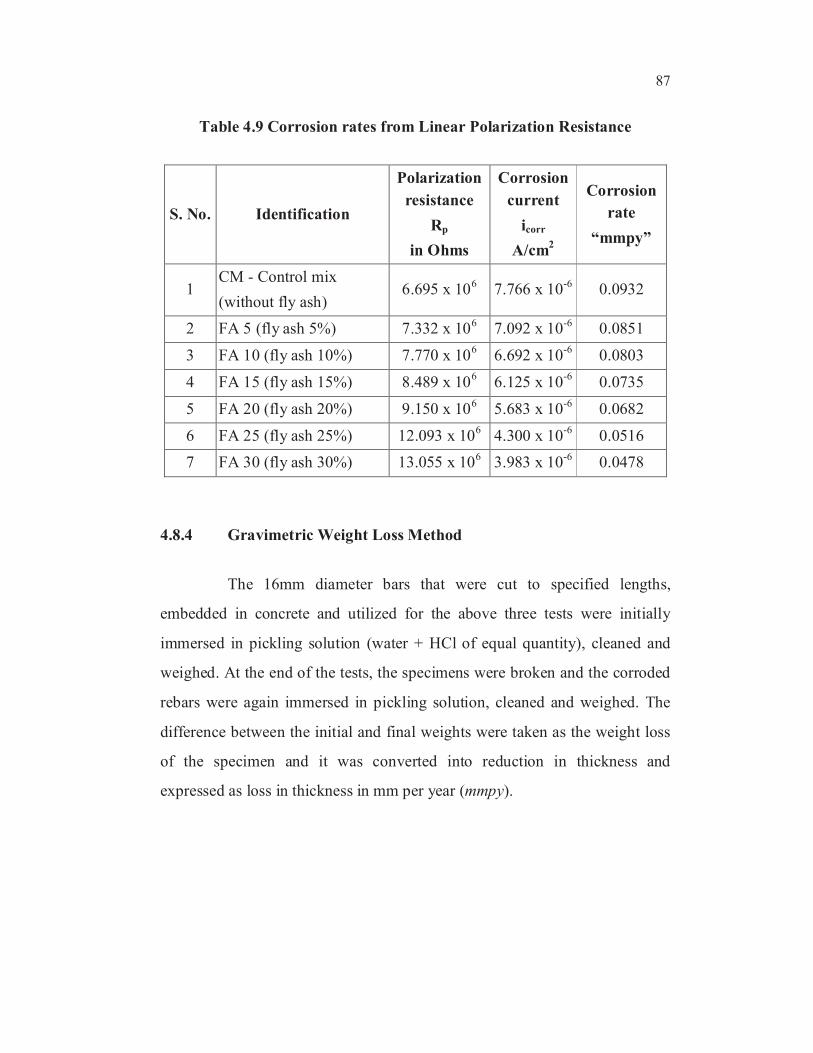
Table 4.9 Corrosion rates from Linear Polarization Resistance
S. No. Identification
Polarization
resistance
Rp
in Ohms
Corrosion
current
icorr
A/cm2
Corrosion
rate
“mmpy”
1CM - Control mix
(without fly ash)6.695 x 10⁶ 7.766 x 10⁻⁶ 0.0932
2 FA 5 (fly ash 5%) 7.332 x 10⁶ 7.092 x 10⁻⁶ 0.0851
3 FA 10 (fly ash 10%) 7.770 x 10⁶ 6.692 x 10
-60.0803
4 FA 15 (fly ash 15%) 8.489 x 10⁶ 6.125 x 10
-60.0735
5 FA 20 (fly ash 20%) 9.150 x 10⁶ 5.683 x 10⁻⁶ 0.0682
6 FA 25 (fly ash 25%) 12.093 x 10⁶ 4.300 x 10
-60.0516
7 FA 30 (fly ash 30%) 13.055 x 10⁶ 3.983 x 10⁻⁶ 0.0478
4.8.4 Gravimetric Weight Loss Method
The 16mm diameter bars that were cut to specified lengths,
embedded in concrete and utilized for the above three tests were initially
immersed in pickling solution (water + HCl of equal quantity), cleaned and
weighed. At the end of the tests, the specimens were broken and the corroded
rebars were again immersed in pickling solution, cleaned and weighed. The
difference between the initial and final weights were taken as the weight loss
of the specimen and it was converted into reduction in thickness and
expressed as loss in thickness in mm per year (mmpy).
88
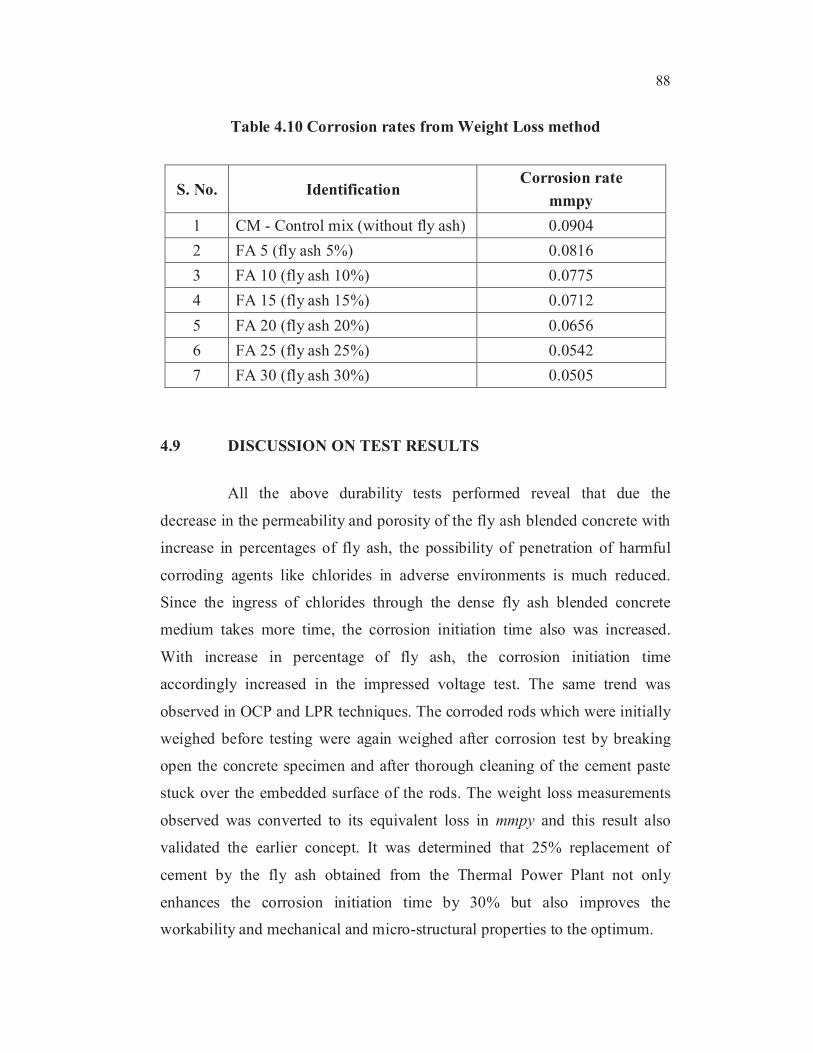
Table 4.10 Corrosion rates from Weight Loss method
S. No. IdentificationCorrosion rate
mmpy
1 CM - Control mix (without fly ash) 0.0904
2 FA 5 (fly ash 5%) 0.0816
3 FA 10 (fly ash 10%) 0.0775
4 FA 15 (fly ash 15%) 0.0712
5 FA 20 (fly ash 20%) 0.0656
6 FA 25 (fly ash 25%) 0.0542
7 FA 30 (fly ash 30%) 0.0505
4.9 DISCUSSION ON TEST RESULTS
All the above durability tests performed reveal that due the
decrease in the permeability and porosity of the fly ash blended concrete with
increase in percentages of fly ash, the possibility of penetration of harmful
corroding agents like chlorides in adverse environments is much reduced.
Since the ingress of chlorides through the dense fly ash blended concrete
medium takes more time, the corrosion initiation time also was increased.
With increase in percentage of fly ash, the corrosion initiation time
accordingly increased in the impressed voltage test. The same trend was
observed in OCP and LPR techniques. The corroded rods which were initially
weighed before testing were again weighed after corrosion test by breaking
open the concrete specimen and after thorough cleaning of the cement paste
stuck over the embedded surface of the rods. The weight loss measurements
observed was converted to its equivalent loss in mmpy and this result also
validated the earlier concept. It was determined that 25% replacement of
cement by the fly ash obtained from the Thermal Power Plant not only
enhances the corrosion initiation time by 30% but also improves the
workability and mechanical and micro-structural properties to the optimum.