chapter 4. coal ash beneficial use (conventional ash
TRANSCRIPT

CHAPTER 4. COAL ASH BENEFICIAL USE (CONVENTIONAL ASH PLACEMENT) ON ANTHRACITE MINE SITES
Roger J. Hornberger, Sharon A. Hill, Michael J. Menghini,
Thomas D. Owen, Daniel J. Koury 4.1 INTRODUCTION
The spatial distribution of permitted beneficial use coal ash sites in the Anthracite Region is closely related to several key aspects of the mining history of the region. One hundred and five years of anthracite coal production (1890 – 1995) is shown in Figure 2.19 (from Eggleston, et al. 1999), wherein underground mining accounted for most of the coal production prior to 1950, and surface mine production increased steadily from the 1920’s and surpassed deep mining by around 1960.
Underground mining in the Anthracite Region started out small in the late 1700’s, but by 1850, there were 1000-foot deep shafts and extensive lateral development of gangways and rock tunnels in numerous collieries of the anthracite coal fields. Historical accounts of this early mine development in the region are found in Miller and Sharpless (1985) and Wallace (1981). The Department of Mines and Mineral Industries of the Commonwealth of Pennsylvania produced annual reports of coal production from 1870 to 1972, and its successors, the Pennsylvania Department of Environmental Resources and the Pennsylvania Department of Environmental Protection, produced these statistical reports from 1972 to the present. Those reports state that there was no accurate record of underground mine production prior to 1870, that anthracite coal production for that year was 14,172,004 tons, and that anthracite production peaked in 1917, at 100,445,299 tons. In addition to the extensive network of colliery development features underground, the effects of all of this anthracite mining on the landscape of the anthracite region included thousands of large coal refuse (or culm) banks, and many thousands of mine subsidence features. For example, the giant refuse bank at the Westwood Colliery in the Southern Anthracite Field, located adjacent to Interstate 81 in Schuylkill County, marked the gateway to the Anthracite Region for northbound travelers; and the huge coal refuse banks of the Glen Burn Colliery in the Western Middle Field, draped over the nose of the Big Mountain water gap of the Shamokin Creek, tend to dwarf the community of Shamokin hundreds of feet below. The statistical reports of the Department of Mines and Mineral Industries state that there were no accurate records of stripping (surface mine) production of anthracite prior to 1932. Stripping production for that year was 3,545,948 tons, and stripping production peaked in 1948 at 13,485,837 tons. By the 1940’s advances in the development of large surface mining equipment, and the demand for anthracite related to World War II industrial development efforts, facilitated the development of large open-pit surface mines several hundred feet deep. Many of these large open-pit mines and thousands of smaller surface mine pits were abandoned prior to the enactment of laws requiring surface mine reclamation.
71

The Pennsylvania Clean Streams Law was passed in 1937, but the treatment of mine drainage from anthracite and bituminous coal mines (underground and surface mines) was exempted until an amendment to that law required the commencement of treatment in 1966. That amendment signaled the decline of the anthracite underground mining industry, because many of the large active collieries shut down to avoid constructing and operating large mine drainage treatment facilities for their voluminous pumped discharges. The Surface Mine Reclamation Act of Pennsylvania became law in 1945, but it lacked significant backfilling and revegetation requirements until the amendments of 1963 and 1971. By that time, most of the extensive damage to the lands and waters of the Anthracite Region had already been done. The significant growth in the use of coal ash in mine reclamation in the anthracite and bituminous coal regions of Pennsylvania in the past 20 years is principally due to three regulatory developments: 1) the enactment of the federal Public Utility Regulatory Policies Act (PURPA) in 1978 and related regulations of the Federal Energy Regulatory Commission (FERC), which facilitated the development of the culm burning cogeneration plants, 2) the development of DEP policies and procedures in 1986 authorizing the Bureaus of Mining and Reclamation (BMR) and District Mining Operations (DMO) to issue permits for the use of coal ash in reclaiming active and abandoned mine lands within Surface Mining Permits (SMP) boundaries, pursuant to the Solid Waste Management Act of 1980, and 3) the promulgation of specific regulations for the beneficial use of coal ash in 1992 by the Pennsylvania Environmental Quality Board (25 Pa. Code Sections 287.661 through 287.666). These regulatory enhancements resulted in the construction of nine cogeneration plants in the anthracite region shown on Figure 1.1, and the issuance of 51 permits for coal ash use in mine reclamation by the Pottsville District Office of District Mining Operations from 1986 through 2003. The permitted coal ash placement sites are shown on Figure 4.1.
The nine anthracite region cogeneration plants account for 38.14 million tons of the coal ash beneficially used for abandoned mine reclamation shown in Table 1.1. The coal ash placement sites associated with these 9 fluidized bed combustion (FBC) plants represent the greatest volume of coal ash and the largest acreage of abandoned mine land reclamation with coal ash in the anthracite region. However, many of the 51 permits issued by the Pottsville District Office were for the use of coal ash from pulverized coal power plants in Pennsylvania and other states, which is transported to the anthracite region by truck and rail for use in the reclamation of active and abandoned pits on these surface mining permits. Many of the yellow dots on Figure 4.1 represent coal ash placement mine sites that are not located at or near a FBC plant, such as the Alden mine site shown in Figures 4.3 and 4.4.
72

Figure 4.1. Location of coal ash beneficial use mine sites in PA.
The cogeneration plant concept is perfectly suited to the Anthracite Region because these facilities remove abandoned coal refuse banks, mix the culm with limestone in their circulating fluidized-bed combustors, producing an alkaline coal ash, and use the coal ash to reclaim abandoned pits and other abandoned mine land (AML) features. Therefore, multiple environmental benefits accrue from the removal of unsightly, acid-producing culm banks, the backfilling of AML features and the reduction of acid mine drainage pollution. In addition, social and economic benefits result from jobs related to the production of electrical power and by-product usage of steam (e.g. growing hydroponic flowers and tomatoes) in an area with a depressed economy. The cogeneration plants would be impossible without the development of the circulating fluidized bed boilers. PURPA created the business opportunity, and the circulating fluidized bed technology made it possible to burn the waste coal material. Figure 4.2 shows the Westwood FBC plant under construction in 1985 and the large coal refuse pile adjacent to Interstate 81 in Schuylkill County.
73

Figure 4.2. Westwood FBC plant near Tremont in Southern Anthracite Field.
Of the nine FBC plants constructed in the Anthracite Region, one was in the Northern Field, four are in the Western Middle Field, two are in the Southern Field, and two are located outside of the coal fields (but haul culm from the coal fields, and haul coal ash back for mine reclamation). These nine FBC plants in the Anthracite Region are generically called cogeneration plants, but three of them are actually classified as “small power producers”, rather than cogeneration plants, under FERC regulations. That is because the term cogeneration implies the generation of steam or some other energy source, in addition to electrical power production. The millions of tons of coal refuse consumed by these plants, volume of coal ash produced and acres of mine land reclaimed are tabulated and graphed in Chapter 1. Additional information on the regulatory developments and requirements for beneficial use of coal ash is found in Chapter 1, 25 PA Code Chapter 287 and Scheetz et al. (1997). 4.2 MONITORING REQUIREMENTS
The physical and chemical properties of coal ash are monitored and evaluated by DEP through permitting and inspection activities at coal ash placement sites. The overall monitoring requirements are described in more detail in Chapter 1 and the interrelationships of the physical properties are described in an engineering context in Chapter 3. Groundwater monitoring associated with coal ash placement at anthracite mine sites generally depends upon an understanding of the minepool hydrology. Almost all of the refuse bank reprocessing and strip
74
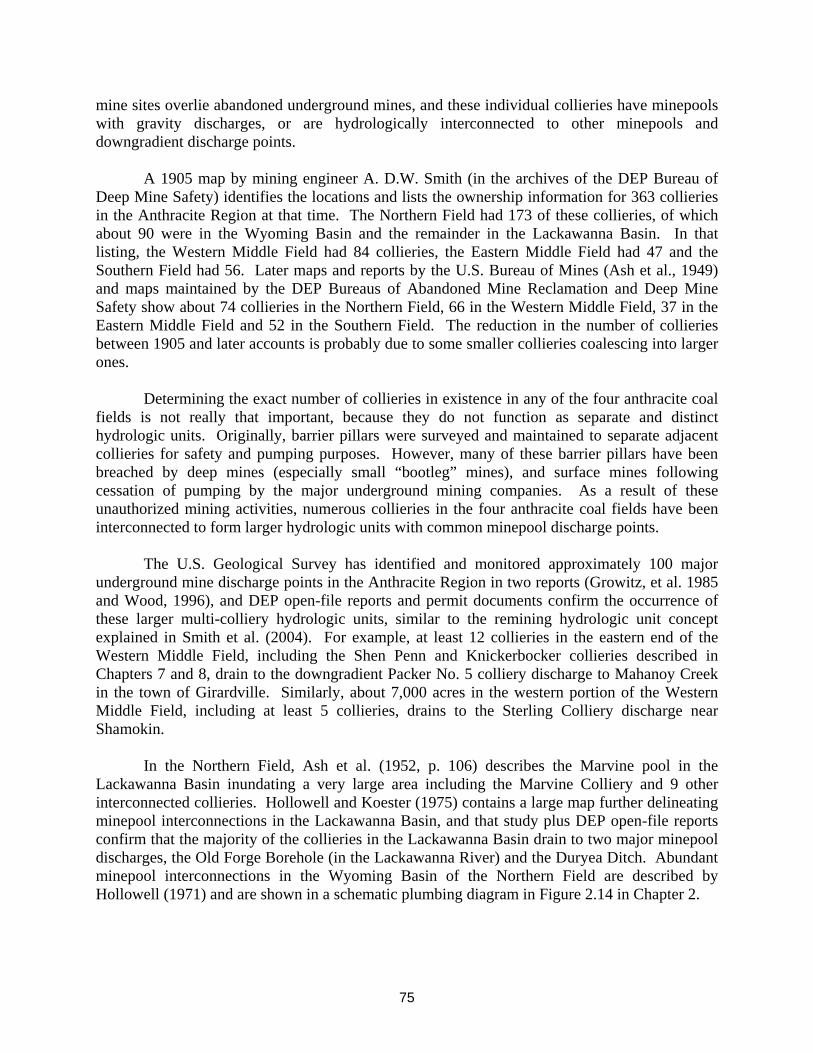
mine sites overlie abandoned underground mines, and these individual collieries have minepools with gravity discharges, or are hydrologically interconnected to other minepools and downgradient discharge points.
A 1905 map by mining engineer A. D.W. Smith (in the archives of the DEP Bureau of Deep Mine Safety) identifies the locations and lists the ownership information for 363 collieries in the Anthracite Region at that time. The Northern Field had 173 of these collieries, of which about 90 were in the Wyoming Basin and the remainder in the Lackawanna Basin. In that listing, the Western Middle Field had 84 collieries, the Eastern Middle Field had 47 and the Southern Field had 56. Later maps and reports by the U.S. Bureau of Mines (Ash et al., 1949) and maps maintained by the DEP Bureaus of Abandoned Mine Reclamation and Deep Mine Safety show about 74 collieries in the Northern Field, 66 in the Western Middle Field, 37 in the Eastern Middle Field and 52 in the Southern Field. The reduction in the number of collieries between 1905 and later accounts is probably due to some smaller collieries coalescing into larger ones.
Determining the exact number of collieries in existence in any of the four anthracite coal fields is not really that important, because they do not function as separate and distinct hydrologic units. Originally, barrier pillars were surveyed and maintained to separate adjacent collieries for safety and pumping purposes. However, many of these barrier pillars have been breached by deep mines (especially small “bootleg” mines), and surface mines following cessation of pumping by the major underground mining companies. As a result of these unauthorized mining activities, numerous collieries in the four anthracite coal fields have been interconnected to form larger hydrologic units with common minepool discharge points.
The U.S. Geological Survey has identified and monitored approximately 100 major underground mine discharge points in the Anthracite Region in two reports (Growitz, et al. 1985 and Wood, 1996), and DEP open-file reports and permit documents confirm the occurrence of these larger multi-colliery hydrologic units, similar to the remining hydrologic unit concept explained in Smith et al. (2004). For example, at least 12 collieries in the eastern end of the Western Middle Field, including the Shen Penn and Knickerbocker collieries described in Chapters 7 and 8, drain to the downgradient Packer No. 5 colliery discharge to Mahanoy Creek in the town of Girardville. Similarly, about 7,000 acres in the western portion of the Western Middle Field, including at least 5 collieries, drains to the Sterling Colliery discharge near Shamokin.
In the Northern Field, Ash et al. (1952, p. 106) describes the Marvine pool in the Lackawanna Basin inundating a very large area including the Marvine Colliery and 9 other interconnected collieries. Hollowell and Koester (1975) contains a large map further delineating minepool interconnections in the Lackawanna Basin, and that study plus DEP open-file reports confirm that the majority of the collieries in the Lackawanna Basin drain to two major minepool discharges, the Old Forge Borehole (in the Lackawanna River) and the Duryea Ditch. Abundant minepool interconnections in the Wyoming Basin of the Northern Field are described by Hollowell (1971) and are shown in a schematic plumbing diagram in Figure 2.14 in Chapter 2.
75
In the Eastern Middle Field, approximately 21,000 acres (32.24 square miles) of the Hazleton Basin and several other basins shown on Figure 2.15 (from Hollowell, 1999 and Ballaron, 1999) drain to the Jeddo Tunnel through a series of rock tunnels. This tunnel system was engineered circa 1900 to interconnect the collieries and produce one major (average 40,000 gpm) gravity discharge, to avoid pumping costs and pumping problems prior to the Clean Streams Law of 1937. The Southern Field has gravity drainage tunnels of a smaller scale, (e.g. the Lausanne Tunnel, draining several collieries at the eastern end of that field directly into the Lehigh River). The Southern Field also has many breaches in the barrier pillars identified in Ash et al. (1949) and described in DEP open-file reports for other collieries throughout the Southern Field, in areas draining to the Schuylkill and Susquehanna Rivers. Therefore, these multi-colliery hydrologic units exist in all four anthracite coal fields.
The anthracite minepool interconnections are described above to provide illustrations of the potential difficulties and complexities of developing realistic groundwater monitoring plans for some anthracite surface mine and coal ash placement sites. The simplified residual-waste monitoring concept of an upgradient monitoring well to document ambient groundwater quality of the aquifer, and one or more downgradient monitoring wells to detect and capture any groundwater pollution emanating from the site, is not applicable to many anthracite mine sites. Thus, the configuration of voids within the underground mine workings (i.e. gangways, cross-cut rock tunnels, slopes, shafts, etc.) is evaluated to select potential upgradient and downgradient monitoring well locations and the presence of breaches in barrier pillars is considered in determining groundwater (minepool) flow patterns.
It is not difficult to locate good well sites on the detailed maps of the abandoned underground mines (i.e. on 1” = 100’ scale maps in DEP and mining company archives), but it is often difficult to find the target subsurface mine voids in the field by drilling, and to complete the well to function effectively as a long-term groundwater monitoring point. Some of these difficulties may be related to coordinating the historical underground mine survey control points with present day land surface survey control points. Other difficulties may occur during drilling, where the correct surface point and correct subsurface target (e.g. gangways or rock cross-cut tunnel) are properly located, but voids are encountered before intercepting the minepool, which may result in collapse of the drill hole or loss of air in air rotary drilling. In other cases, a well is drilled to the correct subsurface target mine void in competent rock, but it does not capture the true representative water quality of the minepool, or the well is fouled or rendered useless after drilling. For example, in a recent cooperative drilling project involving DEP and a coal company in the Southern Field, a borehole was successfully drilled approximately 400 feet to intercept the minepool at the intersection of the main slope and a Mammoth seam gangway, but by the next day most of the drill hole was filled with fine coal silt that choked the hole. A coal preparation plant operated on that site after the major underground mine closed, and apparently it flushed coal fines down the main slope or a nearby borehole, which migrated into the new monitoring well overnight. These potential problems are presented here so the reader can appreciate the state of the art and science of drilling monitoring wells to intercept anthracite minepools, and to acknowledge the importance of coordinating expertise in mining engineering, geology, and borehole drilling procedures in successfully completing meaningful monitoring wells.
76

Monitoring wells are no doubt a primary tool for use in obtaining groundwater sample data to evaluate the performance of coal ash on mine reclamation sites. The goal is to develop a group of wells to facilitate sampling of background groundwater/minepool water quality, and to determine if there are any adverse or beneficial effects of coal ash upon minepool quality. At many of these surface mine sites, all of the monitoring wells drilled to intercept the minepool will yield samples of abandoned mine drainage pollution, regardless of whether the well is located upgradient or downgradient of the ash placement area, or the sample is collected before or after the placement of significant quantities of coal ash. Hence, groundwater samples from these wells are likely to exceed drinking water standards. for one or more analytes associated with mine drainage pollution, including acidity, sulfate, TDS, iron, manganese, aluminum, zinc and other metals of concern. These exceedances of numerical water quality guidelines may be temporary or permanent, based upon seasonal variations, and other factors that may be related to the “background” mine drainage pollution, the coal ash placement activities, or other sources of pollution introduced to the minepool flow system (e.g. industrial pollution, sewage, abandoned waste disposal/superfund sites, etc.). Therefore, it is ideal to develop, at least a pair of wells, located immediately upgradient and downgradient of the coal ash placement area, in order to obtain groundwater samples for comparison of analyte concentrations, as independent as possible of other sources of pollution. Past practice has demonstrated that this ideal case often cannot be achieved, so the industry, consultants, and regulatory agency geologists have to do the best they can to obtain and interpret groundwater/minepool data from reasonably available monitoring wells and other minepool sampling points (e.g. shafts, airways).
Shafts are major vertical openings into abandoned anthracite collieries. They were strategically located during underground mine development to be centers of activity within the mine, and typically were situated near to the center of the mine complex to serve as the main point of ingress and egress from the mine. During active mining these shafts functioned like elevator shafts, to lower men and equipment into the mine, and hoist the coal and men to the surface from the depths of the mine. Post-mining, these shafts are still significant windows to gain observations of the subsurface, and they can function as excellent groundwater monitoring points if the structural integrity of the shaft has not been compromised over time (e.g. it may no longer be plumb due to mining/robbing of the reservation pillar surrounding the shaft, or mine subsidence collapses may have occurred in coal veins near the shaft preventing access of sampling equipment to the full depth of the shaft). Therefore, shafts may function like big monitoring wells (e.g. a typical four-compartment shaft was 40 feet by 80 feet width), and may be the best locations to evaluate minepool quality changes with depth (minepool “top water” and “bottom water” stratifications are described in Barnes et al. (1964), Ladwig et al. (1984) and Fox et al. (2001). Of the four major entries into collieries (slopes, shafts, tunnels and drifts), see Chapter 2, and Wallace (1981), shafts are usually reliable as minepool monitoring points. However, there may be some disadvantages to using shafts as groundwater monitoring points for some coal ash sites, because all of the groundwater flowing through the abandoned underground mine complex does not necessarily pass through the shaft. Rock tunnels were routinely developed in most collieries, perpendicular to the strike of the coal beds, to cross-connect gangways in different coal beds. These rock tunnels and other abandoned underground mine features (e.g. collapsed/blocked gangways) may create groundwater flow pathways that bypass the shaft.
77

Of the four major types of entries into anthracite collieries, tunnels may generally serve as the best groundwater monitoring points, because they typically are gravity drainage structures for all of the abandoned workings, and are the main post-mining overflow s for the minepools. Drift entries into collieries also represent good groundwater monitoring points, but as they are constructed to connect to a gangway of a specific coal bed, they may not be the only groundwater discharge point or be indicative of all of the variations in water quality within the minepool.
Airways and other secondary openings of the abandoned underground mines also serve as major minepool overflow locations and excellent groundwater monitoring points. These secondary openings were situated at the lowest topographic elevation where the minepool can overflow to the land surface, and thence to receiving streams, so they become more important for groundwater monitoring than the main entry to the abandoned underground mine (i.e. main slope or shaft) that is located at a higher elevation. The Tracy Airway in the Good Spring No. 3 Colliery and the Markson Airway, both located in the Donaldson Syncline in the Southern Field, are good examples of high volume minepool overflows, and are described in Fox et al. (2001) and Brady et al. (1998). The creation of these anthracite minepools by the cessation of pumping during abandonment of the underground mine, and the subsequent flooding of the mine workings, is like filling a bathtub or trough; the impounded water will rise until it reaches the level of the lowest opening which becomes the main overflow point. Thus, a relatively minor opening in the colliery during mining may become the major post-mining minepool discharge point.
This group of minepool overflow structures: tunnels, drifts, airways and other secondary openings; are all gravity (i.e. not pumped) discharge points, which makes them good, long-term, accessible, groundwater monitoring points. One advantage of these minepool discharge points is that historical data on the flow and water quality of these discharges is often available (e.g. USGS reports by Growitz et al. 1985, and Wood, 1996 plus DEP permit file data) for use as background/baseline monitoring data for coal ash placement sites. Another advantage is that these minepool overflows are often the sole discharge point from a colliery or a multi-colliery hydrologic unit, thus they represent a composite of all of the upgradient groundwater quality and flow paths – nothing flowing from the minepool should escape these major exit points. A corresponding disadvantage of this groundwater composite characteristic of these overflow points is that the minepools, and abandoned surface mine pits hydrologically connected to them, were used as “dumping grounds” for decades, and a variety of inorganic and organic chemical pollutants from many industries, Superfund sites, and sewage systems have been introduced to the vast minepool volumes. Many of these historical pollution sources have ceased discharging to the minepools, but some illegal industrial waste discharges and unauthorized sewage discharges continue to exist in the four anthracite fields, despite compliance monitoring and enforcement efforts by DEP. Therefore, almost any inorganic or organic chemical compound may be present in some amount in a “composite” minepool sample, in addition to the chemical constituents attributable to mine drainage and coal ash. However, the advantages usually outweigh the disadvantages and these major minepool discharges often serve as the key downgradient monitoring points, particularly where monitoring wells are infeasible or unsuccessful in intercepting the groundwater flow from certain mine sites.
78

4.3 CASE STUDY SITES
Several coal ash case study sites were selected to represent a range of coal ash placement conditions, anthracite mine site types, and different groundwater monitoring scenarios. These mine sites are located in the Northern and Western Middle Coal Fields, and are comparable to the three waste demonstration permit sites in the Eastern and Western Middle Fields that are featured in Chapters 7 through 9. The case study sites in this chapter were not studied in the level of detail presented in Chapters 8 and 9 (e.g. geochemical equilibria modeling and Scanning Electron Microscope analysis of ash mineralogy); however, they represent the type of scientific and engineering data typically contained in surface mine permit files, pursuant to the requirements of the coal mining and waste management regulations. Most of this data and other coal ash information is contained in Module 25 of the surface mining permits, as described in Chapter 1. 4.3.1 Northampton Fuel Supply Company – Alden Mine Site
This site is located in Newport Township, Luzerne County, and consisted of one active strip mine pit and two adjacent abandoned mine pits. The total area affected by the active mining, coal ash placement, and abandoned mine reclamation encompassed 31.5 acres. The total acreage of Surface Mining Permit No. 40860101 is 115 acres, but the coal ash placement area is within the western half of the SMP, as shown on Figure 4.3. The surface mine site overlies the abandoned Alden Colliery workings, at the western end of the Wyoming Basin of the Northern Field.
Figure 4.3. Site map of Northampton Fuels – Alden mine site.
79
The surface mining permit associated with this site was originally issued to Silverbrook Anthracite, Inc. in March 1987, and active strip mining began shortly thereafter. In January 1989 the permittee submitted a request (Module 25) to allow coal ash placement at the site. This submittal was approved in February 1990 and included two upgradient and three downgradient groundwater monitoring points. Coal ash placement began shortly after the Module 25 approval, and an additional coal ash source was added in March 1991. Only a small amount of coal ash was placed at the site, until it was transferred from Silverbrook Anthracite, Inc. to Northampton Fuel Supply Co., Inc. in July 1994. Northampton Generating Company, a FBC facility, was subsequently approved as an additional coal ash source in May 1995, at which time coal ash placement significantly increased at the site. This case study site was selected because: coal ash was used to augment backfill material at an active strip mine site, the site has been completed and reclaimed for several years, geotechnical data exists, and the groundwater monitoring scenario is relatively simple.
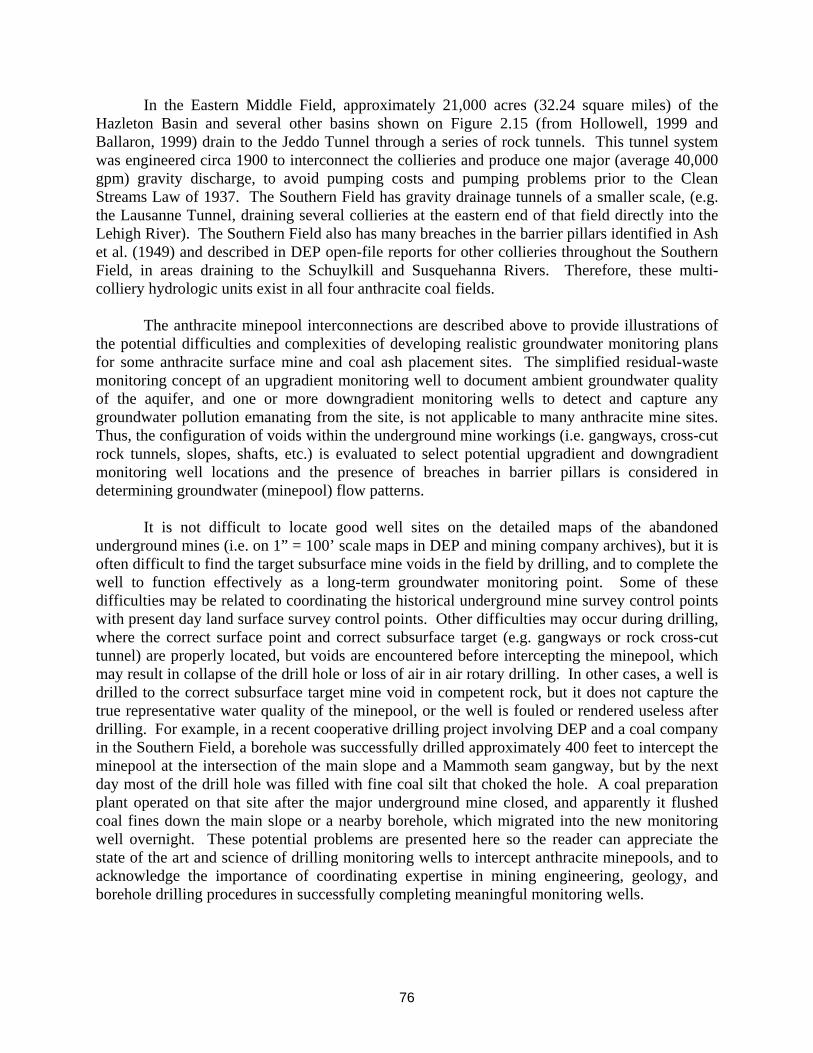
Coal ash from the Northampton Generating Co. source was also approved as a soil additive or replacement in May 1997, and utilization of coal ash for that purpose and as backfill material continued until October 1998. The site was reclaimed to forestland with grasses, legumes and trees, and was eligible for final bond release in October 2003. Approximately 1 million tons of Northampton coal ash was utilized on the 31.5 acres covered by this operation, and the groundwater monitoring at the site showed no degradation in relation to the pre-existing background samples. A photo of the reclaimed site is shown in Figure 4.4.
Figure 4.4. Reclaimed area at Northampton Fuels – Alden site.
80

A geotechnical investigation was conducted at the site in January 1998, with the results indicating more than adequate stability of the in-place material. These results indicate that the site should be stable over the long term for various post-mining uses, (such as industrial development), and that the ash does exhibit some pozzolonic and cementitous characteristics. The results of the geotechnical study are shown in Table 4.1. Similar tables of geotechnical data are included in Chapter 3, where blow counts and other methods are explained.
The five groundwater monitoring points are shown on the schematic map of the site in Figure 4.3. The upgradient monitoring wells, MP #1 and MP #5 are located relatively close together at the western edge of the SMP and these wells were drilled to a depth of 200 feet and 173 feet respectively, to intercept the minepool. The downgradient monitoring wells, MP #2 and MP #3 are in the south-central portion of the permit area (well depths are 150 feet), and the Alden Shaft is MP #4 in the eastern portion of the SMP.
Table 4.1. Geotechnical data from ash reclamation area at Alden site. Northampton Generating Alden Ash Site – Borehole A-1 Depth (ft) From-To Sample No. Blows / 6" Blows / 6" Blows / 6"
0/6 6/12 12/18 0-5 S-1 15 38 50/0.3'
5-10 S-2 20 44 50/0.2'
10-15 S-3 24 47 50/0.2'
15-20 S-4 24 50 50/0.4'
20-25 S-5 20 42 36
25-30 S-6 15 25 29
30-35 S-7 3 5 6
35-40 S-8 5 6 6
Monitoring of upgradient and downgradient wells, plus the Alden Shaft point
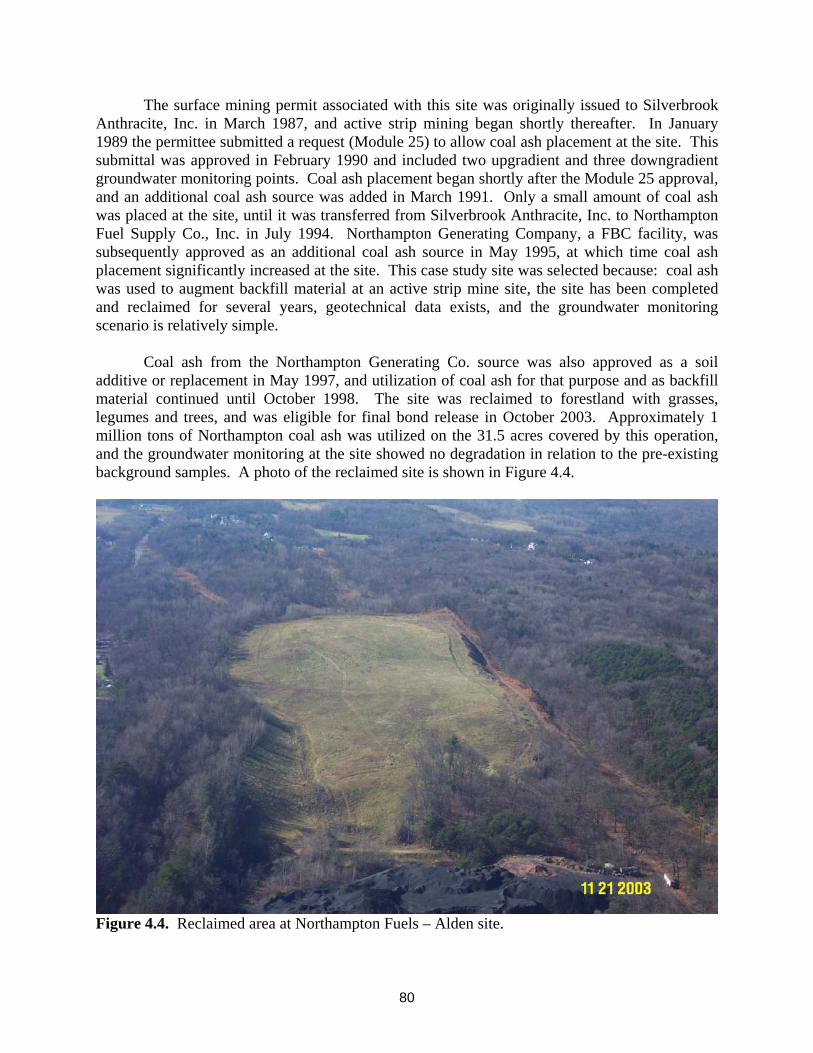
representing the minepool, has shown no major trends in overall quality. There were some very slight temporary increases observed at downgradient monitoring points for manganese and fluoride, but they returned to low levels at the end of the sampling period. Heavy metal levels remained essentially undetectable throughout the sample period of 1989 – 2000 with no discernable trend.
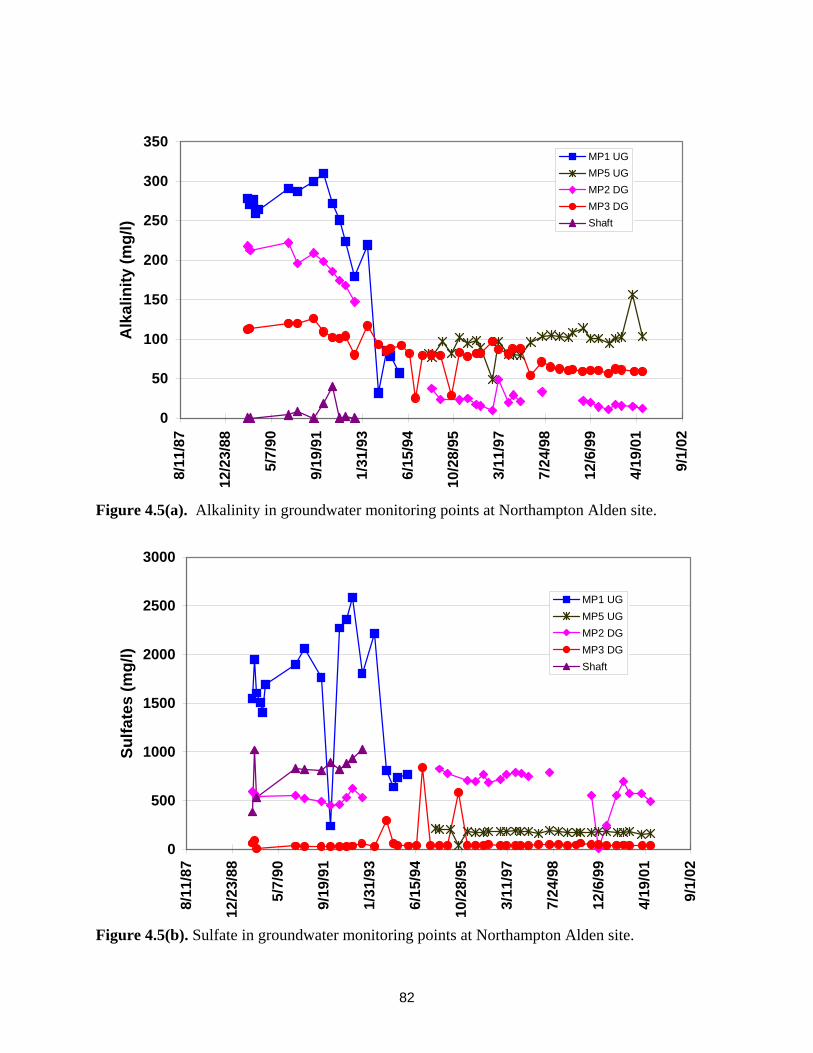
The results of twelve years of groundwater monitoring data are shown in Figures 4.5a and 4.5b. These figures show a dramatic decline in alkalinity and sulfates in upgradient MP #1 in 1993, prior to major coal ash placement, and an apparently small increase in alkalinity in upgradient MP #5. The alkalinity of downgradient MP #3 appears to be declining during and after placement of the alkaline ash, and is also inconsistent with the concentration range and behavior of nearby MP #2, that shows a more significant alkalinity decline. Monitoring well MP #3 also had three spikes in sulfate concentrations from 1993 to 1995, which match low-alkalinity events. Otherwise these data are unremarkable.
81
0
50
100
150
200
250
300
350
8/11
/87
12/2
3/88
5/7/
90
9/19
/91
1/31
/93
6/15
/94
10/2
8/95
3/11
/97
7/24
/98
12/6
/99
4/19
/01
9/1/
02
Alk
alin
ity (m
g/l)
MP1 UGMP5 UGMP2 DGMP3 DGShaft
Figure 4.5(a). Alkalinity in groundwater monitoring points at Northampton Alden site.
0
500
1000
1500
2000
2500
3000
8/11
/87
12/2
3/88
5/7/
90
9/19
/91
1/31
/93
6/15
/94
10/2
8/95
3/11
/97
7/24
/98
12/6
/99
4/19
/01
9/1/
02
Sulfa
tes
(mg/
l)
MP1 UGMP5 UGMP2 DGMP3 DGShaft
Figure 4.5(b). Sulfate in groundwater monitoring points at Northampton Alden site.
82
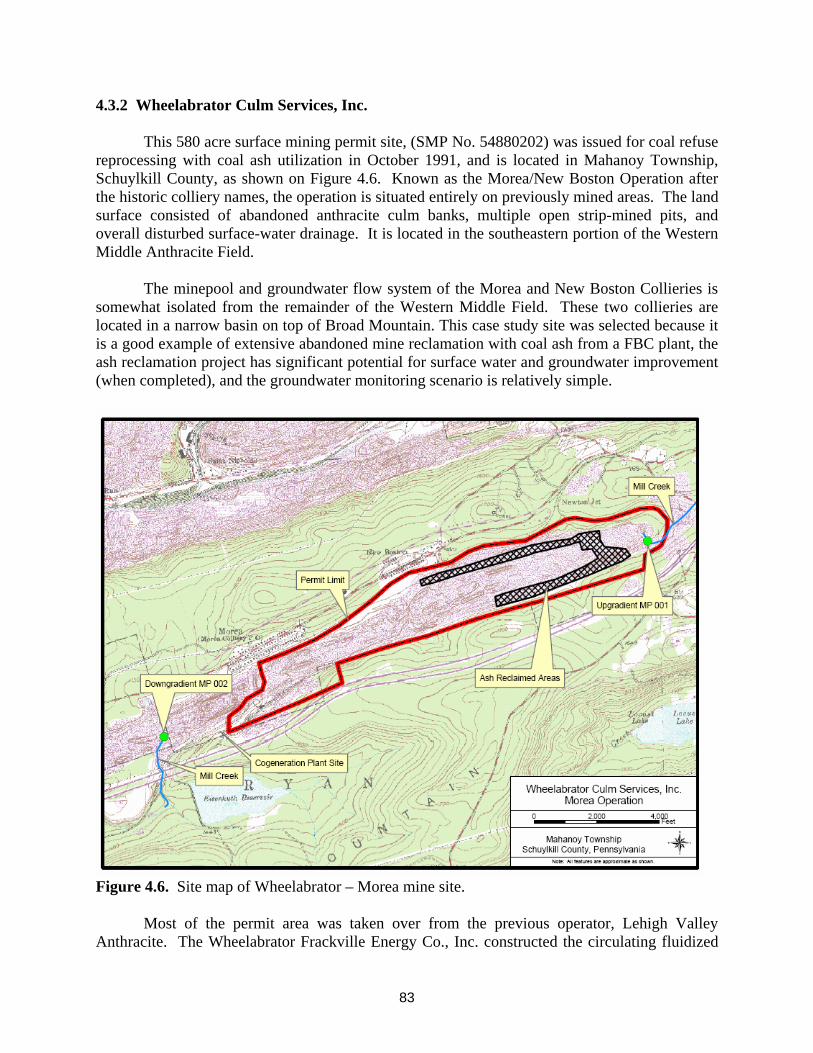
4.3.2 Wheelabrator Culm Services, Inc.
This 580 acre surface mining permit site, (SMP No. 54880202) was issued for coal refuse reprocessing with coal ash utilization in October 1991, and is located in Mahanoy Township, Schuylkill County, as shown on Figure 4.6. Known as the Morea/New Boston Operation after the historic colliery names, the operation is situated entirely on previously mined areas. The land surface consisted of abandoned anthracite culm banks, multiple open strip-mined pits, and overall disturbed surface-water drainage. It is located in the southeastern portion of the Western Middle Anthracite Field.
The minepool and groundwater flow system of the Morea and New Boston Collieries is somewhat isolated from the remainder of the Western Middle Field. These two collieries are located in a narrow basin on top of Broad Mountain. This case study site was selected because it is a good example of extensive abandoned mine reclamation with coal ash from a FBC plant, the ash reclamation project has significant potential for surface water and groundwater improvement (when completed), and the groundwater monitoring scenario is relatively simple.
Figure 4.6. Site map of Wheelabrator – Morea mine site.
Most of the permit area was taken over from the previous operator, Lehigh Valley Anthracite. The Wheelabrator Frackville Energy Co., Inc. constructed the circulating fluidized
83

bed boiler plant (FBC) in 1988 on-site, near their primary fuel source – (anthracite culm) and potential ash placement areas. Coal refuse and coal silt from other local permitted areas is conveyed to the plant. Fly and bottom ash are then hauled from the plant by truck to the active ash placement area. The operation is conducted in phases of refuse recovery and ash utilization. Over 11 years, the operator has had nine phases approved for ash placement, various support activities and refuse reprocessing. At the end of 2002, the operator reported over six million tons of anthracite coal refuse burned in the plant, and over four million cubic yards of ash utilized for reclamation on-site, with 113 acres of abandoned mine lands reclaimed.
The primary use of the coal ash produced by the plant was to fill the abandoned open pits on site. Several 10 to 20 acre pits were filled with ash. On-site spoil and abandoned coal refuse material is used to line the pits prior to ash placement, with the best material saved for final cover. Photographs of the abandoned surface mine pits reclaimed with coal ash are shown in Figure 4.7. Extensive wildlife habitat plantings have been established on the reclaimed areas shown in Figure 4.7b. In addition, the coarse bottom ash from this plant is approved for use as anti-skid material for on-site access and haul roads. This material is stored separately and used during inclement weather.
Figure 4.7(a). Ash placement in pits.
4.7(b). Wildlife plantings.
4.7(c). Morea minepool and FBC plant. 4.7(d). Extensive reclamation area.
84

Initially, 8 feet of fill (spoil and refuse material) was needed to line the pits. All ash conveyed to the active placement area was dumped into the working area and then spread and compacted in lifts of 2-4 feet within 24-48 hours of placement. The ash is conditioned at the plant with adequate moisture for compaction, which is achieved simply by the process of repeated passes of the haul trucks and dozers during spreading. Each daily cell is 150 by 200 feet. A final cover of 4 feet is placed on top, utilizing the adjacent spoil material, with the top one foot being the best available from the site. Daily and intermediate cover is used, as needed, to control dust before the final cover. Since the plant utilizes treated minepool water for cooling purposes, the sludge from the water treatment process is blended with the ash in a 1 to 467 ratio, and placed in the ash use areas.
The site was extensively affected by pre-Act mining. There is no point-source discharge or direct drainage to a stream – water percolates directly through the surface material or drains to the pits and ultimately is conveyed to the minepool underneath. Upgradient diversions are used to prevent runoff onto the site. There is essentially no natural soil present.
Of the nine mining and coal ash placement phases shown on the permit maps, three phases (1, 2 and 3) are substantially completed, and some reclamation work has been completed on two other phases (4 and 5), which are shown in the cross-hatched symbol on Figure 4.6. When this entire remining project is completed, significant surface-water and groundwater benefits should occur, in addition to the extensive reclamation of abandoned mine lands. With every acre of abandoned surface mine pits that are reclaimed to approximate original contour on this site, there is a reduction in water infiltrating directly into the underlying minepool, and a concomitant increase in surface water runoff. The tributary to Mill Creek in the eastern end of the SMP presently flows to the subsurface through abandoned mine workings within the permit area, but this stream should be restored to the surface and emanate from the permit as a perennial stream before completion of the project. The elimination of stream loss (or dramatic reduction in stream bed leakage) and the reduction in direct infiltration to the abandoned underground mines through coal ash backfilling of abandoned surface pits is expected to significantly reduce the flow of the Morea Colliery discharge (downgradient monitoring point MP 002), shown on Figure 4.6. The reduction in flow of abandoned mine discharges by remining operations is one of the most common and significant benefits according to Hawkins (1995), Brady et al. (2001) and Smith et al. (2004). It is anticipated that the extensive placement of alkaline coal ash at the Wheelabrator site will improve the water quality of the Morea Colliery discharge. However, if the concentration of some water quality parameters does not change significantly, the overall pollution load of the discharge should decrease significantly due to the reduction in flow.
As part of the permit conditions, the permittee is required to conduct groundwater and ash monitoring. For this site, the minepool conditions are such that sampling points are easily identified. Mill Creek runs on the surface before it reaches the Wheelabrator site and goes underground into the minepool complex. A point was picked on Mill Creek as an upgradient monitoring site, shown on Figure 4.6. The minepool overflows downgradient from the site and represents the emergence of Mill Creek to the surface. It is worse in quality due to acid mine drainage pollution of the minepool. This is the designated downgradient monitoring point that theoretically would reflect any changes in water quality due to the mining and ash placement activities. The DEP has monitoring data on these points from 1986 to the present. The major
85

problem in comparing upgradient monitoring point 001 with downgradient monitoring point 002 is that they represent two different hydrologic regimes that are only interconnected because the stream (001) flows into the subsurface into the minepool, emanating at the minepool discharge (002). The concentrations of acidity, sulfates, manganese and other analytes have been consistently higher in the downgradient point since the start of monitoring (except for 1 or 2 rare occasions), not due to degradation caused by Wheelabrator mining and reclamation activities, but due to the fundamental difference in analyte concentrations between the minepool and the stream. Thus, interpretations may be made from the presence of any trends within the data from either point. For example, it appears that the pre-mining acidity at the downgradient monitoring point was usually about 90 to 100 mg/L, and during ash placement it has typically been about 50 to 80 mg/L as shown in Figure 4.8a. However, alkalinity has not increased and is still negligible, because the acidity in the minepool is still overwhelming any alkalinity attributable to the coal ash placement.
Figure 4.8(a). Acidity in minepool and stream at Wheelabrator site.
0
20
40
60
80
100
120
12/1
/85
4/15
/87
8/27
/88
1/9/
90
5/24
/91
10/5
/92
2/17
/94
7/2/
95
11/1
3/96
3/28
/98
8/10
/99
12/2
2/00
5/6/
02
9/18
/03
Aci
dity
Acidity UGAcidity DGLinear (Acidity DG)Linear (Acidity UG)
Start of Ash Placement
86

0
5
10
15
20
25
12/1
/85
4/15
/87
8/27
/88
1/9/
90
5/24
/91
10/5
/92
2/17
/94
7/2/
95
11/1
3/96
3/28
/98
8/10
/99
12/2
2/00
5/6/
02
9/18
/03
Ca
(ppm
)Upgradient
Downgradient
Start of Ash Placement
Figure 4.8(b). Calcium concentration in minepool and stream at Wheelabrator site.
There has been no significant change in the overall water quality in an upgradient to downgradient comparison, but some trends of particular constituents are noticeable. The upgradient pH is consistently between 4 and 5 whereas the downgradient is consistently between 3 and 4. For both points, specific conductance trends slightly upward and acidity trends slightly downward. Figure 4.8b shows that calcium concentrations in the upgradient stream monitoring point and the downgradient minepool discharge were nearly identical prior to 1990, while the data since 1995 show the calcium concentrations in the minepool discharge are consistently higher than the upgradient sample site. This difference, however subtle, may be due to dissolution of the calcium hydroxide in the coal ash.
Overall, the Wheelabrator mine site and cogeneration plant operations have resulted in the use of refuse material to produce energy while not only reclaiming the banks of waste material, but also providing stable fill, as ash, to decrease the safety and environmental hazard of open, abandoned pits. Formerly unusable land is being restored to a graded, vegetated condition for future use as shown in the photos in Figure 4.7. It is not anticipated that the ash placement will result in an overall degradation of water quality. Over the long-term, further pollution resulting from flow to the minepool will be reduced as more natural overland drainage patterns are restored and Mill Creek is eventually returned to a surface stream across the site. 4.3.3 B-D Mining – Overall Plant Site and Reading Anthracite - Ellengowan Site
The large B-D Mining coal refuse reprocessing and coal ash placement site is located in Mahanoy and West Mahanoy Townships and Gilberton Borough in Schuylkill County. The surface mining permit (SMP #54850202) is for a total of 1,590 acres, including 809 acres of coal refuse removal and 175 acres of coal ash placement areas. This SMP was issued in December
87

1985 as a repermitting operation that encompassed five previous surface mining permits. The permit boundary and active and abandoned mine features are shown on Figure 4.9.
This site consists of a large area of abandoned mine lands containing extensive waste coal (refuse material) and coal silt deposits. The operator reprocesses coal waste and prepares it for utilization in various ways. The most significant use of the material is as fuel for the nearby cogeneration facility, Gilberton Power Company. The material is burned in this fluidized bed combustion plant and the fly/bottom ash that results is returned to this site for beneficial use in backfilling a silt dam. The silt was removed from the dam prior to ash placement which began shortly after the plant went on-line in 1988.
Figure 4.9. Map of B-D Mining site showing permit boundary, ash placement areas and monitoring locations.
The ash placement silt dam site overlies the abandoned mine workings of the Boston Run Colliery in the eastern portion of the Western Middle Anthracite Field. The silt dam/ash area is at the eastern end of the Boston Run Colliery, adjacent to the barrier pillar between the Boston Run and Tunnel Ridge Collieries, as shown on Figure 4.9. While the ash placement site overlies a single abandoned underground mine (Boston Run Colliery), the 1,590 acre SMP overlies a total of 8 collieries, and the Gilberton Shaft minepool monitoring point within the SMP receives mine drainage from at least 11 upgradient collieries and interconnected minepools. This case study
88

site was selected because it represents a large volume coal ash placement area within a large-scale refuse reprocessing operation with a complex groundwater monitoring scenario.
The ash from Gilberton Power Company placed in this silt dam is the only source of ash at this time, although other sources of ash have been approved for placement at this site. Filling of the dam has been on-going since 1988 in accordance with DEP’s rules and regulations, and established engineering practice. The coal ash is placed in and compacted with on-site equipment, such as bulldozers, which has proven to be adequate to establish the required field densities of 90% of the modified Proctor density as determined in the laboratory for this ash material. As of the end of 2002, approximately 4 million cubic yards of ash and refuse material have been placed at this site, as shown on the photos in Figure 4.10.
Figure 4.10(a). Culm, fuel processing, and conveyor to Gilberton Power Plant.
4.10(b). Silt dam and adjacent ash reclamation area.
4.10(c). Extensive reclamation area. 4.10(d). Gilberton Shaft pumping station.
It was stated above that this site represents a complex groundwater monitoring scenario. Before describing the monitoring points and monitoring data, it is useful to put the B-D Mining site in perspective with the other coal mining and ash placement activities in the watershed. The 1,590 acre B-D Mining SMP shown on Figure 4.9 is adjacent to the 3,038 acre Reading Anthracite Co. Ellengowan SMP located to the northeast. That Reading Anthracite SMP contains the Schuylkill Energy Resources (SER) cogeneration plant and its large coal refuse bank fuel supply, plus the Shen Penn and Knickerbocker pits, and the Ellengowan silt dam coal
89

ash site within the SMP boundaries. Thus, there are three significant coal ash placement sites in the area as shown in Figure 4.11, the Knickerbocker pit to the north (see Chapter 8) the Ellengowan silt dam in the middle (see Chapter 7), and the B-D ash placement site to the south of the other two. The entire area underlying these two large surface mining pits is a series of interconnected abandoned underground mines. Surface mining activities within this area consisted of numerous small pits, several large open pit mines including the Shen Penn and Knickerbocker pits, and extensive coal refuse disposal and refuse reprocessing operations comprising the black and dark brown areas, that almost completely cover Figure 4.11. Annual records of refuse consumption and ash production from the Gilberton Power and SER cogeneration plants, show that more than 22 million tons of coal refuse have been removed from the permit areas, and more than 15 million tons of coal ash have been beneficially used from 1988 to 2002. All of these mining and ash placement areas drain to the Gilberton Shaft and ultimately the Packer V discharge at Girardville, shown on the map in Figure 4.9 and on the photos in Figure 4.10.
The coal ash material placed within the B-D permit area shown on Figures 4.9 and 4.11
has been regularly monitored and tested since 1988 for solid ash bulk chemistry and leachate analyses in accordance with the DEP’s Module 25 requirements, and has shown that the solid ash and leachate parameters are consistently within allowable limits. Table 4.2 shows the chemical analyses for the solid ash expressed in milligrams per kilogram (i.e. parts per million) for the ash from the Gilberton Power FBC plant at the top of the table. The bottom half of the table shows the leachate concentrations from the Synthetic Precipitation Leachate Procedure (SPLP) test, expressed in milligrams per liter (i.e. parts per million), for the ash samples shown in the top half of the table. The samples included in the table are representative samples of the 38 samples contained in the permit file resulting from the semiannual testing requirements. The samples selected for inclusion in Tables 4.2, 4.3 and 4.4 represent the range in concentrations, the medians, the range in time, or sampling events when bottom ash or fly ash were separately tested. The writers determined that to include all available analyses in these tables would make them too voluminous for inclusion in the body of this chapter; plus, all of this data is public file information within the permit files, accessible to anyone who needs all of the analyses. However, the concentration plots of the ash, leachate and monitoring data in Figures 4.13a, 4.13b, and 4.15a, 4.15b and 4.15c show the entire range and median values of all of the data within the permit files.
The elements in the columns of the table are arrayed in the approximate order of their
abundance in the solid ash samples. The major elements, aluminum, iron and potassium shown in the table are present in the range of thousands to tens of thousands of mg/kg. Other major elements in coal, coal refuse and overburden rock minerals (e.g. calcium, magnesium, sodium and silica) are not included in the table, because they are not routinely required in the Module 25 list of analytes; but they are known to be present in these approximate ranges (i.e. thousands of mg/kg) from other analyses discussed in Chapters 7 to 9, Scheetz et al. (1997) and other sources. Barium is relatively abundant in the hundreds of mg/kg range, followed by manganese, chromium, copper, zinc, nickel, boron, molybdenum and arsenic, generally in the tens of mg/kg range. Finally, the elements of selenium, cobalt, mercury, cadmium and silver are generally present in the range of a few mg/kg to trace quantities of a few hundredths of a mg/kg.
90

Figure 4.11. Aerial photograph of B-D Mining and Reading Anthracite permit areas and monitoring locations.
91

Table 4.2. Chemical analyses of Gilberton coal ash and SPLP leachate. (0.00 values = below detection limit).
SAMPLED pH Al Fe K Ba Mn Cr Cu Zn Ni B Pb Mo As Se Co Hg Cd AgCombined Fly and Bottom Ash
5/24/90 10.7 31090 9860 240 54 39 31 16 12 0 0 9 6.2 0.7 0.0 0.06/5/95 10.7 18100 17000 3790 149 57 51 23 14 85 21 25 21 21 2.5 0.0 0.0 0.0 0.01/15/96 8.9 12000 12700 2120 78 35 22 19 10 14 19 26 61 13 0.0 5.2 0.4 0.0 1.46/13/97 10.2 159000 91000 3700 93 41 25 14 19 21 0 0 30 30 0.6 14.0 0.0 0.0 0.06/3/99 10.2 25000 26800 276 87 260 46 28 114 34 25 0 6 0.6 0.8 0.0
10/27/99 10.2 31000 27200 242 98 57 45 35 31 13 30 14 7 0.8 0.3 0.6Boiler #1 Fly
9/29/88 11.2 48065 26670 294 86 59 53 28 25 50 40 0 2 0.5 0.3 2.0 2.09/30/90 12.3 32560 24810 267 82 70 31 20 22 18 43 0 26 0.0 0.3 1.3 0.0
Boiler #1 Bottom6/29/88 11.2 34319 11299 169 49 42 18 18 9 0 26 0 2 0.6 0.0 1.3 1.09/30/90 11.6 24095 11440 217 53 35 12 10 10 6 17 0 10 0.0 0.0 0.0 0.0
Boiler #2 Fly9/29/88 10.5 32216 19941 194 63 48 30 21 18 25 28 0 2 0.4 0.2 2.4 1.010/11/90 11.9 33340 31390 273 91 76 39 20 27 23 46 4 38 0.0 0.5 1.3 0.0
Boiler #2 Bottom9/30/89 5.5 56700 14420 206 46 46 17 22 0 20 56 0 3 0.0 0.0 3.0 0.010/11/90 11.6 19160 12360 192 53 27 12 10 11 6 0 0 8 0.0 0.0 7.0 0.0
SAMPLED pH Al Fe K Ba Mn Cr Cu Zn Ni B Pb Mo As Se Co Hg Cd AgCombined Fly and Bottom Ash
5/27/90 5.0 8.28 0.00 0.15 0.37 0.05 0.00 0.22 0.00 0.00 0.06 0.00 0.21 0.00 0.00 0.006/5/95 10.8 1.16 0.11 23.50 0.14 0.00 0.15 0.00 0.01 0.00 0.00 0.00 0.24 0.25 0.05 0.00 0.00 0.00 0.001/15/96 10.8 0.63 0.11 18.00 0.00 0.00 0.12 0.00 0.00 0.00 0.00 0.00 0.22 0.03 0.00 0.00 0.00 0.00 0.006/13/97 10.6 1.20 0.05 22.30 0.00 0.07 0.23 0.03 0.03 0.00 0.00 0.11 0.60 0.02 0.01 0.07 0.00 0.00 0.036/3/99 10.4 3.50 0.18 0.26 0.01 0.13 0.02 0.01 0.00 0.00 0.00 0.00 0.01 0.01 0.00 0.00
10/27/99 8.7 3.14 0.54 0.00 0.16 0.12 0.00 0.01 0.00 0.00 0.00 0.16 0.02 0.01 0.00 0.00Boiler #1 Fly
9/29/88 4.9 23.90 0.67 0.10 0.73 0.26 0.07 1.04 0.11 0.40 0.30 0.72 0.01 0.02 0.00 0.05 0.059/30/90 11.9 15.83 0.53 0.46 0.60 0.10 0.07 0.35 0.00 0.59 0.26 0.32 0.03 0.00 0.00 0.02 0.00
Boiler #1 Bottom9/29/88 4.8 10.50 1.05 0.00 0.18 0.22 0.07 1.04 0.07 0.00 0.23 0.00 0.02 0.00 0.00 0.04 0.029/30/90 11.3 1.91 0.16 0.24 0.19 0.00 0.03 0.08 0.00 0.13 0.00 0.00 0.04 0.00 0.00 0.00 0.00
Boiler #2 Fly9/29/88 5.0 20.60 0.68 0.15 0.53 0.32 0.13 4.46 0.16 0.55 0.29 0.61 0.02 0.01 0.00 0.03 0.0210/11/90 12.1 16.62 0.38 0.59 0.57 0.17 0.07 1.20 0.00 0.65 0.31 0.40 0.04 0.00 0.00 0.02 0.04
Boiler #2 Bottom9/30/89 5.0 0.00 0.00 0.00 0.00 0.00 0.00 0.02 0.00 0.00 0.00 0.00 0.00 0.00 0.00 0.00 0.0010/11/90 11.5 2.13 0.15 0.24 0.19 0.00 0.03 1.03 0.00 0.12 0.13 0.00 0.04 0.00 0.00 0.01 0.00
Solid Ash - Dry weight concentrations in mg/kg
SPLP Leachate Concentration in mg/L
While some of these elements are not abundant in the solid ash or the SPLP leachate,
they are included in Tables 4.2 and 4.4, and are routinely required in the Module 25 analyses because they are elements of concern in the federal RCRA program (i.e. As, Ba, Cd, Cr, Pb, Hg, Se, Ag). The leachate concentrations of all of these major, minor and trace elements in the bottom half of the table can easily be compared to the solid ash analyses, and it is evident that the relative abundance of certain elements in the solid ash is not matched by their relative abundance
92

in the leachate. For example, aluminum and potassium are more concentrated in the leachate than iron, and barium concentrations are no higher than manganese or zinc. In the 15 columns from barium to silver, the only concentrations greater than 1.0 mg/L are 5 values for zinc where fly ash concentrations were compared to bottom ash concentrations. The analyses for some of these elements that are shown as 0.00 in Tables 4.2 and 4.3 were reported that way in the monitoring data were submitted to DEP, but actually should be expressed as less than a specified analytical detection limit for that element.
Figure 4.12(a). Culm pile and fuel conveyor to SER power plant.
4.12(c). Ash conveyor from SER plant to abandoned silt dam.
4.12(b). Shen Penn abandoned pit and SER plant.
4.12(d). Reclaimed ash placement area and SER plant.
93

The ranges of concentrations of constituents in the solid ash samples from the Gilberton Power FBC plant can be compared to those of the solid ash samples from the Schuylkill Energy Resources FBC plant in Figures 4.13a and 4.13b. All 38 solid ash analyses for the Gilberton Power plant, and all of the 25 solid ash analyses for the SER power plant were used in computing the range and median for these data sets. The bold vertical lines express the range of concentrations and the bold horizontal lines represent the median values in these frequency distribution diagrams. These figures are graphed on a log scale because the range of concentrations of elements in the coal ash extends over 7 orders of magnitude for these two coal ash sources, and the patterns of variations for all these elements can then be viewed simultaneously as an “ash fingerprint” or chemical signature for that ash. These data plots are essentially simplified box plots, following the concepts developed by Tukey (1977) and McGill et al. (1978) for comparing batches of data, and used in the statistical analysis of mine drainage data by Griffiths et al. (2001), Fox et al. (2001), Smith et al. (2004) and Brady et al. (1998, see Chapter 2, Fig. 2.18). If these diagrams were truly box plots, the interquartile range of the data would be contained in a box. While the boxes are very useful in evaluating the shape of the frequency distribution of the data and in comparing large data sets, it was determined that the boxes were not essential in these diagrams.
The median values for numerous elements in Figure 4.13a are very similar to those in 4.13b, but the ranges in concentrations of barium, manganese, chromium, copper, zinc and nickel are broader in the SER ash, hence there are some identifying differences in these ash fingerprints. The data plots for those metals in the SER ash appear to be more skewed toward the low values, but that may be chiefly attributable to the log scale. In the Gilberton data for barium and zinc in Figure 4.13a, the median (horizontal line) is very close to the middle of the range (vertical line) indicating that the data are symmetrically distributed above and below the median (and mean), which would occur in a log normal frequency distribution of the data. The use of the median as the measure of central tendency is typical with asymmetrical frequency distributions; it also reduces the problem of dealing with outliers that may be typographical errors or lab errors in these data sets---these outliers may inflate the mean in data sets with few samples. For example, the ash sample in Table 4.2 for June 13, 1997 has an aluminum concentration of 159,000 mg/kg and an iron concentration of 91,000 mg/kg, both of which are much higher than the other values in the array, but not completely out of the question. Another example is the sample for conditioned fly ash at the SER plant on February 11, 1991 which had an aluminum concentration of 428 mg/kg and an iron concentration of 244 mg/kg, which are about 2 orders of magnitude lower than the other samples in the array, which could be a data reporting error of two decimal places.
The SER ash is generally lower in aluminum and iron than the Gilberton Power ash, but
the median values are comparable. The Gilberton ash has a median aluminum of 31,608 mg/kg, while the SER ash has a median of 23,150 mg/kg. The Gilberton ash has a median iron of 19,995 mg/kg, while the SER ash has a median of 15,750 mg/kg. The medians for another parameter of interest, arsenic, are more similar. The Gilberton ash has a median arsenic of 11.6 mg/kg, while the SER ash has a median of 12.17.
94

igure 4.13(a). Ranges and medians of elements in Gilberton Power coal ash. (all parameters
P are expressed as mg/kg).
Gilberton (B-D) Ash Fingerprint
0.01
0.10
1.00
10.00
100.00
1000.00
10000.00
100000.00
pH NP
ALU
MIN
UM
IRO
N
POTA
SSIU
M
BA
RIU
M
MA
NG
AN
ESE
CH
RO
MIU
M
CO
PPER
ZIN
C
NIC
KEL
BO
RO
N
LEA
D
MO
LYB
DEN
UM
AR
SEN
IC
SELE
NIU
M
CO
BA
LT
MER
CU
RY
CA
DM
IUM
SILV
ER
Fexcept pH and NP are expressed as mg/kg).
SER Ash Fingerprint
0.01
0.10
1.00
10.00
100.00
1000.00
10000.00
100000.00
pH NP
ALU
MIN
UM
IRO
N
POTA
SSIU
M
BA
RIU
M
MA
NG
AN
ESE
CH
RO
MIU
M
CO
PPER
ZIN
C
NIC
KEL
BO
RO
N
LEA
D
MO
LYB
DEN
UM
AR
SEN
IC
SELE
NIU
M
CO
BA
LT
MER
CU
RY
CA
DM
IUM
SILV
ER
Figure 4.13(b). Ranges and medians of elements in SER coal ash. (all parameters except pH and N
95

Table 4.3. Chemical analyses of SER coal ash and SPLP leachate. (0.00 values = below etection limit).
FBC plant, located on the Reading Anthracite Co. Ellengowan permit site djacent to the B-D Mining site. The FBC power plant is shown in the northeastern portion of
Figure
-D Mining site consists the downgradient minepool oint at Gilberton Shaft Pump, and two points up and downgradient in the minepool for
charact
SAMPLE
d
D pH Al Fe K Ba Mn Cr Cu Zn Ni B Pb Mo As Se Co Hg Cd AgCombined Fly and Bottom Ash
4/30/91 10.6 22100 8520 229 57 24 24 35 10 34 19 12 11 5.8 0.42 1.20 0.0012/7/92 9.2 23150 16170 163 70 28 18 14 8 9 17 23 12 0.8 0.33 0.00 0.0010/28/98 9.6 27900 24500 10600 287 62 47 48 23 15 0 45 13 13 0.0 11 0.00 0.00 1.0011/30/99 10.2 13000 8360 121 50 16 10 8 38 0 0 0 7 0.0 0.41 0.0011/10/00 10.4 45600 26700 243 84 27 17 14 25 17 10 10 42 1.2 0.02 0.504/17/02 9.1 10300 13200 108 87 25 14 17 10 45 18 1 10 0.5 0.15 2.00
Bottom1/10/90 11.3 17568 11160 156 59 23 21 19 9 0 62 206 0.0 0.00 0.70 1.80
Conditioned Fly1/10/90 11.3 42470 28140 473 101 52 31 35 22 46 47 158 0.2 0.00 1.00 2.00
SAMPLED pH Al Fe K Ba Mn Cr Cu Zn Ni B Pb Mo As Se Co Hg Cd AgCombined Fly and Bottom Ash
4/30/91 5.4 5.12 0.20 0.27 0.27 0.00 0.00 0.07 0.18 ns 0.09 0.05 0.01 0.12 0.00 0.00 0.0012/7/92 5.4 9.88 0.04 0.00 0.40 0.00 0.00 0.14 0.08 0.37 0.00 0.23 0.02 0.01 0.00 0.00 0.0010/28/98 10.1 1.72 0.00 10.40 0.24 0.03 0.08 0.02 0.00 0.04 0.00 0.12 0.15 0.01 0.08 0.00 0.00 0.01 0.0111/30/99 8.8 2.85 0.12 0.00 0.02 0.07 0.03 0.00 0.20 0.22 0.00 0.45 0.05 0.01 0.00 0.0011/10/00 10.3 1.67 0.03 0.10 0.07 0.05 0.02 0.01 0.04 0.20 0.10 0.10 0.01 0.01 0.00 0.024/17/02 10.2 1.64 0.02 0.03 0.01 0.01 0.01 0.06 0.01 0.07 0.05 0.01 0.04 0.01 0.00 0.01
Bottom1/10/90 5.00 13.82 4.26 0.00 0.56 0.00 0.12 0.17 0.00 0.40 0.42 0.63 0.00 0.00 0.00 0.30 0.04
Conditioned Fly1/10/90 5.10 14.38 4.30 0.00 0.56 0.00 0.10 0.21 0.00 ns 0.44 0.54 0.00 0.00 0.00 0.32 0.03
SPLP Leachate Concentration in mg/L
Solid Ash - Dry weight concentrations in mg/kg
Table 4.3 shows the chemical analyses for the solid ash from the Schuylkill Energy
Resources (SER)a
4.11, and its primary ash placement area is shown within the B-D permit boundary on Figures 4.9 and 4.12. The top half of the table shows the solid ash chemistry and the bottom half shows the SPLP leachate chemistry, in the same format as described above for Table 4.2. The samples included in the table are representative samples of the 25 samples contained in the permit file, resulting from the semiannual testing since 1990. The patterns of variation in the SER ash analytes were described above in the discussion of Figure 4.13b, and the patterns of variation in the leachate analyses are similar to those described above for the Gilberton ash leachate in Table 4.2. However, none of the leachate concentrations in the 15 columns from barium to silver are greater than 1.0 mg/L.
Background water monitoring was performed at the B-D site of prior to placement of ash. Currently the monitoring program for the Bp
erizing groundwater flow from the ash placement area shown on Figure 4.9.
96

The location of the pools and the estimated direction of water flow in the pools is as shown on Figure 4.9. These pools are known to be interconnected and currently have their
ischarge at the Gilberton Shaft. The direction of water flow has been documented by the U.S. Bureau
1, as well as the ultimate downgradient monitoring point at the acker V minepool discharge at Girardville. Table 4.4 shows representative samples of these
monito
chuylkill Energy Resources FBC plant site have een kept somewhat separate. As stated earlier, this case study site represents a complex
ground
samples shown Figures 4.15a, b and c, plus examples of the maximum values shown in those frequency
distribu
d of Mines and also confirmed by DEP review of mine workings and pool elevations. A
review of the mine water flow indicates that the B-D ash placement area, which is above the Boston Run abandoned mine workings, is located at the extreme upgradient portion of the minepool, adjacent to the barrier pillar between the Boston Run and Tunnel Ridge Collieries. Therefore, an upgradient monitoring point, which would sample pool water not affected by ash disposal, cannot be located.
The monitoring points for the adjacent Reading Anthracite Ellengowan permit are also shown in Figure 4.9 and 4.1P
ring points from 1988 through 2002.
Up to this point in the data analysis the data sets from the B-D Mining/Gilberton Power FBC plant site and the Reading Anthracite/Sb
water monitoring scenario, and the minepool/groundwater flow from both sites goes to the downgradient Gilberton Shaft and Packer No. V Colliery discharge points. Fortunately, B-D and Reading Anthracite have some common corporate officers and there are some common ownership interests in the two FBC power plants (which accounts for the existence of the SER ash placement area on the B-D permit), which makes coordination of the groundwater monitoring activities somewhat easier. Therefore, the relevant groundwater monitoring data for both sites is combined in Table 4.4 below and in Figures 4.15a, 4.15b and 4.15c.
The groundwater monitoring samples included in Table 4.4 are representative samples from the B-D and Reading Anthracite permit files, including many of the medianin
tions. The samples were selected from the quarterly groundwater monitoring data set with the intent to represent the entire time period that was monitored, and to match the annual samples that have more metals included in the analysis. MW007 was sampled from March 27, 1988 through September 12, 1996 and was replaced by MW008, which was sampled from January 16, 1996 to the present. The sample collected from MW007 on October 16, 1988 is the median iron concentration (66.7 mg/L) of all 40 samples in the DEP permit file; which is substantially higher than the corresponding median iron concentration (32.2 mg/L) of MW008 in the sample from February 9, 2002 (n = 34 samples).
97
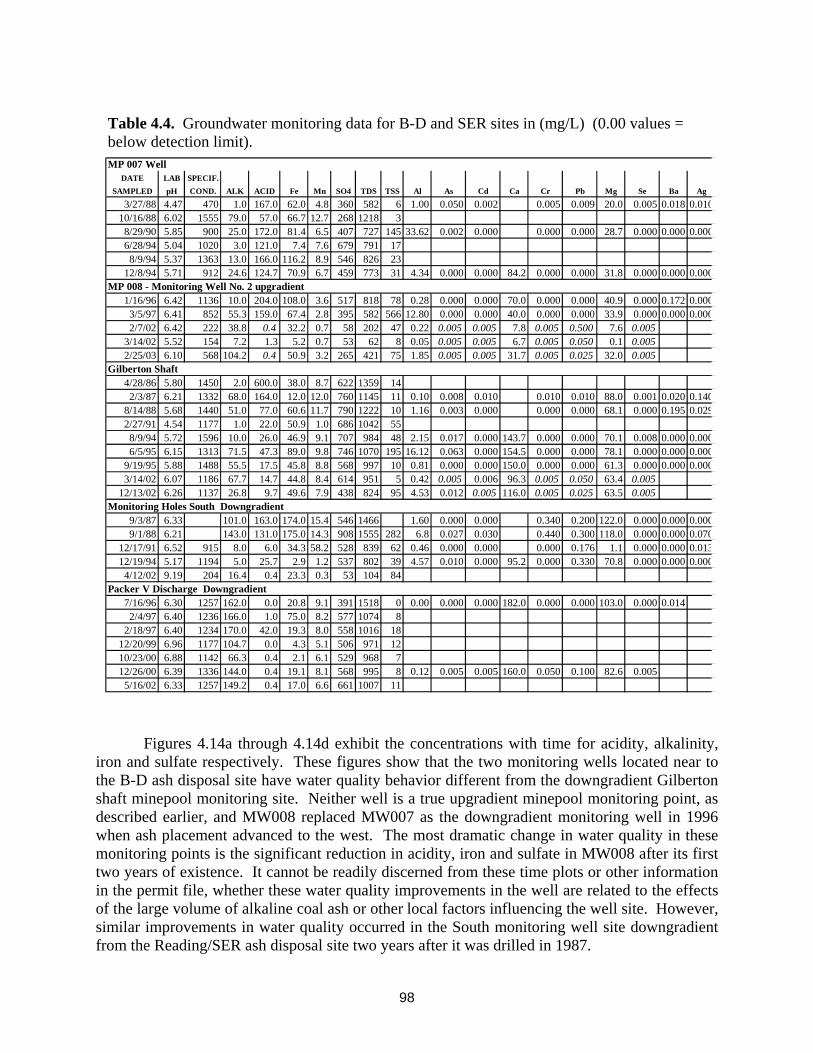
Table 4.4. Groundwater monitoring data for B-D and SER sites in (mg/L) (0.00 values = below detection limit). MP 007 Well
DATE LAB SPECIF.SAMPLED pH COND. ALK ACID Fe Mn SO4 TDS TSS Al As Cd Ca Cr Pb Mg Se Ba Ag
3/27/88 4.47 470 1.0 167.0 62.0 4.8 360 582 6 1.00 0.050 0.002 0.005 0.009 20.0 0.005 0.018 0.01010/16/88 6.02 1555 79.0 57.0 66.7 12.7 268 1218 3
8/29/90 5.85 900 25.0 172.0 81.4 6.5 407 727 145 33.62 0.002 0.000 0.000 0.000 28.7 0.000 0.000 0.0006/28/94 5.04 1020 3.0 121.0 7.4 7.6 679 791 178/9/94 5.37 1363 13.0 166.0 116.2 8.9 546 826 23
12/8/94 5.71 912 24.6 124.7 70.9 6.7 459 773 31 4.34 0.000 0.000 84.2 0.000 0.000 31.8 0.000 0.000 0.000MP 008 - Monitoring Well No. 2 upgradient
1/16/96 6.42 1136 10.0 204.0 108.0 3.6 517 818 78 0.28 0.000 0.000 70.0 0.000 0.000 40.9 0.000 0.172 0.0003/5/97 6.41 852 55.3 159.0 67.4 2.8 395 582 566 12.80 0.000 0.000 40.0 0.000 0.000 33.9 0.000 0.000 0.0002/7/02 6.42 222 38.8 0.4 32.2 0.7 58 202 47 0.22 0.005 0.005 7.8 0.005 0.500 7.6 0.005
3/14/02 5.52 154 7.2 1.3 5.2 0.7 53 62 8 0.05 0.005 0.005 6.7 0.005 0.050 0.1 0.0052/25/03 6.10 568 104.2 0.4 50.9 3.2 265 421 75 1.85 0.005 0.005 31.7 0.005 0.025 32.0 0.005
Gilberton Shaft4/28/86 5.80 1450 2.0 600.0 38.0 8.7 622 1359 142/3/87 6.21 1332 68.0 164.0 12.0 12.0 760 1145 11 0.10 0.008 0.010 0.010 0.010 88.0 0.001 0.020 0.140
8/14/88 5.68 1440 51.0 77.0 60.6 11.7 790 1222 10 1.16 0.003 0.000 0.000 0.000 68.1 0.000 0.195 0.0292/27/91 4.54 1177 1.0 22.0 50.9 1.0 686 1042 558/9/94 5.72 1596 10.0 26.0 46.9 9.1 707 984 48 2.15 0.017 0.000 143.7 0.000 0.000 70.1 0.008 0.000 0.0006/5/95 6.15 1313 71.5 47.3 89.0 9.8 746 1070 195 16.12 0.063 0.000 154.5 0.000 0.000 78.1 0.000 0.000 0.000
9/19/95 5.88 1488 55.5 17.5 45.8 8.8 568 997 10 0.81 0.000 0.000 150.0 0.000 0.000 61.3 0.000 0.000 0.0003/14/02 6.07 1186 67.7 14.7 44.8 8.4 614 951 5 0.42 0.005 0.006 96.3 0.005 0.050 63.4 0.005
12/13/02 6.26 1137 26.8 9.7 49.6 7.9 438 824 95 4.53 0.012 0.005 116.0 0.005 0.025 63.5 0.005Monitoring Holes South Downgradient
9/3/87 6.33 101.0 163.0 174.0 15.4 546 1466 1.60 0.000 0.000 0.340 0.200 122.0 0.000 0.000 0.0009/1/88 6.21 143.0 131.0 175.0 14.3 908 1555 282 6.8 0.027 0.030 0.440 0.300 118.0 0.000 0.000 0.070
12/17/91 6.52 915 8.0 6.0 34.3 58.2 528 839 62 0.46 0.000 0.000 0.000 0.176 1.1 0.000 0.000 0.01312/19/94 5.17 1194 5.0 25.7 2.9 1.2 537 802 39 4.57 0.010 0.000 95.2 0.000 0.330 70.8 0.000 0.000 0.000
4/12/02 9.19 204 16.4 0.4 23.3 0.3 53 104 84Packer V Discharge Downgradient
7/16/96 6.30 1257 162.0 0.0 20.8 9.1 391 1518 0 0.00 0.000 0.000 182.0 0.000 0.000 103.0 0.000 0.0142/4/97 6.40 1236 166.0 1.0 75.0 8.2 577 1074 8
2/18/97 6.40 1234 170.0 42.0 19.3 8.0 558 1016 1812/20/99 6.96 1177 104.7 0.0 4.3 5.1 506 971 1210/23/00 6.88 1142 66.3 0.4 2.1 6.1 529 968 712/26/00 6.39 1336 144.0 0.4 19.1 8.1 568 995 8 0.12 0.005 0.005 160.0 0.050 0.100 82.6 0.005
5/16/02 6.33 1257 149.2 0.4 17.0 6.6 661 1007 11
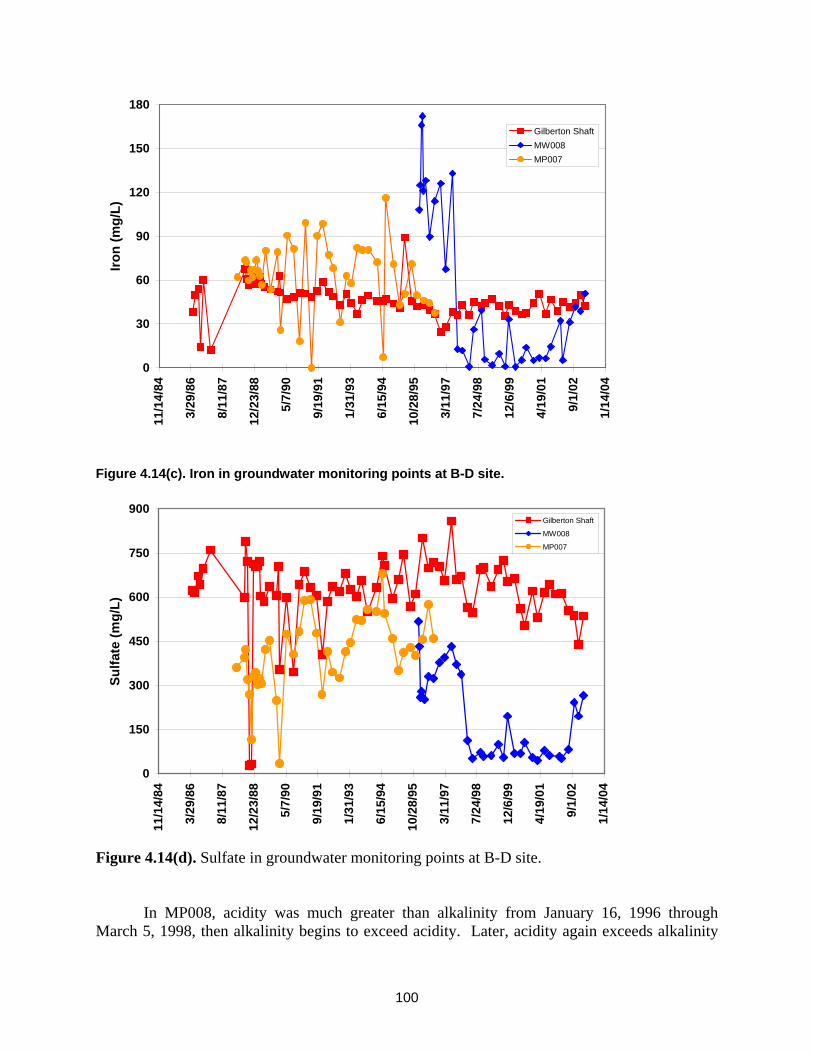
Figures 4.14a through 4.14d exhibit the concentrations with time for acidity, alkalinity, iron and sulfate respectively. These figures show that the two monitoring wells located near to the B-D ash disposal site have water quality behavior different from the downgradient Gilberton shaft minepool monitoring site. Neither well is a true upgradient minepool monitoring point, as described earlier, and MW008 replaced MW007 as the downgradient monitoring well in 1996 when ash placement advanced to the west. The most dramatic change in water quality in these monitoring points is the significant reduction in acidity, iron and sulfate in MW008 after its first two years of existence. It cannot be readily discerned from these time plots or other information in the permit file, whether these water quality improvements in the well are related to the effects of the large volume of alkaline coal ash or other local factors influencing the well site. However, similar improvements in water quality occurred in the South monitoring well site downgradient from the Reading/SER ash disposal site two years after it was drilled in 1987.
98

0
50
100
150
200
250
300
11/1
4/84
3/29
/86
8/11
/87
12/2
3/88
5/7/
90
9/19
/91
1/31
/93
6/15
/94
10/2
8/95
3/11
/97
7/24
/98
12/6
/99
4/19
/01
9/1/
02
1/14
/04
Aci
dity
(mg/
L)
Gilberton ShaftMW008MP007
Figure 4.14(a). Acidity in groundwater monitoring points at B-D site.
0
20
40
60
80
100
120
11/1
4/84
3/29
/86
8/11
/87
12/2
3/88
5/7/
90
9/19
/91
1/31
/93
6/15
/94
10/2
8/95
3/11
/97
7/24
/98
12/6
/99
4/19
/01
9/1/
02
1/14
/04
Alk
alin
ity (m
g/L)
Gilberton Shaft
MW008
MP007
Figure 4.14(b). Alkalinity in groundwater monitoring points at B-D site.
99
0
30
60
90
120
150
180
11/1
4/84
3/29
/86
8/11
/87
12/2
3/88
5/7/
90
9/19
/91
1/31
/93
6/15
/94
10/2
8/95
3/11
/97
7/24
/98
12/6
/99
4/19
/01
9/1/
02
1/14
/04
Iron
(mg/
L)Gilberton ShaftMW008MP007
Figure 4.14(c). Iron in groundwater monitoring points at B-D site.
0
150
300
450
600
750
900
11/1
4/84
3/29
/86
8/11
/87
12/2
3/88
5/7/
90
9/19
/91
1/31
/93
6/15
/94
10/2
8/95
3/11
/97
7/24
/98
12/6
/99
4/19
/01
9/1/
02
1/14
/04
Sulfa
te (m
g/L)
Gilberton Shaft
MW008
MP007
Figure 4.14(d). Sulfate in groundwater monitoring points at B-D site.
In MP008, acidity was much greater than alkalinity from January 16, 1996 through March 5, 1998, then alkalinity begins to exceed acidity. Later, acidity again exceeds alkalinity
100

but by a much smaller margin. In the South monitoring wells of the SER site, acidity exceeded alkalinity from September 3, 1987 to September 30, 1988 (with both parameters generally being greater than 100 mg/L), then acidity continues to exceed alkalinity, (but concentrations of both parameters are generally less than 50 mg/L) until November 8, 1995, after which alkalinity exceeds acidity from December 1995 to 2003, (generally alkalinity concentrations are more than double the acidity during this period). The median acidity concentration of the South borehole site for 1987 and 1988 is 161 mg/L and the median acidity for 1989 to 2003 is 4.10 mg/L, so there has been a significant reduction in acidity. The median iron concentrations for the same time periods were 168.5 and 22.6 respectively. Figures 4.14a through 4.14d show that the water quality of the monitoring wells varies much more widely than the Gilberton shaft, except for alkalinity of the Gilberton shaft in Figure 4.14b. These data suggest that a more comprehensive and subtle approach to the groundwater data analysis is needed. Figures 4.15a through 4.15c were constructed to evaluate the patterns of variation for several analytes of concern (i.e. aluminum, iron and arsenic) in the solid ash, the SPLP leachate, and an array of groundwater monitoring points.
Figure 4.15a shows the patterns of variation for aluminum in the solid ash, the leachate and the groundwater samples occur over eight orders of magnitude. The median solid ash concentrations of the Gilberton and SER ash are 31,608 and 23,150 mg/kg respectively, while the corresponding median SPLP leachate concentrations for these samples are 2.24 and 2.27 mg/L. The three monitoring wells (South BH, MW7, MW8) are located downgradient of the B-D and SER ash sites and they were mostly installed after ash placement commenced and it was determined that these additional monitoring points were needed. Thus, the data from the first few years of monitoring were compared to the data for all of the later years to determine if there were any noteworthy changes. The data from the early years is shown as MW7-e, for example, and the later years as MW7-l. The median of the Gilberton shaft site from 1986 through 1990 is 0.88 mg/L, and the median of the data set from 1991 through 2003 is 0.81 mg/L. The median aluminum concentration of the Packer V discharge is 0.06 mg/L for 12 samples that are all below 1.0 mg/L. Therefore, the inference that can be made from the aluminum data arrayed in Figure 14.15a, (using medians of the frequency distributions as the measure of central tendency), is that the placement of more than 15 million tons of coal ash within the watershed did not result in significant aluminum increases in any of the downgradient monitoring wells, and the median aluminum concentration of the key downgradient minepool monitoring points at the Gilberton shaft and Packer V discharge have been relatively constant at less than 1.0 mg/L before ash placement to the present, despite the relatively high aluminum concentrations in the ash.
101

A l F in g e r p r in t
0 .0 1
0 .1 0
1 .0 0
1 0 .0 0
1 0 0 .0 0
1 0 0 0 .0 0
1 0 0 0 0 .0 0
1 0 0 0 0 0 .0 0
1 0 0 0 0 0 0 .0 0
G PS o l id
S E RS o l id
G P -S P L P
S E R -S P L P
S o u t hB H - e
S o u t hB H - l
M W 7 - e M W 7 - l M W 8 - e M W 8 - l G S - e G S - l P V
Figure 4.15(a). Aluminum content of solid ash, SPLP leachate and groundwater monitoring points (solid ash expressed in mg/kg, all other items expressed as mg/L).
F e F in g e r p r in t
0 .0 1
0 .1 0
1 .0 0
1 0 .0 0
1 0 0 .0 0
1 0 0 0 .0 0
1 0 0 0 0 .0 0
1 0 0 0 0 0 .0 0
G PS o l id
S E RS o l id
G P -S P L P
S E R -S P L P
S o u t hB H - e
S o u t hB H - l
M W 7 - e M W 7 - l M W 8 - e M W 8 - l G S - e G S - l P V
4.15(b). Iron content of solid ash, SPLP leachate and groundwater monitoring points.
A s F in g e r p r in t
0 .0 0 1
0 .0 1 0
0 .1 0 0
1 .0 0 0
1 0 .0 0 0
1 0 0 .0 0 0
1 0 0 0 .0 0 0
G PS o l id
S E RS o l id
G P -S P L P
S E R -S P L P
S o u t hB H - e
S o u t hB H - l
M W 7 - e M W 7 - l M W 8 - e M W 8 - l G S - e G S - l P V
4.15(c). Arsenic content of solid ash, SPLP leachate and groundwater monitoring points.
102
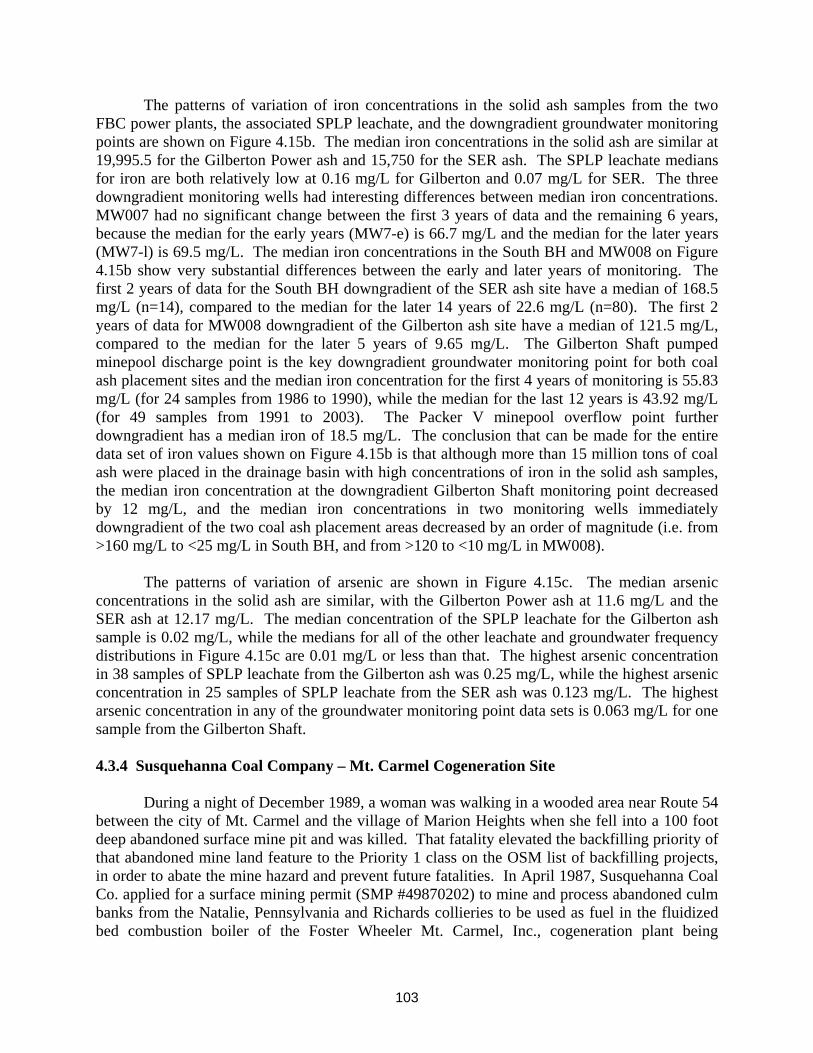
The patterns of variation of iron concentrations in the solid ash samples from the two FBC power plants, the associated SPLP leachate, and the downgradient groundwater monitoring points are shown on Figure 4.15b. The median iron concentrations in the solid ash are similar at 19,995.5 for the Gilberton Power ash and 15,750 for the SER ash. The SPLP leachate medians for iron are both relatively low at 0.16 mg/L for Gilberton and 0.07 mg/L for SER. The three downgradient monitoring wells had interesting differences between median iron concentrations. MW007 had no significant change between the first 3 years of data and the remaining 6 years, because the median for the early years (MW7-e) is 66.7 mg/L and the median for the later years (MW7-l) is 69.5 mg/L. The median iron concentrations in the South BH and MW008 on Figure 4.15b show very substantial differences between the early and later years of monitoring. The first 2 years of data for the South BH downgradient of the SER ash site have a median of 168.5 mg/L (n=14), compared to the median for the later 14 years of 22.6 mg/L (n=80). The first 2 years of data for MW008 downgradient of the Gilberton ash site have a median of 121.5 mg/L, compared to the median for the later 5 years of 9.65 mg/L. The Gilberton Shaft pumped minepool discharge point is the key downgradient groundwater monitoring point for both coal ash placement sites and the median iron concentration for the first 4 years of monitoring is 55.83 mg/L (for 24 samples from 1986 to 1990), while the median for the last 12 years is 43.92 mg/L (for 49 samples from 1991 to 2003). The Packer V minepool overflow point further downgradient has a median iron of 18.5 mg/L. The conclusion that can be made for the entire data set of iron values shown on Figure 4.15b is that although more than 15 million tons of coal ash were placed in the drainage basin with high concentrations of iron in the solid ash samples, the median iron concentration at the downgradient Gilberton Shaft monitoring point decreased by 12 mg/L, and the median iron concentrations in two monitoring wells immediately downgradient of the two coal ash placement areas decreased by an order of magnitude (i.e. from >160 mg/L to <25 mg/L in South BH, and from >120 to <10 mg/L in MW008).
The patterns of variation of arsenic are shown in Figure 4.15c. The median arsenic concentrations in the solid ash are similar, with the Gilberton Power ash at 11.6 mg/L and the SER ash at 12.17 mg/L. The median concentration of the SPLP leachate for the Gilberton ash sample is 0.02 mg/L, while the medians for all of the other leachate and groundwater frequency distributions in Figure 4.15c are 0.01 mg/L or less than that. The highest arsenic concentration in 38 samples of SPLP leachate from the Gilberton ash was 0.25 mg/L, while the highest arsenic concentration in 25 samples of SPLP leachate from the SER ash was 0.123 mg/L. The highest arsenic concentration in any of the groundwater monitoring point data sets is 0.063 mg/L for one sample from the Gilberton Shaft. 4.3.4 Susquehanna Coal Company – Mt. Carmel Cogeneration Site
During a night of December 1989, a woman was walking in a wooded area near Route 54 between the city of Mt. Carmel and the village of Marion Heights when she fell into a 100 foot deep abandoned surface mine pit and was killed. That fatality elevated the backfilling priority of that abandoned mine land feature to the Priority 1 class on the OSM list of backfilling projects, in order to abate the mine hazard and prevent future fatalities. In April 1987, Susquehanna Coal Co. applied for a surface mining permit (SMP #49870202) to mine and process abandoned culm banks from the Natalie, Pennsylvania and Richards collieries to be used as fuel in the fluidized bed combustion boiler of the Foster Wheeler Mt. Carmel, Inc., cogeneration plant being
103

constructed on-site (Fig. 4.16). That SMP was issued on August 24, 1987 and included approval to place fly ash and bottom ash from the cogeneration plant in the abandoned pit and adjacent areas. By 1995, all of the abandoned pits (except for an access area near the ash conveyor) were reclaimed to approximate original contour at no cost to the state or federal government (Fig. 4.17b).
The Susquehanna Coal Co. site is located in Mount Carmel and Coal Townships in Northumberland County. The SMP boundary of the 788 acre site is shown on Figure 4.16. The SMP overlies four abandoned underground mines. These mines are, from east to west, the Richards Water Level, Natalie, Hickory Ridge and Hickory Swamp Collieries. The area of the Richards Colliery within the SMP is very minor, and near to the cogeneration plant site adjacent to Route 54; thus Borehole No. 48 shown on Figure 4.16 serves as an upgradient monitoring well. Most of the permit area, including the ash placement areas, is overlying the Natalie and Hickory Ridge Collieries. These four abandoned underground mines and several additional adjacent collieries are all hydrologically interconnected through breeched, leaking barrier pillars, with the Scott overflow shown on Figure 4.16 being the major mine discharge point. The Scott discharge emanates from the Scott Colliery located south of the permit area. These collieries are within the western portion of the Western Middle Field.
Geologically, the site is located within the Western Middle Synclinorium, which is depicted by Arndt (1971). Of the many anticlines and synclines within this synclinorium, the axis of the Hickory Swamp Syncline passes directly through the permit area and is parallel to the long dimension of the SMP boundary shown on Figure 4.16. Hence, the abandoned surface mine pits and the extensive abandoned coal refuse piles within the permit area shown on Figure 4.17, sat within this relatively narrow trough-like geologic structure, and were underdrained through abandoned underground mine voids to the Scott Overflow. Millions of tons of these coal refuse deposits were mined, transported to the cogeneration plant by a conveyor system and combusted with limestone in the circulating fluidized bed boiler. The resultant alkaline coal ash has been returned to an abandoned surface mine pit by a conveyor system (with trucks currently used to transport ash to western portions of the SMP that are out of reach of the conveyor). The coal ash deposits on the site range from greater than 50 feet thickness in the area of prior deep abandoned pits, to relatively thin veneers of coal ash used to regrade and reclaim other abandoned mine land features (Fig. 4.17). Any water infiltrating through these reclaimed coal ash areas or active coal ash placement areas will flow within the synclinal trough, and thence through cross-connecting mine voids to the Scott Overflow shown on Figure 4.16. Apparently, this groundwater flow system functions effectively as an underdrain for the site.
104

Figure 4.16. Site map of Susquehanna Coal – Mt Carmel Cogeneration site.
The Mount Carmel cogeneration plant consumed a total of 8,078,820 tons of coal refuse from 1990 through 2002, and produced 5,432,975 tons of alkaline coal ash for mine reclamation on-site during that 13 year period. The average yearly culm consumption was 621,448 tons, and the average annual coal ash production was 417,921 tons. A total of 209 acres of abandoned mine lands were reclaimed with coal ash within the SMP for an average of 16.1 acres reclaimed per year. Recent permit maps show the active coal ash placement area is 21.26 acres.
105
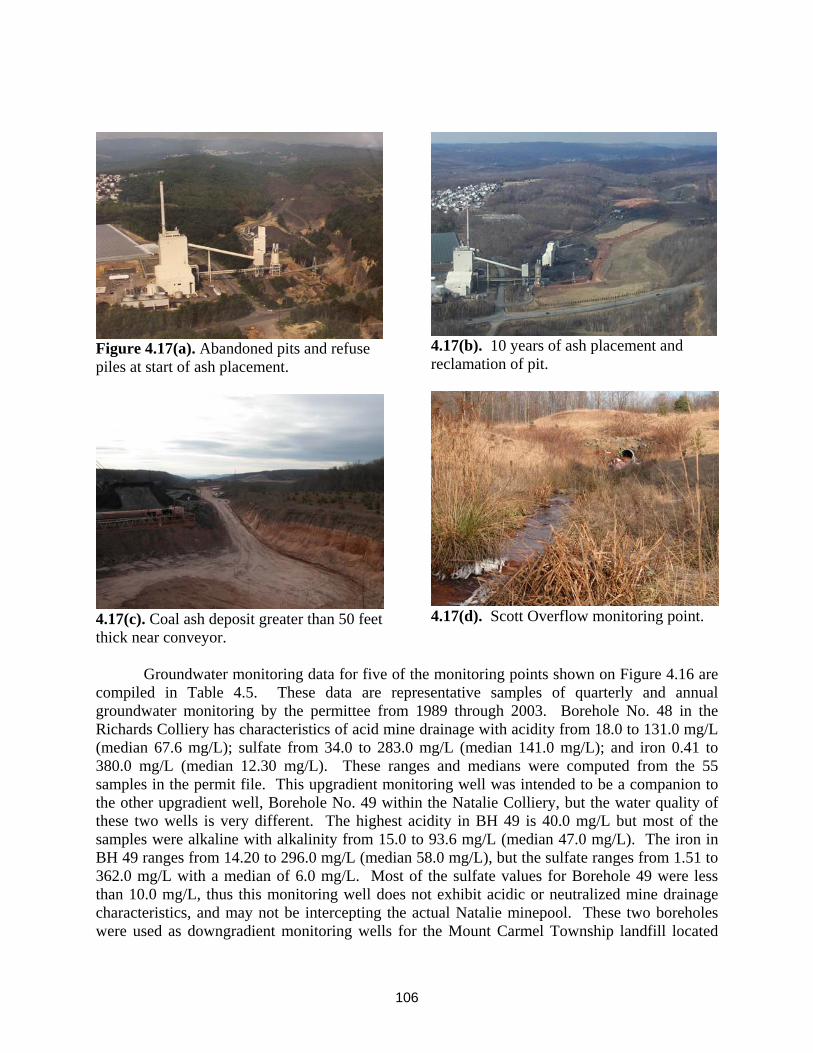
Figure 4.17(a). Abandoned pits and refuse piles at start of ash placement.
4.17(c). Coal ash deposit greater than 50 feet thick near conveyor.
4.17(b). 10 years of ash placement and reclamation of pit.
4.17(d). Scott Overflow monitoring point.
Groundwater monitoring data for five of the monitoring points shown on Figure 4.16 are compiled in Table 4.5. These data are representative samples of quarterly and annual groundwater monitoring by the permittee from 1989 through 2003. Borehole No. 48 in the Richards Colliery has characteristics of acid mine drainage with acidity from 18.0 to 131.0 mg/L (median 67.6 mg/L); sulfate from 34.0 to 283.0 mg/L (median 141.0 mg/L); and iron 0.41 to 380.0 mg/L (median 12.30 mg/L). These ranges and medians were computed from the 55 samples in the permit file. This upgradient monitoring well was intended to be a companion to the other upgradient well, Borehole No. 49 within the Natalie Colliery, but the water quality of these two wells is very different. The highest acidity in BH 49 is 40.0 mg/L but most of the samples were alkaline with alkalinity from 15.0 to 93.6 mg/L (median 47.0 mg/L). The iron in BH 49 ranges from 14.20 to 296.0 mg/L (median 58.0 mg/L), but the sulfate ranges from 1.51 to 362.0 mg/L with a median of 6.0 mg/L. Most of the sulfate values for Borehole 49 were less than 10.0 mg/L, thus this monitoring well does not exhibit acidic or neutralized mine drainage characteristics, and may not be intercepting the actual Natalie minepool. These two boreholes were used as downgradient monitoring wells for the Mount Carmel Township landfill located
106

immediately east of the permit area. There is the possibility that the alkalinity in BH 49 is attributable to landfill leachate or sewage. However, significant influence from landfill leachate can probably be ruled out, based upon 18 groundwater analyses that were conducted for Chemical Oxygen Demand (COD). In these analyses, the COD for BH 48 ranged from 7.70 to 43.20 mg/L, while the COD for BH 49 ranged from 0 to 69.0 mg/L. According to a 1986 EPA study, which sampled leachate from municipal waste landfills throughout the United States, the median COD was 2,800 mg/L and the maximum was 50,450 mg/L. Table 4.5. Groundwater monitoring data of the Susquehanna site in (mg/L). (0.00 values = below detection limit).
SPECIF. SAMPLED pH COND. ALK ACID Fe Mn SO4 TDS TSS Al As Cd Ca Cr PbB.H. #31 Greenough
7/9/90 4.85 450 11.2 26.9 64.0 2.3 71 341 533/10/92 6.60 380 79.0 0.0 22.9 1.5 26 215 249/19/95 6.10 327 105.0 0.0 27.0 1.7 81 158 26 0.00 0.000 0.000 30.2 0.000 0.0008/27/99 6.10 590 46.8 0.0 18.9 2.0 81 316 14 0.70 0.005 0.010 32.1 0.040 0.1009/29/00 6.04 548 60.0 1.0 24.4 2.0 90 303 3 1.00 0.005 0.010 31.6 0.040 0.1008/6/01 4.12 445 3.6 24.0 10.3 2.3 80 290 20 1.30 0.005 0.010 3.4 0.040 0.100
11/6/01 5.48 430 39.9 1.0 16.5 1.8 72 254 10
B.H. #48 Richards Water Level6/29/90 3.55 700 0.0 61.6 60.0 4.5 133 452 229 5.20 0.000 0.000 0.000 0.0006/13/94 3.70 557 0.0 67.6 8.6 4.7 278 524 253/6/95 3.80 656 0.0 79.2 25.0 4.2 283 532 36
9/26/95 3.60 684 0.0 81.0 28.0 5.1 179 559 45 7.20 0.000 0.000 20.7 0.000 0.00012/8/98 3.67 1350 0.0 70.0 2.4 4.3 141 589 59/23/99 3.61 1120 0.0 66.5 12.3 5.2 225 586 4 8.40 0.005 0.010 20.8 0.040 0.1006/13/00 3.48 488 1.0 131.0 380.0 3.9 120 764 900
B.H. #49 Natalie6/9/92 5.90 105 38.0 40.0 51.0 0.8 2 73 78
9/30/93 6.20 98 45.0 0.0 44.0 0.9 362 58 86 0.00 0.000 0.000 0.000 0.00012/22/96 6.11 246 47.0 2.5 53.4 1.0 152 114 409/25/97 6.37 93 63.0 0.0 296.0 1.1 6 82 332 3.50 0.000 0.000 7.4 0.000 0.0008/27/99 6.19 275 93.6 0.0 159.0 1.2 2 166 274 1.20 0.005 0.010 9.7 0.040 0.1003/2/01 5.75 200 36.0 1.0 58.0 1.0 3 84 120
B.H. #50 Hickory Ridge7/9/90 6.60 75 43.0 0.0 26.3 0.4 2 37 88 0.00 0.000 0.000 0.000 0.0008/3/90 2.49 1200 0.0 464.0 21.0 0.3 5 105 15
3/22/94 6.50 569 83.0 0.0 20.0 0.4 0 372 3612/14/94 5.87 472 43.0 22.0 31.0 4.0 341 435 1 0.00 0.000 0.000 47.2 0.000 0.00012/17/99 6.00 127 45.0 0.0 34.2 0.3 0 50 54
8/7/02 6.50 96 14.4 1.0 10.0 0.5 3 94 6 0.70 0.005 0.010 10.4 0.040 0.1003/12/03 6.58 1060 56.0 1.0 7.4 0.6 25 756 188/7/03 6.78 133 20.1 0.4 21.3 1.4 2 67 51
Scott overflow10/16/89 6.52 660 38.0 54.8 31.2 4.6 371 200 4
2/2/90 6.50 650 38.0 35.1 26.5 4.3 248 20 1210/3/90 6.05 658 32.3 30.4 23.5 3.8 170 546 04/9/91 5.67 700 38.0 82.0 28.0 3.8 260 450 2
Borehole No. 31 in the Greenough minepool and Borehole No. 50 in the Hickory Ridge Colliery are both of questionable value as long-term groundwater monitoring points for the
107

Susquehanna Coal Co. site. This monitoring well has a chemical signature that resembles neutralized acid mine drainage, but there are no distinct trends of water quality improvement nor degradation. Further, from its location, BH 31 cannot be considered an upgradient well, but it is unlikely to be a reliable downgradient monitoring well.
0
20
40
60
80
100
120
140
160
9/1/
89
1/14
/91
5/28
/92
10/1
0/93
2/22
/95
7/6/
96
11/1
8/97
4/2/
99
8/14
/00
12/2
7/01
5/11
/03
Aci
dity
(mg/
L)
BH 48Scott OFRichards Colliery
Figure 4.18(a). Acidity in upgradient monitoring points and downgradient Scott Overflow at the Susquehanna site.
igure 4.18(b). Alkalinity increase in downgradient Scott Overflow.
0102030405060708090
9/1/
89
1/14
/91
5/28
/92
10/1
0/93
2/22
/95
7/6/
96
11/1
8/97
4/2/
99
8/14
/00
12/2
7/01
5/11
/03
Alk
alin
ity (m
g/L)
BH 48Scott OFLinear (Scott OF)
F
108

The location of Borehole 50 within the Hickory Ridge Colliery should make it a suitable downgradient monitoring well, at the southern edge of the permit area (Fig. 4.16) and north of the Scott Overflow discharge. However, its chemical signature does not resemble mine drainage, and the well is little value in groundwater quality interpretation related to the surface mine and ash placement site. The sulfates in Borehole 50 are less than 10.0 mg/L in 47 of 55 samples in the data set. The median alkalinity is 45 mg/L and most of the samples fluctuate about that concentration from 1988 to 2003; thus, there is no apparent trend of increasing or decreasing alkalinity concentrations. Also, there were only 2 samples with detectable acidity concentrations. This water is not representative of acidic or neutralized minepool water quality, and clearly does not represent groundwater influenced by the area of coal ash placement. Thus the water quality data from BH 50 and BH 31 were deemed to be unworthy of further consideration.
0
100
200
300
400
500
600
700
9/1/
89
1/14
/91
5/28
/92
10/1
0/93
2/22
/95
7/6/
96
11/1
8/97
4/2/
99
8/14
/00
12/2
7/01
5/11
/03
Sulfa
te (m
g/L)
Scott OFBH 48
Figure 4.18(c). Sulfate in monitoring points at the Susquehanna Coal site.
The Scott Overflow is considered the most reliable downgradient groundwater monitoring point for the Susquehanna Coal Co. permit site. It exhibits a discernable trend of groundwater quality improvement, which is most likely attributed to the beneficial use of coal ash in mine reclamation, plus the removal of large volumes of coal refuse for combustion in the FBC power plant. USGS sample data of the Scott discharge from 1975 (Growitz, et al., 1985) and 1991 (Wood, 1996) show that the flow of the discharge was measured at 15 cfs (6733 gpm) on April 17, 1975 and a flow of 4.8 cfs (2154 gpm) on November 1, 1991. The acidity in the 1975 sample was 165 mg/L and 161 mg/L in 1991. The alkalinity concentration of the 1975 sample was 16 mg/L, and the 1991 sample was 38 mg/L. Representative samples from the permittee’s self-monitoring data are in Table 4.5. Of the 60 permittee’s monitoring samples of the Scott Overflow in the DEP permit file, the median acidity is 26.15 mg/L and the median alkalinity is 43.0 mg/L. Acidity exceeds alkalinity in 12 out of 60 samples in this data set, but 7 of these are in 1989 and 1990, when ash placement on the site was in its infancy (Fig. 4.18a), and the last time that acidity exceeded alkalinity was the sample of December 15, 1994. The median
109

alkalinity for the samples prior to 1991 is 32.3 mg/L as compared to the median alkalinity of 44 mg/L for all samples from 1991 to 2003. The corresponding median acidity values are 35.1 mg/L for pre 1991 samples, and 21.3 mg/L for the past 12 years. This trend of acidity reduction is shown on Figure 4.18a for the Scott Overflow discharge as compared to the relatively consistent acidity in upgradient monitoring well BH 48. The corresponding trend of increasing alkalinity concentration in the Scott Overflow discharge is shown in Figure 4.18b. The least- squares trend line fitted to the alkalinity data for the Scott Overflow indicates an increase through time, however, the plotted monitoring data are not equally spaced through time – so the slope of the line may not be an accurate representation of the actual time trend. There also has been a subtle trend of decreasing sulfate concentration in the Scott discharge since 1995 as shown on Figure 4.18c. This indicates that the acidity production at the Mt. Carmel cogeneration plant site may be decreasing due to the removal of the coal refuse and the concomitant addition of alkaline coal ash to reclaim abandoned pits on the site. 4.4 DISCUSSION AND CONCLUSIONS 4.4.1 Groundwater Monitoring Summary
The potential difficulties and complexities of developing realistic groundwater monitoring plans for some coal ash placement sites in the anthracite region of Pennsylvania were discussed in Section 4.2. That section also described the multitude of abandoned underground mines (collieries) in the four anthracite coal fields, and the presence of large multi-colliery hydrologic units, that have resulted over time (during deep mining and post-mining) due to breached barrier pillars and other interconnections between adjacent collieries. Examples of major abandoned underground mine discharge points, draining thousands of acres of these hydrologically interconnected collieries, were given in Section 4.2, and minepool monitoring data for several of these large discharge points located downgradient from coal ash sites was tabulated for the Gilberton Shaft and Packer V discharges (Table 4.4) in Section 4.3.3, and for the Scott Overflow discharge (Table 4.5) in Section 4.3.4.
The potential problems of locating and drilling meaningful monitoring wells for upgradient and downgradient monitoring of coal ash sites was also discussed in Section 4.2. In each of the case study sites described in Section 4.3, there were some monitoring well difficulties related to the presence of problems with the well(s) or the absence of good monitoring well locations. On the Alden site the upgradient wells behaved erratically and appeared to be independent of the downgradient wells and the Alden shaft (Fig. 4.5), although all five of these monitoring points were located within the shoreline of the Alden minepool. On the Wheelabrator site, the downgradient Morea minepool discharge point showed some subtle signs of water quality improvements through time (Fig. 4.8) that may be related to coal ash placement, but the absence of one or more upgradient monitoring wells in the Morea or New Boston collieries make interpretation of the data more difficult. In the area of the B-D Mining permit site, it was stated that an upgradient minepool monitoring well location for the main ash disposal silt dam could not be located, due to the barrier pillar configuration between the Boston Run and Tunnel Ridge Collieries. In addition, the water quality fluctuated widely in downgradient monitoring wells MW007 and MW008 for the B-D ash area (Fig. 4.14) and the downgradient South well for the SER ash area, while some meaningful data were obtained from these three
110

wells. On the Susquehanna mine site, two of the four monitoring wells do not provide meaningful minepool data, and a third well is of questionable value. Upgradient monitoring well BH49 may be outside of the shoreline of the Natalie pool or influenced by other factors, because its water quality does not resemble mine drainage (Fig. 4.16). Downgradient Borehole 50 in the Hickory Ridge Colliery also lacks the chemical signature (i.e. it has very low sulfate concentrations) of acidic or neutralized mine drainage, and Borehole 31 in the Greenough pool is questionable. Fortunately, Borehole 48 appears to be a good upgradient monitoring well for this site, and the Scott Overflow is an effective downgradient groundwater monitoring point.
These observations from minepool monitoring wells lead to some conclusions and recommendations about the relative usefulness (advantages and disadvantages) of monitoring wells, shafts and minepool overflows as meaningful groundwater monitoring points. This also leads to the conclusion that monitoring wells are not the only tool or sole source of good groundwater data; shafts, tunnels, airways and other deep mine openings may be suitable groundwater monitoring points.
The Gilberton Shaft described in Section 4.3.3 is an ideal groundwater monitoring point, because the minepool there is continuously pumped at 11,300 gpm by the DEP Bureau of Abandoned Mine Reclamation (to prevent flooding of homes in the village of Gilberton) and discharged to the Mahanoy Creek. Thus, it functions like a giant pumped water well, drawing down the minepool, and inducing groundwater flow to it that might otherwise bypass a more static shaft location. It also serves as a very accessible groundwater sampling site (i.e. the pumped discharge). However, with respect to sampling accessibility, many shafts in the four anthracite fields were filled in by the state and federal government, to eliminate mine hazards and public health and safety problems. The Packer V minepool overflow in Girardville, as described in Section 4.3.3, and the Scott Overflow described in Section 4.3.4 are good examples of large minepool discharges from multi-colliery hydrologic units, that serve as useful downgradient monitoring points for coal ash placement sites.
The purpose of this groundwater monitoring summary is to illustrate that developing realistic groundwater monitoring plans for anthracite coal ash sites should include some combination of monitoring wells and shafts or minepool overflow discharges, because each of these groundwater monitoring tools has been shown, in the four case studies and the discussion in Section 4.2, to have some advantages and disadvantages – so there is no guarantee that any of these tools alone, is sufficient to get the job done. Also, the summary and case study sites data hopefully conveys the reality that interpretation of minepool monitoring data can be tricky business – so scientists from regulatory agencies, academia, industry and environmental groups should be mindful of the potential complexities, and careful and thorough in their interpretations and conclusions about the effects of coal ash sites upon the minepool chemistry. 4.4.2 Factors Influencing Detection of Beneficial or Adverse Effects of Coal Ash Sites Upon Minepool Discharge Quality
Some anthracite coal ash sites exhibit a distinct effect upon minepool chemistry (e.g. reduction in acidity/increased alkalinity) at downgradient minepool discharge sites; for other coal ash sites any effects are more subtle, ranging from barely discernable to non-detectable. The last
111

two categories include monitoring points where there is little to no apparent change in water quality parameters over time, and graphs where the sample to sample variation is so great and erratic that no trend can be discerned. The following characteristics of the coal ash placement site and the minepool system are believed to determine the magnitude of any water quality effects:
• The size of the minepool drainage area (for multi-colliery hydrologic units, the subsurface groundwater drainage area may be thousands of acres, and include more than one surface-water watershed, e.g. Jeddo Tunnel drains 32.24 square miles).
• The flow volume of the minepool discharge (should be proportional to the first factor of
drainage area size; some minepool discharges are on the order of a hundred(s) of gallons per minute, the Jeddo Tunnel averages 40,000 gpm and was measured at 190,000 gpm in 1996 by USGS and DEP).
• The size of the coal ash placement area and ash volume (a 10 acre ash site may not
produce a detectable change in the typical minepool discharge, but a 100 acre site might).
• The ratio of the coal ash site acreage to the minepool drainage area acreage.
• The thickness and permeability of the coal ash deposit (on the Wheelabrator site the coal ash was placed in relatively thin layers or lenses, less than 25 feet thick in relatively shallow abandoned surface mine pits; on the B-D Mining and SER ash sites, the ash was placed in abandoned coal silt dam structures, with a total ash thickness of 50 to 100 feet).
• The bulk chemistry and mineralogy of the coal ash deposit (if the coal ash is from a FBC
plant and contains a significant amount of unreacted calcium hydroxide, the Neutralization Potential value of the ash will be high, and the ash deposit should produce high pH, high alkalinity groundwater flow to the minepool).
• The acidity to alkalinity ratio in the minepool (some anthracite minepool discharges have
relatively high acidity and negligible alkalinity, some have relatively high alkalinity and negligible acidity, and some have appreciable acidity and alkalinity concentrations (50 mg/L to > 100 mg/L of both) – which is relatively rare in natural groundwaters in Pennsylvania (see the Gilberton Shaft and South boreholes in Table 4.4 and the Scott overflow in Table 4.5, compared to the Wheelabrator example in Fig. 4.8a)).
• The geologic structure underlying the surface mine coal ash site and the associated
minepool (e.g. the Susquehanna site is in a relatively tight synclinal structure, and groundwater flow within this trough-like structure is apparently connected to the Scott Overflow).
• Underground mine development features (e.g. gangways, rock cross-cut tunnels, inside
slopes) that may serve as conduits or pathways to direct minepool/groundwater flow from coal ash sites toward or away from (bypass) downgradient groundwater monitoring points.
112

Three possible interpretive scenarios emerge from interactions of the coal ash site and minepool characteristics listed above: (a) significant improvement in water quality parameters at minepool monitoring points from beneficial use of coal ash in mine reclamation, (b) no significant change in minepool chemistry associated with the coal ash, and (c) a significant degradation in minepool chemistry and pollution loading at downgradient minepool discharge locations attributable to the coal ash placement. Fortunately, for the interests of the coal mining/electrical power production industry, the environmental regulatory agencies, and the environmental/citizens groups, none of the type (c) environmental damage scenarios have been found in more than 15 years of compliance monitoring and inspections of anthracite ash sites by DEP staff. The Susquehanna and Westwood sites exhibit significant improvement in alkalinity (type (a) behavior) at downgradient minepool monitoring points (see Figs. 4.18 a and b, and Fig. 4.19), presumably due to a relatively small ratio of minepool drainage area size to coal ash placement area acreage, bulk chemistry of the FBC ash, and favorable geologic structure and underground mine development features, to convey groundwater flow from the coal ash site to the minepool monitoring points. The Northampton-Alden site, the Wheelabrator site, and the B-D/SER sites exhibit the type (b), no significant change, behavior in varying degrees, for a variety of known and unknown reasons. However, when hundreds of acres of abandoned mine lands on these sites are reclaimed (at no cost to the government or taxpayers) with millions of tons of FBC coal ash that contains large amounts (tens of thousands of mg/kg) of aluminum and iron, and there is no discernable degradation of downgradient minepool discharge points with these metals or other analytes of concern, the overall project still represents a significant environmental benefit.
0
20
40
60
80
100
120
140
160
11/1
4/84
8/11
/87
5/7/
90
1/31
/93
10/2
8/95
7/24
/98
4/19
/01
1/14
/04
Alk
alin
ity (m
g/L)
MP-2U (upgradient monitoringwell)MP 3D (downgradientmonitoring well)
start of ash placement
Figure 4.19. Alkalinity in upgradient and downgradient monitoring wells at the Westwood
FBC power plant site.113

4.4.3 Applicability of a Hydrologic Budget Approach to Beneficial Use of Coal Ash in Reclamation of Abandoned Surface Mines
The concept of a hydrologic budget and practice of constructing various types of these hydrologic budgets is described in numerous hydrogeology texts including Walton (1970), Davis and DeWiest (1966), Freeze and Cherry (1979) and White (1988). According to Walton (1970, p. 375), “A hydrologic budget is a quantitative statement of the balance between the total water gains and losses of a basin, for a period of time. The budget considers all waters, surface and subsurface, entering and leaving or stored within a basin. Water entering a basin is equated to water leaving a basin, plus or minus changes in basin storage”. Typically a hydrologic budget is stated as an equation where precipitation equals the sum of numerous components such as surface runoff, groundwater runoff, subsurface underflow, evapotranspiration (ET), change in soil moisture and change in groundwater storage.
A hydrologic budget for the Jeddo Tunnel Basin in the Eastern Middle Field near Hazleton, PA was developed by Ballaron (1999) of the Susquehanna River Basin Commission. In that study, precipitation records were available from several weather stations in the Hazleton area; continuous flow measurements of the Jeddo Tunnel were recorded by USGS (see Fig. 2.17a; and surface runoff was computed based upon flow measurements of several creeks exiting the basin. Ballaron (1999) assumed that recharge equals discharge, so the storage factor in the equation could be ignored, and therefore evapotranspiration was calculated by difference, since surface runoff and groundwater runoff (Jeddo Tunnel discharge) were known from the measurements described above. From an average of three years of measurements (1996 to 1998) Ballaron (1999) computed precipitation of 48.5 inches, equals 3.46” surface runoff (7.1%), plus 32.18” Jeddo Tunnel discharge (66.4%), plus 12.87” evapotranspiration (26.5%). The percentages of water attributable to surface runoff and evapotranspiration in this budget are considerably lower than unmined, well-vegetated watersheds, but it was determined during the study that extensive acreages of abandoned surface mine pits and numerous mine subsidence features in streambeds, within the basin, account for a large percentage of infiltration to the minepool system – and consequently a small percentage of surface water runoff. It was also determined that the low rate of evapotranspiration was related to a lack of luxuriant vegetation, which is in turn related to the lack of well-developed soils on abandoned mine spoils.
The purpose of this hydrologic budget discussion is to briefly evaluate the effects of coal ash placement in abandoned surface mine reclamation as a component in the post-reclamation hydrologic budget. The Wheelabrator case study site described in Section 4.3.2 is selected for this purpose because it is near Hazleton, and the surface water/groundwater relationships are very similar to the Jeddo Tunnel basin, but on a smaller scale – so the hydrologic budget components in Ballaron (1999) are relevant for the pre-reclamation site conditions. Figure 4.6 and the site description in Section 4.3.2 document that there was very little surface runoff from the permit area because the tributary to Mill Creek entering the eastern end of the permit, goes subsurface to the minepool near to the upgradient monitoring point 001, and most of the permit area was covered by extensive abandoned surface mine pits and spoil piles prior to remining and coal ash placement by Wheelabrator. Therefore, the 7.1% surface runoff value used by Ballaron (1999) is probably reasonable and applicable here. Also, the 26.5% evapotranspiration used by Ballaron (1999) is probably applicable, and may be too low for the Wheelabrator site because
114

some areas of the 32.24 square miles of the Jeddo Basin study area were forest covered and would promote higher ET values than the extensively strip mined Wheelabrator site. Using the values from Ballaron (1999) to evaluate the before remining conditions of a 10 acre phase of the Wheelabrator permit area, the annual precipitation of 48.5 inches falling on that 10 acres equals 13.2 million gallons, the surface runoff would be 0.94 million gallons, and the evapotranspiration would be 3.5 million gallons. Therefore the amount of water infiltrating to the minepool from that unreclaimed 10 acre phase would be 8.76 million gallons.
During the coal ash placement and reclamation of cross-hatched areas shown on Figure 4.6 at the Wheelabrator site, the ash was dumped in the working area as shown on Figure 4.7a and spread and compacted in lifts of 2 to 4 feet. At least 8 feet of fill (abandoned mine spoil or coarse refuse material) was placed in the base of abandoned pits, for site preparation, prior to placing the ash in the pit, and 8 feet of that spoil material was placed against any highwall or low wall of the abandoned pit, with 4 feet of mine spoil cover material placed on top of the final compacted ash surface. Thus a cross-section through the relatively shallow abandoned pits (40 ft depth) on the Wheelabrator site would show a lens-shaped compacted ash deposit of about 20 to 25 feet thickness, with an estimated permeability in the range of 10-5 to 10-6 cm/sec groundwater flow, surrounded by more coarse mine spoil (bottom, side and top cover material), with an estimated permeability in the range of 10-1 to 10-3 cm/sec. These permeability estimates for the mine spoil are based upon summary statistics of hydraulic conductivity (K values) reported in Hawkins (2004) and related data in Hawkins (1998) and Hawkins and Aljoe (1991). Groundwater velocities ranging from 1 to greater than 370 meters per day have been recorded in mine spoil of the Appalachian Plateau, according to Hawkins (1998, 2004). Following final grading, with the top one foot of final cover being the best available spoil/soil material on site, the site was revegetated with a mixture of trees, grasses and legumes as shown in Figures 4.7b and 4.7d. The result of this regrading and revegetation of the abandoned mine lands is a significant increase in surface runoff and evopotranspiration, as compared to the hydrologic budget items computed above for site conditions before remining.
A reasonable figure for evapotranspiration from this type of reclaimed surface mine site would be 20 inches/year (M.W. Smith, personal communication, 2004), and an approximate surface runoff of 9.7 inches/year was computed from other hydrologic budget studies in central Pennsylvania (e.g. Taylor et al., 1983; Taylor and Werkheiser, 1984) where annual surface runoff was about 20% of the annual precipitation values. Therefore in the post-reclamation hydrologic budget for the Wheelabrator site area with the presumed annual precipitation of 48.5 inches; the surface runoff term in the hydrologic budget equation would be 9.7 inches (20%) and the evapotranspiration would be 20 inches (41.2%) with the remainder in groundwater runoff/minepool discharge of 18.8 inches (38.8%). The comparison of these revised hydrologic budget values to the unreclaimed site conditions for the 10 acre remining phase, would commence with the annual precipitation of 13.2 million gallons, minus the reclaimed site surface runoff of 2.64 million gallons, minus the revegetated site ET of 5.44 million gallons, to yield the reduced groundwater recharge amount of 5.12 million gallons (compared to 8.76 million gallons in the reclaimed mine site). Total reduction in mine recharge was 3.64 million gallons per year. Given the assumption that recharge to the minepool equals discharge, the flow of the Morea/New Boston minepool discharge at the downgradient monitoring point (002) should decrease by about 41.6 percent, after the entire site is reclaimed.
115

There may be some zones of saturation within the backfilled mine spoil or the coal ash deposit (i.e. groundwater storage), but the minepool is the regional groundwater table of the area, and pursuant to the residual waste regulations and permit conditions, the coal ash must be at least 8 feet above the regional groundwater level (i.e. the “high and dry” concept). Thus, most of the groundwater flow from the point of recharge to the minepool should be under unsaturated conditions, and given the permeability contrast between the compacted ash lenses/layers and the surrounding mine spoil, most of the infiltrating groundwater should run off of the upper ash surface or flow around the ash deposit (with mine spoil permeability 2 to 6 orders of magnitude greater than compacted ash) before entering the minepool flow system. The generally unsaturated conditions of the backfill and the sloping top surface of the ash deposit should result in very little head buildup on top of the ash deposit, and in the absence of substantial head it will be difficult to drive much infiltrating water through the ash deposit. If the pozzolanic reactions are occurring within the fine-grained, compacted coal ash deposit, it is even less likely that significant quantities of groundwater will flow through the ash deposit. Nevertheless, some groundwater will flow through the coal ash deposit, with a substantial residence time, and discharge to the minepool.
From the hydrologic budget calculations described above, a rough estimate is made here, that of 5.12 million gallons of recharge in the 10 acre reclaimed area, less than 0.5 million gallons per year would flow out of the ash deposit with a high alkalinity concentration. A much lower amount of groundwater draining from the ash deposit annually under this scenario would result if different permeability contrast values from the literature were used (i.e. greater spoil permeability and/or lesser ash permeability), or if the terms of the hypothetical case presented in Chapter 11 are applicable to the Wheelabrator site. However that high alkalinity groundwater flow component would commingle with the many millions of gallons of groundwater in the minepool, and would result in a modest acidity reduction in the downgradient groundwater monitoring point, as shown in Figure 4.8, rather than a significant alkalinity increase in the minepool discharge. The purpose of this discussion has been to document that the “high and dry” coal ash placement concept is apparently working well on mine sites like the Wheelabrator site. 4.4.4 Conclusions
1. A very significant amount of abandoned mine reclamation in the four anthracite coal fields has been completed through the beneficial use of coal ash on remining sites. This extensive reclamation is significant, not only on individual sites associated with FBC power plants (e.g. the before and after photos in Fig. 4.17 a and b), but also in the total acreage reclaimed (at no cost to the government or taxpayers) as shown in Chapter 1.
2. The evaluation of more than 15 years worth of groundwater monitoring data for the case
study sites presented in this chapter, and other permitted sites throughout the anthracite region, has not resulted in any significant findings of environmental damage groundwater pollution cases, as measured at key downgradient minepool monitoring points. Several sites discussed in this chapter showed no significant change in groundwater/minepool water quality, despite extensive ash placement and land reclamation – although these sites significantly reduced infiltration to the minepool, and thus should represent a
116

reduction in the flow and thereby the pollution load of acidity, iron and other metals in these high volume minepool discharges. At least two sites discussed in this chapter produced a significant increase in alkalinity concentrations, or reduction in acidity, iron or other analytes that is attributable to the beneficial use of coal ash on these sites.
3. The range of mine site characteristics, coal ash placement configurations and
groundwater/minepool monitoring scenarios presented in this chapter demonstrates that a “one size fits all” approach to the permitting and compliance monitoring of the sites is not practical or effective. Site specific application of engineering principles and evaluation of geologic factors is essential, particularly: (a) the soil-mechanics engineering of ash placement, (b) the mining engineering of the active surface mine and abandoned underground mines, (c) the geologic structure of the site and surrounding area (e.g. synclinorium), and (d) the hydrogeology of the site and underlying minepool system. Permit applicants, their consultants and regulatory agency scientists and engineers must collaborate to promote effective ash placement technology and to develop practical and realistic groundwater monitoring plans.
4. The groundwater monitoring data for some of the case study sites and the hydrologic
budget discussion demonstrate that the “high and dry” concept of placing relatively dry (optimum moisture content) coal ash into a relatively dry mine environment is working well. The three other ash placement/minepool scenarios presented in this book (i.e. generally described in Chapter 1, and in detail in Chapters 7, 8 and 9) provide significant information for regulatory agencies to evaluate in determining whether the technology employed in these one-of-a-kind demonstration permit ash placement alternatives should be authorized for a range of other site-specific beneficial use applications. It is feasible to develop a matrix approach that would match the range of physical and chemical properties of FBC and PC coal ash classes to various ash placement alternatives, in order to optimize cementitous behavior of specific ash types, or maximize alkalinity production in groundwater – and solve a variety of abandoned mine land and mine drainage problems.
117