chapter 4-1 evaluate past performance. chapter 2 - income statement lo 1 understand the uses and...
TRANSCRIPT

Chapter 4-1
Evaluate past performance.
Chapter 2 - Income StatementChapter 2 - Income StatementChapter 2 - Income StatementChapter 2 - Income Statement
LO 1 Understand the uses and limitations of an income statement.LO 1 Understand the uses and limitations of an income statement.
Help assess the risk or uncertainty of achieving future cash flows.
Predicting future performance.
Usefulness

Chapter 4-2
Companies omit items that cannot be measured reliably.
Income StatementIncome StatementIncome StatementIncome Statement
Limitations
LO 1 Understand the uses and limitations of an income statement.LO 1 Understand the uses and limitations of an income statement.
Income measurement involves judgment.
Income is affected by the accounting methods employed.

Chapter 4-3
Format of the Income StatementFormat of the Income StatementFormat of the Income StatementFormat of the Income Statement
LO 1 Understand the uses and limitations of an income statement.LO 1 Understand the uses and limitations of an income statement.
Revenues – Inflows or other enhancements of assets or – Inflows or other enhancements of assets or settlements of its liabilities that constitute the entity’s settlements of its liabilities that constitute the entity’s ongoing major or central operations.ongoing major or central operations.
SalesSales
Fee revenueFee revenue
Interest revenueInterest revenue
Dividend revenueDividend revenue
Rent revenueRent revenue
Examples of Revenue Accounts
Elements of the Income Statement

Chapter 4-4
Format of the Income StatementFormat of the Income StatementFormat of the Income StatementFormat of the Income Statement
LO 1 Understand the uses and limitations of an income statement.LO 1 Understand the uses and limitations of an income statement.
Expenses – Outflows or other using-up of assets or – Outflows or other using-up of assets or incurrences of liabilities that constitute the entity’s incurrences of liabilities that constitute the entity’s ongoing major or central operations.ongoing major or central operations.
Cost of goods soldCost of goods sold
Depreciation expenseDepreciation expense
Interest expenseInterest expense
Rent expenseRent expense
Salary expenseSalary expense
Examples of Expense Accounts
Elements of the Income Statement

Chapter 4-5
Format of the Income StatementFormat of the Income StatementFormat of the Income StatementFormat of the Income Statement
LO 1 Understand the uses and limitations of an income statement.LO 1 Understand the uses and limitations of an income statement.
Gains – Increases in equity (net assets) from – Increases in equity (net assets) from peripheral or incidental transactions.peripheral or incidental transactions.
Losses - Decreases in equity (net assets) from - Decreases in equity (net assets) from peripheral or incidental transactions.peripheral or incidental transactions.
Gains and losses can result fromGains and losses can result from
sale of investments or plant assets, sale of investments or plant assets,
settlement of liabilities, settlement of liabilities,
write-offs of assets.write-offs of assets.
Elements of the Income Statement
Chapter 4-6
Single-Step FormatSingle-Step FormatSingle-Step FormatSingle-Step Format
LO 2 Prepare a single-step income statement.LO 2 Prepare a single-step income statement.
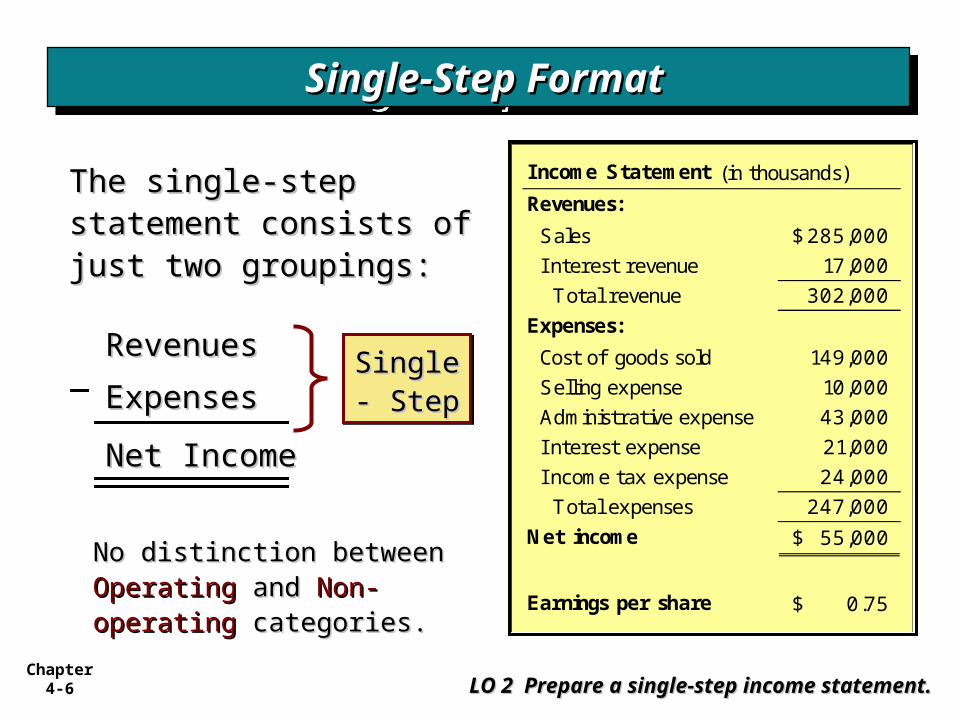
The single-step The single-step statement consists of statement consists of just two groupings:just two groupings:
Income Statement (in thousands)
Revenues:
Sales 285,000$
I nterest revenue 17,000
Total revenue 302,000
Expenses:
Cost of goods sold 149,000
Selling expense 10,000
Administrative expense 43,000
I nterest expense 21,000
I ncome tax expense 24,000
Total expenses 247,000
Net income 55,000$
Earnings per share 0.75$
RevenuesRevenues
ExpensesExpenses
Net IncomeNet Income
Single- Single- StepStep
Single- Single- StepStep
No distinction between No distinction between OperatingOperating and and Non-Non-operatingoperating categories. categories.

Chapter 4-7
Single-Step Single-Step FormatFormat
Single-Step Single-Step FormatFormat
LO 2 Prepare a single-step income statement.LO 2 Prepare a single-step income statement.
Administrative expense: Revenues:
Offi cers' salaries 4,900$ Sales 96,500$
Depreciation 3,960 Rental revenue 17,230
Cost of goods sold 63,570 Total revenues 113,730
Rental revenue 17,230 Expenses:
Selling expense: Cost of goods sold 63,570
Transportation- out 2,690 Selling expense 17,150
Sales commissions 7,980 Administrative exense 8,860
Depreciation 6,480 I nterest expense 1,860
Sales 96,500 I ncome tax expense 7,580
I ncome tax expense 7,580 Total expenses 99,020
I nterest expense 1,860 Net income 14,710$
I ncome Statement
For the year ended Dec. 31, 2011
E4-4: Prepare an income statement from the data below.
Solution on notes page
Chapter 4-8
The single-step income statement emphasizesThe single-step income statement emphasizes
a. a. the gross profit figure.the gross profit figure.
b. b. total revenues and total expenses.total revenues and total expenses.
c. c. extraordinary items more than it is extraordinary items more than it is emphasized emphasized in the multiple-step income in the multiple-step income statement.statement.
d. d. the various components of income from the various components of income from continuing operations.continuing operations.
ReviewReview
Single-Step FormatSingle-Step FormatSingle-Step FormatSingle-Step Format
LO 2 Prepare a single-step income statement.LO 2 Prepare a single-step income statement.

Chapter 4-9
1. Operating section
2. Nonoperating section
3. Income tax
4. Discontinued operations
5. Extraordinary items
6. Earnings per share
LO 3 Prepare a multiple-step income statement.LO 3 Prepare a multiple-step income statement.
Multiple-Step FormatMultiple-Step FormatMultiple-Step FormatMultiple-Step Format
Income Statement Sections
Chapter 4-10
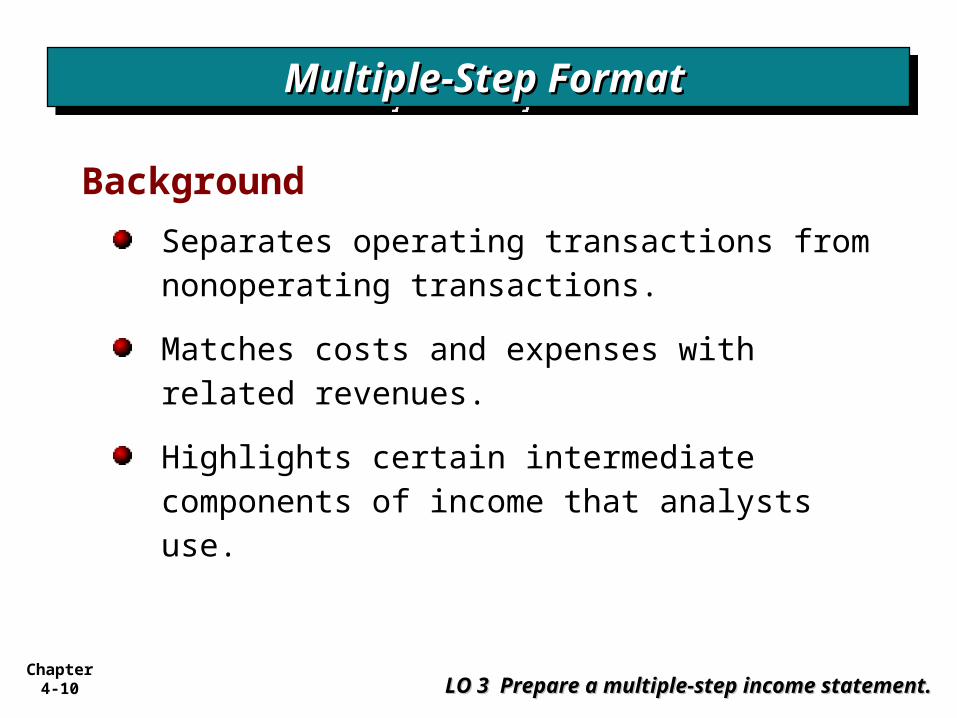
Separates operating transactions from nonoperating transactions.
Matches costs and expenses with related revenues.
Highlights certain intermediate components of income that analysts use.
LO 3 Prepare a multiple-step income statement.LO 3 Prepare a multiple-step income statement.
Multiple-Step FormatMultiple-Step FormatMultiple-Step FormatMultiple-Step Format
Background
Chapter 4-11
Multiple-Step FormatMultiple-Step FormatMultiple-Step FormatMultiple-Step Format
LO 3 Prepare a multiple-step income statement.LO 3 Prepare a multiple-step income statement.
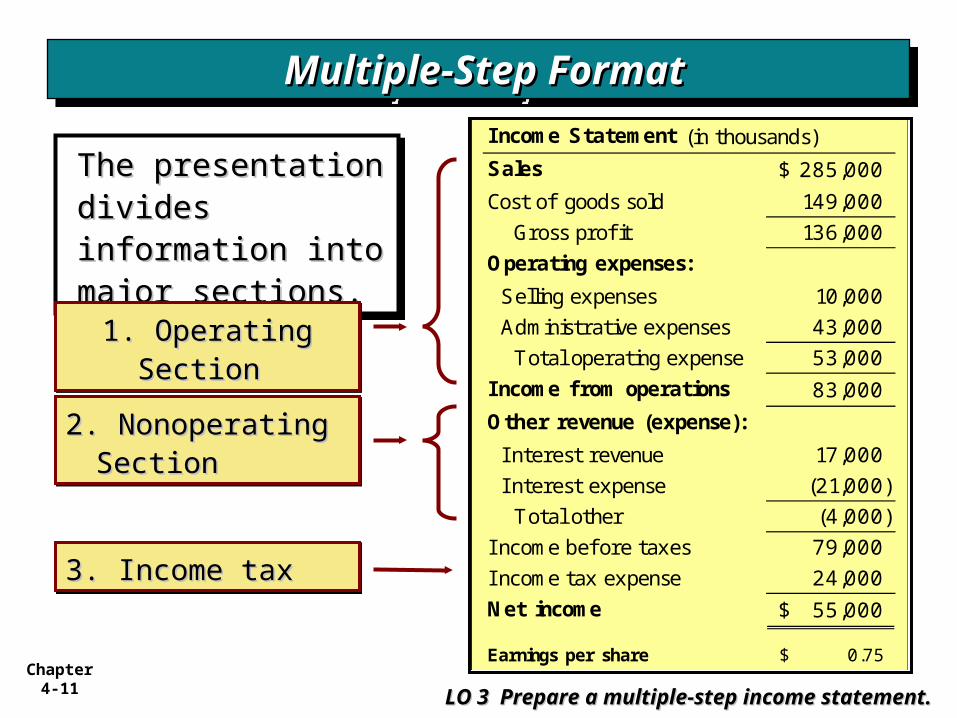
The presentation The presentation divides information divides information into major into major sections. sections.
The presentation The presentation divides information divides information into major into major sections. sections.
Income Statement (in thousands)
Sales 285,000$
Cost of goods sold 149,000
Gross profit 136,000
Operating expenses:
Selling expenses 10,000
Administrative expenses 43,000
Total operating expense 53,000
Income from operations 83,000
Other revenue (expense):
I nterest revenue 17,000
I nterest expense (21,000)
Total other (4,000)
I ncome bef ore taxes 79,000
I ncome tax expense 24,000
Net income 55,000$
Earnings per share 0.75$
1. Operating 1. Operating Section Section
1. Operating 1. Operating Section Section
2. Nonoperating 2. Nonoperating Section Section
2. Nonoperating 2. Nonoperating Section Section
3. Income tax 3. Income tax 3. Income tax 3. Income tax

Chapter 4-12
Multiple-Step Multiple-Step FormatFormat
Multiple-Step Multiple-Step FormatFormat
Administrative expense: Sales 96,500$
Offi cers' salaries 4,900$ Cost of goods sold 63,750
Depreciation 3,960 Gross profit 32,750
Cost of goods sold 63,750 Operating Expenses:
Rental revenue 17,230 Selling expense 17,150
Selling expense: Administrative exense 8,860
Transportation- out 2,690 Total operating expenses 26,010
Sales commissions 7,980 I ncome from operations 6,740
Depreciation 6,480 Other revenue (expense):
Sales 96,500 Rental revenue 17,230
I ncome tax expense 7,580 I nterest expense (1,860)
I nterest expense 1,860 Total other 15,370
I ncome before tax 22,110
I ncome tax expense 7,580
Net income 14,530$
I ncome Statement
For the year ended Dec. 31, 2011
Illustration (E4-4): Prepare an income statement from the data below.
Solution on notes page
Chapter 4-13
ReviewReviewA separation of operating and non operating activities A separation of operating and non operating activities of a company exists inof a company exists in
a. a. both a multiple-step and single-step income both a multiple-step and single-step income statement.statement.
b. b. a multiple-step but not a single-step income a multiple-step but not a single-step income statementstatement..
c. c. a single-step but not a multiple-step income a single-step but not a multiple-step income statementstatement..
d. d. neither a single-step nor a multiple-step neither a single-step nor a multiple-step income income statementstatement..
Multiple-Step FormatMultiple-Step FormatMultiple-Step FormatMultiple-Step Format
LO 3 Prepare a multiple-step income statement.LO 3 Prepare a multiple-step income statement.

Chapter 4-14

Chapter 4-15
An Income StatementAn Income StatementAn Income StatementAn Income Statement SalesSales
Minus Cost of Goods SoldMinus Cost of Goods Sold = Gross Profit= Gross Profit Minus Operating ExpensesMinus Operating Expenses
Selling expensesSelling expenses General and Administrative expensesGeneral and Administrative expenses Depreciation and Amortization ExpenseDepreciation and Amortization Expense
= Operating income (EBIT)= Operating income (EBIT) Minus Interest ExpenseMinus Interest Expense = Earnings before taxes (EBT)= Earnings before taxes (EBT) Minus Income taxesMinus Income taxes = Net income (EAT)= Net income (EAT)
FIN3000, Liuren Wu
15

Chapter 4-16
An Income StatementAn Income StatementAn Income StatementAn Income Statement SalesSales
Minus Cost of Goods SoldMinus Cost of Goods Sold = Gross Profit= Gross Profit Minus Operating ExpensesMinus Operating Expenses
Selling expensesSelling expenses General and Administrative expensesGeneral and Administrative expenses Depreciation and Amortization ExpenseDepreciation and Amortization Expense
= Operating income (EBIT)= Operating income (EBIT) Minus Interest ExpenseMinus Interest Expense = Earnings before taxes (EBT)= Earnings before taxes (EBT) Minus Income taxesMinus Income taxes = Net income (EAT)= Net income (EAT)
FIN3000, Liuren Wu
16

Chapter 4-17
Sample Income StatementSample Income StatementSample Income StatementSample Income Statement
FIN3000, Liuren Wu
17

Chapter 4-18
Evaluating a FirmEvaluating a Firm’’s EPSs EPSEvaluating a FirmEvaluating a Firm’’s EPSs EPS
We can use the income statement to determine the earnings We can use the income statement to determine the earnings per share (EPS) and dividends.per share (EPS) and dividends.
EPS = Net income/Number of shares outstandingEPS = Net income/Number of shares outstanding Example 1Example 1: A firm reports a net income $90 million and has : A firm reports a net income $90 million and has
35 million shares outstanding, what will be the earnings per 35 million shares outstanding, what will be the earnings per share (EPS)?share (EPS)?
EPS = Net income ÷ Number of sharesEPS = Net income ÷ Number of shares = $90 million ÷ $35 million = $90 million ÷ $35 million = = $2.57$2.57
FIN3000, Liuren Wu
18
Chapter 4-19
Evaluating a FirmEvaluating a Firm’’s Dividends s Dividends per shareper share
Evaluating a FirmEvaluating a Firm’’s Dividends s Dividends per shareper share Dividends per share = Dividends paid ÷ Dividends per share = Dividends paid ÷
Number of sharesNumber of shares Example 2Example 2: A firm reports dividend payment : A firm reports dividend payment
of $20 million on its income statement and of $20 million on its income statement and has 35 million shares outstanding. What will has 35 million shares outstanding. What will be the dividends per share? be the dividends per share?
Dividends per share = dividend payment ÷ Dividends per share = dividend payment ÷ Number of sharesNumber of shares
= $20 million ÷ $35 million= $20 million ÷ $35 million = = $0.57 $0.57
FIN3000, Liuren Wu
19

Chapter 4-20
Connecting the Income Statement Connecting the Income Statement and the Balance Sheetand the Balance Sheet
Connecting the Income Statement Connecting the Income Statement and the Balance Sheetand the Balance Sheet
What can the firm do with the net income?:What can the firm do with the net income?:1.1. Pay dividends to shareholders, and/or Pay dividends to shareholders, and/or 2.2. Reinvest in the firmReinvest in the firm
Example 3Example 3: Review examples 1 & 2. How : Review examples 1 & 2. How much was retained or reinvested by the firm?much was retained or reinvested by the firm?
Amount retained = Net Income – DividendsAmount retained = Net Income – Dividends= $90m - $20m = = $90m - $20m = $70m$70m
The firmThe firm’’s balance on retained earnings will s balance on retained earnings will increase by $70 million on the balance sheet.increase by $70 million on the balance sheet.
FIN3000, Liuren Wu
20
Chapter 4-21
Interpreting Firm Profitability using Interpreting Firm Profitability using the Income Statementthe Income Statement
Interpreting Firm Profitability using Interpreting Firm Profitability using the Income Statementthe Income Statement
What can we learn from Boswell Inc.What can we learn from Boswell Inc.’’s s income statement?income statement?1.1. The firm has been profitable as its revenues The firm has been profitable as its revenues
exceeded its expenses.exceeded its expenses.
2.2. The gross profit margin (GPM)The gross profit margin (GPM)
= gross profits ÷ sales = gross profits ÷ sales
= $675 million ÷ $2,700 = $675 million ÷ $2,700 million million
= = 25%25% GPM indicates the firmGPM indicates the firm’’s s ““mark-upmark-up”” on its cost of goods sold on its cost of goods sold
per dollar of sales.per dollar of sales.
FIN3000, Liuren Wu
21

Chapter 4-22
Interpreting Firm Profitability using Interpreting Firm Profitability using the Income Statement (cont.)the Income Statement (cont.)
Interpreting Firm Profitability using Interpreting Firm Profitability using the Income Statement (cont.)the Income Statement (cont.)
3.3. The operating profit marginThe operating profit margin= net operating income (EBIT)÷ sales= net operating income (EBIT)÷ sales= $382.5 million ÷ $2,700 million= $382.5 million ÷ $2,700 million= = 14.17%14.17%
4.4. Net profit marginNet profit margin: : = net profits (Net income) ÷ sales= net profits (Net income) ÷ sales= $204.75 million ÷ $2,700 million= $204.75 million ÷ $2,700 million= = 7.58%7.58%
These profit margins (gross profit margin, operating profit margin, and net profit These profit margins (gross profit margin, operating profit margin, and net profit margin) should be closely monitored and compared to previous years and those margin) should be closely monitored and compared to previous years and those of competing firms.of competing firms.
FIN3000, Liuren Wu
22