chapter 3 - unesco · chapter 3 education cost and financing as shown in chapter 1, the government...
TRANSCRIPT
CHAPTER 3EDUCATION COSTAND FINANCINGAs shown in Chapter 1, the government has maintained ahigh macro level budget priority for Tanzania’s mainlandeducation sector over the last decade. Beyond the totalamount and share of public resources allocated to theeducation sector, it is however necessary to: (i) identify theareas of underspending in the education system. Chapter1 has also shown that over the next decade, the fiscal spaceto further increase the global volume of public educationexpenditure will be narrower than in the past. Thissituation raises the necessity for policy makers to also: (ii)find scope for cost savings in specific spending items orwithin education subsectors.
Tanzania Education Sector Analysis 117

This chapter aims to provide some insights to these two basic questions by analyzing, in asmuch detail as data permit, how public resources channeled to the education sector areused. In particular, it analyses the allocation of public resources (recurrent and developmentexpenditures) to various education subsectors (from preprimary to higher education,including teacher training, vocational education and adult and non formal education). Italso reviews, within each subsector, how expenditure is distributed according to the twomain allocations: personnel emoluments and other charges.47
Households and communities also play an important role in funding education services inTanzania. The total amount of their investment and the way they fund education servicesmust also be analyzed. These questions are to be monitored by the government, particularlyin the context of the fee-free primary education policy and the secondary and highereducation cost-sharing policy.
A Foreword: Tracing Public Education Expenditure
The way public education expenditures are computed is of great importance. In the case ofTanzania, public education expenditure is spread across the “votes” of various ministries,parastatal agencies, regions and Local Government Authorities (LGAs).48 Moreover, therehave been various institutional restructuring exercises within the education sector since2000/01, adding challenge and complexity to the tracking exercise. The case of the currentMinistry of Education and Vocational Training (MoEVT) is an illustration of these institutionalchanges. For example, one can found that the former Ministry of Education and Culturewas also in charge of funding some Culture related activities between 2000/01 and 2005/06(including Sport development in 2000/01). Also, in July 2008, Higher education and someTechnical institutions were moved from the Ministry of Higher Education, Science andTechnology (MHEST) to MoEVT. Another major institutional change occurred with thedecentralization of Secondary education expenditures since July 2009.
To achieve data consistency through time, this chapter has made some assumptions in itstrend analysis: (i) the 2008/09 institutional set-up is used to classify public educationexpenditure by funding source; but (ii) when analyzing expenditure trends by subsector, allpublic expenditure channeled to each subsector is captured according to the cycle/level,irrespective of the prevailing institutional arrangements at the time.
Development partners’ contributions to the sector as global budget support have beenincluded in public expenditures, which is in fact the case of most external funding. Externalcontributions that are received through different channels (nonbudget resources) are notnecessarily included in the computations, mainly because of the difficulty in obtaining thedata.
Tanzania Education Sector Analysis118
CH
AP
TER
3ED
UC
ATIO
N C
OS
T A
ND
FIN
AN
CIN
G

A considerable share of education spending is decentralized. Regions, LGAs and the Ministryof Education and Vocational Training (MoEVT) jointly account for a considerable share ofpublic education expenditure (71 percent on average over the 2000-08 period) as shown inFigure 3.1. The remaining share, over the same period, was spread across the Ministry ofHigher Education, Science and Technology (MHEST, 15.0 percent), the Prime Minister’s Officefor Regional Administration and Local Government (PMO-RALG, 4.7 percent), the Ministryof Community Development, Gender and Children (0.8 percent) and 8.6 percent waschanneled through various other MDAs (4.9 percent), including the VETA (3.4 percent) andthe Teacher Service Department (TSD– 0.3 percent).
For FY 2009/10, following the decentralization of the administration of secondary schools,the government plans to transfer 60.6 percent of the total public education budget toregions and LGAs (up from 45.6 percent real expenditure in FY 2008/09); 30 percent of thebudget is to be spent by MoEVT (compared with 42.8 percent real expenditure in FY2008/09). MoEVT, the regions and LGAs will therefore remain the main entities responsiblefor executing the public education budget on the mainland.
The next sections’ analysis focuses on actual expenditures as much as possible. Someadjustments (or item reclassifications) have been made to raw data in order to betterestimate education expenditures according to their real nature (recurrent or development),and avoid potentially considerable underestimations of recurrent expenditure. Recurrentexpenditures recorded under development expenditure have been systematically identifiedand reclassified. This was the case of 54 percent of MoEVT capitation grants for FY 2006/07,which are recurrent by nature, but were recorded as development. Misclassified recurrentexpenditures are less common, but they have also been reclassified to ensure consistencyin the trend analysis.
Tanzania Education Sector Analysis 119
Figure 3.1: Total Public Education Expenditure, by Implementing Institution, FY2000/01-FY2008/09
100%
80%
60%
40%
20%
0%
2000-08(Actual - Average)
2008/09(Actual)
2009/10(Budget)
Perc
ent
PMO-RALG and MCDGC
Other MDAs, includingVETA and TSD
MoHEST
MoEVT
Regions and LGAs
Percent
44,9
26,0
15,0
8,65,5
45,6
42,8
9,91,7
60,6
30,0
7,42,0
Source: Authors' calculations based on MoFEA and VETA data.
Public Education Expenditure
Distribution by Nature
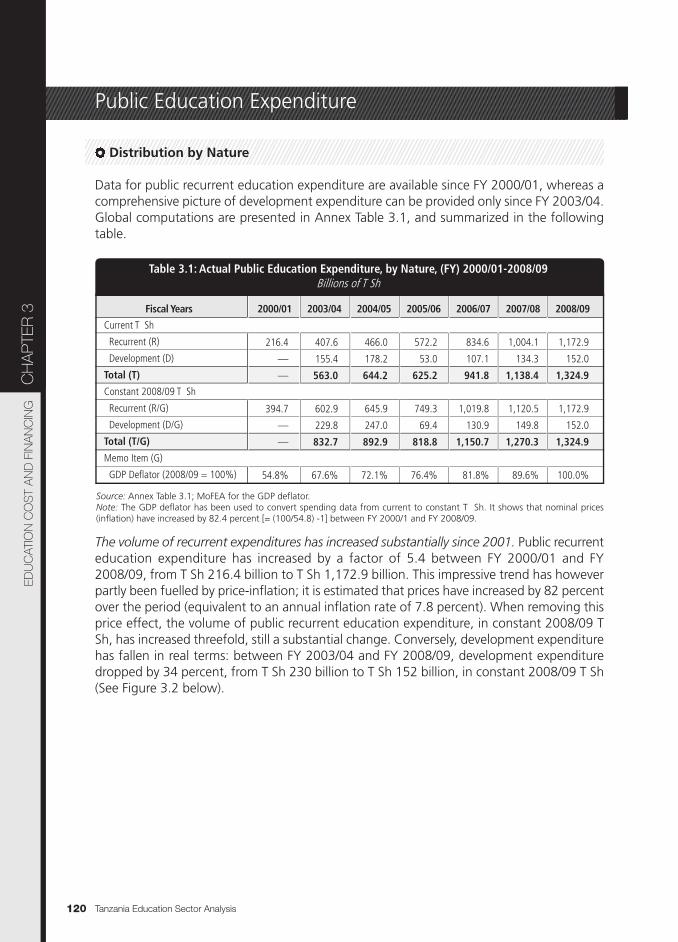
Data for public recurrent education expenditure are available since FY 2000/01, whereas acomprehensive picture of development expenditure can be provided only since FY 2003/04.Global computations are presented in Annex Table 3.1, and summarized in the followingtable.
Tanzania Education Sector Analysis120
CH
AP
TER
3ED
UC
ATIO
N C
OS
T A
ND
FIN
AN
CIN
G
Current T Sh
Recurrent (R)
Development (D)
Total (T)
Constant 2008/09 T Sh
Recurrent (R/G)
Development (D/G)
Total (T/G)
Memo Item (G)
GDP Deflator (2008/09 = 100%)
Fiscal Years 2000/01 2003/04 2004/05 2005/06 2006/07 2007/08 2008/09
Table 3.1: Actual Public Education Expenditure, by Nature, (FY) 2000/01-2008/09Billions of T Sh
216.4
—
—
394.7
—
—
54.8%
407.6
155.4
563.0
602.9
229.8
832.7
67.6%
466.0
178.2
644.2
645.9
247.0
892.9
72.1%
572.2
53.0
625.2
749.3
69.4
818.8
76.4%
834.6
107.1
941.8
1,019.8
130.9
1,150.7
81.8%
1,004.1
134.3
1,138.4
1,120.5
149.8
1,270.3
89.6%
1,172.9
152.0
1,324.9
1,172.9
152.0
1,324.9
100.0%
The volume of recurrent expenditures has increased substantially since 2001. Public recurrenteducation expenditure has increased by a factor of 5.4 between FY 2000/01 and FY2008/09, from T Sh 216.4 billion to T Sh 1,172.9 billion. This impressive trend has howeverpartly been fuelled by price-inflation; it is estimated that prices have increased by 82 percentover the period (equivalent to an annual inflation rate of 7.8 percent). When removing thisprice effect, the volume of public recurrent education expenditure, in constant 2008/09 TSh, has increased threefold, still a substantial change. Conversely, development expenditurehas fallen in real terms: between FY 2003/04 and FY 2008/09, development expendituredropped by 34 percent, from T Sh 230 billion to T Sh 152 billion, in constant 2008/09 T Sh(See Figure 3.2 below).
Source: Annex Table 3.1; MoFEA for the GDP deflator.Note: The GDP deflator has been used to convert spending data from current to constant T Sh. It shows that nominal prices(inflation) have increased by 82.4 percent [= (100/54.8) -1] between FY 2000/1 and FY 2008/09.
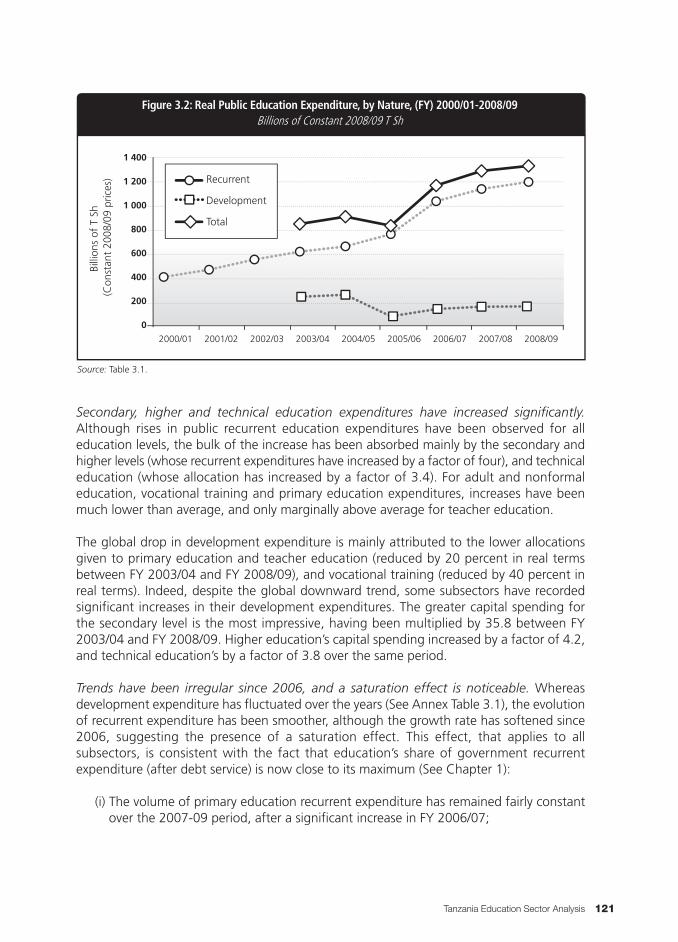
Secondary, higher and technical education expenditures have increased significantly.Although rises in public recurrent education expenditures have been observed for alleducation levels, the bulk of the increase has been absorbed mainly by the secondary andhigher levels (whose recurrent expenditures have increased by a factor of four), and technicaleducation (whose allocation has increased by a factor of 3.4). For adult and nonformaleducation, vocational training and primary education expenditures, increases have beenmuch lower than average, and only marginally above average for teacher education.
The global drop in development expenditure is mainly attributed to the lower allocationsgiven to primary education and teacher education (reduced by 20 percent in real termsbetween FY 2003/04 and FY 2008/09), and vocational training (reduced by 40 percent inreal terms). Indeed, despite the global downward trend, some subsectors have recordedsignificant increases in their development expenditures. The greater capital spending forthe secondary level is the most impressive, having been multiplied by 35.8 between FY2003/04 and FY 2008/09. Higher education’s capital spending increased by a factor of 4.2,and technical education’s by a factor of 3.8 over the same period.
Trends have been irregular since 2006, and a saturation effect is noticeable. Whereasdevelopment expenditure has fluctuated over the years (See Annex Table 3.1), the evolutionof recurrent expenditure has been smoother, although the growth rate has softened since2006, suggesting the presence of a saturation effect. This effect, that applies to allsubsectors, is consistent with the fact that education’s share of government recurrentexpenditure (after debt service) is now close to its maximum (See Chapter 1):
(i) The volume of primary education recurrent expenditure has remained fairly constantover the 2007-09 period, after a significant increase in FY 2006/07;
Tanzania Education Sector Analysis 121
Figure 3.2: Real Public Education Expenditure, by Nature, (FY) 2000/01-2008/09
1 400
1 200
1 000
800
600
400
200
0
2000/01 2001/02 2002/03 2003/04 2004/05 2005/06 2006/07 2007/08 2008/09
Billi
ons
of T
Sh
(Con
stan
t 20
08/0
9 pr
ices
)
Billions of Constant 2008/09 T Sh
Recurrent
Development
Total
Source: Table 3.1.
(ii) Secondary education recurrent expenditure stabilized in FY 2008/09, after significantreal increases (17 percent annual growth over 2004/05-2006/07);
(iii) The higher education recurrent expenditure increase was lower in FY 2008/09 (7percent in real terms) than in previous years (37 percent average annual increaseover the 2004/05-2006/07 period);
(iv) On the other hand, technical education has benefitted from ongoing spendingincreases, with the highest rate recorded in FY 2008/09 (37 percent growth,compared with an average of 15 percent since FY 2000/01); and
(v) Vocational training recurrent expenditure has been variable, although recentincreases (nine percent in FY 2007/08 and five percent in FY 2008/09) are muchlower than in the two previous years, when they averaged 14 percent.
Allocations by Subsector
Recurrent Expenditure
Cuts in primary education spending have mainly benefited higher education. Primary andpreprimary recurrent expenditure decreased from 58 percent in 2000/01 to 48.7 percent inFY 2008/09. While the country has been progressing toward universal primary education(UPE) as shown in the previous chapter, the decrease of the share of Primary education canbe reflecting the Government’ policy to expand secondary education. However, Secondaryeducation spending also dropped between FY 2000/01 and FY 2003/04 (from 9.9 percentto 7.5 percent), before rising anew to 12.9 percent in FY 2004/05 with the launch of theSecondary Education Development Program (SEDP I), and stabilizing in FY 2008/09(Secondary was allocated 13.5 percent of recurrent education expenditure).
The cuts in primary education spending have mainly benefited higher education, whoseshare has increased from 17.4 percent in FY 2000/01 to 23.6 percent in FY 2008/09. Overthis period, technical education has also benefitted from a greater allocation, rising from6.4 percent of recurrent education expenditure to 7.4 percent.
Development Expenditure
Budget priority has shifted from primary to post primary levels. A sizeable share ofdevelopment education expenditure (almost 84 percent) was allocated to primary andpreprimary in FY 2003/04; their share has now decreased to approximately 22 percent. Onthe other hand, the share of development education expenditure allocated to secondaryand teacher training increased substantially in FY 2006/07, certainly due to theimplementation of the SEDP I that launched a building programme to provide each wardwith an O-Level school. Other subsectors such as higher, technical and adult and non formaleducation have witnessed continued allocation increases.
Tanzania Education Sector Analysis122
CH
AP
TER
3ED
UC
ATIO
N C
OS
T A
ND
FIN
AN
CIN
G
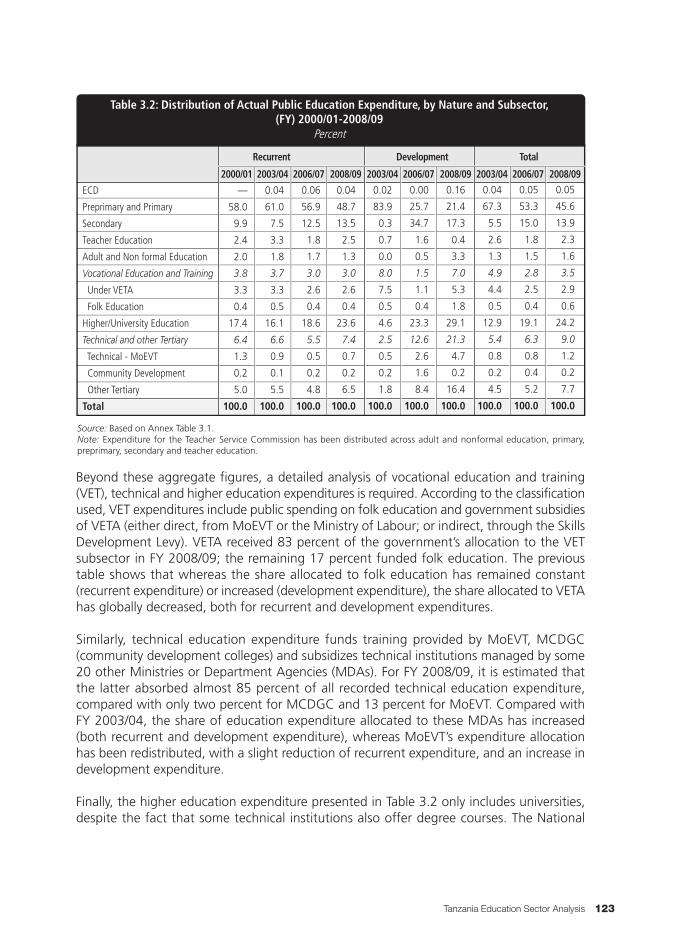
Beyond these aggregate figures, a detailed analysis of vocational education and training(VET), technical and higher education expenditures is required. According to the classificationused, VET expenditures include public spending on folk education and government subsidiesof VETA (either direct, from MoEVT or the Ministry of Labour; or indirect, through the SkillsDevelopment Levy). VETA received 83 percent of the government’s allocation to the VETsubsector in FY 2008/09; the remaining 17 percent funded folk education. The previoustable shows that whereas the share allocated to folk education has remained constant(recurrent expenditure) or increased (development expenditure), the share allocated to VETAhas globally decreased, both for recurrent and development expenditures.
Similarly, technical education expenditure funds training provided by MoEVT, MCDGC(community development colleges) and subsidizes technical institutions managed by some20 other Ministries or Department Agencies (MDAs). For FY 2008/09, it is estimated thatthe latter absorbed almost 85 percent of all recorded technical education expenditure,compared with only two percent for MCDGC and 13 percent for MoEVT. Compared withFY 2003/04, the share of education expenditure allocated to these MDAs has increased(both recurrent and development expenditure), whereas MoEVT’s expenditure allocationhas been redistributed, with a slight reduction of recurrent expenditure, and an increase indevelopment expenditure.
Finally, the higher education expenditure presented in Table 3.2 only includes universities,despite the fact that some technical institutions also offer degree courses. The National
Tanzania Education Sector Analysis 123
ECD
Preprimary and Primary
Secondary
Teacher Education
Adult and Non formal Education
Vocational Education and Training
Under VETA
Folk Education
Higher/University Education
Technical and other Tertiary
Technical - MoEVT
Community Development
Other Tertiary
Total
2000/01 2003/04
Recurrent Development Total
2006/07 2008/09 2003/04 2006/07 2008/09 2003/04 2006/07 2008/09
Table 3.2: Distribution of Actual Public Education Expenditure, by Nature and Subsector,(FY) 2000/01-2008/09
Percent
—
58.0
9.9
2.4
2.0
3.8
3.3
0.4
17.4
6.4
1.3
0.2
5.0
100.0
0.04
61.0
7.5
3.3
1.8
3.7
3.3
0.5
16.1
6.6
0.9
0.1
5.5
100.0
0.06
56.9
12.5
1.8
1.7
3.0
2.6
0.4
18.6
5.5
0.5
0.2
4.8
100.0
0.04
48.7
13.5
2.5
1.3
3.0
2.6
0.4
23.6
7.4
0.7
0.2
6.5
100.0
0.02
83.9
0.3
0.7
0.0
8.0
7.5
0.5
4.6
2.5
0.5
0.2
1.8
100.0
0.00
25.7
34.7
1.6
0.5
1.5
1.1
0.4
23.3
12.6
2.6
1.6
8.4
100.0
0.16
21.4
17.3
0.4
3.3
7.0
5.3
1.8
29.1
21.3
4.7
0.2
16.4
100.0
0.04
67.3
5.5
2.6
1.3
4.9
4.4
0.5
12.9
5.4
0.8
0.2
4.5
100.0
0.05
53.3
15.0
1.8
1.5
2.8
2.5
0.4
19.1
6.3
0.8
0.4
5.2
100.0
0.05
45.6
13.9
2.3
1.6
3.5
2.9
0.6
24.2
9.0
1.2
0.2
7.7
100.0
Source: Based on Annex Table 3.1.Note: Expenditure for the Teacher Service Commission has been distributed across adult and nonformal education, primary,preprimary, secondary and teacher education.
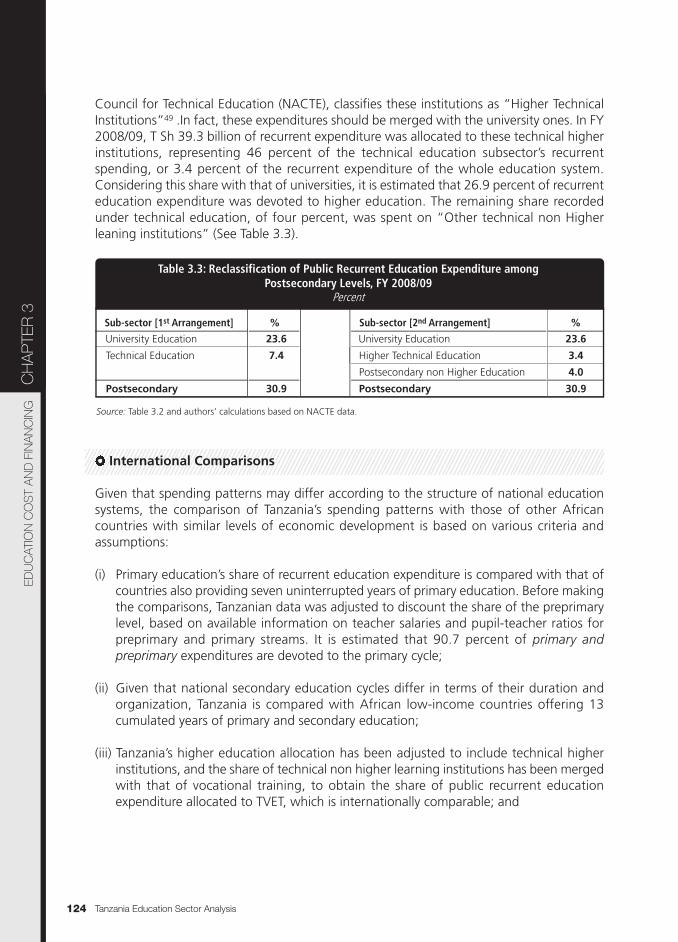
Council for Technical Education (NACTE), classifies these institutions as “Higher TechnicalInstitutions”49 .In fact, these expenditures should be merged with the university ones. In FY2008/09, T Sh 39.3 billion of recurrent expenditure was allocated to these technical higherinstitutions, representing 46 percent of the technical education subsector’s recurrentspending, or 3.4 percent of the recurrent expenditure of the whole education system.Considering this share with that of universities, it is estimated that 26.9 percent of recurrenteducation expenditure was devoted to higher education. The remaining share recordedunder technical education, of four percent, was spent on “Other technical non Higherleaning institutions” (See Table 3.3).
International Comparisons
Given that spending patterns may differ according to the structure of national educationsystems, the comparison of Tanzania’s spending patterns with those of other Africancountries with similar levels of economic development is based on various criteria andassumptions:
(i) Primary education’s share of recurrent education expenditure is compared with that ofcountries also providing seven uninterrupted years of primary education. Before makingthe comparisons, Tanzanian data was adjusted to discount the share of the preprimarylevel, based on available information on teacher salaries and pupil-teacher ratios forpreprimary and primary streams. It is estimated that 90.7 percent of primary andpreprimary expenditures are devoted to the primary cycle;
(ii) Given that national secondary education cycles differ in terms of their duration andorganization, Tanzania is compared with African low-income countries offering 13cumulated years of primary and secondary education;
(iii) Tanzania’s higher education allocation has been adjusted to include technical higherinstitutions, and the share of technical non higher learning institutions has been mergedwith that of vocational training, to obtain the share of public recurrent educationexpenditure allocated to TVET, which is internationally comparable; and
Tanzania Education Sector Analysis124
CH
AP
TER
3ED
UC
ATIO
N C
OS
T A
ND
FIN
AN
CIN
G
University Education
Technical Education
Postsecondary
Sub-sector [1st Arrangement] %
Table 3.3: Reclassification of Public Recurrent Education Expenditure amongPostsecondary Levels, FY 2008/09
Percent
23.6
7.4
30.9
University Education
Higher Technical Education
Postsecondary non Higher Education
Postsecondary
Sub-sector [2nd Arrangement] %
23.6
3.4
4.0
30.9
Source: Table 3.2 and authors’ calculations based on NACTE data.

(iv) Comparisons are based on all African low-income countries fulfilling the above criteria,and for which data are available.
The Primary Education Allocation
Tanzania’s resource allocation to the primary cycle is similar to that of other countries closeto achieving universal primary education. Although Table 3.4 suggests that the primarylevel’s share of recurrent education expenditure is below average, this direct comparison isbiased given that primary education is less developed in these countries (the average PrimaryCompletion Rate (PCR) is 80 percent, compared with 94.5 percent in Tanzania). ComparingTanzania with African countries close to achieving universal primary education provides abetter benchmark. Figure 3.3 below shows that in general, the closer a country is toachieving universal primary education, the lower the share of resources it allocates to theprimary cycle. Tanzania fits in with this global trend: the share of expenditure allocated tothe primary cycle is similar to that of countries with similar primary completion rates.
Tanzania Education Sector Analysis 125
Primary
Secondary
TVET
Technical Nonhigher
VETA
Folk Education
Higher Education
University Education
Technical Higher
Other
Preprimary
Teacher Training
Adult and Nonformal Education
Total
Mainland Tanzania (2008/09) Comparable African Countries’ Average
Table 3.4: Comparison of the Allocation of Public Recurrent Education Expenditure,by Cycle, Tanzania and Selected African Countries’ Average, 2006 or MRY
Percent
44.2
13.5
7.0
4.0
2.6
0.4
26.9
23.6
3.4
8.3
4.5
2.5
1.3
100.0
48.6
20.7
5.0
—
20.8
—
4.8
—
100.0
*
**
***
***
***
Source: Tables 3.2 and 3.3 and authors’ calculations based on MoFEA and EMIS data for Tanzania; and Pôle de Dakar-UNESCO/BREDA for other countries.Note: * Based on the average of Botswana, Lesotho, Mozambique, Namibia, South Africa, Swaziland, Uganda, Zambia andZimbabwe; ** Obtained by deducting the share of primary (48.6) from the average total share allocated to primary and secondaryeducation in Benin, Burkina Faso, Burundi, Central African Republic, Chad, Côte d’Ivoire, Guinea, Niger, Senegal, Togo, Ugandaand Zimbabwe; *** Based on the averages of all African low-income countries for which data were available.
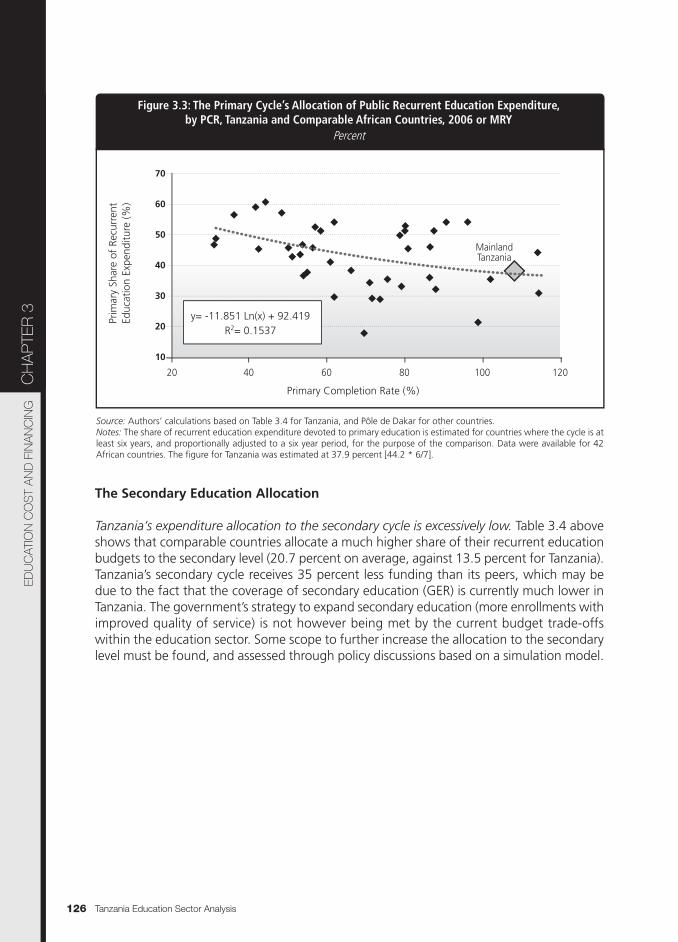
The Secondary Education Allocation
Tanzania’s expenditure allocation to the secondary cycle is excessively low. Table 3.4 aboveshows that comparable countries allocate a much higher share of their recurrent educationbudgets to the secondary level (20.7 percent on average, against 13.5 percent for Tanzania).Tanzania’s secondary cycle receives 35 percent less funding than its peers, which may bedue to the fact that the coverage of secondary education (GER) is currently much lower inTanzania. The government’s strategy to expand secondary education (more enrollments withimproved quality of service) is not however being met by the current budget trade-offswithin the education sector. Some scope to further increase the allocation to the secondarylevel must be found, and assessed through policy discussions based on a simulation model.
Tanzania Education Sector Analysis126
CH
AP
TER
3ED
UC
ATIO
N C
OS
T A
ND
FIN
AN
CIN
G
Figure 3.3: The Primary Cycle’s Allocation of Public Recurrent Education Expenditure,by PCR, Tanzania and Comparable African Countries, 2006 or MRY
70
60
50
40
30
20
10
20 40 60 80 100
MainlandTanzania
120
Prim
ary
Shar
e of
Rec
urre
ntEd
ucat
ion
Expe
nditu
re (%
)
Primary Completion Rate (%)
Percent
y= -11.851 Ln(x) + 92.419R2= 0.1537
Source: Authors’ calculations based on Table 3.4 for Tanzania, and Pôle de Dakar for other countries.Notes: The share of recurrent education expenditure devoted to primary education is estimated for countries where the cycle is atleast six years, and proportionally adjusted to a six year period, for the purpose of the comparison. Data were available for 42African countries. The figure for Tanzania was estimated at 37.9 percent [44.2 * 6/7].
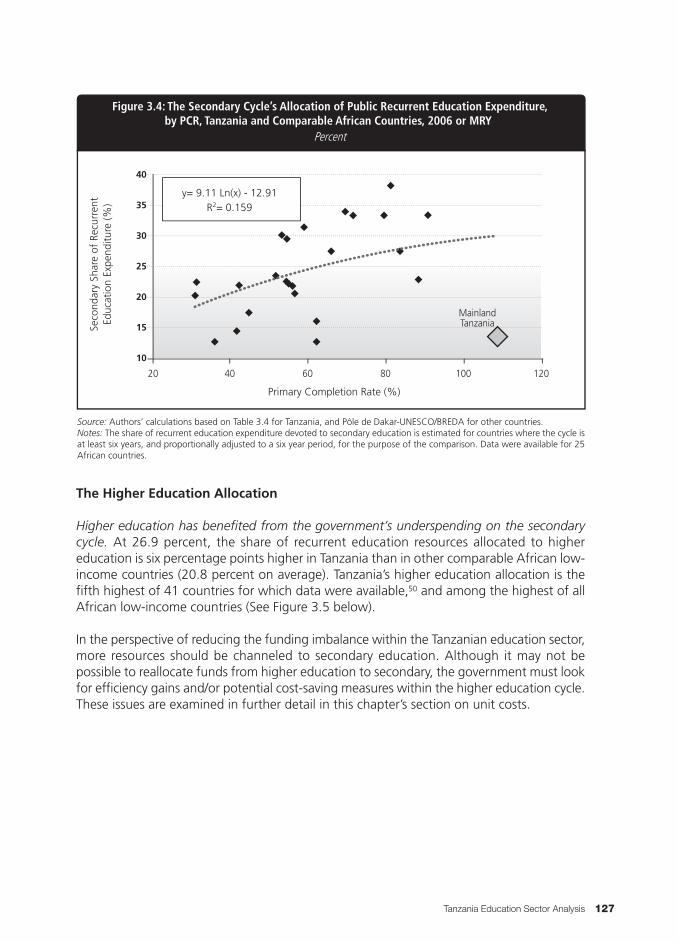
The Higher Education Allocation
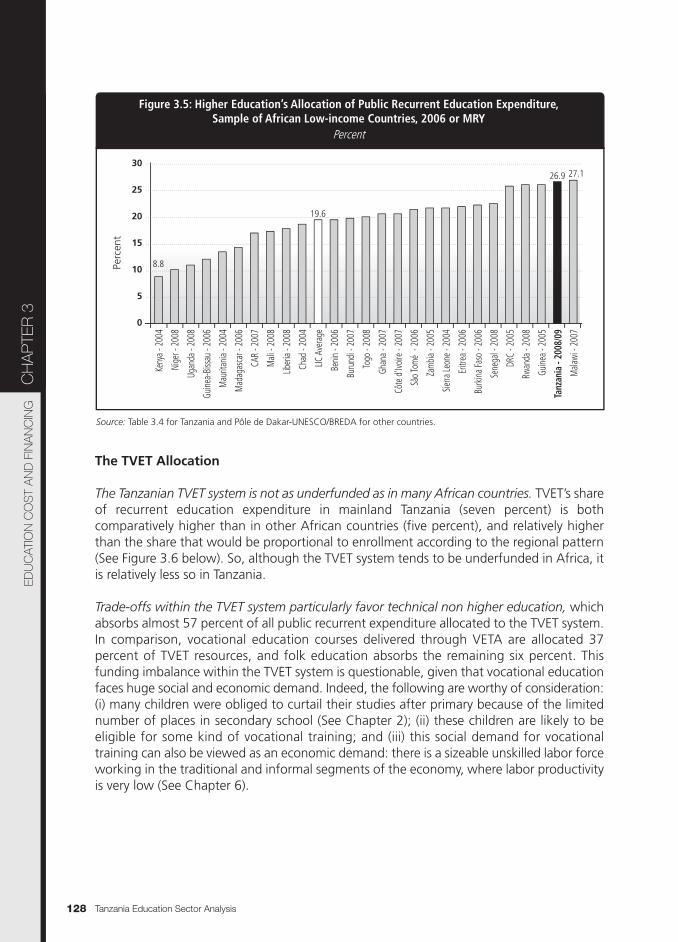
Higher education has benefited from the government’s underspending on the secondarycycle. At 26.9 percent, the share of recurrent education resources allocated to highereducation is six percentage points higher in Tanzania than in other comparable African low-income countries (20.8 percent on average). Tanzania’s higher education allocation is thefifth highest of 41 countries for which data were available,50 and among the highest of allAfrican low-income countries (See Figure 3.5 below).
In the perspective of reducing the funding imbalance within the Tanzanian education sector,more resources should be channeled to secondary education. Although it may not bepossible to reallocate funds from higher education to secondary, the government must lookfor efficiency gains and/or potential cost-saving measures within the higher education cycle.These issues are examined in further detail in this chapter’s section on unit costs.
Tanzania Education Sector Analysis 127
Figure 3.4: The Secondary Cycle’s Allocation of Public Recurrent Education Expenditure,by PCR, Tanzania and Comparable African Countries, 2006 or MRY
40
35
30
25
20
15
10
20 40 60 80 100 120
Seco
ndar
y Sh
are
of R
ecur
rent
Educ
atio
n Ex
pend
iture
(%)
Primary Completion Rate (%)
Percent
y= 9.11 Ln(x) - 12.91R2= 0.159
MainlandTanzania
Source: Authors’ calculations based on Table 3.4 for Tanzania, and Pôle de Dakar-UNESCO/BREDA for other countries.Notes: The share of recurrent education expenditure devoted to secondary education is estimated for countries where the cycle isat least six years, and proportionally adjusted to a six year period, for the purpose of the comparison. Data were available for 25African countries.
Tanzania Education Sector Analysis128
CH
AP
TER
3ED
UC
ATIO
N C
OS
T A
ND
FIN
AN
CIN
G
The TVET Allocation
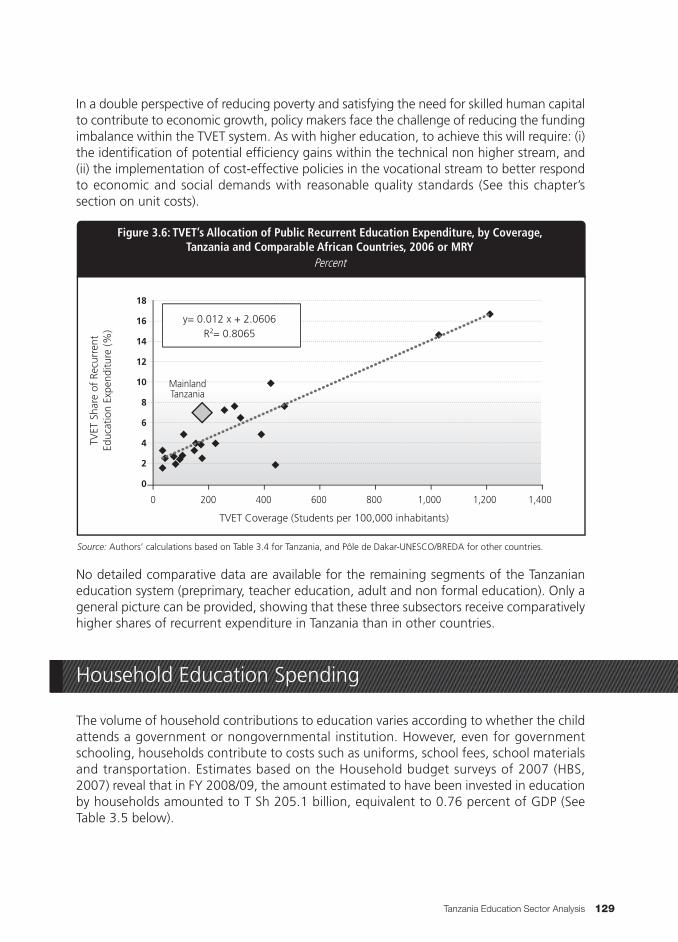
The Tanzanian TVET system is not as underfunded as in many African countries. TVET’s shareof recurrent education expenditure in mainland Tanzania (seven percent) is bothcomparatively higher than in other African countries (five percent), and relatively higherthan the share that would be proportional to enrollment according to the regional pattern(See Figure 3.6 below). So, although the TVET system tends to be underfunded in Africa, itis relatively less so in Tanzania.
Trade-offs within the TVET system particularly favor technical non higher education, whichabsorbs almost 57 percent of all public recurrent expenditure allocated to the TVET system.In comparison, vocational education courses delivered through VETA are allocated 37percent of TVET resources, and folk education absorbs the remaining six percent. Thisfunding imbalance within the TVET system is questionable, given that vocational educationfaces huge social and economic demand. Indeed, the following are worthy of consideration:(i) many children were obliged to curtail their studies after primary because of the limitednumber of places in secondary school (See Chapter 2); (ii) these children are likely to beeligible for some kind of vocational training; and (iii) this social demand for vocationaltraining can also be viewed as an economic demand: there is a sizeable unskilled labor forceworking in the traditional and informal segments of the economy, where labor productivityis very low (See Chapter 6).
Figure 3.5: Higher Education’s Allocation of Public Recurrent Education Expenditure,Sample of African Low-income Countries, 2006 or MRY
30
25
20
15
10
5
0
Keny
a - 2
004
Nige
r - 2
008
Ugan
da -
2008
Guine
a-Bi
ssau
- 20
06
Mau
ritan
ia - 2
004
Mad
agas
car -
200
6
CAR
- 200
7
Mali
- 20
08
Liber
ia - 2
008
Chad
- 20
04
LIC A
vera
ge
Benin
- 20
06
Buru
ndi -
200
7
Togo
- 20
08
Ghan
a - 2
007
Côte
d'Iv
oire -
200
7
São T
omé
- 200
6
Zam
bia -
2005
Sierra
Leon
e - 2
004
Eritr
ea -
2006
Burk
ina Fa
so -
2006
Sene
gal -
200
8
DRC
- 200
5
Rwan
da -
2008
Guine
a - 2
005
Tanz
ania
- 20
08/0
9
Mala
wi -
2007
Perc
ent
Percent
19.6
8.8
26.9 27.1
Source: Table 3.4 for Tanzania and Pôle de Dakar-UNESCO/BREDA for other countries.
In a double perspective of reducing poverty and satisfying the need for skilled human capitalto contribute to economic growth, policy makers face the challenge of reducing the fundingimbalance within the TVET system. As with higher education, to achieve this will require: (i)the identification of potential efficiency gains within the technical non higher stream, and(ii) the implementation of cost-effective policies in the vocational stream to better respondto economic and social demands with reasonable quality standards (See this chapter’ssection on unit costs).
No detailed comparative data are available for the remaining segments of the Tanzanianeducation system (preprimary, teacher education, adult and non formal education). Only ageneral picture can be provided, showing that these three subsectors receive comparativelyhigher shares of recurrent expenditure in Tanzania than in other countries.
Household Education Spending
The volume of household contributions to education varies according to whether the childattends a government or nongovernmental institution. However, even for governmentschooling, households contribute to costs such as uniforms, school fees, school materialsand transportation. Estimates based on the Household budget surveys of 2007 (HBS,2007) reveal that in FY 2008/09, the amount estimated to have been invested in educationby households amounted to T Sh 205.1 billion, equivalent to 0.76 percent of GDP (SeeTable 3.5 below).
Tanzania Education Sector Analysis 129
Figure 3.6: TVET’s Allocation of Public Recurrent Education Expenditure, by Coverage,Tanzania and Comparable African Countries, 2006 or MRY
18
16
14
12
10
8
6
4
2
0
0 200 400 600 800 1,000 1,200 1,400
TVET
Sha
re o
f Re
curr
ent
Educ
atio
n Ex
pend
iture
(%)
TVET Coverage (Students per 100,000 inhabitants)
Percent
y= 0.012 x + 2.0606R2= 0.8065
MainlandTanzania
Source: Authors’ calculations based on Table 3.4 for Tanzania, and Pôle de Dakar-UNESCO/BREDA for other countries.
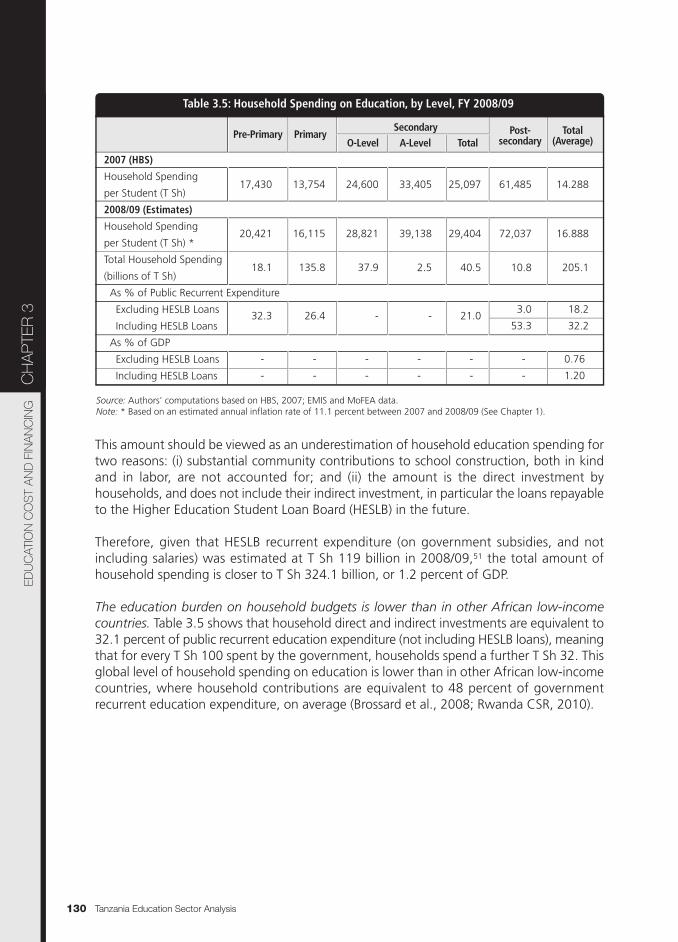
This amount should be viewed as an underestimation of household education spending fortwo reasons: (i) substantial community contributions to school construction, both in kindand in labor, are not accounted for; and (ii) the amount is the direct investment byhouseholds, and does not include their indirect investment, in particular the loans repayableto the Higher Education Student Loan Board (HESLB) in the future.
Therefore, given that HESLB recurrent expenditure (on government subsidies, and notincluding salaries) was estimated at T Sh 119 billion in 2008/09,51 the total amount ofhousehold spending is closer to T Sh 324.1 billion, or 1.2 percent of GDP.
The education burden on household budgets is lower than in other African low-incomecountries. Table 3.5 shows that household direct and indirect investments are equivalent to32.1 percent of public recurrent education expenditure (not including HESLB loans), meaningthat for every T Sh 100 spent by the government, households spend a further T Sh 32. Thisglobal level of household spending on education is lower than in other African low-incomecountries, where household contributions are equivalent to 48 percent of governmentrecurrent education expenditure, on average (Brossard et al., 2008; Rwanda CSR, 2010).
Tanzania Education Sector Analysis130
CH
AP
TER
3ED
UC
ATIO
N C
OS
T A
ND
FIN
AN
CIN
G
2007 (HBS)
Household Spending
per Student (T Sh)
2008/09 (Estimates)
Household Spending
per Student (T Sh) *
Total Household Spending
(billions of T Sh)
As % of Public Recurrent Expenditure
Excluding HESLB Loans
Including HESLB Loans
As % of GDP
Excluding HESLB Loans
Including HESLB Loans
Pre-Primary PrimaryO-Level A-Level
SecondaryTotal
Post-secondary
Total(Average)
Table 3.5: Household Spending on Education, by Level, FY 2008/09
17,430
20,421
18.1
32.3
-
-
-
-
-
-
-
-
-
-
-
-
0.76
1.20
13,754
16,115
135.8
26.4
24,600
28,821
37.9
-
33,405
39,138
2.5
-
25,097
29,404
40.5
21.0
61,485
72,037
10.8
3.0
53.3
14.288
16.888
205.1
18.2
32.2
Source: Authors' computations based on HBS, 2007; EMIS and MoFEA data.Note: * Based on an estimated annual inflation rate of 11.1 percent between 2007 and 2008/09 (See Chapter 1).

Higher Education Cost-Sharing
The higher education cost-sharing policy has contributed to reduce the government’sfinancial burden. Household spending on education is equivalent to less than 30 percent ofgovernment expenditure for the primary and secondary levels, but more than 50 percentfor higher and tertiary education. Tanzanian households’ investment in higher education isalso comparatively higher than in other African countries (See Figure 3.7). Recent studiesshow that with the current high level of higher education unit costs, governments cannotbe the sole financiers of this cycle, especially in a context of rapid expansion and given theneed to improve the quality of service delivery (Pôle de Dakar, 2007; World Bank, 2010).That Tanzanian families pay just over a third of the cost of higher education shows that thecost-sharing policy has been effective in lowering the government’s financial burden.However, the management of the loan-recovery mechanisms of the HESLB should bestrengthened to ensure the financial sustainability of the loan scheme.
Trends in household education spending have been analyzed on the basis of data from theHousehold Budget Surveys (HBS) for 2000 and 2007, focusing on spending per student.Figure below 3.8 shows that household spending per child has decreased in real terms forthe preprimary and primary levels, by 40 percent over 2000-07, but increased significantlyfor A-Level and postsecondary levels, by 29 percent and 21 percent respectively.
Tanzania Education Sector Analysis 131
Figure 3.7: International Comparison of Household Spending on Education, by Level, 2009 or MRY
90
80
70
60
50
40
30
20
10
0
Perc
ent
Percentage Equivalent of Public Recurrent Education Expenditure
83
2126
41
53
30
48
32
Mainland Tanzania
African LICs
Primary Secondary Higher/Tertiary Average
Source: Table 3.5 for Tanzania; Rwanda CSR, 2010 and Brossard et al., 2008 for 17 African low-income countries.Note: 18 African low-income countries are considered here: Benin, Burkina Faso, Cameroon, Chad, Congo, Côte d’Ivoire, Djibouti,Guinea Bissau, Madagascar, Malawi, Mali, Mauritania, Niger, Rwanda, Senegal, Sierra Leone, Togo and Uganda.
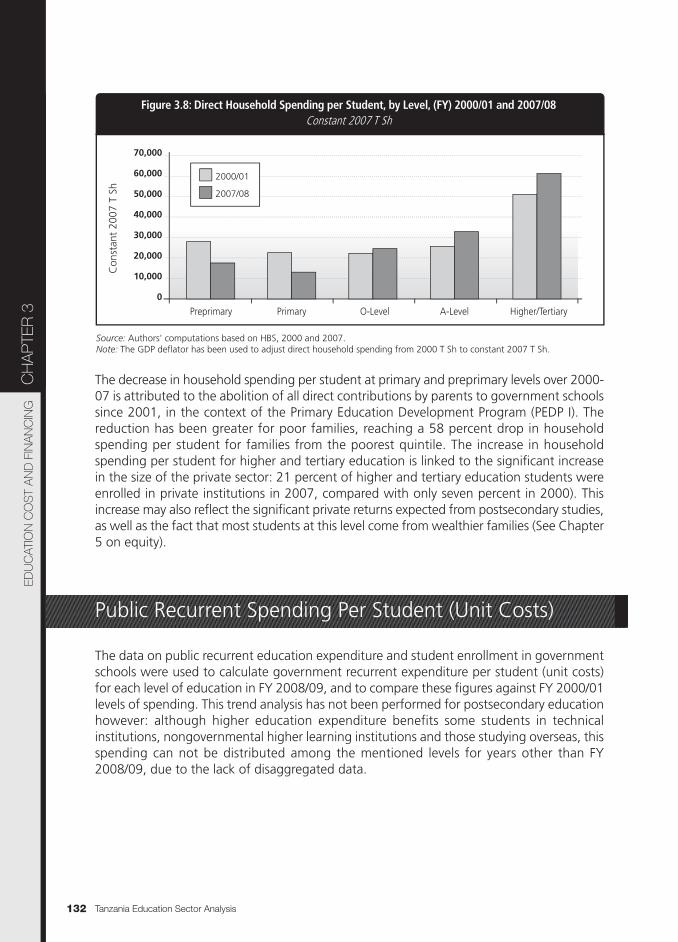
The decrease in household spending per student at primary and preprimary levels over 2000-07 is attributed to the abolition of all direct contributions by parents to government schoolssince 2001, in the context of the Primary Education Development Program (PEDP I). Thereduction has been greater for poor families, reaching a 58 percent drop in householdspending per student for families from the poorest quintile. The increase in householdspending per student for higher and tertiary education is linked to the significant increasein the size of the private sector: 21 percent of higher and tertiary education students wereenrolled in private institutions in 2007, compared with only seven percent in 2000). Thisincrease may also reflect the significant private returns expected from postsecondary studies,as well as the fact that most students at this level come from wealthier families (See Chapter5 on equity).
Public Recurrent Spending Per Student (Unit Costs)
The data on public recurrent education expenditure and student enrollment in governmentschools were used to calculate government recurrent expenditure per student (unit costs)for each level of education in FY 2008/09, and to compare these figures against FY 2000/01levels of spending. This trend analysis has not been performed for postsecondary educationhowever: although higher education expenditure benefits some students in technicalinstitutions, nongovernmental higher learning institutions and those studying overseas, thisspending can not be distributed among the mentioned levels for years other than FY2008/09, due to the lack of disaggregated data.
Tanzania Education Sector Analysis132
CH
AP
TER
3ED
UC
ATIO
N C
OS
T A
ND
FIN
AN
CIN
G
Figure 3.8: Direct Household Spending per Student, by Level, (FY) 2000/01 and 2007/08
70,000
60,000
50,000
40,000
30,000
20,000
10,000
0
Con
stan
t 20
07 T
Sh
Constant 2007 T Sh
2000/01
2007/08
Preprimary Primary O-Level A-Level Higher/Tertiary
Source: Authors' computations based on HBS, 2000 and 2007.Note: The GDP deflator has been used to adjust direct household spending from 2000 T Sh to constant 2007 T Sh.
Overview
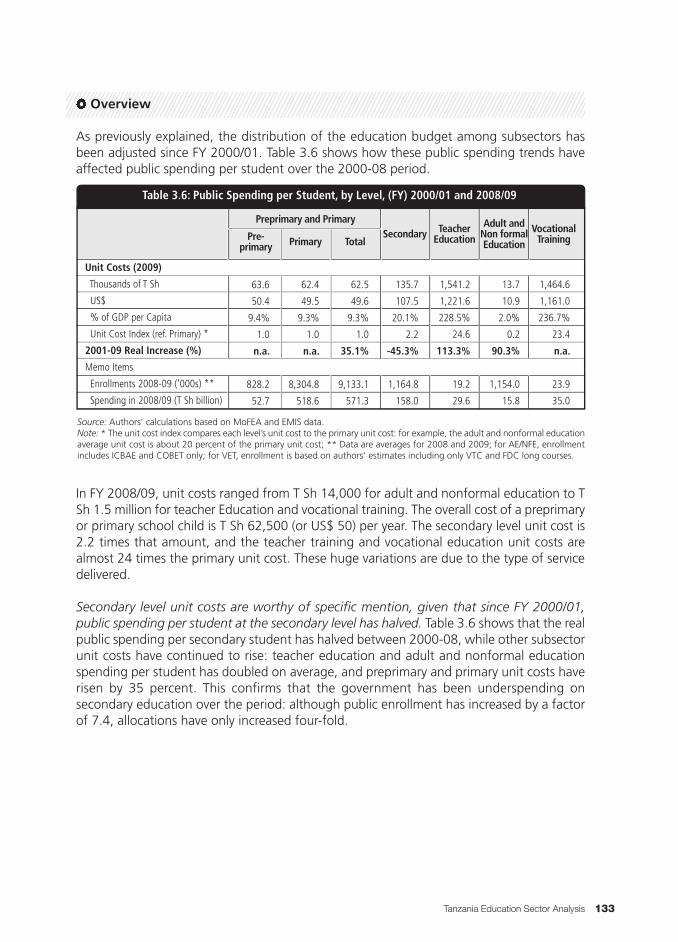
As previously explained, the distribution of the education budget among subsectors hasbeen adjusted since FY 2000/01. Table 3.6 shows how these public spending trends haveaffected public spending per student over the 2000-08 period.
In FY 2008/09, unit costs ranged from T Sh 14,000 for adult and nonformal education to TSh 1.5 million for teacher Education and vocational training. The overall cost of a preprimaryor primary school child is T Sh 62,500 (or US$ 50) per year. The secondary level unit cost is2.2 times that amount, and the teacher training and vocational education unit costs arealmost 24 times the primary unit cost. These huge variations are due to the type of servicedelivered.
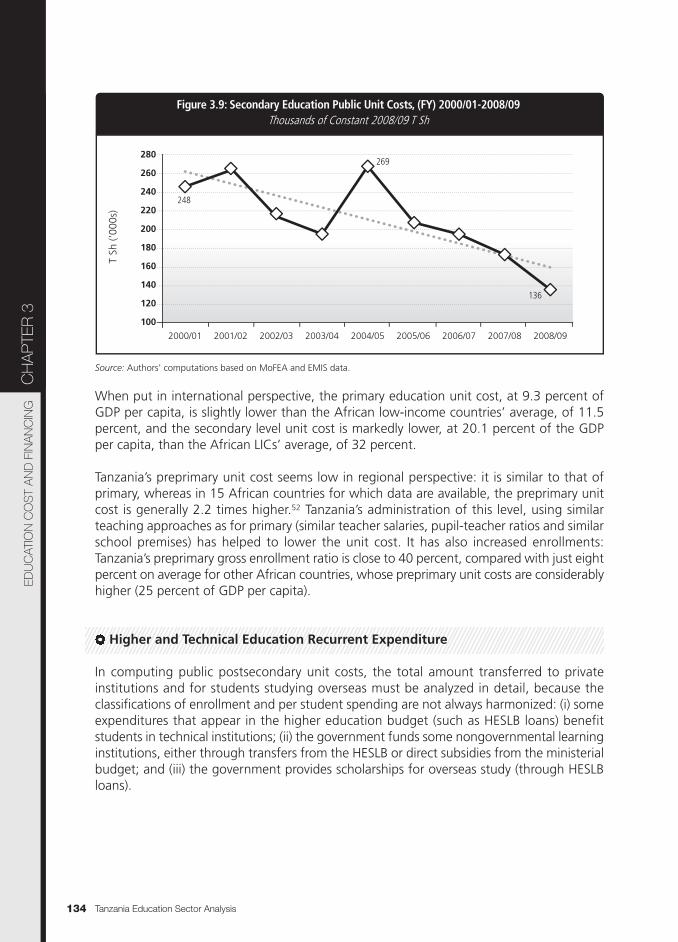
Secondary level unit costs are worthy of specific mention, given that since FY 2000/01,public spending per student at the secondary level has halved. Table 3.6 shows that the realpublic spending per secondary student has halved between 2000-08, while other subsectorunit costs have continued to rise: teacher education and adult and nonformal educationspending per student has doubled on average, and preprimary and primary unit costs haverisen by 35 percent. This confirms that the government has been underspending onsecondary education over the period: although public enrollment has increased by a factorof 7.4, allocations have only increased four-fold.
Tanzania Education Sector Analysis 133
Unit Costs (2009)
Thousands of T Sh
US$
% of GDP per Capita
Unit Cost Index (ref. Primary) *
2001-09 Real Increase (%)
Memo Items
Enrollments 2008-09 (’000s) **
Spending in 2008/09 (T Sh billion)
Pre-primary Primary
Preprimary and Primary
TotalSecondary Teacher
Education
Adult andNon formalEducation
VocationalTraining
Table 3.6: Public Spending per Student, by Level, (FY) 2000/01 and 2008/09
63.6
50.4
9.4%
1.0
n.a.
828.2
52.7
62.4
49.5
9.3%
1.0
n.a.
8,304.8
518.6
62.5
49.6
9.3%
1.0
35.1%
9,133.1
571.3
135.7
107.5
20.1%
2.2
-45.3%
1,164.8
158.0
1,541.2
1,221.6
228.5%
24.6
113.3%
19.2
29.6
13.7
10.9
2.0%
0.2
90.3%
1,154.0
15.8
1,464.6
1,161.0
236.7%
23.4
n.a.
23.9
35.0
Source: Authors’ calculations based on MoFEA and EMIS data.Note: * The unit cost index compares each level’s unit cost to the primary unit cost: for example, the adult and nonformal educationaverage unit cost is about 20 percent of the primary unit cost; ** Data are averages for 2008 and 2009; for AE/NFE, enrollmentincludes ICBAE and COBET only; for VET, enrollment is based on authors’ estimates including only VTC and FDC long courses.
When put in international perspective, the primary education unit cost, at 9.3 percent ofGDP per capita, is slightly lower than the African low-income countries’ average, of 11.5percent, and the secondary level unit cost is markedly lower, at 20.1 percent of the GDPper capita, than the African LICs’ average, of 32 percent.
Tanzania’s preprimary unit cost seems low in regional perspective: it is similar to that ofprimary, whereas in 15 African countries for which data are available, the preprimary unitcost is generally 2.2 times higher.52 Tanzania’s administration of this level, using similarteaching approaches as for primary (similar teacher salaries, pupil-teacher ratios and similarschool premises) has helped to lower the unit cost. It has also increased enrollments:Tanzania’s preprimary gross enrollment ratio is close to 40 percent, compared with just eightpercent on average for other African countries, whose preprimary unit costs are considerablyhigher (25 percent of GDP per capita).
Higher and Technical Education Recurrent Expenditure
In computing public postsecondary unit costs, the total amount transferred to privateinstitutions and for students studying overseas must be analyzed in detail, because theclassifications of enrollment and per student spending are not always harmonized: (i) someexpenditures that appear in the higher education budget (such as HESLB loans) benefitstudents in technical institutions; (ii) the government funds some nongovernmental learninginstitutions, either through transfers from the HESLB or direct subsidies from the ministerialbudget; and (iii) the government provides scholarships for overseas study (through HESLBloans).
Tanzania Education Sector Analysis134
CH
AP
TER
3ED
UC
ATIO
N C
OS
T A
ND
FIN
AN
CIN
G
Figure 3.9: Secondary Education Public Unit Costs, (FY) 2000/01-2008/09
280
260
240
220
200
180
160
140
120
100
2000/01 2001/02 2002/03 2003/04 2004/05 2005/06 2006/07 2007/08 2008/09
T Sh
(’00
0s)
Thousands of Constant 2008/09 T Sh
248
269
136
Source: Authors' computations based on MoFEA and EMIS data.

The Higher Education Student Loan Board (HESLB)
In FY 2008/09, the HESLB granted loans to 59,033 students in 51 postsecondary institutions(47 on the mainland and four in Zanzibar), including: (i) 31 universities, and 20 technicalinstitutions; (ii) 27 public and 24 private institutions; and (iii) 39 higher education institutions,and 12 nonhigher (See Annex Table 3.2). These institutions accounted for 95.2 percent ofall HESLB disbursements, the remainder financing overseas scholarships.
Therefore, in order to reach reliable estimates of public higher education unit costs it is firstnecessary to distribute the amounts devoted to HESLB loans among their beneficiaries,differentiating between universities and technical nonhigher institutions.
A total amount of T Sh 135.1 billion was disbursed by the HESLB in FY 2008/09: 85 percentfor university students, and 15 percent for students in technical institutions. Also, about 36percent of overall disbursements were for students in private institutions (See Table 3.7).
Another key feature of the HESLB’s activities to be considered is that 30 percent of loanswere transferred directly to institutions, to cover tuition fees and special facultyrequirements. The remaining 70 percent was transferred to students’ bank accounts, forthem to finance their meals and accommodation, books and stationery, practical trainingand research (See Annex Table 3.3). A total amount of T Sh 47.3 billion was transferred bythe HESLB to the private sector in 2008/09, equivalent to 12.6 percent of public recurrent
Tanzania Education Sector Analysis 135
HESLB National Loans
Mainland Tanzania
Government HLIs
Transferred to HLIs
Transferred to Students
Nongovernmental HLIs
Transferred to HLIs
Transferred to Students
Zanzibar
Subtotal
%
All HESLB Funding
National Loans
Overseas Students
Total
UniversityHigher
Technical Education
Non-higherTotal %
Table 3.7: HESLB Loans Disbursed, by Level, FY 2008/09
105,447
63,787
16,593
47,194
41,660
14,835
26,825
3,965
109,412
85.0%
109,412
—
109,412
18,335
14,399
3,559
10,840
3,936
2,154
1,782
0
18,335
14.2%
18,335
—
18,335
943
300
72
228
643
212
431
7
950
0.7%
950
—
950
124,725
78,485
20,223
58,262
46,240
17,202
29,038
3,972
128,697
100.0%
128,697
6,444
135,141
96.9%
61.0%
15.7%
45.3%
35.9%
13.4%
22.6%
3.1%
100.0%
95.2%
4.8%
100.00%
Millions of T Sh and Percent
Source: HESLB and authors’ calculations.
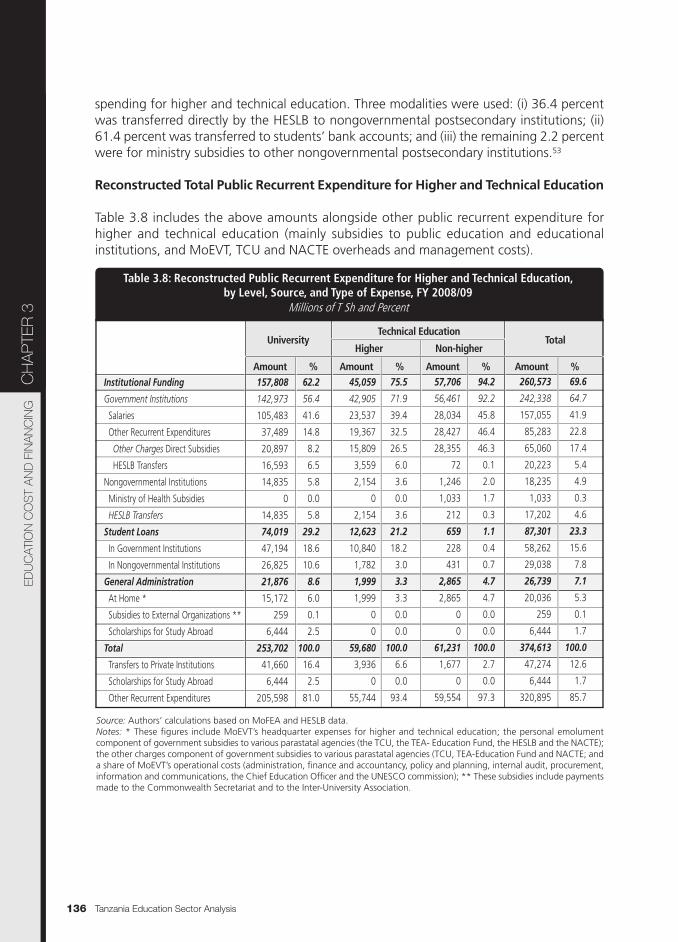
spending for higher and technical education. Three modalities were used: (i) 36.4 percentwas transferred directly by the HESLB to nongovernmental postsecondary institutions; (ii)61.4 percent was transferred to students’ bank accounts; and (iii) the remaining 2.2 percentwere for ministry subsidies to other nongovernmental postsecondary institutions.53
Reconstructed Total Public Recurrent Expenditure for Higher and Technical Education
Table 3.8 includes the above amounts alongside other public recurrent expenditure forhigher and technical education (mainly subsidies to public education and educationalinstitutions, and MoEVT, TCU and NACTE overheads and management costs).
Tanzania Education Sector Analysis136
CH
AP
TER
3ED
UC
ATIO
N C
OS
T A
ND
FIN
AN
CIN
G
Institutional Funding
Government Institutions
Salaries
Other Recurrent Expenditures
Other Charges Direct Subsidies
HESLB Transfers
Nongovernmental Institutions
Ministry of Health Subsidies
HESLB Transfers
Student Loans
In Government Institutions
In Nongovernmental Institutions
General Administration
At Home *
Subsidies to External Organizations **
Scholarships for Study Abroad
Total
Transfers to Private Institutions
Scholarships for Study Abroad
Other Recurrent Expenditures
University
Amount % Amount % Amount % Amount %
Higher
Technical Education
Non-higherTotal
Table 3.8: Reconstructed Public Recurrent Expenditure for Higher and Technical Education,by Level, Source, and Type of Expense, FY 2008/09
157,808
142,973
105,483
37,489
20,897
16,593
14,835
0
14,835
74,019
47,194
26,825
21,876
15,172
259
6,444
253,702
41,660
6,444
205,598
62.2
56.4
41.6
14.8
8.2
6.5
5.8
0.0
5.8
29.2
18.6
10.6
8.6
6.0
0.1
2.5
100.0
16.4
2.5
81.0
45,059
42,905
23,537
19,367
15,809
3,559
2,154
0
2,154
12,623
10,840
1,782
1,999
1,999
0
0
59,680
3,936
0
55,744
75.5
71.9
39.4
32.5
26.5
6.0
3.6
0.0
3.6
21.2
18.2
3.0
3.3
3.3
0.0
0.0
100.0
6.6
0.0
93.4
57,706
56,461
28,034
28,427
28,355
72
1,246
1,033
212
659
228
431
2,865
2,865
0
0
61,231
1,677
0
59,554
94.2
92.2
45.8
46.4
46.3
0.1
2.0
1.7
0.3
1.1
0.4
0.7
4.7
4.7
0.0
0.0
100.0
2.7
0.0
97.3
260,573
242,338
157,055
85,283
65,060
20,223
18,235
1,033
17,202
87,301
58,262
29,038
26,739
20,036
259
6,444
374,613
47,274
6,444
320,895
69.6
64.7
41.9
22.8
17.4
5.4
4.9
0.3
4.6
23.3
15.6
7.8
7.1
5.3
0.1
1.7
100.0
12.6
1.7
85.7
Millions of T Sh and Percent
Source: Authors’ calculations based on MoFEA and HESLB data.Notes: * These figures include MoEVT’s headquarter expenses for higher and technical education; the personal emolumentcomponent of government subsidies to various parastatal agencies (the TCU, the TEA- Education Fund, the HESLB and the NACTE);the other charges component of government subsidies to various parastatal agencies (TCU, TEA-Education Fund and NACTE; anda share of MoEVT’s operational costs (administration, finance and accountancy, policy and planning, internal audit, procurement,information and communications, the Chief Education Officer and the UNESCO commission); ** These subsidies include paymentsmade to the Commonwealth Secretariat and to the Inter-University Association.
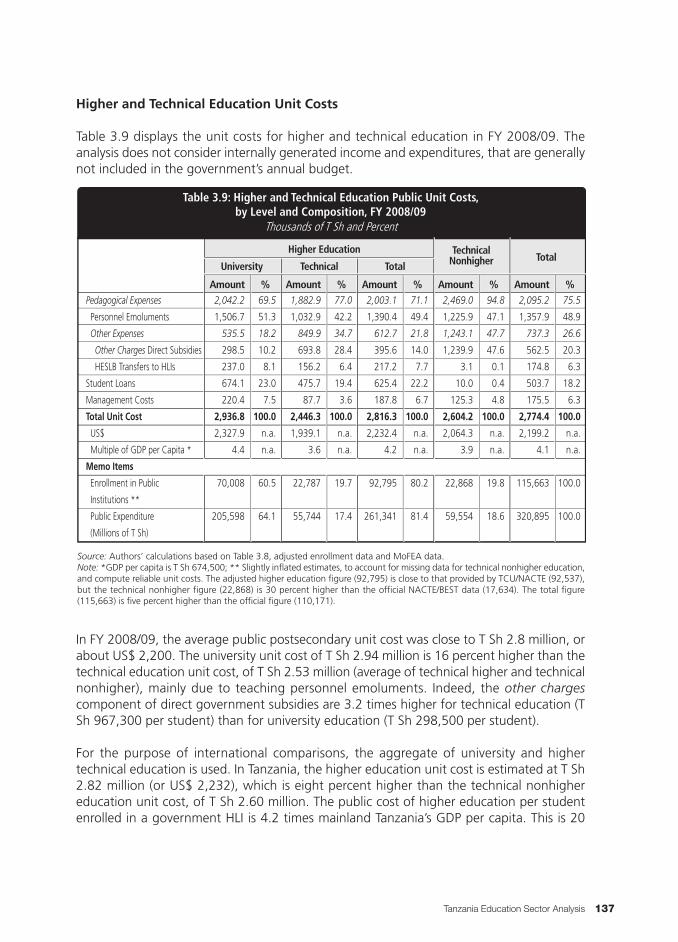
Higher and Technical Education Unit Costs
Table 3.9 displays the unit costs for higher and technical education in FY 2008/09. Theanalysis does not consider internally generated income and expenditures, that are generallynot included in the government’s annual budget.
In FY 2008/09, the average public postsecondary unit cost was close to T Sh 2.8 million, orabout US$ 2,200. The university unit cost of T Sh 2.94 million is 16 percent higher than thetechnical education unit cost, of T Sh 2.53 million (average of technical higher and technicalnonhigher), mainly due to teaching personnel emoluments. Indeed, the other chargescomponent of direct government subsidies are 3.2 times higher for technical education (TSh 967,300 per student) than for university education (T Sh 298,500 per student).
For the purpose of international comparisons, the aggregate of university and highertechnical education is used. In Tanzania, the higher education unit cost is estimated at T Sh2.82 million (or US$ 2,232), which is eight percent higher than the technical nonhighereducation unit cost, of T Sh 2.60 million. The public cost of higher education per studentenrolled in a government HLI is 4.2 times mainland Tanzania’s GDP per capita. This is 20
Tanzania Education Sector Analysis 137
Pedagogical Expenses
Personnel Emoluments
Other Expenses
Other Charges Direct Subsidies
HESLB Transfers to HLIs
Student Loans
Management Costs
Total Unit Cost
US$
Multiple of GDP per Capita *
Memo Items
Enrollment in Public
Institutions **
Public Expenditure
(Millions of T Sh)
University Technical TotalTotal
TechnicalNonhigher
Amount %
Higher Education
Table 3.9: Higher and Technical Education Public Unit Costs,by Level and Composition, FY 2008/09
2,042.2
1,506.7
535.5
298.5
237.0
674.1
220.4
2,936.8
2,327.9
4.4
70,008
205,598
69.5
51.3
18.2
10.2
8.1
23.0
7.5
100.0
n.a.
n.a.
60.5
64.1
Amount %1,882.9
1,032.9
849.9
693.8
156.2
475.7
87.7
2,446.3
1,939.1
3.6
22,787
55,744
77.0
42.2
34.7
28.4
6.4
19.4
3.6
100.0
n.a.
n.a.
19.7
17.4
Amount %2,003.1
1,390.4
612.7
395.6
217.2
625.4
187.8
2,816.3
2,232.4
4.2
92,795
261,341
71.1
49.4
21.8
14.0
7.7
22.2
6.7
100.0
n.a.
n.a.
80.2
81.4
Amount %2,469.0
1,225.9
1,243.1
1,239.9
3.1
10.0
125.3
2,604.2
2,064.3
3.9
22,868
59,554
94.8
47.1
47.7
47.6
0.1
0.4
4.8
100.0
n.a.
n.a.
19.8
18.6
Amount %2,095.2
1,357.9
737.3
562.5
174.8
503.7
175.5
2,774.4
2,199.2
4.1
115,663
320,895
75.5
48.9
26.6
20.3
6.3
18.2
6.3
100.0
n.a.
n.a.
100.0
100.0
Thousands of T Sh and Percent
Source: Authors’ calculations based on Table 3.8, adjusted enrollment data and MoFEA data.Note: *GDP per capita is T Sh 674,500; ** Slightly inflated estimates, to account for missing data for technical nonhigher education,and compute reliable unit costs. The adjusted higher education figure (92,795) is close to that provided by TCU/NACTE (92,537),but the technical nonhigher figure (22,868) is 30 percent higher than the official NACTE/BEST data (17,634). The total figure(115,663) is five percent higher than the official figure (110,171).

Cost-savings and Efficiency Gains
Scope to reduce costs and improve efficiency exists at two interrelated levels: (i) the fundingallocations to individual postsecondary institutions; and (ii) the composition of publicexpenditure per student.
Cost-Saving/Efficiency-Gain Measure 1: Improve the Link Between Funding Allocationsand Needs
Other charges per student vary considerably among postsecondary institutions. Althoughthey are expected to be higher for technical institutions than for universities (due to thetype of teaching, the technical materials and equipment required, and so on), the differencenoted in Tanzania of a factor of 3.2 is questionable.54 This situation requires further analysisby subject area however, given the diversity of courses offered, and training types, inputsand costs.
NACTE has clustered various technical fields into five subject areas, and established a SubjectBoard to handle each subject area. The five subject areas and their corresponding boards
percent higher than for other African low-income countries, where the average unit cost is3.5 times GDP per capita (See Figure 3.10), which calls for an analysis of the areas wherecost-savings and/or efficiency gains can be made.
Tanzania Education Sector Analysis138
CH
AP
TER
3ED
UC
ATIO
N C
OS
T A
ND
FIN
AN
CIN
G
Figure 3.10: Cross-country Comparison of Public Higher Education Unit Costs, 2006 or MRY
25
20
15
10
5
0
Guin
ea-B
issau
, 200
6
CAR,
200
7
Mau
ritan
ia, 2
004
Liber
ia, 2
008
Mal
i, 20
08
Beni
n, 2
006
Togo
, 200
7
Guin
ea, 2
005
Sene
gal,
2007
Côte
d'Iv
oire
, 200
7
Ugan
da, 2
004
Mad
agas
car, 2
006
Burk
ina
Faso
, 200
6
Med
ian
Valu
e
DRC,
200
5
Keny
a, 2
004
Chad
, 200
5
Ghan
a, 2
007
Sierra
Leon
e, 20
04
Nige
r, 200
8
Tanz
ania
, 200
9
São
Tom
é, 20
06
Rwan
da, 2
008
Buru
ndi,
2007
Eritr
ea, 2
004
Mal
awi,
2007
Mul
tiple
of
GD
P pe
r C
apita
Multiple of GDP per Capita
2.20.6
4.2
21.5
Source: Table 3.4 for Tanzania and Pôle de Dakar-UNESCO/BREDA for other countries.

are: (i) agriculture, natural resources and environment; (ii) business and management; (iii)engineering and other sciences; (iv) health and allied sciences; and (v) planning and welfare.Surprisingly, planning and welfare courses are twice as expensive as health and alliedsciences; engineering courses are the most expensive, almost 13 times more than businessand management, which is the least costly subject (See Table 3.10).
Tanzania Education Sector Analysis 139
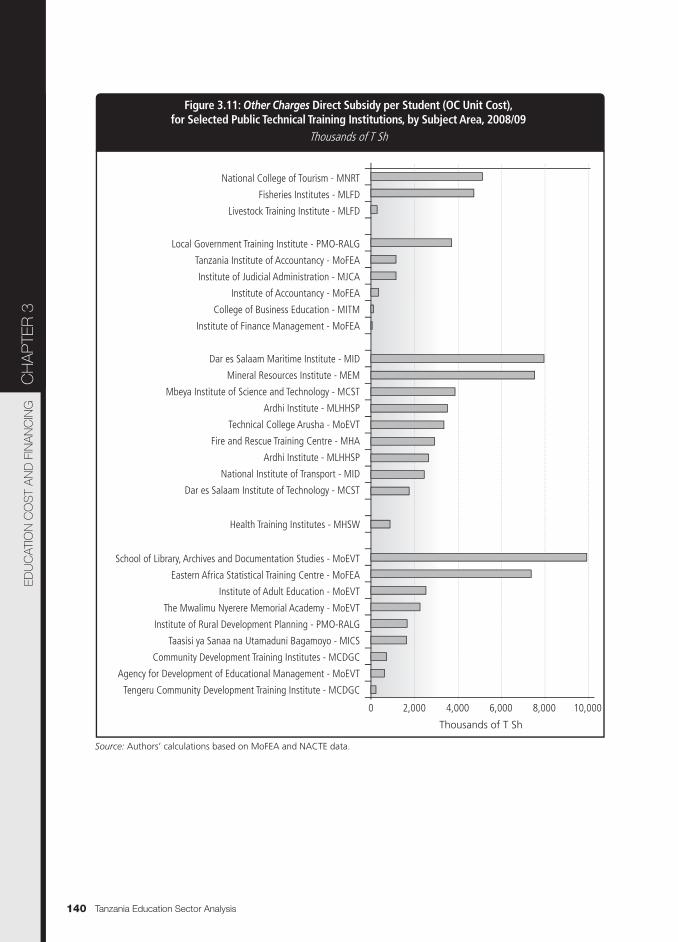
However, even for a same subject area, and among institutions with comparable levels ofenrollment, the variation in the resources devoted to other charges is large (See Figure 3.11below).
The planning and welfare training centers show the greatest disparity in other charges perstudent: the School of Library, Archives and Documentation Studies and the Agency for theDevelopment of Educational Management, both under MoEVT, each had an average 300students enrolled per year over 2008-09, but the other charges per student of the latter(T Sh 9.9 million) were over 16 times higher than those of the former (T Sh 0.6 million).Likewise, the variations are significant within engineering courses: the Ardhi institute locatedat Tabora (under the Ministry of Lands, Housing and Human Settlements Development) andthe Mineral Resources Institute (under the Ministry of Energy and Minerals) each had anaverage of 125 students enrolled per year over 2008-09, but the other charges per studentof the latter (T Sh 7.5 million) are more than double those of the former (T Sh 3.5 million).
The majority of the technical institutions offering agricultural or health trainings are notsubsidized, in the sense that they do not have an autonomous budget. Although the realother charges per student per institution were not available, their consolidated amount bysubject area for public health training institutes and livestock and fisheries training instituteshas been captured.55
Agriculture, Natural Resources
and Environment
Business and Management
Engineering and Other Sciences
Health and Allied Sciences
Planning and Welfare
Average
Unit Cost Unit CostIndex
NonhigherHigher Average
Table 3.10: Other Charges Direct Subsidy per Student in Technical Institutions,by Subject Area, FY 2008/09
n.a.
168.9
2,701.3
n.a.
1,601.2
693.8
n.a.
1.0
16.0
n.a.
9.5
n.a.
576.6
669.8
3,616.6
830.0
1,744.8
1,239.9
1.0
1.2
6.3
1.4
3.0
n.a.
576.6
247.4
3,110.2
830.0
1,687.1
967.3
2.3
1.0
12.6
3.4
6.8
n.a.
Unit Cost Unit CostIndex Unit Cost Unit Cost
Index
Thousands of T Sh
Source: Authors’ calculations based on MoFEA and NACTE data.Notes: The unit cost index is obtained by dividing the unit cost for a given subject area by the lowest unit cost of all subject areas.For instance, the other charges per student for planning and welfare studies are 6.8 times those of business and management.
Tanzania Education Sector Analysis140
Source: Authors’ calculations based on MoFEA and NACTE data.
CH
AP
TER
3ED
UC
ATIO
N C
OS
T A
ND
FIN
AN
CIN
G
Figure 3.11: Other Charges Direct Subsidy per Student (OC Unit Cost),for Selected Public Technical Training Institutions, by Subject Area, 2008/09
Thousands of T Sh
0 2,000 4,000 6,000 8,000 10,000
Thousands of T Sh
Tengeru Community Development Training Institute - MCDGC
Agency for Development of Educational Management - MoEVT
Community Development Training Institutes - MCDGC
Taasisi ya Sanaa na Utamaduni Bagamoyo - MICS
Institute of Rural Development Planning - PMO-RALG
The Mwalimu Nyerere Memorial Academy - MoEVT
Institute of Adult Education - MoEVT
Eastern Africa Statistical Training Centre - MoFEA
School of Library, Archives and Documentation Studies - MoEVT
Health Training Institutes - MHSW
Dar es Salaam Institute of Technology - MCST
National Institute of Transport - MID
Ardhi Institute - MLHHSP
Fire and Rescue Training Centre - MHA
Technical College Arusha - MoEVT
Ardhi Institute - MLHHSP
Mbeya Institute of Science and Technology - MCST
Mineral Resources Institute - MEM
Dar es Salaam Maritime Institute - MID
Institute of Finance Management - MoFEA
College of Business Education - MITM
Institute of Accountancy - MoFEA
Institute of Judicial Administration - MJCA
Tanzania Institute of Accountancy - MoFEA
Local Government Training Institute - PMO-RALG
Livestock Training Institute - MLFD
Fisheries Institutes - MLFD
National College of Tourism - MNRT

Conversely, other charges at universities are highly correlated to their number of students.In general, an enrollment increase of 20 percent (that is the overall increase observed over2007-08 for mainland public universities) lead to an increase in other charges ranging fromthree percent to nine percent. Other charges increase at a lower rate than enrollments, dueto economies of scale: indeed, the other charges unit cost for universities with 20 percentmore students is 14 percent lower, on average (See Figure 3.12).
Tanzania Education Sector Analysis 141
Cost-Saving/Efficiency-gain Measure 2: Increase University Enrollment, at Lower Cost
The existence of economies of scale indicates a certain rationality in the allocation of othercharges unit costs (OC unit costs) among universities, and has two favorable implications:
(i) OC unit costs are much higher for small universities. Figure 3.12 shows that thesecosts rise sharply for universities with fewer than 7,000 students. The seven publicuniversities that have less than 5,000 students enroll just 28 percent of all publicuniversity students (most of them are underutilized - See Chapter 7 on management),and OC unit costs range from T Sh 470,000 to T Sh 920,000, compared with lessthan T Sh 300,000 for universities with 7,000 students or more; and
(ii) Fixed cost allocations, at times of questionable magnitude, can be reviewed in thelight of the institution’s needs according to the type of training delivered, to identifypotential cost-savings (agriculture courses will require greater resources thaneducation courses). Currently, universities with only 2,000 students (close to the
1,000
900
800
700
600
500
400
300
200
100
0
OC
Uni
t C
ost
(Tho
usan
ds o
f T
Sh)
Enrollment (Thousands)
Thousands of T Sh
0 5 10 15 20 25 30
y= 1,592.9 N -0.8785
R2= 0.8392
MUCE
SUAARU
MU
UDOM
UDSM
OUT
MUHAS
MUCCOBS
BUCE
Source: Authors’ calculations based on MoFEA and TCU data.Notes: Unit costs are for FY 2008/09, and enrollments are averages for 2008 and 2009. Even by removing the Open University ofTanzania (OUT) from this graph, the correlation remains high: Y = 1,135.1 N-0,56 (R² = 0.749).
minimum average per year for all public universities over 2008-09) receive anapproximate OC allocation of T Sh 1.64 billion, regardless of their subjectspecializations.
Cost-Saving/Efficiency-Gain Measure 3: Target Social Expenditures at the Students inGreatest Need
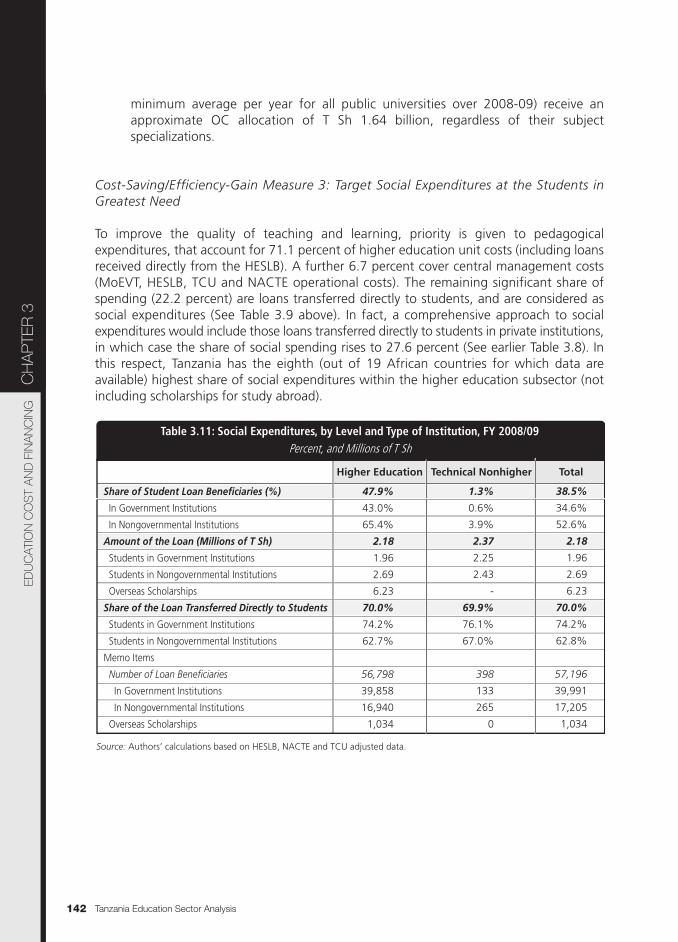
To improve the quality of teaching and learning, priority is given to pedagogicalexpenditures, that account for 71.1 percent of higher education unit costs (including loansreceived directly from the HESLB). A further 6.7 percent cover central management costs(MoEVT, HESLB, TCU and NACTE operational costs). The remaining significant share ofspending (22.2 percent) are loans transferred directly to students, and are considered associal expenditures (See Table 3.9 above). In fact, a comprehensive approach to socialexpenditures would include those loans transferred directly to students in private institutions,in which case the share of social spending rises to 27.6 percent (See earlier Table 3.8). Inthis respect, Tanzania has the eighth (out of 19 African countries for which data areavailable) highest share of social expenditures within the higher education subsector (notincluding scholarships for study abroad).
Tanzania Education Sector Analysis142
Share of Student Loan Beneficiaries (%)
In Government Institutions
In Nongovernmental Institutions
Amount of the Loan (Millions of T Sh)
Students in Government Institutions
Students in Nongovernmental Institutions
Overseas Scholarships
Share of the Loan Transferred Directly to Students
Students in Government Institutions
Students in Nongovernmental Institutions
Memo Items
Number of Loan Beneficiaries
In Government Institutions
In Nongovernmental Institutions
Overseas Scholarships
Technical NonhigherHigher Education Total
Table 3.11: Social Expenditures, by Level and Type of Institution, FY 2008/09
47.9%
43.0%
65.4%
2.18
1.96
2.69
6.23
70.0%
74.2%
62.7%
56,798
39,858
16,940
1,034
1.3%
0.6%
3.9%
2.37
2.25
2.43
-
69.9%
76.1%
67.0%
398
133
265
0
38.5%
34.6%
52.6%
2.18
1.96
2.69
6.23
70.0%
74.2%
62.8%
57,196
39,991
17,205
1,034
Percent, and Millions of T Sh
Source: Authors’ calculations based on HESLB, NACTE and TCU adjusted data.
CH
AP
TER
3ED
UC
ATIO
N C
OS
T A
ND
FIN
AN
CIN
G
Social expenditures effectively depend on three main factors: (i) the share of students thatbenefit from loans; (ii) the average amount of the student loan; and (iii) the share of thatamount that is transferred directly to students for their social expenses. In 2008/09, 57,196students on the mainland benefited from an HESLB loan, representing 39 percent of allstudents in public and private mainland postsecondary institutions (See Table 3.11 above).The average loan value was T Sh 2.18 billions (or US$ 1,729), approximately 70 percent ofwhich was transferred directly to students’ individual bank accounts. Although the value ofthe loan appears to be in line with the Tanzanian cost of living, the share of studentsreceiving a loan (almost 48 percent of higher education students) appears to be excessive:less than 10 percent of postsecondary students’ families are from the poorest quintiles (SeeChapter 5 on equity). This is clearly inequitable, and calls for an improvement in the loantargeting mechanisms.
Vocational Training Public Expenditure
This section focuses on public spending for folk education and other VET activitiesmanaged by VETA. Although folk education is directly funded by the government (througha specific MCDGC budget allocation), VET activities under VETA are funded differently:in addition to subsidies received directly from the government, VETA benefits from indirectsubsidies through the Skills Development Levy, and generates income from its operations(training, boarding, evening course fees and production activities). However beforeanalyzing this funding arrangement in greater detail, it is first necessary to review thestructure of vocational training recurrent expenditures, to better understand the issuesaffecting unit costs.
Administrative Costs
A quarter of folk education recurrent expenditure is retained at the ministerial level to coveroverheads (the remaining 75 percent is allocated directly to Folk Development Colleges).This share is comparatively higher than for other education subsectors: for basic education,central administrative costs represent approximately 10 percent of total public recurrentexpenditure, and for higher and technical education, they are just seven percent. Thissuggests that there is scope to reduce administrative overheads, in benefit of the share ofresources channeled directly to FDCs, especially for underfunded pedagogical items(teaching, training and learning materials).
Tanzania Education Sector Analysis 143
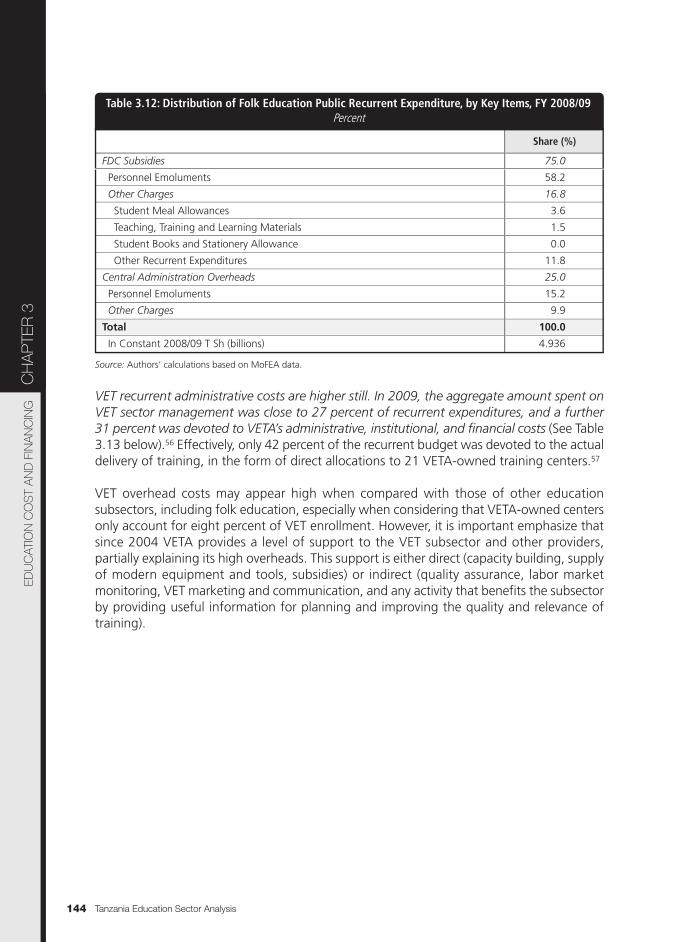
VET recurrent administrative costs are higher still. In 2009, the aggregate amount spent onVET sector management was close to 27 percent of recurrent expenditures, and a further31 percent was devoted to VETA’s administrative, institutional, and financial costs (See Table3.13 below).56 Effectively, only 42 percent of the recurrent budget was devoted to the actualdelivery of training, in the form of direct allocations to 21 VETA-owned training centers.57
VET overhead costs may appear high when compared with those of other educationsubsectors, including folk education, especially when considering that VETA-owned centersonly account for eight percent of VET enrollment. However, it is important emphasize thatsince 2004 VETA provides a level of support to the VET subsector and other providers,partially explaining its high overheads. This support is either direct (capacity building, supplyof modern equipment and tools, subsidies) or indirect (quality assurance, labor marketmonitoring, VET marketing and communication, and any activity that benefits the subsectorby providing useful information for planning and improving the quality and relevance oftraining).
Tanzania Education Sector Analysis144
FDC Subsidies
Personnel Emoluments
Other Charges
Student Meal Allowances
Teaching, Training and Learning Materials
Student Books and Stationery Allowance
Other Recurrent Expenditures
Central Administration Overheads
Personnel Emoluments
Other Charges
Total
In Constant 2008/09 T Sh (billions)
Share (%)
Table 3.12: Distribution of Folk Education Public Recurrent Expenditure, by Key Items, FY 2008/09
75.0
58.2
16.8
3.6
1.5
0.0
11.8
25.0
15.2
9.9
100.0
4.936
Percent
Source: Authors’ calculations based on MoFEA data.
CH
AP
TER
3ED
UC
ATIO
N C
OS
T A
ND
FIN
AN
CIN
G
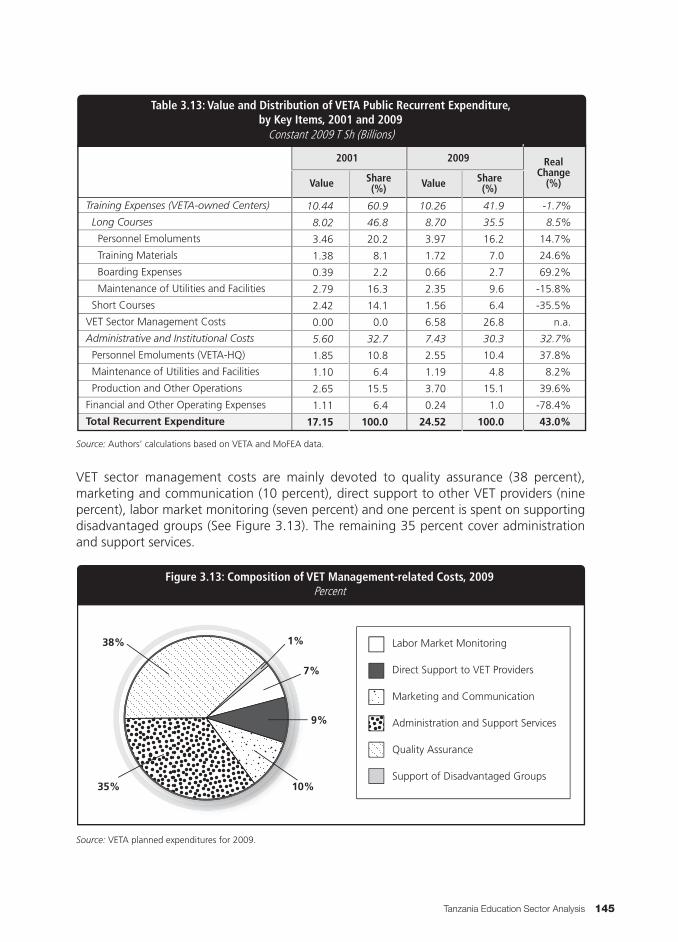
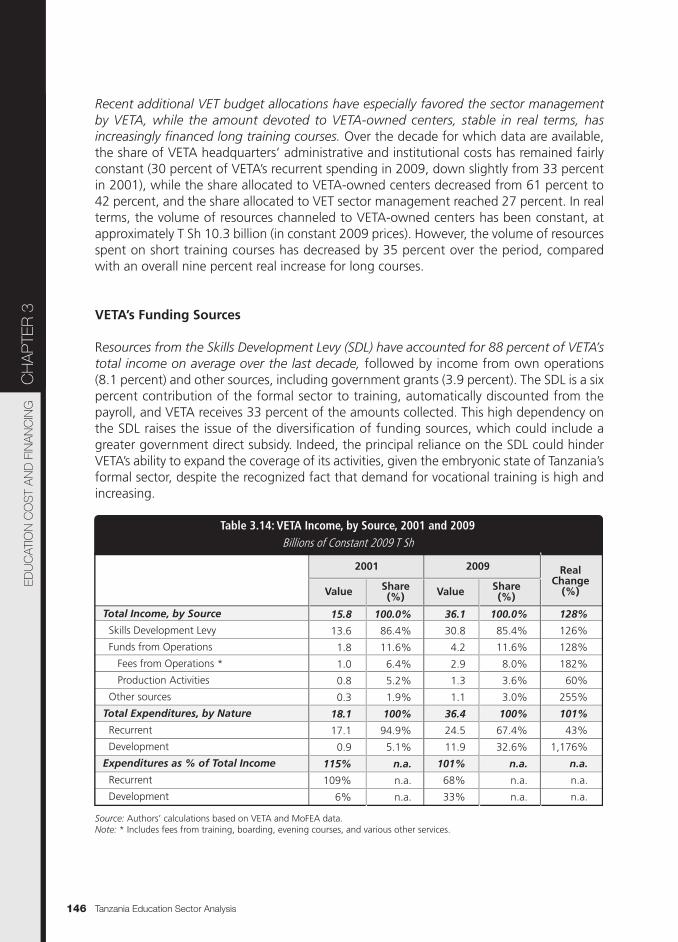
VET sector management costs are mainly devoted to quality assurance (38 percent),marketing and communication (10 percent), direct support to other VET providers (ninepercent), labor market monitoring (seven percent) and one percent is spent on supportingdisadvantaged groups (See Figure 3.13). The remaining 35 percent cover administrationand support services.
Tanzania Education Sector Analysis 145
Training Expenses (VETA-owned Centers)
Long Courses
Personnel Emoluments
Training Materials
Boarding Expenses
Maintenance of Utilities and Facilities
Short Courses
VET Sector Management Costs
Administrative and Institutional Costs
Personnel Emoluments (VETA-HQ)
Maintenance of Utilities and Facilities
Production and Other Operations
Financial and Other Operating Expenses
Total Recurrent Expenditure
Value
20092001 RealChange
(%)
Table 3.13: Value and Distribution of VETA Public Recurrent Expenditure,by Key Items, 2001 and 2009
10.44
8.02
3.46
1.38
0.39
2.79
2.42
0.00
5.60
1.85
1.10
2.65
1.11
17.15
60.9
46.8
20.2
8.1
2.2
16.3
14.1
0.0
32.7
10.8
6.4
15.5
6.4
100.0
10.26
8.70
3.97
1.72
0.66
2.35
1.56
6.58
7.43
2.55
1.19
3.70
0.24
24.52
41.9
35.5
16.2
7.0
2.7
9.6
6.4
26.8
30.3
10.4
4.8
15.1
1.0
100.0
-1.7%
8.5%
14.7%
24.6%
69.2%
-15.8%
-35.5%
n.a.
32.7%
37.8%
8.2%
39.6%
-78.4%
43.0%
Share(%)
Share(%)Value
Constant 2009 T Sh (Billions)
Source: Authors’ calculations based on VETA and MoFEA data.
Labor Market Monitoring
Direct Support to VET Providers
Marketing and Communication
Administration and Support Services
Quality Assurance
Support of Disadvantaged Groups
Figure 3.13: Composition of VET Management-related Costs, 2009Percent
38% 1%
7%
9%
10%35%
Source: VETA planned expenditures for 2009.
Recent additional VET budget allocations have especially favored the sector managementby VETA, while the amount devoted to VETA-owned centers, stable in real terms, hasincreasingly financed long training courses. Over the decade for which data are available,the share of VETA headquarters’ administrative and institutional costs has remained fairlyconstant (30 percent of VETA’s recurrent spending in 2009, down slightly from 33 percentin 2001), while the share allocated to VETA-owned centers decreased from 61 percent to42 percent, and the share allocated to VET sector management reached 27 percent. In realterms, the volume of resources channeled to VETA-owned centers has been constant, atapproximately T Sh 10.3 billion (in constant 2009 prices). However, the volume of resourcesspent on short training courses has decreased by 35 percent over the period, comparedwith an overall nine percent real increase for long courses.
VETA’s Funding Sources
Resources from the Skills Development Levy (SDL) have accounted for 88 percent of VETA’stotal income on average over the last decade, followed by income from own operations(8.1 percent) and other sources, including government grants (3.9 percent). The SDL is a sixpercent contribution of the formal sector to training, automatically discounted from thepayroll, and VETA receives 33 percent of the amounts collected. This high dependency onthe SDL raises the issue of the diversification of funding sources, which could include agreater government direct subsidy. Indeed, the principal reliance on the SDL could hinderVETA’s ability to expand the coverage of its activities, given the embryonic state of Tanzania’sformal sector, despite the recognized fact that demand for vocational training is high andincreasing.
Tanzania Education Sector Analysis146
Total Income, by Source
Skills Development Levy
Funds from Operations
Fees from Operations *
Production Activities
Other sources
Total Expenditures, by Nature
Recurrent
Development
Expenditures as % of Total Income
Recurrent
Development
Value
20092001 RealChange
(%)
Table 3.14: VETA Income, by Source, 2001 and 2009
15.8
13.6
1.8
1.0
0.8
0.3
18.1
17.1
0.9
115%
109%
6%
100.0%
86.4%
11.6%
6.4%
5.2%
1.9%
100%
94.9%
5.1%
n.a.
n.a.
n.a.
36.1
30.8
4.2
2.9
1.3
1.1
36.4
24.5
11.9
101%
68%
33%
100.0%
85.4%
11.6%
8.0%
3.6%
3.0%
100%
67.4%
32.6%
n.a.
n.a.
n.a.
128%
126%
128%
182%
60%
255%
101%
43%
1,176%
n.a.
n.a.
n.a.
Share(%)
Share(%)Value
Billions of Constant 2009 T Sh
Source: Authors’ calculations based on VETA and MoFEA data.Note: * Includes fees from training, boarding, evening courses, and various other services.
CH
AP
TER
3ED
UC
ATIO
N C
OS
T A
ND
FIN
AN
CIN
G
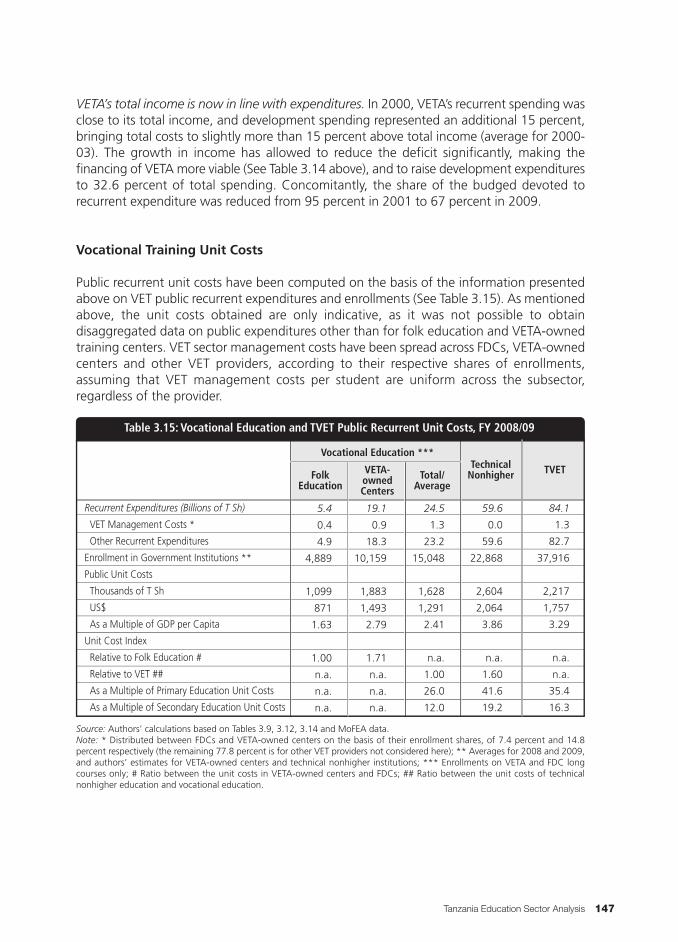
VETA’s total income is now in line with expenditures. In 2000, VETA’s recurrent spending wasclose to its total income, and development spending represented an additional 15 percent,bringing total costs to slightly more than 15 percent above total income (average for 2000-03). The growth in income has allowed to reduce the deficit significantly, making thefinancing of VETA more viable (See Table 3.14 above), and to raise development expendituresto 32.6 percent of total spending. Concomitantly, the share of the budged devoted torecurrent expenditure was reduced from 95 percent in 2001 to 67 percent in 2009.
Vocational Training Unit Costs
Public recurrent unit costs have been computed on the basis of the information presentedabove on VET public recurrent expenditures and enrollments (See Table 3.15). As mentionedabove, the unit costs obtained are only indicative, as it was not possible to obtaindisaggregated data on public expenditures other than for folk education and VETA-ownedtraining centers. VET sector management costs have been spread across FDCs, VETA-ownedcenters and other VET providers, according to their respective shares of enrollments,assuming that VET management costs per student are uniform across the subsector,regardless of the provider.
Tanzania Education Sector Analysis 147
Recurrent Expenditures (Billions of T Sh)
VET Management Costs *
Other Recurrent Expenditures
Enrollment in Government Institutions **
Public Unit Costs
Thousands of T Sh
US$
As a Multiple of GDP per Capita
Unit Cost Index
Relative to Folk Education #
Relative to VET ##
As a Multiple of Primary Education Unit Costs
As a Multiple of Secondary Education Unit Costs
FolkEducation
Vocational Education ***
TVET
Table 3.15: Vocational Education and TVET Public Recurrent Unit Costs, FY 2008/09
5.4
0.4
4.9
4,889
1,099
871
1.63
1.00
n.a.
n.a.
n.a.
19.1
0.9
18.3
10,159
1,883
1,493
2.79
1.71
n.a.
n.a.
n.a.
24.5
1.3
23.2
15,048
1,628
1,291
2.41
n.a.
1.00
26.0
12.0
59.6
0.0
59.6
22,868
2,604
2,064
3.86
n.a.
1.60
41.6
19.2
84.1
1.3
82.7
37,916
2,217
1,757
3.29
n.a.
n.a.
35.4
16.3
VETA-ownedCenters
TechnicalNonhigherTotal/
Average
Source: Authors’ calculations based on Tables 3.9, 3.12, 3.14 and MoFEA data.Note: * Distributed between FDCs and VETA-owned centers on the basis of their enrollment shares, of 7.4 percent and 14.8percent respectively (the remaining 77.8 percent is for other VET providers not considered here); ** Averages for 2008 and 2009,and authors’ estimates for VETA-owned centers and technical nonhigher institutions; *** Enrollments on VETA and FDC longcourses only; # Ratio between the unit costs in VETA-owned centers and FDCs; ## Ratio between the unit costs of technicalnonhigher education and vocational education.
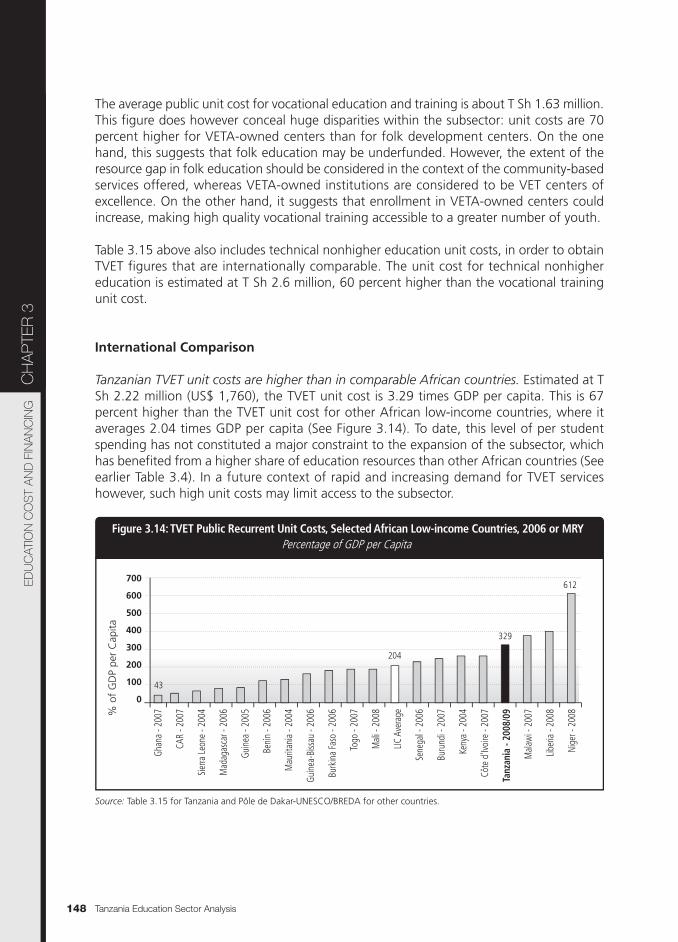
The average public unit cost for vocational education and training is about T Sh 1.63 million.This figure does however conceal huge disparities within the subsector: unit costs are 70percent higher for VETA-owned centers than for folk development centers. On the onehand, this suggests that folk education may be underfunded. However, the extent of theresource gap in folk education should be considered in the context of the community-basedservices offered, whereas VETA-owned institutions are considered to be VET centers ofexcellence. On the other hand, it suggests that enrollment in VETA-owned centers couldincrease, making high quality vocational training accessible to a greater number of youth.
Table 3.15 above also includes technical nonhigher education unit costs, in order to obtainTVET figures that are internationally comparable. The unit cost for technical nonhighereducation is estimated at T Sh 2.6 million, 60 percent higher than the vocational trainingunit cost.
International Comparison
Tanzanian TVET unit costs are higher than in comparable African countries. Estimated at TSh 2.22 million (US$ 1,760), the TVET unit cost is 3.29 times GDP per capita. This is 67percent higher than the TVET unit cost for other African low-income countries, where itaverages 2.04 times GDP per capita (See Figure 3.14). To date, this level of per studentspending has not constituted a major constraint to the expansion of the subsector, whichhas benefited from a higher share of education resources than other African countries (Seeearlier Table 3.4). In a future context of rapid and increasing demand for TVET serviceshowever, such high unit costs may limit access to the subsector.
Tanzania Education Sector Analysis148
Figure 3.14: TVET Public Recurrent Unit Costs, Selected African Low-income Countries, 2006 or MRY
700
600
500
400
300
200
100
0
Ghan
a - 2
007
CAR
- 200
7
Sierra
Leon
e - 2
004
Mad
agas
car -
200
6
Guin
ea -
2005
Beni
n - 2
006
Mau
ritan
ia -
2004
Guin
ea-B
issau
- 20
06
Burk
ina
Faso
- 20
06
Togo
- 20
07
Mal
i - 2
008
LIC A
vera
ge
Sene
gal -
200
6
Buru
ndi -
200
7
Keny
a - 2
004
Côte
d'Iv
oire
- 20
07
Tanz
ania
- 20
08/0
9
Mal
awi -
200
7
Liber
ia -
2008
Nige
r - 2
008%
of
GD
P pe
r C
apita
Percentage of GDP per Capita
204
43
329
612
Source: Table 3.15 for Tanzania and Pôle de Dakar-UNESCO/BREDA for other countries.
CH
AP
TER
3ED
UC
ATIO
N C
OS
T A
ND
FIN
AN
CIN
G
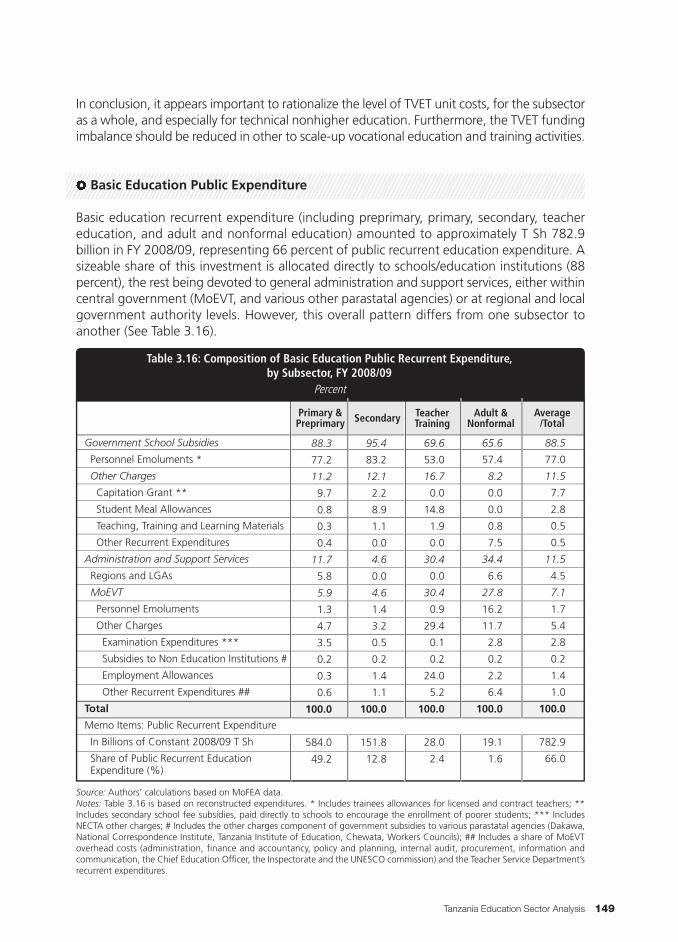
In conclusion, it appears important to rationalize the level of TVET unit costs, for the subsectoras a whole, and especially for technical nonhigher education. Furthermore, the TVET fundingimbalance should be reduced in other to scale-up vocational education and training activities.
Basic Education Public Expenditure
Basic education recurrent expenditure (including preprimary, primary, secondary, teachereducation, and adult and nonformal education) amounted to approximately T Sh 782.9billion in FY 2008/09, representing 66 percent of public recurrent education expenditure. Asizeable share of this investment is allocated directly to schools/education institutions (88percent), the rest being devoted to general administration and support services, either withincentral government (MoEVT, and various other parastatal agencies) or at regional and localgovernment authority levels. However, this overall pattern differs from one subsector toanother (See Table 3.16).
Tanzania Education Sector Analysis 149
Government School Subsidies
Personnel Emoluments *
Other Charges
Capitation Grant **
Student Meal Allowances
Teaching, Training and Learning Materials
Other Recurrent Expenditures
Administration and Support Services
Regions and LGAs
MoEVT
Personnel Emoluments
Other Charges
Examination Expenditures ***
Subsidies to Non Education Institutions #
Employment Allowances
Other Recurrent Expenditures ##
Total
Memo Items: Public Recurrent Expenditure
In Billions of Constant 2008/09 T Sh
Share of Public Recurrent Education Expenditure (%)
Primary &Preprimary
Average/Total
Table 3.16: Composition of Basic Education Public Recurrent Expenditure,by Subsector, FY 2008/09
88.3
77.2
11.2
9.7
0.8
0.3
0.4
11.7
5.8
5.9
1.3
4.7
3.5
0.2
0.3
0.6
100.0
584.0
49.2
95.4
83.2
12.1
2.2
8.9
1.1
0.0
4.6
0.0
4.6
1.4
3.2
0.5
0.2
1.4
1.1
100.0
151.8
12.8
69.6
53.0
16.7
0.0
14.8
1.9
0.0
30.4
0.0
30.4
0.9
29.4
0.1
0.2
24.0
5.2
100.0
28.0
2.4
65.6
57.4
8.2
0.0
0.0
0.8
7.5
34.4
6.6
27.8
16.2
11.7
2.8
0.2
2.2
6.4
100.0
19.1
1.6
88.5
77.0
11.5
7.7
2.8
0.5
0.5
11.5
4.5
7.1
1.7
5.4
2.8
0.2
1.4
1.0
100.0
782.9
66.0
Secondary Adult &Nonformal
TeacherTraining
Percent
Source: Authors’ calculations based on MoFEA data.Notes: Table 3.16 is based on reconstructed expenditures. * Includes trainees allowances for licensed and contract teachers; **Includes secondary school fee subsidies, paid directly to schools to encourage the enrollment of poorer students; *** IncludesNECTA other charges; # Includes the other charges component of government subsidies to various parastatal agencies (Dakawa,National Correspondence Institute, Tanzania Institute of Education, Chewata, Workers Councils); ## Includes a share of MoEVToverhead costs (administration, finance and accountancy, policy and planning, internal audit, procurement, information andcommunication, the Chief Education Officer, the Inspectorate and the UNESCO commission) and the Teacher Service Department’srecurrent expenditures.
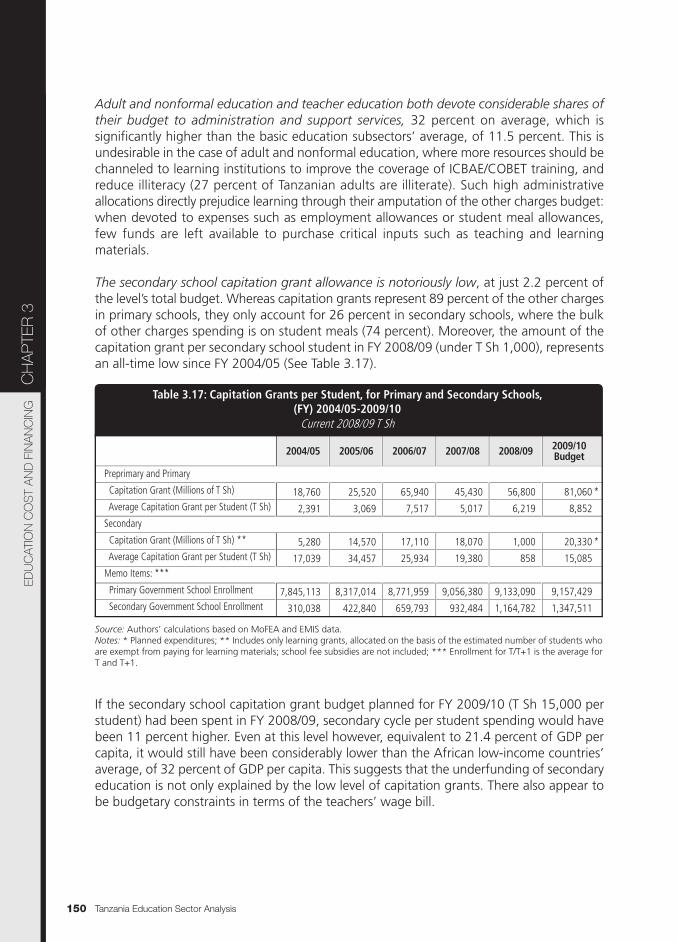
Adult and nonformal education and teacher education both devote considerable shares oftheir budget to administration and support services, 32 percent on average, which issignificantly higher than the basic education subsectors’ average, of 11.5 percent. This isundesirable in the case of adult and nonformal education, where more resources should bechanneled to learning institutions to improve the coverage of ICBAE/COBET training, andreduce illiteracy (27 percent of Tanzanian adults are illiterate). Such high administrativeallocations directly prejudice learning through their amputation of the other charges budget:when devoted to expenses such as employment allowances or student meal allowances,few funds are left available to purchase critical inputs such as teaching and learningmaterials.
The secondary school capitation grant allowance is notoriously low, at just 2.2 percent ofthe level’s total budget. Whereas capitation grants represent 89 percent of the other chargesin primary schools, they only account for 26 percent in secondary schools, where the bulkof other charges spending is on student meals (74 percent). Moreover, the amount of thecapitation grant per secondary school student in FY 2008/09 (under T Sh 1,000), representsan all-time low since FY 2004/05 (See Table 3.17).
If the secondary school capitation grant budget planned for FY 2009/10 (T Sh 15,000 perstudent) had been spent in FY 2008/09, secondary cycle per student spending would havebeen 11 percent higher. Even at this level however, equivalent to 21.4 percent of GDP percapita, it would still have been considerably lower than the African low-income countries’average, of 32 percent of GDP per capita. This suggests that the underfunding of secondaryeducation is not only explained by the low level of capitation grants. There also appear tobe budgetary constraints in terms of the teachers’ wage bill.
Tanzania Education Sector Analysis150
2004/05 2005/06 2006/07 2007/08 2008/09 2009/10Budget
Table 3.17: Capitation Grants per Student, for Primary and Secondary Schools,(FY) 2004/05-2009/10
Current 2008/09 T Sh
Preprimary and Primary
Capitation Grant (Millions of T Sh)
Average Capitation Grant per Student (T Sh)
Secondary
Capitation Grant (Millions of T Sh) **
Average Capitation Grant per Student (T Sh)
Memo Items: ***
Primary Government School Enrollment
Secondary Government School Enrollment
18,760
2,391
5,280
17,039
7,845,113
310,038
25,520
3,069
14,570
34,457
8,317,014
422,840
65,940
7,517
17,110
25,934
8,771,959
659,793
45,430
5,017
18,070
19,380
9,056,380
932,484
56,800
6,219
1,000
858
9,133,090
1,164,782
81,060
8,852
20,330
15,085
9,157,429
1,347,511
*
*
Source: Authors’ calculations based on MoFEA and EMIS data.Notes: * Planned expenditures; ** Includes only learning grants, allocated on the basis of the estimated number of students whoare exempt from paying for learning materials; school fee subsidies are not included; *** Enrollment for T/T+1 is the average forT and T+1.
CH
AP
TER
3ED
UC
ATIO
N C
OS
T A
ND
FIN
AN
CIN
G
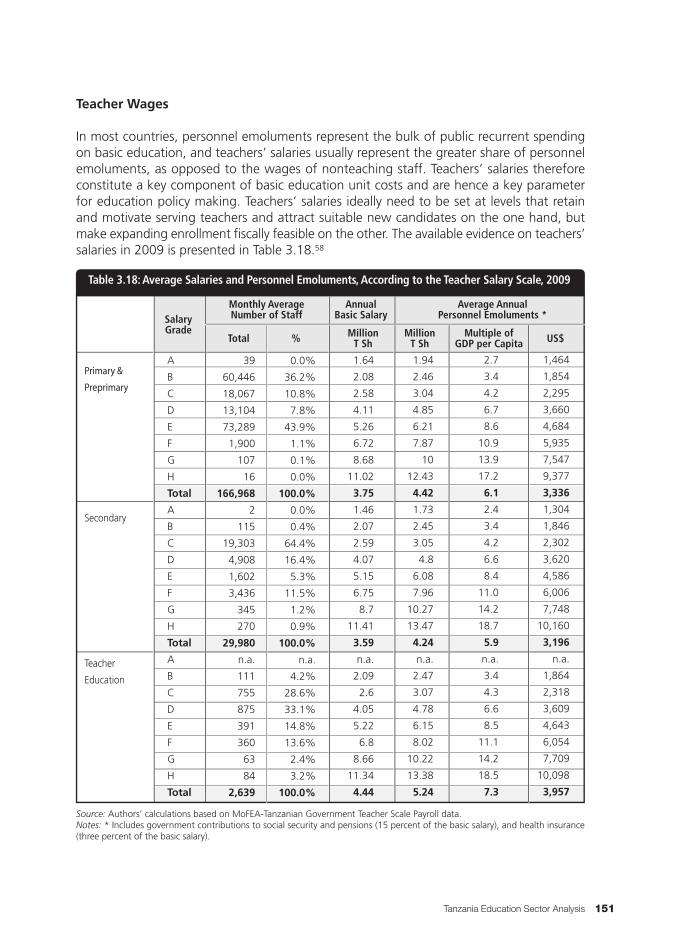
Teacher Wages
In most countries, personnel emoluments represent the bulk of public recurrent spendingon basic education, and teachers’ salaries usually represent the greater share of personnelemoluments, as opposed to the wages of nonteaching staff. Teachers’ salaries thereforeconstitute a key component of basic education unit costs and are hence a key parameterfor education policy making. Teachers’ salaries ideally need to be set at levels that retainand motivate serving teachers and attract suitable new candidates on the one hand, butmake expanding enrollment fiscally feasible on the other. The available evidence on teachers’salaries in 2009 is presented in Table 3.18.58
Tanzania Education Sector Analysis 151
Primary &
Preprimary
Secondary
Teacher
Education
Total %
SalaryGrade
Monthly AverageNumber of Staff
AnnualBasic Salary
Table 3.18: Average Salaries and Personnel Emoluments, According to the Teacher Salary Scale, 2009
0.0%
36.2%
10.8%
7.8%
43.9%
1.1%
0.1%
0.0%
100.0%
0.0%
0.4%
64.4%
16.4%
5.3%
11.5%
1.2%
0.9%
100.0%
n.a.
4.2%
28.6%
33.1%
14.8%
13.6%
2.4%
3.2%
100.0%
39
60,446
18,067
13,104
73,289
1,900
107
16
166,968
2
115
19,303
4,908
1,602
3,436
345
270
29,980
n.a.
111
755
875
391
360
63
84
2,639
A
B
C
D
E
F
G
H
Total
A
B
C
D
E
F
G
H
Total
A
B
C
D
E
F
G
H
Total
1.64
2.08
2.58
4.11
5.26
6.72
8.68
11.02
3.75
1.46
2.07
2.59
4.07
5.15
6.75
8.7
11.41
3.59
n.a.
2.09
2.6
4.05
5.22
6.8
8.66
11.34
4.44
1.94
2.46
3.04
4.85
6.21
7.87
10
12.43
4.42
1.73
2.45
3.05
4.8
6.08
7.96
10.27
13.47
4.24
n.a.
2.47
3.07
4.78
6.15
8.02
10.22
13.38
5.24
2.7
3.4
4.2
6.7
8.6
10.9
13.9
17.2
6.1
2.4
3.4
4.2
6.6
8.4
11.0
14.2
18.7
5.9
n.a.
3.4
4.3
6.6
8.5
11.1
14.2
18.5
7.3
1,464
1,854
2,295
3,660
4,684
5,935
7,547
9,377
3,336
1,304
1,846
2,302
3,620
4,586
6,006
7,748
10,160
3,196
n.a.
1,864
2,318
3,609
4,643
6,054
7,709
10,098
3,957
Average AnnualPersonnel Emoluments *
MillionT Sh
Multiple ofGDP per Capita US$Million
T Sh
Source: Authors’ calculations based on MoFEA-Tanzanian Government Teacher Scale Payroll data.Notes: * Includes government contributions to social security and pensions (15 percent of the basic salary), and health insurance(three percent of the basic salary).
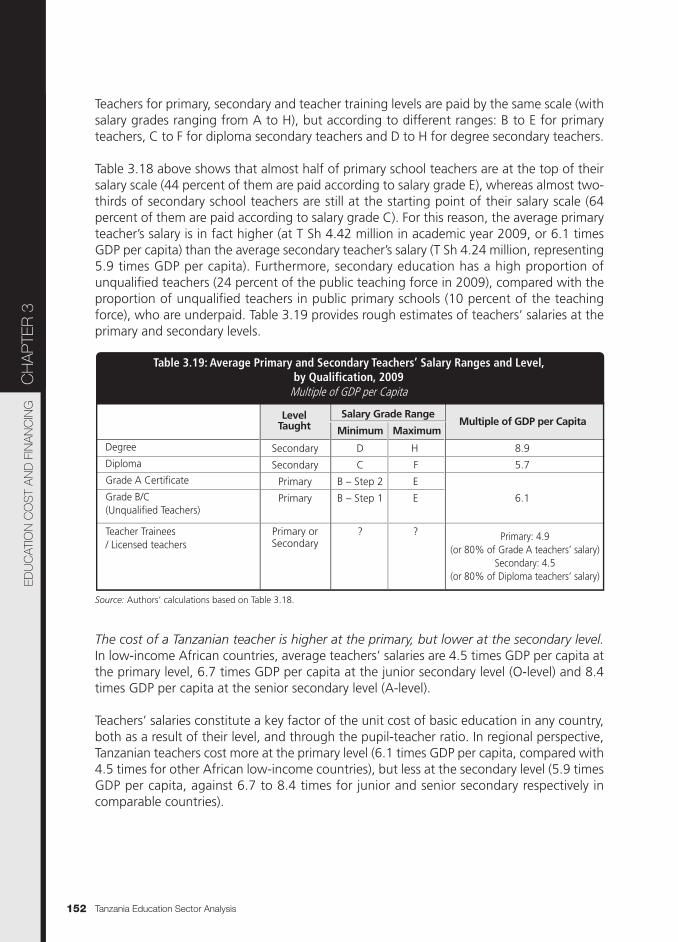
Teachers for primary, secondary and teacher training levels are paid by the same scale (withsalary grades ranging from A to H), but according to different ranges: B to E for primaryteachers, C to F for diploma secondary teachers and D to H for degree secondary teachers.
Table 3.18 above shows that almost half of primary school teachers are at the top of theirsalary scale (44 percent of them are paid according to salary grade E), whereas almost two-thirds of secondary school teachers are still at the starting point of their salary scale (64percent of them are paid according to salary grade C). For this reason, the average primaryteacher’s salary is in fact higher (at T Sh 4.42 million in academic year 2009, or 6.1 timesGDP per capita) than the average secondary teacher’s salary (T Sh 4.24 million, representing5.9 times GDP per capita). Furthermore, secondary education has a high proportion ofunqualified teachers (24 percent of the public teaching force in 2009), compared with theproportion of unqualified teachers in public primary schools (10 percent of the teachingforce), who are underpaid. Table 3.19 provides rough estimates of teachers’ salaries at theprimary and secondary levels.
Tanzania Education Sector Analysis152
The cost of a Tanzanian teacher is higher at the primary, but lower at the secondary level.In low-income African countries, average teachers’ salaries are 4.5 times GDP per capita atthe primary level, 6.7 times GDP per capita at the junior secondary level (O-level) and 8.4times GDP per capita at the senior secondary level (A-level).
Teachers’ salaries constitute a key factor of the unit cost of basic education in any country,both as a result of their level, and through the pupil-teacher ratio. In regional perspective,Tanzanian teachers cost more at the primary level (6.1 times GDP per capita, compared with4.5 times for other African low-income countries), but less at the secondary level (5.9 timesGDP per capita, against 6.7 to 8.4 times for junior and senior secondary respectively incomparable countries).
LevelTaught
Salary Grade Range
Minimum MaximumMultiple of GDP per Capita
Table 3.19: Average Primary and Secondary Teachers’ Salary Ranges and Level,by Qualification, 2009
Multiple of GDP per Capita
Degree
Diploma
Grade A Certificate
Grade B/C (Unqualified Teachers)
Teacher Trainees / Licensed teachers
Secondary
Secondary
Primary
Primary
Primary orSecondary
D
C
B – Step 2
B – Step 1
?
H
F
E
E
?
8.9
5.7
6.1
Primary: 4.9(or 80% of Grade A teachers’ salary)
Secondary: 4.5(or 80% of Diploma teachers’ salary)
Source: Authors’ calculations based on Table 3.18.
CH
AP
TER
3ED
UC
ATIO
N C
OS
T A
ND
FIN
AN
CIN
G
This situation makes the primary teaching profession comparatively more financiallyattractive in Tanzania, from a subregional perspective: indeed, a Tanzanian primary schoolteacher earns about US$ 6,560 per year (in 2005 Purchasing Power Parity –PPP– US$),against an average of US$ 4,320 for other African LICs and the East African Community.59
It therefore should be straightforward to attract those teachers to the profession that arenecessary to improve the pupil-teacher ratios (PTR); but the average PTR in governmentprimary schools was 55:1 in 2009, above the regional average of 50:1, and substantiallyhigher than both the FTI benchmark of 40:1, and the ESDP II benchmark of 45:1,jeopardizing the quality of education. It appears that among other factors, resourceconstraints have prevented the government from recruiting the required number of teachers.
Tanzania is however now close to achieving universal primary education, and as thedemographic pressure on the education system is set to quell (See Chapter 1), the intensityof teacher requirements will also drop. In this context, reducing the primary PTR should bemore feasible, improving learning conditions, and ultimately, the quality of service.
The situation of secondary school teachers is quite the opposite. Their low compensation inTanzania is partly due to the high proportion of unqualified (and underpaid) teachers at thislevel. Despite the lower public teacher cost, the PTR (of 50:1 in government secondaryschools in 2009) is much higher than in other LICs (with average PTRs of 30:1). To deal withthe general shortage of secondary teachers (especially qualified ones) MoEVT has developeda multipronged Teacher Development and Management Strategy (TDMS, 2008).60 Thestrategy, which has not yet been fully implemented, focuses mainly on supply side issues.The attractiveness of the secondary teaching profession should also be assessed, to elaboratestrategies to better retain candidates, inspired by labor market surveys and cross-countrycomparisons.
Tanzania Education Sector Analysis 153
KEY FINDINGS
The increase in public education expenditure has been followed by significant changes insubsector allocations.
The share of primary education has decreased since FY 2000/01, while the country wasmoving toward universal primary education. The current share of primary (44.2 percent ofpublic education expenditure) is similar to that of countries equally close to achievinguniversal primary education. The choice of comparable modes of preprimary and primaryservice delivery has been helpful in lowering unit costs and increasing preprimary enrollment.
Secondary education is underfunded. Tanzania is spending far less on secondary education(13.5 percent of public education resources) than countries who are equally close toachieving universal primary education, and where there are also convincing arguments toexpand secondary education.
Higher education has benefited from the government’s underspending on secondaryeducation. With 26.9 percent of public education resources, Tanzania’s higher educationsubsector is one of the best financed among African countries (after Lesotho, Botswana,Swaziland and Malawi). Unfortunately, this has led to the halving of secondary educationunit costs since FY 2000/01.
Whereas the Tanzanian secondary unit cost is only two-thirds of the African low-incomecountries’ average, the higher education unit cost (the average for university and highertechnical education) is 20 percent higher than in other LICs. The government’s strategy toexpand secondary education is not matched by current budget trade-offs within the sector,and options to increase secondary education’s funding must be explored.
Receiving seven percent of public education resources, the Tanzanian TVET system is not asunderfunded as in many other African countries. However, technical nonhigher educationabsorbs almost 57 percent of all TVET resources, against just 37 percent for vocationaltraining, and six percent for folk education. This funding imbalance should be reduced inorder to scale-up vocational education and training activities.
Potential efficiency gains and cost-saving options are available.
Basic education focuses too little on spending that directly improves the quality of servicedelivered. In secondary education, capitation grant spending is 40 percent lower than thenorm, and student meals absorb four times as much of the budget. Teacher training collegesalso overspend on student meals, to the tune of 90 percent of nonsalary expenditures.Preprimary and primary pupil-teacher ratios are excessively high, partly because the highsalaries constitute a constraint to further recruitment. Secondary PTRs are also well aboveregional averages, due to a quantitative and qualitative shortage of teachers.
Tanzania Education Sector Analysis154
CH
AP
TER
3ED
UC
ATIO
N C
OS
T A
ND
FIN
AN
CIN
G
A number of policy reorientations constitute feasible responses to these issues. For instance,although it may not be possible to reallocate funds from higher education to secondary,the government can search for efficiency gains and/or potential cost-saving measures withinhigher education; the identification of potential efficiency gains for technical nonhighereducation and of cost-effective policies for vocational training may enable the bettercoverage of economic and social demands in terms of technical and vocational educationand training, while maintaining reasonable quality standards; in secondary schools, thegovernment could examine the feasibility of reallocating a part of meal subsidies topedagogical expenses, and recover the cost of meals, where possible.
An efficient TVET system can be created through revising subsector budget trade-offs.
The average public unit cost for technical nonhigher education is 60 percent higher thanfor vocational education and training. This figure does however conceal huge disparitieswithin the subsector: unit costs are 70 percent higher in VETA-owned centers than in folkdevelopment centers. On the one hand, this suggests that folk education may beunderfunded. However, the extent of the resource gap in folk education should beconsidered in the context of the community-based services offered, whereas VETA-ownedinstitutions are considered to be VET centers of excellence. On the other, it suggests thatenrollment in VETA-owned centers could increase, making high quality vocational trainingaccessible to a greater number of youth. There should also be the possibility for FDCs tobenefit from further VETA resources: FDCs are already VETA Trade Test Examination Centers,and FDC long course participants can sit this examination.
Within VETA-owned centers, there is an increased focus on long courses. The volume ofresources spent on short training courses has decreased by 35 percent since 2001, comparedwith an overall real increase of nine percent for long training courses. It may be necessaryto increase the budget priority given to short courses, to better respond to the trainingneeds of the huge unskilled labor force working in the informal sector. In order to betterrespond to these needs, additional and more sustainable resources will be required.Currently, about 90 percent of VETA resources comes from the Skills Development Levy,based on the payroll of the embryonic formal sector, which constitutes a threat to VETA’sability to broaden the coverage of its activities. Its high dependency on the levy raises theissue of the diversification of funding, and the need for a constant and increased directgovernment subsidy.
At higher and technical education levels, it is necessary to improve the link between fundingallocations and students’ and market needs.
Higher education is blatantly inefficient, paying little attention to potential economies ofscale. Indeed, universities with only 2,000 students (the minimum size in 2008/09) benefittedfrom fixed other charges allocations of T Sh 1.64 billion (US$ 1.3 million). Furthermore,
Tanzania Education Sector Analysis 155
approximately 28 percent of the level’s budget (not including expenditures for overseasstudents) are badly targeted social expenditures (loans directly transferred to students): 48percent of students benefit from a loan, yet less than 10 percent come from the poorestquintiles, which calls for an improvement in the loan targeting mechanisms.
Other charges expenditure allocations to technical institutions vary considerably. Forinstance, planning and welfare courses are two to three times more expensive than healthand allied science or agriculture courses, which involve more costly inputs. Even amonginstitutions with the same subject specialization and similar enrollment, sizeable differencesin other charges allocations exist. This situation merits an improved funding formula andfor more coordination in planning and budgeting among parent ministries.
Households also contribute significantly to education funding, although their burden islower than in other African low-income countries.
Household education spending is equivalent to 32.1 percent of public educationexpenditure. However, the overall financial effort of households is comparatively lower thanin other LICs, where household contributions are equivalent to 48 percent of governmentrecurrent education expenditure on average. Although the higher education cost-sharingpolicy has contributed to reduce the government’s financial burden, the management ofthe cost-recovery mechanisms of the HESLB should be strengthened to ensure its financialsustainability.
Tanzania Education Sector Analysis156
CH
AP
TER
3ED
UC
ATIO
N C
OS
T A
ND
FIN
AN
CIN
G
Tanzania Education Sector Analysis 157
47 Subsidies to public institutions are allocated in two components: personal emoluments and other charges. Furtherresources are received from the HESLB. Total nonsalary costs are effectively the sum of other charges and transfersfrom the HESLB.
48 In Tanzania, each autonomous entity benefiting from a government subsidy has a “specific vote” in the budget.The computations in this chapter consider education expenditures channeled through MoEVT, regions, LGAs andvarious other ministries and agencies, including: VETA, the Treasury (vote 21), Home Affairs (votes 28 and 51), Justiceand Constitutional Affairs (vote 40), Agriculture, Food Security and Cooperatives (vote 43), Industry, Trade andMarketing (vote 44), Lands, Housing and Human Settlements’ Development (vote 48), Finance and Economic Affairs(vote 50), Health and Social Welfare (vote 52), Community Development, Gender and Children (vote 53), PrimeMinister's Office - Regional Administration and Local Government (vote 56), Energy and Minerals (vote 58),Communication, Science and Technology (vote 68), Natural Resources and Tourism (vote 69), President's Office -Civil Service Commission (vote 94), Information, Culture and Sports (vote 96), Infrastructure Development (vote 98)and Livestock and Fisheries Development (vote 99).
49 They include: the Kivukoni Academy of Social Science (MoEVT), the Institute of Adult Education (MoEVT), the Dares Salaam Institute of Technology (MCST), the Mbeya Institute of Science and Technology (MCST), the Institute ofAccountants - Arusha (MoFEA), the Institute of Financial Management (MoFEA), the Tanzania Institute ofAccountancy (MoFEA), the Tengeru Community Development Training Institute (MCGDC), the College of BusinessEducation (MITM), the Dar es Salaam Maritime Institute (MID), the National Institute of Transport (MID), the Instituteof Rural Development (PMO-RALG) and the Institute of Social Work - Dar es Salaam (MHSW).
50 After Lesotho (36 percent), Botswana (31.6 percent), Swaziland (28.3 percent) and Malawi (27.1 percent).
51 This is the figure reported in the MoEVT ministerial budget. However, it is lower than the figure shared by the HESLB(T Sh 135.1 billion; as shown in Table 3.7).
52 The countries considered here are mainly francophone: Benin, Burkina Faso, Burundi, Cameroon, Central AfricanRepublic, Chad, Congo (Rep.), Côte d’Ivoire, Guinea, Guinea-Bissau, Madagascar, Mali, Niger, Senegal and Togo.
53 Only the Ministry of Health and Social Welfare subsidies to nongovernmental health training institutes have beencaptured in this last category.
54 Other charges direct subsidies per student expenses are 2.3 times higher for technical higher institutions and 4.2times higher for technical non higher institutions, than for universities.
55 To capture potential imbalances in allocations to individual institutions would have required access to the parentministries’ specific accounts.
56 In 2008, there were 889 vocational training centres, including 53 folk development colleges and 836 VETA managedinstitutions, of which 21 were VETA-owned. In 2008, 7.4 percent of VET students were enrolled in FDCs; 14.8percent in VETA-owned centres and the remaining 77.8 percent in other VTCs (See Chapter 2).
57 This amount is mainly devoted to long courses (85 percent in 2009, up from 77 percent in 2001), the remainderfunding short technical courses.
58 Computations are based on yearly average payroll data for all staff under the Tanzania Government Teacher Scale.This differentiated teacher salary scale (for primary teachers, secondary teachers and teacher trainers) has been usedhere as a proxy for actual teachers’ salaries, as it was not possible to merge MoFEA and EMIS payroll data. In fact,the difference between the total number of preprimary and primary staff recorded in the MoFEA payroll (165,113for the January to June 2009 period) and in EMIS/BEST (166,844 for 2009) is almost insignificant. Although in thecase of public secondary school teachers (24,501 and 25,908 respectively) it is slightly more important, most of thegap is explained by the fact that about 3.5 percent of secondary teachers are not registered under the teacher scale.
59 Within the EAC, Tanzanian primary school teachers’ earnings are higher than in Burundi (PPP US$ 2,550), Rwanda(PPP US$ 2,180) and Uganda (PPP US$ 2,600), but lower than in Kenya (PPP US$ 7,600).
60 The strategy includes: (i) The improvement of TTC infrastructure to increase the enrollment of diploma–level students;(ii) The training of a greater number of qualified diploma and degree teachers to meet growing demands in bothgovernment and nongovernmental secondary schools; (iii) The introduction of teacher training programs ingovernment universities where they are not on offer; (iv) The motivation of nongovernmental universities to traindegree teachers to complement the government’s efforts; (v) The establishment of Constituent Colleges of Educationto train more degree teachers; and (vi) The recruitment of Form 6 and degree holders to teacher posts, offeringthem in-service training (See Chapter 7).
Notes
