chapter 3 service quality analysis -...
TRANSCRIPT
34
Chapter 3
Service Quality Analysis
3.1 Introduction
It is intended to identify service quality gaps as experienced by the subscribers of the
mobile services of state owned BSNL in the geographical area of Ernakulam district.
It also indicates the strengths and weakness of service based on the various
dimensions. The service quality gaps have been arrived by obtaining the difference
between expected and perceived service, as experienced by the users and by
examining the overall perceived service quality of mobile subscribers
3.2 Identification of Service Dimension and Preparation of Instruments
Hoffman and Bateson, (2001) suggests that among the tools of measuring service
quality of organization SERVQUAL developed by Parasuraman et al. (1988) seems
to be useful and widely adopted by researchers. The Instruments in SERVQUAL
analysis is modified for application in mobile communication service sector. The
instruments are under seven dimensions such as Tangibles, Reliability, Responsibility,
Assurance, Empathy, Network and Convenience. 28 modified instruments
(questionnaires) under the seven dimensions were prepared and used for survey. The
questions were presented in both English as well as Malayalam (local language) for
better understanding. A preliminary survey was conducted to ascertain the
acceptability of questionnaire and corrections were made accordingly. Since the
service sector varies in mode of service and significance of service, a weighted
average value of each dimensions were also collected in the preliminary survey.
35
Modifications of the number of instruments based on the field of application
especially the network aspect, and collection of data from a larger domain are the
uniqueness of this study. Further, this technique is not been used to assess the
telecommunication service sector in Indian cities so far.
Ernakulam is a thickly populated district of Kerala and has around half a million
subscribers for state owned BSNL mobile service. The recommended sample size for
such a survey is
)1( 2NeNSn
(3.1)
where N is the approximate population and e is the probability of error.
The BSNL mobile subscribers in Ernakulam are around 500000 in numbers and with
a probability of error 5% (confidence level 95%) the number of samples shall be 399.
The stratified sampling technique was used and 362 samples were collected, out of
which 336 were valid. That amounts to a probability of error 5.5% that is at 94.5%
confidence level
Table 3.1 Five point Likert scale
Strongly disagree
Disagree
Neither disagree nor agree
Agree
Strongly agree
1 2 3 4 5
3.3 Field Survey
The responses are marked with five point Likert scales as given in Table 3.1 for both
expectation and perception. Samples were collected under a stratified sampling
method by dividing the sampling area of Ernakulam district into five different strata,
namely Kalamassery, Aluva, Vypin, Thripunithura and Ernakulam city. The survey
was held personally after explaining the significance and specialties of questionnaires
to the respondents. The expectations of the customer are based on their level of
36
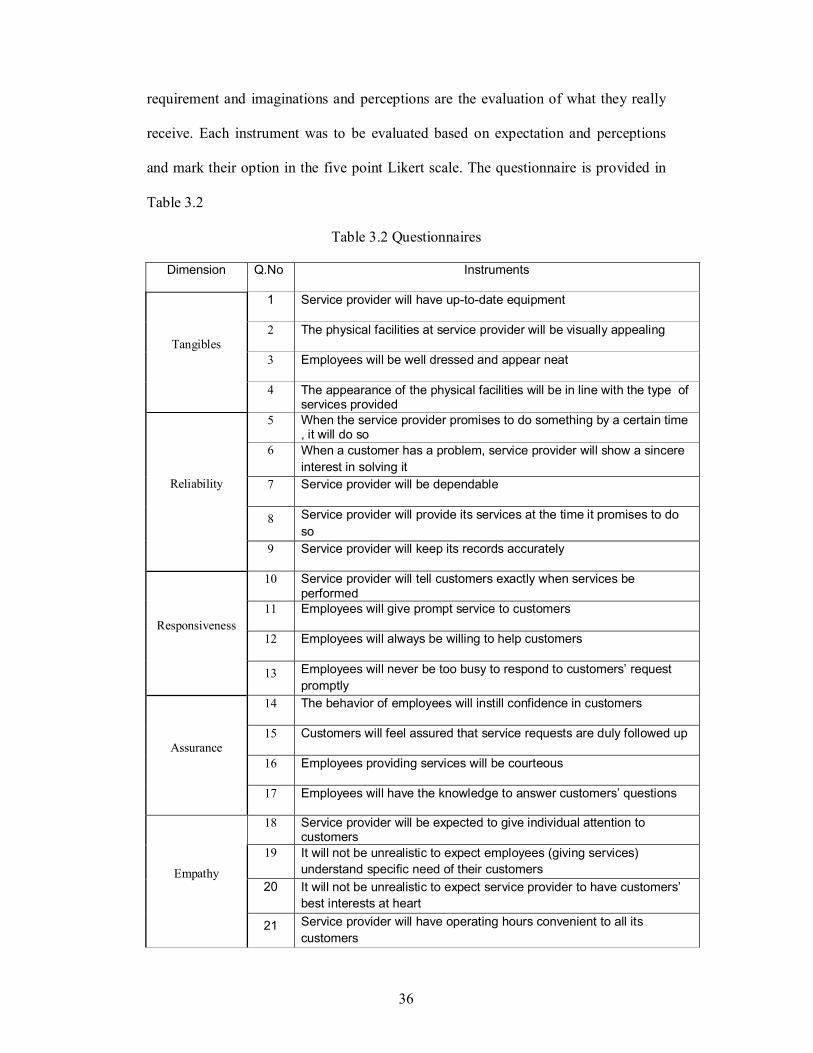
requirement and imaginations and perceptions are the evaluation of what they really
receive. Each instrument was to be evaluated based on expectation and perceptions
and mark their option in the five point Likert scale. The questionnaire is provided in
Table 3.2
Table 3.2 Questionnaires
Dimension Q.No Instruments
1 Service provider will have up-to-date equipment
2 The physical facilities at service provider will be visually appealing
3 Employees will be well dressed and appear neat Tangibles
4 The appearance of the physical facilities will be in line with the type of services provided
5 When the service provider promises to do something by a certain time , it will do so
6 When a customer has a problem, service provider will show a sincere
interest in solving it
7 Service provider will be dependable
8 Service provider will provide its services at the time it promises to do
so
Reliability
9 Service provider will keep its records accurately
10 Service provider will tell customers exactly when services be performed
11 Employees will give prompt service to customers
12 Employees will always be willing to help customers Responsiveness
13 Employees will never be too busy to respond to customers’ request
promptly
14 The behavior of employees will instill confidence in customers
15 Customers will feel assured that service requests are duly followed up
16 Employees providing services will be courteous Assurance
17 Employees will have the knowledge to answer customers’ questions
18 Service provider will be expected to give individual attention to customers
19 It will not be unrealistic to expect employees (giving services)
understand specific need of their customers
20 It will not be unrealistic to expect service provider to have customers’
best interests at heart
Empathy
21 Service provider will have operating hours convenient to all its
customers
37
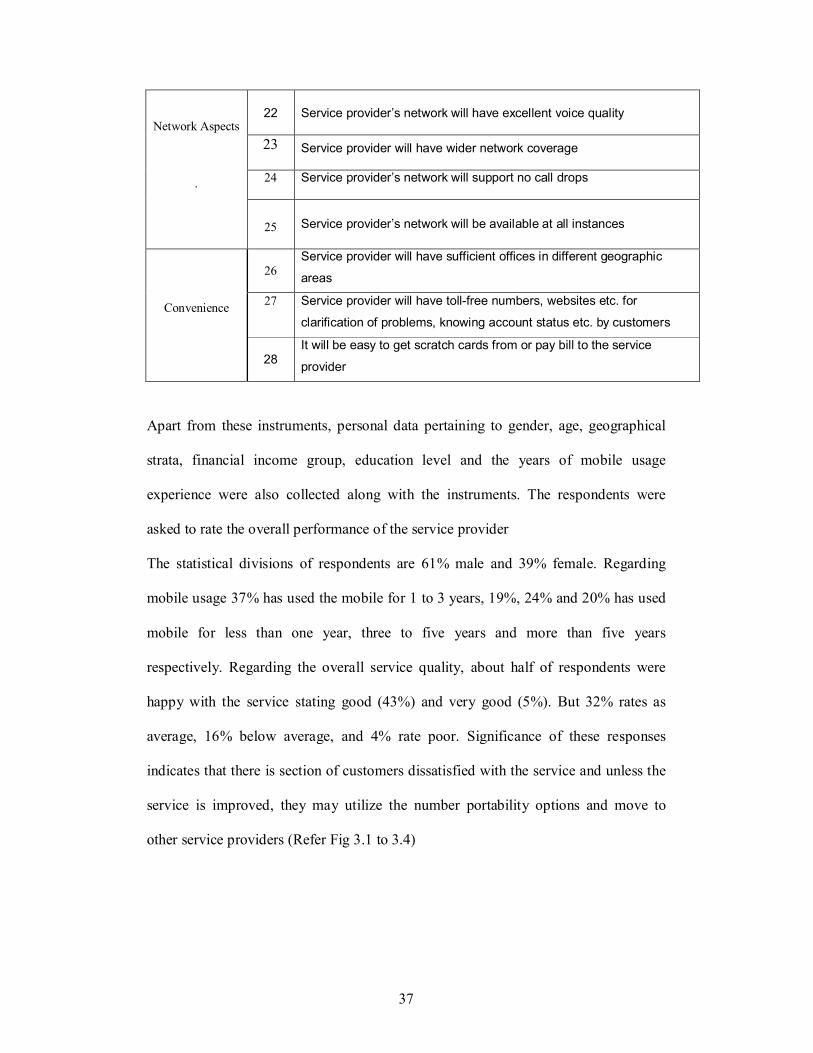
22 Service provider’s network will have excellent voice quality
23 Service provider will have wider network coverage
24 Service provider’s network will support no call drops
Network Aspects
.
25 Service provider’s network will be available at all instances
26 Service provider will have sufficient offices in different geographic
areas
27 Service provider will have toll-free numbers, websites etc. for
clarification of problems, knowing account status etc. by customers Convenience
28 It will be easy to get scratch cards from or pay bill to the service
provider
Apart from these instruments, personal data pertaining to gender, age, geographical
strata, financial income group, education level and the years of mobile usage
experience were also collected along with the instruments. The respondents were
asked to rate the overall performance of the service provider
The statistical divisions of respondents are 61% male and 39% female. Regarding
mobile usage 37% has used the mobile for 1 to 3 years, 19%, 24% and 20% has used
mobile for less than one year, three to five years and more than five years
respectively. Regarding the overall service quality, about half of respondents were
happy with the service stating good (43%) and very good (5%). But 32% rates as
average, 16% below average, and 4% rate poor. Significance of these responses
indicates that there is section of customers dissatisfied with the service and unless the
service is improved, they may utilize the number portability options and move to
other service providers (Refer Fig 3.1 to 3.4)
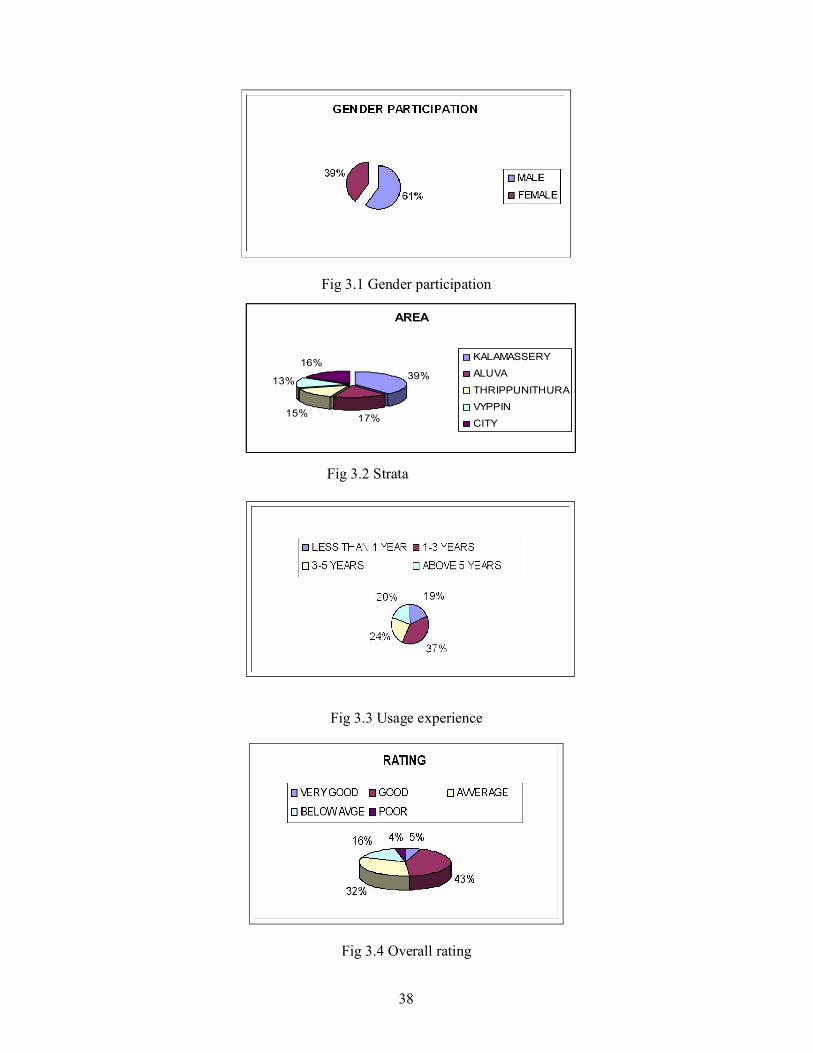
38
Fig 3.1 Gender participation
Fig 3.2 Sampling Strata
Fig 3.2 Strata
Fig 3.3 Usage experience
Fig 3.4 Overall rating
AREA
39%
17%15%
13%
16%KALAMASSERY
ALUVA
THRIPPUNITHURA
VYPPIN
CITY

39
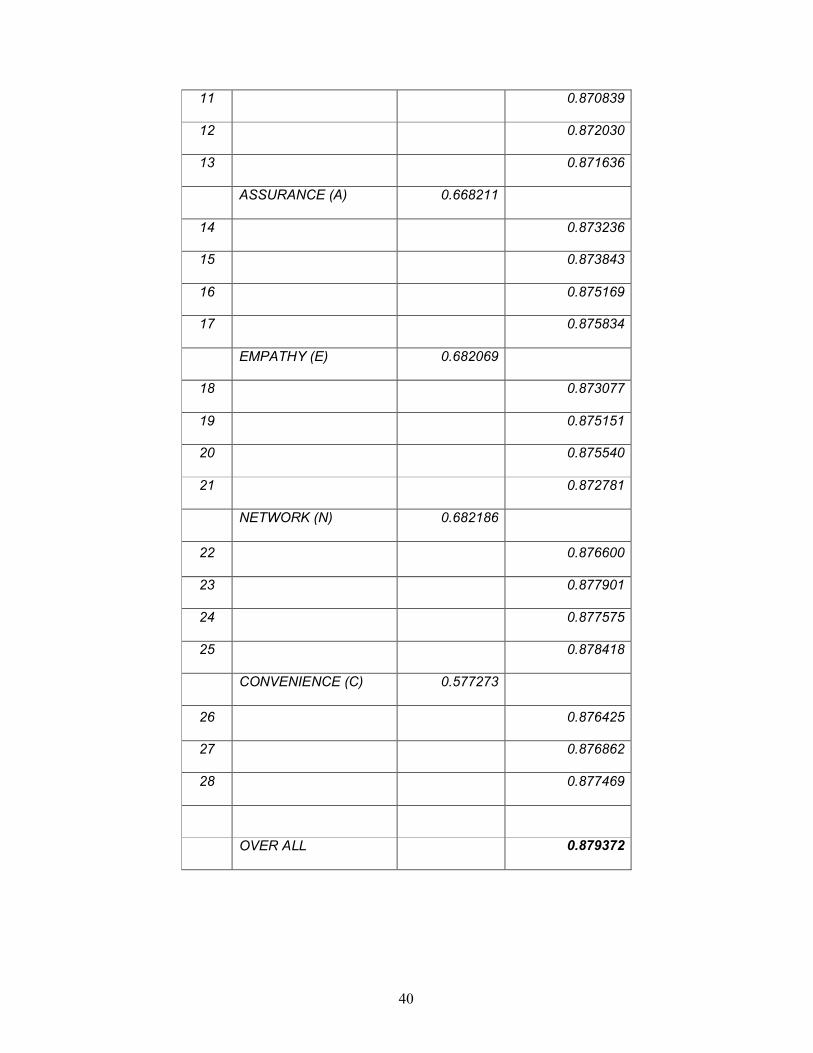
3.4 Response Validation
The reliability or internal consistency of the scale is validated by calculating the
Cronbach Alfa values. It was originally derived by Kuder & Richardson (1937) for
dichotomously scored data (0 or 1) and later generalized by Cronbach (1951) to
account for any scoring method. Cronbach coefficient Alpha is a measure of squared
correlation between observed scores and true scores. In other words, reliability is
measured in terms of the ratio of true score variance to observed score variance. It is
calculated based on the variance of score for each questions and total variance.
Cronbach Alpha value more than 0.7 is acceptable and indicates the internal
consistency of instruments. The overall Alpha value was calculated as 0.8793. Table
3.3 presents the various Alpha values
Table 3.3 CRONBACH Alpha values
Q.NO Dimension Dimension ALPHA If
ALPHA Item deleted TANGIBLES (T) 0.513223
1 0.878821
2 0.877460
3 0.879296
4 0.876811
RELIABILITY (R ) 0.649344
5 0.872961
6 0.872917
7 0.879809
8 0.872790
9 0.876556
RESPONSIVENESS(S) 0.736480
10 0.873695
40
11 0.870839
12 0.872030
13 0.871636
ASSURANCE (A) 0.668211
14 0.873236
15 0.873843
16 0.875169
17 0.875834
EMPATHY (E) 0.682069
18 0.873077
19 0.875151
20 0.875540
21 0.872781
NETWORK (N) 0.682186
22 0.876600
23 0.877901
24 0.877575
25 0.878418
CONVENIENCE (C) 0.577273
26 0.876425
27 0.876862
28 0.877469
OVER ALL 0.879372
41
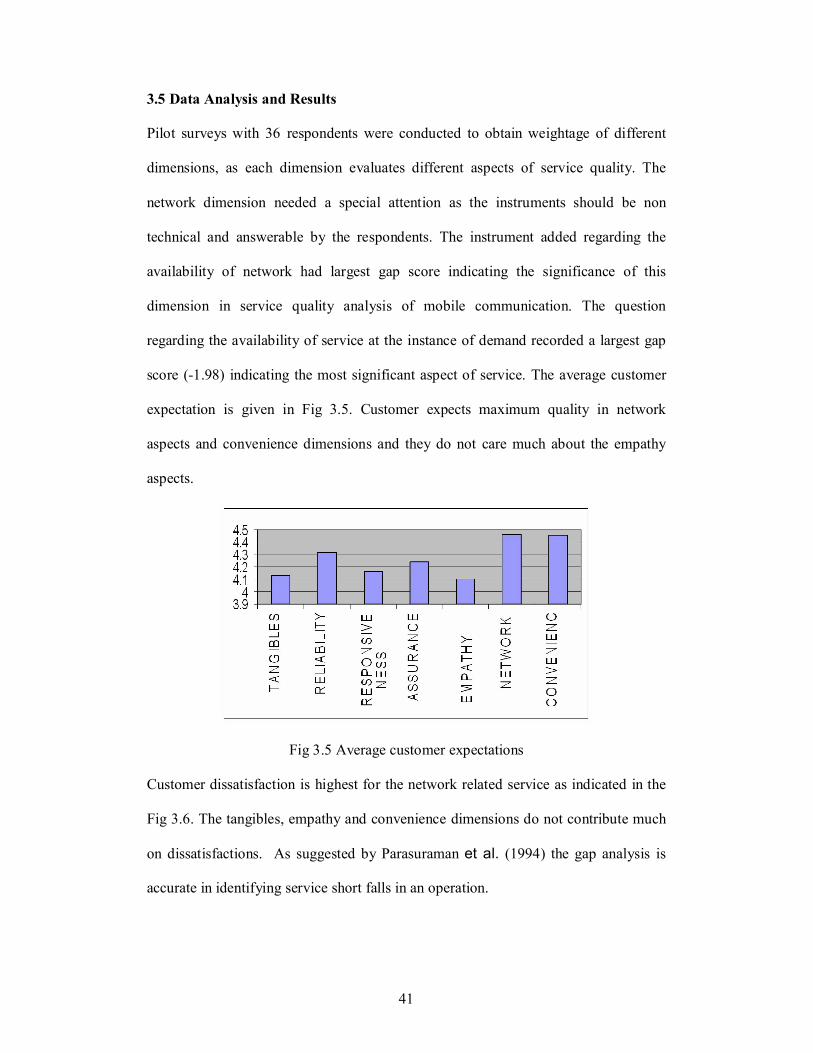
3.5 Data Analysis and Results
Pilot surveys with 36 respondents were conducted to obtain weightage of different
dimensions, as each dimension evaluates different aspects of service quality. The
network dimension needed a special attention as the instruments should be non
technical and answerable by the respondents. The instrument added regarding the
availability of network had largest gap score indicating the significance of this
dimension in service quality analysis of mobile communication. The question
regarding the availability of service at the instance of demand recorded a largest gap
score (-1.98) indicating the most significant aspect of service. The average customer
expectation is given in Fig 3.5. Customer expects maximum quality in network
aspects and convenience dimensions and they do not care much about the empathy
aspects.
Fig 3.5 Average customer expectations
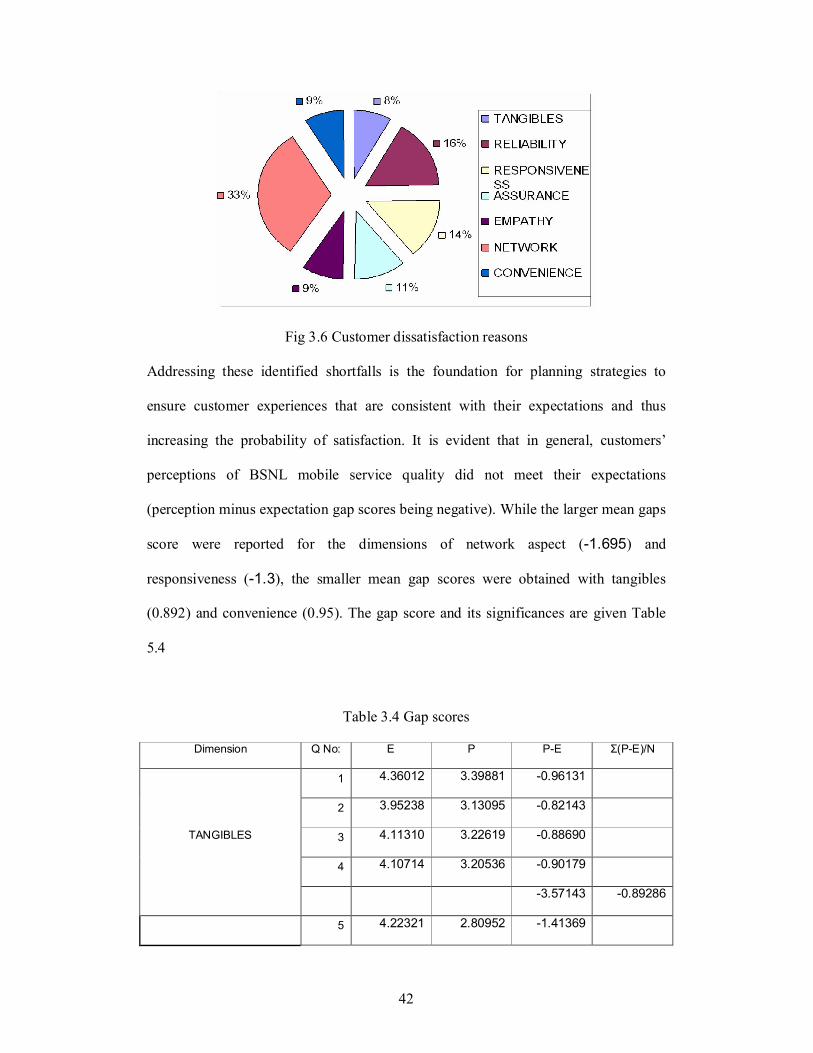
Customer dissatisfaction is highest for the network related service as indicated in the
Fig 3.6. The tangibles, empathy and convenience dimensions do not contribute much
on dissatisfactions. As suggested by Parasuraman et al. (1994) the gap analysis is
accurate in identifying service short falls in an operation.
42
Fig 3.6 Customer dissatisfaction reasons
Addressing these identified shortfalls is the foundation for planning strategies to
ensure customer experiences that are consistent with their expectations and thus
increasing the probability of satisfaction. It is evident that in general, customers’
perceptions of BSNL mobile service quality did not meet their expectations
(perception minus expectation gap scores being negative). While the larger mean gaps
score were reported for the dimensions of network aspect (-1.695) and
responsiveness (-1.3), the smaller mean gap scores were obtained with tangibles
(0.892) and convenience (0.95). The gap score and its significances are given Table
5.4
Table 3.4 Gap scores
Dimension Q No: E P P-E Σ(P-E)/N
1 4.36012 3.39881 -0.96131
2 3.95238 3.13095 -0.82143
3 4.11310 3.22619 -0.88690
4 4.10714 3.20536 -0.90179
TANGIBLES
-3.57143 -0.89286
5 4.22321 2.80952 -1.41369

43
6 4.35417 2.89881 -1.45536
7 4.20833 3.09226 -1.11607
8 4.28274 2.94048 -1.34226
9 4.34524 3.24405 -1.10119
RELIABILITY
-6.42857 -1.28571
10 4.13393 2.95536 -1.17857
11 4.16071 2.83333 -1.32738
12 4.27381 2.90476 -1.36905
13 4.07440 2.74107 -1.33333
RESPONSIVENESS
. -5.20833 -1.30208
14 4.21726 2.97024 -1.24702
15 4.16071 2.97619 -1.18452
16 4.21131 3.05952 -1.15179
17 4.37202 3.16071 -1.21131
ASSURANCE
-4.79464 -1.19866
18 4.11607 2.92857 -1.18750
19 4.01786 2.97619 -1.04167
20 4.00298 2.94345 -1.05952
21 4.25595 3.08036 -1.17560
EMPATHY
-4.46429 -1.11607
22 4.41667 2.98512 -1.43155
23 4.53274 2.91964 -1.61310
24 4.42560 2.67262 -1.75298 NETWORK
25 4.47321 2.49107 -1.98214
-6.77976 -1.69494
26 4.37798 3.19940 -1.17857
27 4.52083 3.64881 -0.87202
28 4.45536 3.65476 -0.80060
CONVENIENCE
-2.85119 -0.95040
44
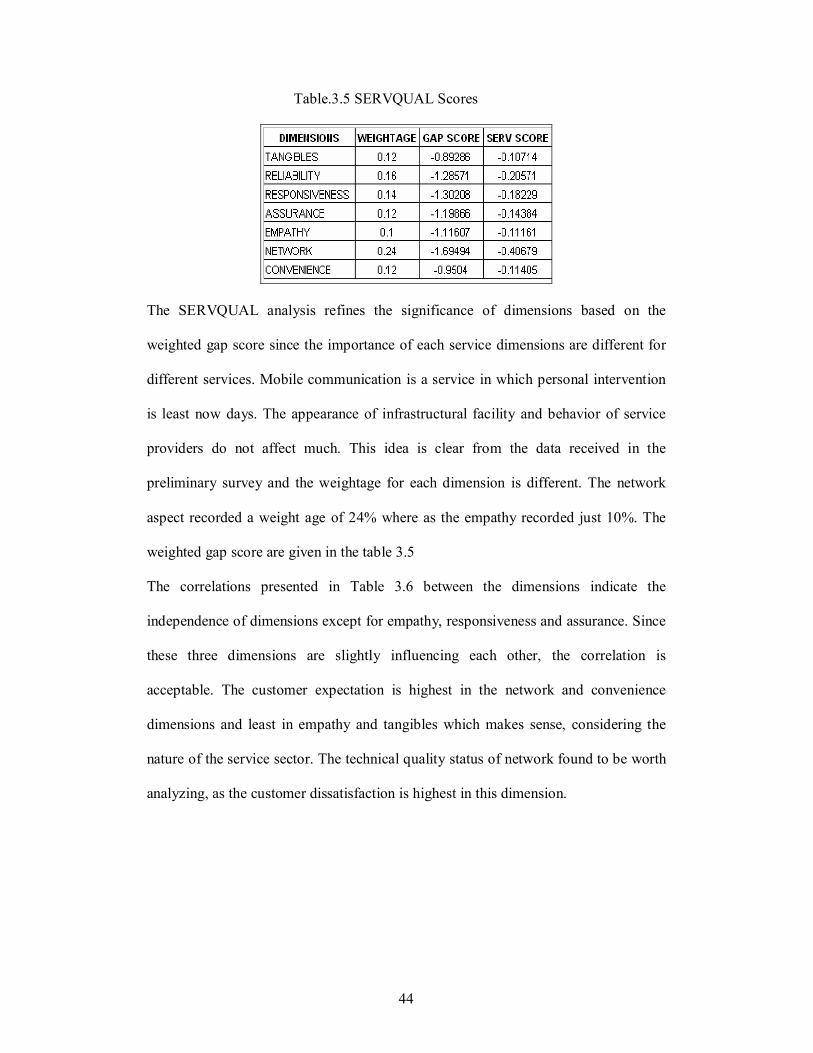
Table.3.5 SERVQUAL Scores
The SERVQUAL analysis refines the significance of dimensions based on the
weighted gap score since the importance of each service dimensions are different for
different services. Mobile communication is a service in which personal intervention
is least now days. The appearance of infrastructural facility and behavior of service
providers do not affect much. This idea is clear from the data received in the
preliminary survey and the weightage for each dimension is different. The network
aspect recorded a weight age of 24% where as the empathy recorded just 10%. The
weighted gap score are given in the table 3.5
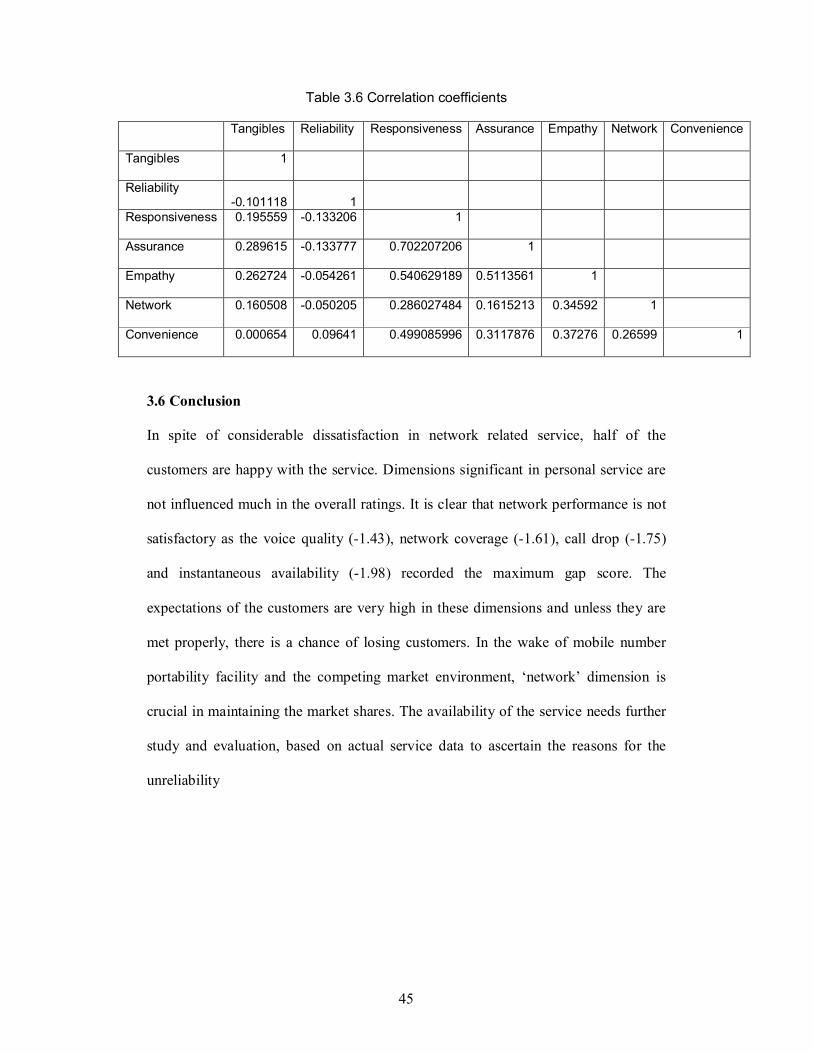
The correlations presented in Table 3.6 between the dimensions indicate the
independence of dimensions except for empathy, responsiveness and assurance. Since
these three dimensions are slightly influencing each other, the correlation is
acceptable. The customer expectation is highest in the network and convenience
dimensions and least in empathy and tangibles which makes sense, considering the
nature of the service sector. The technical quality status of network found to be worth
analyzing, as the customer dissatisfaction is highest in this dimension.
45
Table 3.6 Correlation coefficients
Tangibles Reliability Responsiveness Assurance Empathy Network Convenience
Tangibles 1
Reliability -0.101118 1
Responsiveness 0.195559 -0.133206 1
Assurance 0.289615 -0.133777 0.702207206 1
Empathy 0.262724 -0.054261 0.540629189 0.5113561 1
Network 0.160508 -0.050205 0.286027484 0.1615213 0.34592 1
Convenience 0.000654 0.09641 0.499085996 0.3117876 0.37276 0.26599 1
3.6 Conclusion
In spite of considerable dissatisfaction in network related service, half of the
customers are happy with the service. Dimensions significant in personal service are
not influenced much in the overall ratings. It is clear that network performance is not
satisfactory as the voice quality (-1.43), network coverage (-1.61), call drop (-1.75)
and instantaneous availability (-1.98) recorded the maximum gap score. The
expectations of the customers are very high in these dimensions and unless they are
met properly, there is a chance of losing customers. In the wake of mobile number
portability facility and the competing market environment, ‘network’ dimension is
crucial in maintaining the market shares. The availability of the service needs further
study and evaluation, based on actual service data to ascertain the reasons for the
unreliability