chapter 3 mid-infrared spectroscopy of submillimeter...
TRANSCRIPT

28
Chapter 3
Mid-Infrared Spectroscopy ofSubmillimeter Galaxies:Extended Star Formation inMassive High-Redshift Galaxies
We have completed an observing program with Spitzer IRS to study the mid-IR prop-
erties and investigate the energetics of 24 SMGs 1. This program comprises the largest
sample of SMGs observed with Spitzer IRS and covers the full extent of properties
of the radio-identified population of SMGs in the redshift range of z ∼ 0.65–3.2. We
observe broad PAH emission features in more than 80% of our sample. We find that
the median mid-IR spectrum is well-described by a starburst component with an ad-
ditional power law, Fν ∼ ν−2, likely representing a . 35% AGN contribution to the
bolometric luminosity. Our results thus confirm that even in the case of SMGs with a
significant AGN contribution revealed at other wavelengths, starburst activity domi-
nates the bolometric luminosity. We find that SMGs show weaker silicate absorption
at ∼ 9.7 µm than local ULIRGs. This implies that the continuum and PAH emitting
regions of the SMGs are less obscured than in similarly luminous local ULIRGs. We
interpret this as evidence for a more extended distribution of cool and warm dust
in SMGs compared to the more compact starbursts in local ULIRGs. We also find
stronger 6.2 µm PAH emission in SMGs (relative to the 7.7 µm PAH feature) than
in local starbursts. These results suggest that SMGs are not simply high-redshift
1This chapter has been submitted to ApJ in similar form as Menendez-Delmestre et al. 2008.
29
analogs of either local ULIRGs or nuclear starbursts, but instead they appear to have
star formation which resembles that seen in less-extreme star-forming environments
at z ∼ 0 – suggesting their intense activity is distributed across a far larger region
than the ∼ 1-kpc nuclear bursts in local ULIRGs.
3.1 Introduction
In Chapter 2 we presented the Spitzer IRS results for the first five SMGs observed
in the program (Menendez-Delmestre et al. 2007), which complemented earlier IRS
results for two SMGs at z ∼ 2.8 presented by Lutz et al. (2005). Since then, Valiante
et al. (2007) and Pope et al. (2008) obtained IRS spectra of nine SMGs in blank field
and cluster lens surveys and of 13 SMGs from the GOODS-North Field, respectively.
Here we present our results for our full sample of 24 SMGs, comprising the largest
sample of SMGs observed to date with Spitzer and nearly doubling the number of
SMGs observed with IRS. We discuss our sample selection and observing strategy in
§3.2. The steps comprising the reduction and analysis of the spectra are discussed in
§3.2 and §3.3. Our results are presented in §3.4 and discussed in detail in §3.5. We
assume a ΛCDM cosmology, with H0 = 71 km s−1 Mpc−1, ΩM = 0.27 and ΩΛ = 0.73.
3.2 Observations and Reduction
The SMGs in our program were selected from the sample of 73 spectroscopically-
confirmed, radio-identified SMGs in C05. We aimed for full coverage of the range
in redshifts, radio, submm and total IR luminosities present in the C05 sample (see
Fig. 3.1) to build a sample representative of the radio-identified SMG population in
general. We note that several of the SMGs from the C05 spectroscopic sample fall in
the GOODS-North region and were included in the IRS studies focused on that field
(Pope et al. 2008). Together with our sample, these are effectively part of a larger
IRS study of the C05 survey which covers a total of 33 SMGs (or 45% of the parent
C05 sample).

30
Table 3.1. Summary of Spitzer IRS Observations
Name R.A.a Dec. zbopt Date LL1 LL2
(h m s) ( ′ ′′) (ramp [s] × cycles) (ramp [s] × cycles)
SMMJ030227.73 03 02 27.73 +00 06 53.5 1.408 Jan. 2006 120 × 30 120 × 30SMMJ030231.81 03 02 31.81 +00 10 31.3 1.316 Feb. 2006 120 × 30 120 × 30SMMJ105151.69 10 51 51.69 +57 26 36.0 1.147 May 2006 120 × 30 120 × 30SMMJ105158.02 10 51 58.02 +57 18 00.3 2.239 May 2006 120 × 30 –SMMJ105200.22 10 52 00.22 +57 24 20.2 0.689 May 2006 120 × 30 120 × 30SMMJ105227.58 10 52 27.58 +57 25 12.4 2.142 May 2006 120 × 30 –SMMJ105238.19 10 52 38.19 +57 16 51.1 1.852 May 2006 120 × 30 120 × 30SMMJ105238.30 10 52 38.30 +57 24 35.8 3.036 May 2006 120 × 30 –SMMJ123549.44 12 35 49.44 +62 15 36.8 2.203 May 2006 120 × 30 –SMMJ123553.26 12 35 53.26 +62 13 37.7 2.098 May 2006 120 × 30 –SMMJ123707.21 12 37 07.21 +62 14 08.1 2.484 May 2006 120 × 30 –SMMJ123711.98 12 37 11.98 +62 13 25.7 1.992 May 2006 120 × 30 120 × 30SMMJ123721.87 12 37 21.87 +62 10 35.3 0.979 May 2006 120 × 30 120 × 30SMMJ163639.01 16 36 39.01 +40 56 35.9 1.495 Aug. 2005 120 × 30 120 × 30SMMJ163650.43 16 36 50.43 +40 57 34.5 2.378 Sept. 2005 120 × 30 –SMMJ163658.78 16 36 58.78 +40 57 28.1 1.190 Sept. 2005 120 × 30 120 × 30SMMJ221733.02 22 17 33.02 +00 09 06.0 0.926 June 2006 120 × 20 120 × 30SMMJ221733.12 22 17 33.12 +00 11 20.2 0.652 Nov. 2005 120 × 15 120 × 15SMMJ221733.91 22 17 33.91 +00 13 52.1 2.555 June 2006 120 × 30 –SMMJ221735.15 22 17 35.15 +00 15 37.2 3.098 June 2006 120 × 30 –SMMJ221735.84 22 17 35.84 +00 15 58.9 3.089 June 2006 120 × 30 –SMMJ221737.39 22 17 37.39 +00 10 25.1 2.614 June 2006 120 × 30 –SMMJ221804.42 22 18 04.42 +00 21 54.4 2.517 June 2006 120 × 30 –SMMJ221806.77 22 18 06.77 +00 12 45.7 3.623 June 2006 120 × 30 –
a Radio position from C05 compilation.
b Spectroscopic redshifts from C05.
31
While we aimed to span the full range in multi-wavelength properties of radio-
identified SMGs, to have a realistic chance of detecting the galaxies with IRS we
selected the 24 SMGs with the highest estimated 24 µm fluxes.2 As 24 µm observa-
tions were not available at the time of the proposal, we estimated 24 µm fluxes for
the SMGs in C05 from fitting the SEDs to the radio (1.4GHz), submm (850 µm) and
available optical photometric data points (see C05 and references therein). We note
that selection of 24 µm-bright sources (albeit estimated) may introduce a two-sided
selection effect. Selection based on bright 24 µm-fluxes will preferentially pick out
the hot dust emission in AGNs. However, at redshifts z ∼ 2, the 7.7 µm-PAH feature
is redshifted onto the 24 µm band: this is a prominent emission feature, associated
with star-formation activity and will result in a boosted 24 µm flux. We discuss
this potential selection bias in more detail in §3.4.5. From a parallel mid-IR imaging
survey of the radio-identified SMGs in C05 with the Multiband Imager for Spitzer
(MIPS) by Hainline et al. (2009) our IRS subsample has MIPS 24 µm band fluxes in
the range S24 µm ∼ 0.09–0.85mJy with a median value of < S24 µm >= 0.33 ± 0.18
mJy.
The details of our observations are summarized in Table 3.1. We observed all our
targets using the low-resolution (R ∼ 57–126) Long-Low (LL) observing module of
IRS. The slit width for this module is ∼ 10.7′′, which corresponds to roughly 100 kpc
at z ∼ 2, and so each target is fully enclosed in the observed slit and is thus treated
as a point source. With shared coverage of the first LL order (LL1: 19.5–38.0 µm)
and the second LL order (LL2: 14.0–21.3 µm) we aimed to cover rest-frame emission
longwards of 6µm to search for PAH emission and for any silicate absorption at
9.7µm. With a redshift range of z = 0.65–3.2 for the full sample, the LL1 IRS
module alone provides the relevant coverage for SMGs with z & 2.2; while the LL2
module is also required for SMGs with z . 2.2. We observed each target at two
different nod positions for a total integration time of 1–2 hours with each module.
The data were obtained between August 2005 and June 2006.
2We used the online tool SPEC-PET to calculate estimated S/N for galaxies according to theestimated S24µm value (http://ssc.spitzer.caltech.edu/tools/specpet/).

32
Figure 3.1 (Left:) The distribution of redshifts and IR luminosities (8–1000 µm) ofthe parent sample of radio-identified SMGs compiled by C05 with our IRS subsamplehighlighted. We plot a representative error on the IR luminosities. (Right:) Thedistribution of radio and submillimeter fluxes for the full C05 sample and those inthe subsample observed with IRS. The histograms show the cumulative distributionof the full sample and the IRS subsample. These plots demonstrate that the IRSsample is representative of the parent sample of radio-identified SMGs, covering thefull range in radio and submm properties, redshift and IR-luminosity.

33
We reduced the data using the Spitzer IRS S14 pipeline.3 To ensure homogene-
ity throughout the sample, we reprocessed the raw data from our earlier results
(Menendez-Delmestre et al. 2007), which had been processed by the S13 pipeline.
We performed additional cleaning of the 2D spectra using the SSC utility irsclean 4
to remove rogue pixels, by creating a mask for each Astronomical Observing Request
(AOR). We use the rogue pixel mask associated with the observing cycle as a base and
then identify additional deviant pixels in a superdroop file resulting from the averaging
of all droop files within a single AOR. We relied on differencing between the two nod
positions to subtract the residual background. To do this, we median-combined all
cycles for science images with the same module order (LL1 or LL2) and nod position.
For each module order, we then subtracted the median of all science images at one
nod position from that of the other nod position.
For each LL order, we used the SPitzer IRS Custom Extraction 5 (spice) software
to extract flux-calibrated 1D spectra from each 2D sky-subtracted median-combined
nod. We used the optimal extraction mode recently included in spice. Optimal
extraction entails taking a weighted average of profile-normalized flux at each wave-
length to increase the S/N in IRS observations of faint sources (Horne 1986; Narron et
al. 2006). Flux calibration is based on observations of a standard star during the same
observing cycle as the science observations and has a 10% uncertainty (see IRS Data
Handbook 6 for details). The spice-extracted 1D spectra for the different nods within
one LL order were then median-combined. We combined the orders using iraf to
produce a final spectrum for each target, excluding the noisy edges at λobs . 14.2 µm
and λobs & 35 µm. The resulting spectra are shown in Fig. 3.2.
3http://ssc.spitzer.caltech.edu/irs/dh/4http://ssc.spitzer.caltech.edu/archanaly/contributed/irsclean5http://ssc.spitzer.caltech.edu/postbcd/spice.html6http://ssc.spitzer.caltech.edu/irs/dh/

34
Figure 3.2 The rest-frame mid-IR spectra of all 24 SMGs in our sample, smoothed tothe instrument resolution (∆λ ∼ 0.3 µm at λ ∼ 24 µm). The zero level for each spec-trum is denoted by a horizontal short-dashed line and the shading represents the fluxuncertainty, as given by SPICE. We do not detect SMMJ030231.81. The locations ofPAH features at 6.2, 7.7, 8.6, 11.3 and 12.7 µm are indicated by the dashed lines andthese features are visible in a large fraction of our sample. The position of tentativenarrow line emission from [Arii] (6.99 µm) and/or [Siv] (10.51 µm) are shown by dot-ted lines in SMM J105158.02, SMMJ105238.19, SMMJ123711.98, SMM J123721.87,SMM J163639.01, SMMJ221733.91 and SMMJ221735.15.

35
Fig. 3.2. — Continued.

36
3.3 Analysis
The spectra in Fig. 3.2 show a range of emission and absorption features. One of the
key advantages of our survey over previous studies is the availability of spectroscopic
redshifts for the entire sample from C05. With spectroscopic redshifts in hand, we
have a priori knowledge of the observed wavelengths where emission and absorption
features are expected. We therefore identified PAH features, silicate absorption cen-
tered at ∼ 9.7 µm and a number of possible forbidden narrow emission lines, such
as [Arii] (6.99 µm) and [Siv] (10.51 µm). We see that a large fraction of our sample
show PAH emission and we mark these and the other spectral features on Fig. 3.2.
To derive quantitative estimates of the strength of the emission and absorption
features and determine their precise wavelengths we need to fit the spectra. However,
given our modest integration times (Table 3.1), we reach a signal to noise (S/N) of
only 1–5 in the continuum emission at 24 µm 7. At this S/N we found that intricate
spectral fitting programs (e.g., pahfit; Smith et al. 2007) are not appropriate. We
thus adopted a simple and straight-forward fitting approach which we describe below.
The measurements of the fluxes and EWs of features in the spectra required
that we first determine the continuum level for each spectrum before measuring the
strength of each individual emission and absorption feature. The resulting EW and
flux measurements are extremely sensitive to the fitting method selected, particularly
in the determination of the continuum level. A number of alternative fitting methods
have been used by different authors, making a fair comparison of PAH strengths in
different samples a rather subjective and delicate issue, as discussed by Sajina et
al. (2007). In particular, the prevalence of interactive fitting methods has further
complicated the reproducibility of mid-IR properties between samples. Hence in this
work we have adopted a method of continuum and PAH fitting that ensures complete
reproducibility. Moreover, in order to make fair comparisons between the SMGs in
our sample and other low- and high-redshift sources, we have re-measured all the mid-
IR features in all of these samples using our method. We have applied our method
7S/N was determined within a λ-window of ∆λ ∼ 1.4 µm on the individual nod-subtracted 2Dspectra

37
to select local ULIRGs from the Bright IRAS sample studied by Armus et al. (2006,
2007) and Desai et al. (2007), the low-redshift nuclear starburst-dominated galaxies
presented by Brandl et al. (2006) and the mid-IR selected high-redshift sources of
Sajina et al. (2007). As we noted earlier, we have also included in our comparisons
the 13 SMGs in the GOODS-North field studied by Pope et al. (2008), nine of which
have optical redshifts measured by C05 and thus naturally complement our sample.
The thermal mid-IR continuum, arising either from starburst or AGN activity
can be described by a power-law, Sν ∼ ν−αMIR , where the value of the power-law
index αMIR gives an indication of the steepness of the spectrum. Flatter mid-IR con-
tinua with low power-law indices (αMIR . 0.5) are usually associated with unobscured
AGNs, where emission from the hot dust close to the AGN is readily observed. Steeper
continua (αMIR & 0.5) are on the other hand associated with starburst activity, but
can also be found in dust-obscured AGNs. Hence we determined the power-law con-
tinuum index αMIR for the spectra in our sample to: (1) characterize the continuum
slope and investigate the underlying energetics, and (2) to define the continuum level
on which PAH emission features are superimposed.
To determine αMIR we use the χ2 minimization idl routine linfit to obtain the
best linear fit to each SMG spectrum in log(Sν)–log(ν) space (see Fig. 3.3). We first
obtain the best linear fit to each full spectrum and calculate the rms in the (original
− fit) residual spectrum. Then, we identify those wavelength regions in the original
spectrum where the data points lie more than 1× the rms away from this first linear
fit. In this way, we automatically identify the wavelength regions where emission and
absorption features are present. We then perform a second round of linear fitting,
where we exclude these regions from the fit. We adopt the results of this second
fit as our final continuum, with the influence of emission and absorption features
minimized. The uncertainty in the continuum level is established considering the flux
uncertainty given by SPICE for each individual spectrum. These flux uncertainties
propagate into an uncertainty of ∼ 20%.

38
Figure 3.3 (Top Left:) Sample spectrum in Log[Sν ] − Log[ν] space that illus-trates our approach to continuum determination. The solid line is the spectrumof SMMJ030227.73 and the dotted line is the best fit continuum determined throughthe method described in §3.3. (Top Right:) For each PAH feature, we defined afitting window covering a narrow wavelength range centered at the expected centralPAH wavelengths (6.22, 7.598, 8.61, 11.33, 12.62 µm; Draine & Li 2007). The edges ofthese fitting windows are denoted in this figure by open diamonds on the spectrum.(Bottom:) Mid-IR spectrum of SMMJ030227.73 with flux expressed in units of λSλ.The gaussian fit for each PAH feature is shown as dashed curves.

39
Having determined the continuum, we search for the presence of PAH emission
features at 6.2, 7.7, 8.6, 11.3 and 12.7 µm. Since our targets have a range in redshift,
z ∼ 0.65–3.2, the wavelength coverage varies from 6–22 µm for the lowest redshift
SMGs to 4.2–8.3 µm for the highest redshift. Out of all detected SMGs in our
sample, 90% include coverage of the 7.7 µm region of the spectrum, thus providing
a large sample of 20 SMGs to investigate the spectral features within this important
wavelength region. We define a wavelength window around each spectral feature and
use the iraf task splot to fit the PAH features with individual gaussians, where the
center and FWHM are left as free parameters within the fitting window. We create
a cursor file specifying the fitting windows and continuum level for each spectrum
to automate the fitting process and thus avoid the lack of reproducibility inherent
to other interactive fitting tasks. The wavelength regions used to fit the 6.2, 7.7,
8.6, 11.3 and 12.7 µm PAH features were approximately 6.026–6.617, 7.031–8.302,
8.242–8.922, 10.813–11.812, 12.409–13.029µm, respectively (see Fig. 3.3). We adopt
the splot output uncertainties in the resulting EWs and luminosities, which account
for the noise level present in the spectra. These errors are indicated in Table 3.2 and
correspond to an average uncertainty of ∼ 30%. We derive a redshift associated with
each PAH feature from its observed central wavelength. The final PAH-based redshift
for spectra displaying multiple PAH features corresponds to the weighted mean of the
redshifts derived from the individual PAH features, where the weights are provided
by the PAH fitting uncertainties.
Finally, to determine the depth of the silicate absorption, we define the optical
depth as τ9.7 µm = log10[Scont/Sobs], where Sobs is the flux level observed at 9.7 µm
and Scont, the interpolated flux of continuum in the absence of any absorption. We
measure the latter from our power law continuum fit. The EWs and fluxes for PAH
emission and absorption features we derive are listed in Table 3.2.

40
Figure 3.4 (Left:) The median-combined rest-frame composite spectrum of 22 SMGsdetected in our sample, with the shaded area representing the 1-σ sample standarddeviation. We assume optical redshifts (C05), except for the five SMGs in whichPAH features suggest an alternate redshift (see Table 3.2). The composite spectrumis dominated by strong PAH emission at 6.2, 7.7, 8.6, 11.3 and 12.7µm, with anunderlying red continuum. All the spectra are normalized by their flux at λ = 8.5 µmin the rest-frame (see §3.3.1 for details). (Right:) Composite spectra for subsetsof SMGs in three separate redshift bins, where the zero level of each spectrum isdenoted by a dash-dotted horizontal line. These demonstrate that at λ > 10 µm ourcomposite spectrum is dominated by sources at z < 1.6.

41
Figure 3.5 (Left:) Rest-frame 8 µm luminosity, measured from rest-frame IRS spec-tra, as a function of redshift for the SMGs in our sample. The dotted curve representsthe lowest 8 µm luminosity accessible to Spitzer IRS at each redshift, assuming a fluxsensitivity of S24 µm ∼ 0.2mJy. The dashed box denotes the luminosity-complete sub-sample of SMGs with L8 µm & 1032 erg s−1 from which we build composite spectrabased on 24 µm-brightness. (Right:) Similar plot for the rest-frame radio lumi-nosity density at 1.4 GHz for the SMGs in our sample. The dotted line representsthe 3-σ flux sensitivity (∼ 30 µJy) of the radio observations discussed in C05. Thedashed box encloses the SMGs with L1.4GHz & 2 × 1024 erg s−1 Hz−1 that comprisethe radio-luminosity-complete sample used to create SMG composites based on radio-brightness. See §3.3.1 for details.
42
SMM J221806.77
SMM J221733.91SMM J105151.69SMM J105158.02
SMM J105227.58
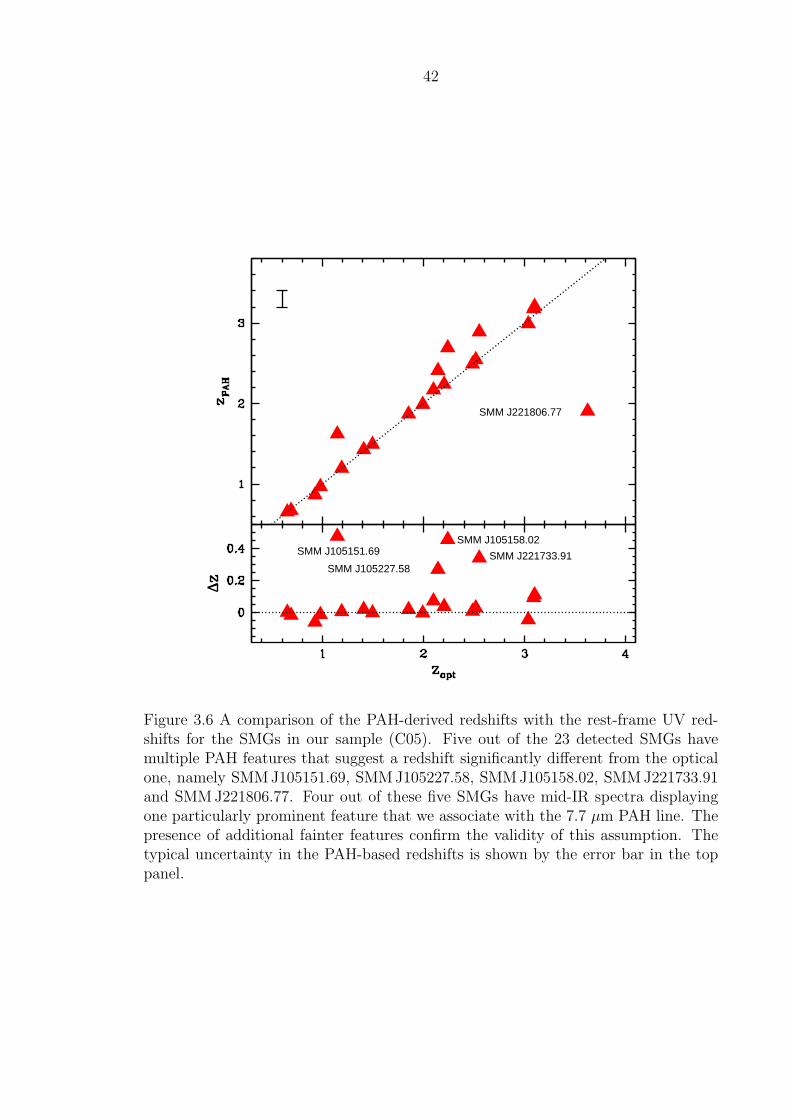
Figure 3.6 A comparison of the PAH-derived redshifts with the rest-frame UV red-shifts for the SMGs in our sample (C05). Five out of the 23 detected SMGs havemultiple PAH features that suggest a redshift significantly different from the opticalone, namely SMMJ105151.69, SMM J105227.58, SMMJ105158.02, SMM J221733.91and SMM J221806.77. Four out of these five SMGs have mid-IR spectra displayingone particularly prominent feature that we associate with the 7.7 µm PAH line. Thepresence of additional fainter features confirm the validity of this assumption. Thetypical uncertainty in the PAH-based redshifts is shown by the error bar in the toppanel.

43
3.3.1 Composite Spectra
In the interest of obtaining a representative spectrum for the sample as a whole,
with a higher S/N to enable identification of fainter underlying features, we also
median-combined the individual spectra of the SMGs into a composite. The full
collection of individual spectra in our sample cover the rest-frame wavelength range
λ ∼ 5–22 µm. To reduce bias towards the mid-IR properties of SMGs within
a narrower redshift range, we only include in the composite spectrum wavelengths
covered by the data for at least five SMGs. The individual spectra in Fig. 3.2 also
display a significant spread in rest-frame continuum level with S9µm ∼ 0.2–1.2mJy
and so we normalize them by their flux at a rest-frame wavelength of 8.5 µm. Only
the spectrum of SMMJ221733.12 does not cover this wavelength and is thus excluded
from the composite. The final composite spectrum includes 22 detected SMGs, and
is shown in Fig. 3.4. The sample standard deviation of the SMG composite spectrum
increases towards longer wavelengths, in part reflecting the fact that fewer individual
spectra contribute at λrest & 10 µm. To better demonstrate the redshift ranges which
contribute to the different wavelength regions in the composite (and their variations)
we divide our sample into three different redshift bins and construct composite spectra
of low-, intermediate- and high-redshift SMGs (see Fig. 3.4). We discuss these in
§3.4.6.
We also take advantage of the range in properties covered by our sample (see
Fig. 3.1) to investigate mid-IR spectral properties of different SMG sub-populations.
We follow the method described above to construct composite spectra of subsamples
of SMGs based on 24 µm and radio brightness to search for trends within our sample.
However, composite spectra based on apparent brightness mix sources with different
intrinsic luminosities at different redshifts: we attempt to minimize this bias in these
composites by defining luminosity-complete sub-samples of SMGs. First, we restrict
the sample of SMGs that go into each composite to those that fall within a redshift
range for which we are close to complete in terms of mid-IR and radio luminosity. At
the median redshift of our sample, < z >∼ 2, the observed 24 µm flux corresponds

44
to redshifted rest-frame 8 µm emission. Therefore, we define luminosity-complete
sub-samples of SMGs by using the rest-frame luminosities at 8 µm and at 1.4GHz. 8
We impose a luminosity cut and select all SMGs with luminosities greater than the
limiting luminosity (see Fig. 3.5). To build the 24 µm-composites we restrict the
parent sample to SMGs with L8 µm & 1032 erg s−1. For the radio composite, we
include SMGs with L1.4GHz & 2 × 1024 erg s−1 Hz−1. As a result, low-redshift SMGs
with the lowest mid-IR and radio luminosities within the sample, even though they
have the highest apparent fluxes, are excluded from the 24 µm- and radio-brightness
composites. We discuss these composites in §3.4.5.
3.4 Results
Out of the 24 SMGs in our sample shown in Fig. 3.2, we detect PAH emission and
continuum in 16 SMGs, PAH emission and no continuum in three SMGs, continuum
but no PAH emission in another four SMGs and neither continuum nor PAH emission
in only a single SMG (SMMJ030231.81). Hence, our sample contains 19 SMGs with
PAH emission and 20 with detectable continuum emission. In addition, marginal
detections of [Arii] (6.99 µm) and [Siv] (10.51 µm) narrow-line emission were found
in several individual SMGs (see Fig. 3.2). We give the emission and absorption line
properties for the individual SMGs in Table 3.2. Results for the various composite
spectra are presented in Table 3.3.
8L1.4GHz = 4πD2LS1.4GHz(1 + z)−(α+1) WHz−1, assuming α = −0.8, the average spectral index
for star-forming galaxies (e.g., Yun et al. 2001)

45
3.4.1 PAH-based Redshifts
We have rest-frame UV redshifts for all the SMGs in our sample from optical spec-
troscopy (C05) using the blue-sensitive Low-Resolution Imaging Spectrograph (Oke
et al. 1995; McCarthy et al. 1998) on Keck II. These spectroscopic redshifts allowed
us to identify confidently faint emission and absorption features in the mid-IR spectra
of individual SMGs. Nevertheless, with 19 SMGs displaying prominent PAH emis-
sion, we can determine a mid-IR redshift for each SMG based on the location of the
redshifted PAH features and compare these to the rest-frame UV redshifts for these
galaxies. PAH-based redshifts (zPAH) for our sample are shown in Table 3.2 and are
compared to the redshifts from C05 (zopt) in Fig. 3.6. We note that PAH-derived red-
shifts have a large uncertainty (∆z ∼ 0.1) arising from the intrinsically large width
of PAH features (FWHM7.7µm & 104 km s−1). Redshifts based on rest-frame UV fea-
tures are thus more precise, although equally we note that as the optical emission in
these systems does not trace the bolometric emission well, there are opportunities for
them to be erroneous if the optical spectroscopic IDs are spatially offset from the true
radio counterpart. The comparison in Fig. 3.6 demonstrates that the IRS spectra of
the majority of the SMGs have features consistent with the rest-frame UV redshifts.
However, there are five SMGs where the features suggest an alternate redshift (see
Table 3.2) that is significantly different from the rest-frame UV redshift.
For the five SMGs with discrepant redshifts (see Fig. 3.7), the reasons for the
disagreement are in all cases due to ambiguous line identifications resulting from low
S/N features in the UV spectra, and so we discuss these individually. We note that
these corrections to the redshifts have not significantly changed the interpretation of
these sources. 9 We also note that one of the new PAH redshifts, for SMM J105158.02,
strengthens the significance of the z ∼ 2.7 SMG cluster/association discovered in
Blain et al. (2004).
In the case of SMMJ221733.91, an initial indication of a redshift around z ∼ 2.5
from absorption features in a low S/N spectrum was apparently verified by a weak Hα
9Changes in redshift at the 10–20% level at z ∼ 2 do not result in changes to the luminosities ortemperatures beyond the associated calibration errors.

46
Tab
le3.
2.C
har
acte
riza
tion
ofM
id-I
RSpec
tral
Fea
ture
sin
Indiv
idual
SM
Gs
SM
MJ
zo
pta
zP
AH
bS6
.2c
EW
6.2
dS7
.7E
W7
.7S8
.6E
W8
.6S11
.3E
W11
.3S12
.7E
W12
.7τ9
.7e
S24
.0f
030227.7
31.4
08
1.4
35.5
1±
0.9
70.1
8±
0.0
320.4
4±
1.5
00.6
5±
0.0
57.9
2±
1.4
00.2
5±
0.0
45.4
7±
1.0
00.1
7±
0.0
36.9
3±
0.8
40.2
1±
0.0
3>
0.0
50.4
5030231.8
1g
1.3
16
––
––
––
––
––
––
–105151.6
91.1
47
1.6
216.0
7±
1.2
00.5
0±
0.0
417.6
0±
2.5
00.7
9±
0.0
9–
–4.4
0±
1.6
00.4
3±
0.1
5–
–>
0.3
40.2
8105158.0
22.2
39
2.6
9–
–8.5
6±
7.1
0–
0.6
9±
7.5
00.8
3±
0.0
6–
––
––
0.1
2105200.2
20.6
89
0.6
7–
––
––
–3.5
5±
1.1
00.2
8±
0.0
9–
–>
0.4
90.8
8105227.5
82.1
42
2.4
1–
–8.6
2±
1.5
00.5
7±
0.1
01.5
8±
0.9
20.1
0±
0.0
6–
––
––
0.1
9105238.1
91.8
52
1.8
79.1
3±
0.6
40.3
3±
0.0
226.1
1±
1.1
01.3
9±
0.0
66.4
5±
1.2
00.4
3±
0.0
8–
––
–>
0.2
70.5
1105238.3
03.0
36
2.9
9–
–6.0
5±
0.6
20.0
4±
0.0
0–
––
––
––
0.7
5123549.4
42.2
03
2.2
4–
–15.3
8±
1.4
00.2
1±
0.0
22.1
3±
0.8
40.0
3±
0.0
1–
––
––
0.6
3123553.2
62.0
98
2.1
7–
–4.1
8±
1.3
00.0
9±
0.0
35.1
9±
1.7
00.1
6±
0.0
5–
––
––
0.3
9123707.2
12.4
84
2.4
94.9
1±
1.2
00.1
9±
0.0
512.3
0±
1.2
00.4
5±
0.0
42.9
0±
0.7
10.1
0±
0.0
2–
––
––
0.1
8123711.9
81.9
92
1.9
98.7
5±
0.9
60.4
1±
0.0
436.0
7±
1.7
02.4
7±
0.1
26.6
8±
1.3
00.5
8±
0.1
15.5
5±
0.6
70.8
5±
0.1
0–
–>
0.2
60.5
6123721.8
70.9
79
0.9
7–
–2.7
7±
1.1
00.7
2±
0.3
04.3
5±
1.0
01.3
2±
0.3
14.2
9±
1.0
01.1
6±
0.2
82.7
7±
1.2
00.9
3±
0.4
1>
1.0
10.2
1163639.0
11.4
95
1.4
98.3
2±
1.0
00.5
1±
0.0
610.0
0±
1.8
00.6
4±
0.1
14.4
5±
1.3
00.2
5±
0.0
83.7
5±
1.5
00.2
0±
0.0
86.3
1±
1.5
00.3
3±
0.0
8>
0.6
60.2
1
163650.4
3h
2.3
78
––
–34.9
3±
1.8
00.2
3±
0.0
1–
––
––
––
0.9
5163658.7
81.1
90
1.2
0–
–20.5
1±
1.7
00.8
9±
0.0
74.7
2±
1.4
00.2
0±
0.0
65.4
6±
1.1
00.2
3±
0.0
54.9
5±
1.1
00.2
0±
0.0
5>
0.2
10.5
6221733.0
20.9
26
0.8
7–
––
–3.0
5±
1.1
00.2
1±
0.0
84.9
7±
1.1
00.7
0±
0.1
5–
–>
0.1
10.3
1221733.1
20.6
52
0.6
5–
––
––
–13.8
9±
1.6
01.5
3±
0.1
74.7
7±
1.3
00.5
7±
0.1
6>
1.2
00.3
6221733.9
12.5
55
2.8
95.3
3±
1.2
00.1
6±
0.0
49.4
5±
1.2
00.3
6±
0.0
5–
––
––
––
0.2
4221735.1
53.0
98
3.2
1–
–11.5
4±
0.9
90.4
4±
0.0
4–
––
––
––
0.0
4221735.8
43.0
89
3.1
83.9
8±
0.6
1–
6.2
8±
0.6
1–
––
––
––
–0.0
1
221737.3
9h
2.6
14
––
––
––
––
––
––
0.1
4221804.4
22.5
17
2.5
52.7
2±
0.8
40.0
9±
0.0
313.9
7±
2.1
01.2
8±
0.1
9–
0.1
4±
0.1
8–
––
––
0.1
0221806.7
73.6
23
1.9
1–
–25.9
8±
0.9
70.1
7±
0.0
14.9
0±
0.6
70.0
4±
0.0
17.3
5±
0.6
70.1
2±
0.0
1–
––
0.6
0
aO
pti
calre
dsh
ifts
from
C05
bPA
H-b
ase
dR
edsh
ifts
;se
e§3
.4.1
for
deta
ils.
cPA
Hfluxes
inunit
sof10−
15
erg
s−1cm−
2.
Quote
derr
ors
corr
esp
ond
toPA
Hfitt
ing
uncert
ain
ties.
An
addit
ional∼
20%
isatt
ribute
dto
flux
calibra
tion
and
conti
nuum
dete
rmin
ati
on.
dPA
Hre
st-fra
me
EW
sare
expre
ssed
inunit
sof
µm
eO
pti
caldepth
deri
ved
from
Silic
ate
-abso
rpti
on
featu
re.
See§3
.4.4
for
deta
ils.
fFlu
xes
report
ed
are
avera
ge
fluxes
wit
hin
λo
bs
=23.7±
2.3
5µm
inth
ein
div
idualIR
Ssp
ectr
a,to
repro
duce
the
24µm
-MIP
Sband
wavele
ngth
covera
ge.
gT
his
SM
Gre
main
ed
undete
cte
d.
hW
edo
not
report
PA
Hm
easu
rem
ents
for
SM
Gs
wit
hfe
atu
rele
sssp
ectr
aw
ithin
the
rele
vant
PA
Hre
gio
nor
when
PA
Hfe
atu
res
are
mark
edly
ble
nded,
since
rela
tive
fitt
ing
uncert
ain
ties
becom
eunduly
dom
inant.

47
Figure 3.7 Alternate PAH-based redshifts for five individual SMG cases. (Left:) Rest-frame mid-IR spectra of SMM J105227.58, SMM J221733.91, SMM J221806.77,SMM J105151.69 and SMMJ105158.02 assuming rest-frame UV redshifts (C05).(Right:) Rest-frame mid-IR spectra for the same five SMGs with the PAH-basedredshifts. For clarity, we have excluded flux uncertainties, which are presented inFig. 3.2. See §3.4.1 for details.

48
line at z = 2.555 (Swinbank et al. 2004). However, a deeper UV-spectrum, doubling
the S/N , revealed an unambiguous z = 2.865 from multiple absorption features,
consistent with the z = 2.89 found from the IRS spectrum.
Similarly with SMMJ105227.58, the original noisy UV absorption line spectrum
suggested z = 2.142. Subsequent deeper spectroscopy revealed this source to be
z = 2.407 from weak Lyα emission, as well as Civ1549 absorption and emission,
consistent with the PAH redshift.
SMM J221806.77 was identified at z = 3.623 from a single weak emission line in
a relatively sky-free spectral region and corroborated by a red continuum dropping
out in the B band. The PAH-based redshift z = 1.91 suggests that the continuum of
this source is more heavily reddened, and that the rest-frame UV emission feature is
either noise or a superposed line detection from a different galaxy.
SMM J105158.02 was identified at z ∼ 2.2 in the UV through various low S/N ab-
sorption features. An apparent Hα detection consistent with z = 2.239 was proposed
as the true redshift (Swinbank et al. 2004), although a failed attempt to detect CO
gas cast some doubt on the reality of the redshift (Smail et al., in prep). Re-analysis
of a deeper UV spectra reveals a suite of absorption features consistent with z = 2.694
(Siii1260, Cii1335).
Finally, for SMMJ105151.69, an apparent emission line proposed as [Oii]3727 cor-
responding to z = 1.147 is not confirmed in later Keck spectra taken on this galaxy
at a different position angle, and it has now been identified as an emission line galaxy
slightly offset from the radio position. The PAH-based redshift of z = 1.62 is consis-
tent with UV-spectra [Ciii]1909 absorption features and Mgii2800 emission features.
3.4.2 PAH Luminosities and PAH Ratios
The 7.7 µm PAH feature is the most prominent in the mid-IR spectra of star-forming
galaxies and is particularly useful in studying star formation in sources at high red-
shift. We derive PAH luminosities from the integrated line fluxes presented in Ta-
ble 3.2 and we plot these in Fig. 3.8. We find 7.7 µm PAH luminosities for SMGs

49
in the range ∼ 1043–1045 erg s−1 and hence that, as expected from their far-IR lumi-
nosities, SMGs have PAH luminosities that exceed those of local nuclear starbursts
(Brandl et al. 2006) and ULIRGs 10 (Armus et al. 2007) by up to nearly four and two
orders of magnitude, respectively. These PAH luminosities indicate that ∼ 1–5% of
the bolometric luminosity in SMGs escapes in the form of PAH emission. We discuss
the comparison of SMGs and local sources further in §3.4.6.1.
Different PAH emission features arise from distinct bending/vibrational modes of
the PAH molecules (Draine & Li 2007). The different modes can be enhanced relative
to each other as a result of varying PAH ionization state and PAH molecule size.
Exposure to a more energetic radiation field may strip PAH molecules of peripheral
H-atoms. A decrease in the fraction of neutral PAHs would diminish the strength of
the 8.6, 11.3 and 12.7 µm PAH features, which are produced by the in-plane (8.6 µm)
and out-of-plane (11.3, 12.7 µm) C-H bending mode. As a result, the 6.2 and 7.7 µm
PAH features, which are thought to be produced by C-C skeleton vibration (Draine &
Li 2007), would dominate. Within this context, the relative strength of PAH features
can be used to probe the energetics of the underlying radiation field (e.g., Galliano et
al. 2008). The size distribution of PAH molecules may also affect the observed relative
strength of features: smaller PAHs (NC . 103) tend to emit more strongly at 6.2 and
7.7 µm (Allamandola et al. 1989). In the hottest regions close to an AGN, sublimation
of these smaller PAH molecules may result in a suppression of short-wavelength PAH
emission features. Dust extinction has also been shown to play an important role
in explaining the variation in the relative strength of PAH features. In particular,
strong extinction can increase the 7.7/6.2 and 7.7/8.6 PAH ratios (Rigopoulou et al.
1999) due to an ice absorption feature at ∼ 6 µm (which reduces the 6.2 µm PAH
emission, Spoon et al. 2002) and broad silicate absorption at ∼ 9.7 µm which reduces
the strength of 8.6 µm PAH emission in highly extincted sources.
We derive the ratios of the integrated flux in the 6.2, 7.7 and 11.3 µm PAH
features in our sample to investigate the energetics and extinction in the star-forming
10We include NGC 6240, Mrk 1014, UGC 5101, Arp 220, FSC05189−2524, FSC 12112−0305,Mrk 273, FSC 14348−1447, FSC 22491−1808 from Armus et al. (2007).

50
Figure 3.8 The 7.7 µm-PAH luminosities as a function of redshift for the SMGs in oursample. In addition we plot the two SMGs at z ∼ 2.8 from Lutz et al. (2005) and theSMGs from Pope et al. (2008), many of which come from C05. For comparison we alsoplot aperture-corrected low-redshift nuclear starburst-dominated galaxies (Brandl etal. 2006), local ULIRGs from the bright IRAS sample (Armus et al. 2006, 2007) andhigh-redshift mid-IR-selected sources (Sajina et al. 2007). We see that SMGs areamong the most PAH-luminous objects in the universe, with PAH features nearlyfour and two orders of magnitude more luminous than local starbursts and localULIRGs, respectively. This means that the SMG population comprises the mostvigorous star-formation events ever observed. See §3.4.2.
51
environments within SMGs. Fig. 3.9 illustrates that the distribution in values for
the 7.7/11.3 PAH ratio in SMGs is very broad and extends over a similar range
to that of the high-redshift 24µm-selected sources studied by Sajina et al. (2007).
We also compare to the nuclear starburst galaxies from Brandl et al. (2006) and
find that SMGs have a median 7.7/11.3 PAH ratio similar to that of low-redshift
nuclear starbursts (3.7 ± 1.7 versus 3.7 ± 0.9). Such diversity in PAH ratios is also
present in local ULIRGs (e.g., Rigopoulou et al. 1999; Peeters et al. 2004), indicating
that diverse radiation field strengths are found amongst both low- and high-redshift
sources. However, we note that the need for measurable 11.3 µm emission means that
this comparison only includes SMGs at z < 1.6 (Fig. 3.4).
Fig. 3.9 also shows that the bulk of SMGs have 7.7/6.2 PAH ratios that are lower
than both the high-redshift sources in Sajina et al. (2007) and the median value found
for local nuclear starbursts (2.5 ± 1.4 for SMGs versus 5.3 ± 1.7 for the starbursts).
This suggests that an intrinsic difference in either radiation field or extinction exists
between SMGs and low-redshift nuclear starbursts, which results in a suppressed
6.2 µm PAH feature (Rigopoulou et al. 1999) and a relatively prominent 7.7 µm
PAH feature. As we discuss in §3.5.2, we believe that a lesser degree of extinction is
responsible for this behavior in SMGs.
3.4.3 Continuum Slopes
The continuum power-law index αMIR characterizes the steepness of the mid-IR con-
tinuum, although it requires adequate wavelength coverage to be measured reliably. In
Table 3.4 we present the αMIR values for the SMGs whose spectra cover a wavelength
range that extends longwards of the silicate absorption and that we thus consider re-
liable. We find that the SMGs in our sample have a median mid-IR power-law index
of αMIR = 1.3 ± 1.1, typical of the continuum found for star-forming regions. The
individual spectra span a range of power-law indices αMIR ∼ −0.6–2.5. The majority
of our sample, 9/14 SMGs or ∼ 65%, have power-law indices which are characteristic
of star forming regions (αMIR & 0.5). The remaining 35% (5/14) have αMIR . 0.5

52
Figure 3.9 PAH ratios for the SMGs in our sample. We also include PAH ratiosmeasured for a sample of low-redshift nuclear starbursts (Brandl et al. 2006), and high-redshift mid-IR selected sources (Sajina et al. 2007). SMGs have similar 7.7/11.3 PAHratios to these two populations and the distribution of 7.7/6.2 PAH ratios occupiesthe same range as high-redshift mid-IR selected sources. However, SMGs display7.7/6.2 PAH ratios that are in general lower than that of low-redshift starbursts.
more characteristic of AGN-dominated regions (e.g., Deo et al. 2007).
For a subset of our sample (those at z < 1.6) we can also characterize the contin-
uum shape in the SMGs from their S6µm/S12µm colors, which is measured at wave-
lengths devoid of substantial contamination from PAH emission. At 6 µm, the con-
tinuum traces thermal emission from hot (Tdust ∼ 500K) dust, while at 12 µm, the
continuum is dominated by dust heated to lower temperatures (Tdust ∼ 250K). We
find that the 4/7 (∼ 60%, Table 3.4) of the SMGs for which we can determine their
mid-IR colors show red continua (S6µm/S12µm . 0.3, αMIR & 0.5) which resemble the

53
colors of low-redshift star-forming galaxies and the nuclear starburst galaxies pre-
sented by Brandl et al. (2006): S6µm/S12µm ∼ 0.18–0.53. The remaining 40% of this
subsample have bluer continua (S6µm/S12µm & 0.3, αMIR . 0.5), more typical of the
high-redshift mid-IR selected sources of Sajina et al. (2007) with S6µm/S12µm & 0.3.
Taken together, these results suggests that the mid-IR continuum emission in the
two-thirds of the SMGs in our sample has the spectral characteristics associated with
star forming systems locally. The remaining third of the SMGs show more AGN-like
mid-IR continua, although these frequently also display strong PAH emission.
3.4.4 Obscuration as Measured by silicate Absorption
One of the clearest indicators of absorption in the mid-IR arises from intervening
amorphous silicate dust grains. Silicate absorption from the stretching of Si-O bonds
centered around 9.7 µm is the main absorption feature within the wavelength range
considered in this work and is measurable in roughly half of the SMGs in our sample,
those at z < 2.0.
We use the strength of the silicate-absorption feature as a measure of the obscu-
ration along the line of sight to the warm continuum emission, τ9.7µm. We note that
this definition of optical depth assumes that the obscuring material lies in a fore-
ground screen, which is likely to be too naive a model for the complex spatial mix of
absorption and emission in SMGs.
To calculate τ9.7µm for the individual SMGs, we assume that the bottom of silicate
absorption feature is well constrained. However, we stress that since we only detect
faint continuum with S/N . 3 for a number of SMGs in our sample, the values we
derive for the strength of the silicate absorption are likely lower limits (see Table 3.2).
We find a range of optical depths τ9.7 µm ∼ 0.05–1.2 for the SMGs in our sample,
with a median value of < τ9.7µm >= 0.3 ± 0.1. 11 For the composite spectrum, which
benefits from an improved S/N , we find an optical depth of τ9.7 µm = 0.44 ± 0.06.
In Fig. 3.10 we compare the optical depths in SMGs to those of low-redshift nuclear
11Including the SMGs with redshifts from C05 from Pope et al. (2008) extends this range toτ9.7 µm ∼ 1.4.

54
starbursts and ULIRGs and to high-redshift mid-IR selected sources. We find that
the bulk of SMGs have τ9.7 µm values that extend across the range of values covered
by high-redshift mid-IR selected sources, but are typically less than those seen in
local nuclear starbursts or local ULIRGs. This suggests that the SMGs have lower
typical extinction along the lines of sight to their warm continuum emission sources.
We stress that the IRS observations of the local ULIRG sample contain 80–90% of the
star-formation activity in these systems falling in the slit, and hence these differences
in apparent optical depth are not due to comparing galaxy-integrated measurements
for the SMGs to measurements of just the nuclear component in local systems (Armus
et al. 2007).
We also explore in Fig. 3.10 the distribution in τ9.7 µm as a function of the 7.7 µm
PAH luminosity relative to the hot-dust continuum at 6 µm, L7.7/L6. The distribution
in (L7.7/L6)-values for SMGs and low-redshift star-forming galaxies is quite similar
(L7.7/L6 ∼ 0.1 − 0.8), and separates from the mid-IR bright high-redshift sources,
which display lower values (L7.7/L6 . 0.4).
3.4.5 Composite Spectra of SMG subsets
3.4.5.1 Investigating 24 µm Selection Biases
We investigate the differences between 24µm-bright and 24µm-faint SMGs (in the
observed frame) to understand how representative our sample is of the bulk of the
SMG population which have counterparts which are faint at 24 µm. Using the SMGs
within the L8 µm-complete sample described in §3.3.1 (see Fig. 3.5), we construct
mid-IR composite spectra based on 24 µm-brightness: SMGs with S24 µm & 0.4mJy
comprise the 24µm–bright composite, while those with S24 µm . 0.4mJy make up
the 24µm–faint composite (see Fig. 3.11).
We see stronger 7.7 µm PAH emission, as demonstrated by the line’s EW (see
Table 3.3), in the 24µm–faint composite, while the 24µm–bright composite displays a
greater contribution from hot dust continuum. Thus it appears that the strong PAH
emission we see in our SMG sample at z ∼ 2 is not likely to be a result of our use

55
Figure 3.10 A plot of the 7.7 µm PAH luminosity relative to the 6 µm continuumluminosity as a function of silicate optical depth. We include only those SMGs thatprovide sufficient wavelength coverage for reasonable continuum estimates: 10 SMGsfrom our sample and seven SMGs from Pope et al. (2008). Optical depths for localnuclear starbursts (Brandl et al. 2006), local ULIRGs (Armus et al. 2007) and high-redshift 24µm-selected sources (Sajina et al. 2007) are also shown for comparison.The error bar displays the representative uncertainties in these measurements. Thehistogram at the top shows the cumulative distributions for the three samples. We seethat the SMGs display much weaker silicate absorption than local nuclear starburstsand ULIRGs, but proportionally stronger 7.7 µm PAH emission. This suggests thatthe activity in these systems is occurring in less intense environments, even thoughthe SMGs have integrated star-formation rates some four orders of magnitude higherthan the local starbursts.

56
Figure 3.11 (Left:) The composite spectra of the seven 24 µm-bright SMGs (bot-tom) and of the seven 24 µm-faint SMGs (top) within the L8µm-complete sample.(Right:) Composite spectra of the five radio-bright SMGs (top) and of the fiveradio-faint SMGs (bottom) within the L1.4GHz-complete sample. Note that the spec-tra of the individual SMGs that comprise the radio composites are normalized bytheir flux at λ = 7.8 µm. The same flux-scale is maintained for the spectra withineach panel and the dash-dotted line denotes the offset zero level for the 24 µm-faintand radio-faint composites. We see that 24µm-faint composite is significantly morePAH-dominated than the 24µm-bright composite, while the latter displays a strongercontinuum. In the case of the radio-composites, the radio-bright sample displays abroader 7.7 µm PAH feature over a slightly more prominent continuum. The char-acterization of the radio-composite spectra do not reveal any significant differencewithin our measurement uncertainties (see Table 3.3).

57
Tab
le3.
3.C
ompos
ite
Spec
tra
Com
posi
te#
SM
Gs
zm
ed
ia
na
L6
.2b
EW
6.2
cL
7.7
EW
7.7
L11
.3E
W11
.3S6
µm
/S12
µm
αM
IRτ9
.7µ
m
all
22
2.0
00.5
0±
0.0
10.0
5±
0.0
13.5
7±
0.0
50.4
2±
0.0
21.1
6±
0.0
40.1
9±
0.0
20.3
4±
0.0
71.1
7±
0.1
10.4
4±
0.0
6
24um
-Bri
ghtd
72.1
0–
–3.5
1±
0.0
50.3
2±
0.0
1–
––
––
24um
-Fain
te7
2.6
1–
–10.6
7±
0.0
60.6
9±
0.0
1–
––
––
Radio
-Bri
ghtf
53.0
4–
–3.6
7±
0.2
20.1
7±
0.0
4–
––
––
Radio
-Fain
tg5
2.3
8–
–1.9
2±
0.1
10.1
7±
0.0
3–
––
––
Sta
rburs
t-dom
inate
d16
1.9
80.5
9±
0.0
20.0
6±
0.0
15.4
6±
0.1
10.7
0±
0.0
41.8
7±
0.1
50.4
4±
0.1
00.4
1±
0.1
10.4
6±
0.0
70.2
1±
0.0
5
(Xra
y/U
V/opt)
h
Sta
rburs
t-dom
inate
d12
1.9
71.0
2±
0.0
20.0
9±
0.0
25.0
4±
0.1
10.6
3±
0.0
42.0
9±
0.1
20.4
9±
0.0
80.3
6±
0.1
50.4
0±
0.0
60.4
8±
0.1
0
(mid
-IR
)i
AG
N8
2.0
02.3
6±
0.0
8–
3.2
3±
0.1
50.4
2±
0.0
61.6
6±
0.0
90.3
7±
0.0
20.4
6±
0.1
80.5
9±
0.0
80.2
6±
0.0
4
(Xra
y/U
V/opt)
j
AG
N10
2.0
20.7
5±
0.0
3–
4.6
2±
0.1
30.5
2±
0.0
41.5
3±
0.1
00.3
1±
0.0
60.4
4±
0.2
60.5
0±
0.0
60.0
2±
0.0
1
(mid
-IR
)k
aM
edia
nre
dsh
ift
ofSM
Gs
com
pri
sing
com
posi
tesp
ectr
um
.
bPA
Hlu
min
osi
ties
are
expre
ssed
inunit
sof1044
erg
s−1.
Uncert
ain
ties
are
deri
ved
from
the
pro
pagati
on
ofin
tegra
ted
line
flux
uncert
ain
ties
as
dete
rmin
ed
by
our
PA
Hfitt
ing
appro
ach.
An
addit
ional∼
20%
isatt
ribute
dto
flux
calibra
tion
and
conti
nuum
dete
rmin
ati
on.
cPA
Hre
st-fra
me
EW
sare
expre
ssed
inunit
sof[µ
m].
dS24
µm
>0.4
0m
Jy
from
the
8µm
lum
inosi
ty-c
om
ple
tesu
b-s
am
ple
ofSM
Gs
wit
hL8
µm
>1032
erg
s−1
eS24
µm
<0.4
0m
Jy
from
the
8µm
lum
inosi
ty-c
om
ple
tesu
b-s
am
ple
ofSM
Gs
wit
hL8
µm
>1032
erg
s−1
fS1
.4G
Hz
>95µJy
from
the
lum
inosi
ty-c
om
ple
tesu
b-s
am
ple
ofSM
Gs
wit
hL1
.4G
Hz
>2×
1024
erg
s−1
Hz−
1
gS1
.4G
Hz
<95µJy
from
the
lum
inosi
ty-c
om
ple
tesu
b-s
am
ple
ofSM
Gs
wit
hL1
.4G
Hz
>2×
1024
erg
s−1
Hz−
1
hC
om
posi
teofSM
Gs
cla
ssifi
ed
as
starb
urs
t-dom
inate
din
the
rest
-fra
me
opti
cal(S
win
bank
et
al.
2004;Takata
et
al.
2006),
UV
(C05)
and/or
X-r
ay
(Ale
xander
et
al.
2005a)
iC
om
posi
teofSM
Gs
cla
ssifi
ed
as
starb
urs
t-dom
inate
din
the
mid
-IR
,w
ith
EW
7.7
µm
>1
and
αM
IR>
0.5
.See
text
for
deta
ils.
jC
om
posi
teofSM
Gs
wit
hA
GN
signatu
res
inth
eX
-ray
(Ale
xander
et
al.
2005a)
and/or
inth
enear-
IR(S
win
bank
et
al.
2004;Takata
et
al.
2006)
kC
om
posi
teofSM
Gs
wit
hA
GN
signatu
res
inth
em
id-I
R:
EW
7.7
µm
<1
and
αM
IR<
0.5
.See
text
for
deta
ils.

58
of estimated 24 µm-fluxes in selecting our sample, although the prevalence of sources
with strong continuum emission (and hence the contribution from AGN or highly
obscured starbursts) is likely to be higher in our sample than in the general SMG
population.
3.4.5.2 Exploring the Radio Bias
We use the range in radio fluxes covered by our sample (see Fig. 3.1) to investigate
possible intrinsic trends in mid-IR properties associated with radio brightness. We
seek to address potential differences between our sample of radio-identified SMGs
and the . 30% of S850µm & 5mJy SMGs with radio counterparts below the sensi-
tivity of current radio surveys. The lack of a radio counterpart for an SMG may
result from their lying at significantly higher redshifts than the radio-identified pop-
ulation (z 3, C05; Younger et al. 2007). We cannot test this suggestion with our
sample as we have targeted SMGs with known redshifts. However, it has also been
suggested that the radio-undetected SMGs lie at similar redshifts to the dominant
radio-detected population, but that they have somewhat lower IR luminosities and
slightly colder characteristic dust temperatures, a combination which would result in
similar observed 850 µm fluxes (Blain et al. 1999; Chapman et al. 2004). Our radio-
detected sample may therefore be biased towards systems with hotter characteristic
dust temperatures, either due to typically more compact star forming regions or the
presence of an AGN. To investigate this possibility, we divide our sample into radio-
bright and radio-faint SMGs. We first define a luminosity-complete sub-sample of
SMGs based on their rest-frame radio luminosity and use their apparent radio fluxes
to build the composite spectra (see Fig. 3.11).
The radio-faint SMG composite has a narrow 7.7 µm PAH feature that emerges
sharply from the continuum, while the radio-bright composite displays a broader, less
distinct PAH feature. Considering the line-to-continuum parameter (l/c; e.g., Genzel
et al. 1998), traditionally used to gauge the strength of PAH features, the radio-faint
composite displays a higher 7.7 µm–(l/c) relative to the radio-bright composite. This
difference may suggest that the radio-bright composite has a larger obscured AGN

59
contribution, which we perceive in the mid-IR as a broadening of the 7.7 µm PAH
feature, which could ultimately become a continuum-dominated feature at λ ∼ 8 µm,
similar to the spectrum of SMM J163650.43. However, the EWs of the 7.7 µm PAH
feature in these composites are not significantly different within the measurement
uncertainties (see Table 3.3). Therefore, overall our observations do not reveal any
significant difference in mid-IR properties based on radio-luminosity and we conclude
that our radio-detected SMG sample is likely to be representative of the whole SMG
population at z . 3.5.
3.4.5.3 Starburst and AGN-Dominated Composites
The SMGs in our sample have been classified prior to this work as either AGN- or
star-formation–dominated systems using deep X-ray observations (Alexander et al.
2005a), rest-frame optical spectroscopy (Swinbank et al. 2004; Takata et al. 2006)
and/or rest-frame UV spectroscopy (C05). Table 3.4 provides a summary of these
classifications. We construct composites for an AGN and star-forming class based
on these classifications to investigate differences in mid-IR spectral properties (see
Fig. 3.12). Since we do not take mid-IR properties into account to build these com-
posites, the differences are not the result of any mid-IR selection bias.
Both composite spectra display prominent PAH features, but the PAH emission
in the AGN composite spectrum lies on top of a stronger continuum, in comparison
to the star-forming composite: the 7.7 µm PAH feature EW of 0.42 ± 0.06 and
0.70 ± 0.04 respectively reflect this difference. The other possible difference between
these composites is that the AGN composite spectrum has an emission feature at
λ = 10.51 µm, which is much less obvious in the star-forming composite. This feature
may correspond to [Siv] narrow-line emission, which is commonly associated with a
hot starburst or AGN activity (Spoon et al. 2002; Ogle et al. 2006). We note that all
of the individual SMGs in this AGN-composite whose spectra cover the λ ∼ 10.5 µm
wavelength region show what could correspond to [Siv] emission (see Fig. 3.2). Since
the SMGs that make up this composite have AGN signatures in the rest-frame UV
and optical, it is likely that our line of sight has direct access into the broad line

60
Figure 3.12 (Left:) Composite mid-IR spectra of the eight SMGs in the samplewith AGN signatures in the X-ray (Alexander et al. 2005a), optical (C05) or near-IR (Swinbank et al. 2004) (bottom) and of the 10 SMGs with mid-IR spectra thatsuggest the presence of an AGN (top). (Right:) Composite spectra of the 16 SMGsin our sample with no AGN signature either in the X-ray, optical or near-IR (bottom)and of the 12 SMGs with mid-IR spectra dominated by strong star-formation activity.We see that the AGN-composites display an enhanced continuum relative to the star-forming counterparts. We also note that the AGN-composite with AGN signatures atwavelengths other than the mid-IR (bottom left panel) displays a prominent emissionfeature, likely corresponding to [SIV] emission from an AGN. See §3.4.5.3 for details.

61
region. Thus it is also possible that this feature corresponds instead to solid silicate
emission from very near a central AGN.
In Fig. 3.12 we show the composite spectra for AGN- and starburst- subsets, based
this time on their mid-IR classifications. We classify SMGs with EW7.7 µm & 1 or
steep mid-IR continua (S6 µm/S12 µm . 0.3) as star-formation–dominated systems;
SMGs with EW7.7 µm . 1 or flat mid-IR continua (S6 µm/12 µm & 0.8 or αMIR . 0.5)
are classified as having a significant AGN contribution (see Table 3.4). Both of these
composites display an enhanced underlying continuum, relative to their respective
composite counterparts based on AGN signatures at other wavelengths. This is most
likely due to the need to have moderate mid-IR emission for an object to be classifiable
in the mid-IR. However, there is one notable difference between the two mid-IR
classified spectra: Fig. 3.12 shows that the 6.2 µm PAH feature appears to have been
diluted by the enhanced continuum in the AGN composite.
3.4.6 The SMG Spectrum
With more than∼ 80% of the individual SMGs in our sample displaying PAH features,
unsurprisingly the composite spectrum in Fig. 3.4 displays prominent PAH emission.
Using our large sample of SMGs covering a wide redshift range, we explore composite
spectra of SMGs in three redshift bins: low (z ≤ 1.6), intermediate (z = 1.6–2.4)
and a high (z ≥ 2.4); see Fig. 3.4. The SMGs in the low-redshift bin dominate the
composite spectrum at λ & 10 µm. All three redshift composites display strong
7.7 µm PAH emission and a prominent 8.6 µm feature. With increasing redshift we
observe a broadening of the 7.7 µm PAH feature and a weakening of the 6.2 µm PAH
feature. The increase in scatter around the median composite spectrum indicates
either a more diverse range in spectral properties at the higher redshifts, or poorer
S/N . However, we note that the three composites display an increase in continuum
level with redshift. Within the context discussed in §3.4.2, the weakening of the
observed 6.2 µm PAH emission feature may be an indication that SMGs at higher
redshifts suffer from either increased extinction, hampering detection of PAH emission

62
features at the shorter wavelengths, or from a systematic hardening of the radiation
field that the PAH molecules encounter.
3.4.6.1 Comparison to Local Templates
In Chapter 2 (Menendez-Delmestre et al. 2007) we found that the composite spec-
trum is well fit by a starburst-like template (represented by M82) with an additional
continuum component, likely arising from an AGN (see Fig. 2.1). We found that the
mid-IR spectral features of SMGs are more comparable to those of the M82 star-
burst, than to other well-studied local ULIRGs, such as Arp 220 and Mrk 1014. We
now consider our complete sample of 24 SMGs.
The mid-IR composite spectrum of the SMGs in our sample is reasonably well
fit at λ . 10 µm by the composite spectrum of nearby nuclear starburst-dominated
galaxies (Brandl et al. 2006; see Fig. 3.13). By using this more diverse starburst
template, we seek to better represent the diversity in continuum slopes and PAH
strengths in starburst-dominated galaxies in the local Universe.
The PAH component of the SMG composite spectrum is well represented by a
starburst template, but we find that an additional power-law continuum remains
necessary to describe the overall composite spectrum: at the longer wavelengths,
λ & 10 µm, the starburst template fails to match the continuum level (see Fig. 3.13).
This continuum component may be associated with AGN activity or an additional
starburst continuum component. To quantify this we characterize the red continuum
in the composite SMG that is unaccounted for by the starburst template by fitting a
power-law to the (SMG composite − starburst-template) residuals. We find that the
residuals are best fit by a power-law Fν ∼ ν−αMIR , where αMIR = 1.97± 0.22. In the
next section we estimate an upper limit to the contribution from an AGN, making
the conservative assumption that all of the additional continuum component arises
from a dust-enshrouded AGN.

63
Tab
le3.
4.A
GN
and
Sta
rburs
tSig
nat
ure
sin
Rad
io-I
den
tified
SM
Gs
SM
MJ
αM
IRa
S6.0
/S
12.0
X-r
ayb
UV
cH
αm
id-I
RC
om
men
t
030227.7
32.0
8±
0.1
10.2
4±
0.1
2–
SB
AG
Nd
,ein
tα
MIR
>0.5
,E
W7.7
µm
<1
030231.8
1–
––
SB
––
undet
ecte
d105151.6
90.0
7±
0.2
20.9
6±
0.4
8–
SB
–in
tα
MIR
<0.5
,E
W7.7
µm
<1
105158.0
2–
––
SB
SB
dSB
?st
rong
PA
Hem
issi
on
above
fain
tco
ntinuum
105200.2
21.7
6±
0.1
10.3
0±
0.1
4–
SB
–SB
αM
IR>
0.5
105227.5
8–
––
SB
–in
tE
W7.7
µm
<1
105238.1
9–
––
SB
–SB
EW
7.7
µm
>1
105238.3
0–
––
AG
N–
AG
NE
W7.7
µm
<1,co
ntinuum
-dom
inate
d123549.4
4–
–A
GN
SB
intd
/A
GN
ein
tE
W7.7
µm
<1
123553.2
6−
0.7
5±
0.5
0–
SB
SB
–A
GN
αM
IR<
0.5
,E
W7.7
µm
<1,co
ntinuum
-dom
inate
d123707.2
12.4
6±
1.3
–A
GN
SB
SB
ein
tE
W7.7
µm
<1
123711.9
8−
0.1
0±
0.3
0<
1.0
7A
GN
SB
–in
tα
MIR
<0.5
,E
W7.7
µm
>1,fa
int
continuum
123721.8
70.2
2±
0.3
3<
0.8
6A
GN
AG
NSB
ein
tE
W7.7
µm
<1,α
MIR
<0.5
163639.0
12.2
0±
0.3
2<
0.2
2–
SB
SB
d /in
tein
tE
W7.7
µm
<1,α
MIR
>0.5
163650.4
3–
––
int
AG
Nd
,eA
GN
Abso
rbed
continuum
163658.7
82.0
7±
0.3
20.2
4±
0.0
6–
SB
–SB
αM
IR>
0.5
,E
W7.7
µm∼
1221733.0
2−
0.6
2±
0.4
5–
–SB
SB
ein
tα
MIR
<0.5
,pro
min
ent
7.7
µm
PA
Hfe
atu
re221733.1
21.2
6±
0.2
5–
–SB
–SB
αM
IR>
0.5
,pro
min
ent
11.3
,12.7
µm
PA
Hfe
atu
res
221733.9
10.8
4±
0.7
2–
–SB
SB
din
tα
MIR
>0.5
,E
W7.7
µm
<1
221735.1
5–
––
SB
––
EW
7.7
µm
<1,fa
int
continuum
221735.8
4–
––
SB
––
7.7
µm
PA
Hfe
atu
reabove
fain
tco
ntinuum
221737.3
9–
––
SB
AG
Ne
AG
Nfe
atu
rele
ss,co
ntinuum
-dom
inate
d221804.4
2–
––
SB
–SB
?E
W7.7
µm
>1,fa
int
continuum
221806.7
7−
0.3
9±
0.3
5–
–SB
–in
tE
W7.7
µm
<1,α
MIR
<0.5
aW
ere
port
mid
-IR
colo
rsfo
rSM
Gs
with
wavel
ength
cover
age
λrest∼
6–12µm
.
bFro
mA
lexander
etal.
(2005a)
cFro
mC
05
dFro
mSw
inbank
etal.
(2004)
eFro
mTakata
etal.
(2006)

64
3.4.7 The AGN Contribution to the Bolometric Luminosity
in SMGs
Hard X-ray emission provides one of the most direct routes to estimate the luminosi-
ties of AGN. However, in the presence of high column densities, such as are found
for SMGs (NH ∼ 1023–1024 cm−2; Alexander et al. 2005a,b), hard X-ray photons may
be completely absorbed. In these difficult cases an alternate probe for AGN emis-
sion is to trace the mid-IR emission from hot dust near the AGN. The mid-IR thus
provides a complementary insight into a deeply obscured AGN (Sturm et al. 2006;
Lutz et al. 2004). In particular, Krabbe et al. (2001) show that the 10.5 µm-flux is
tightly correlated with the moderately hard X-ray emission, S2−10keV, both in Seyfert
and in starburst galaxies, which have markedly distinct mid-IR slopes. We use the
derived correlation for Seyfert galaxies to estimate the X-ray luminosity of the AGN
component in the SMG composite spectrum and thus estimate the AGN contribution
to the bolometric luminosity of SMGs.
The composite spectrum includes a power-law continuum, Sν ∼ ν−αMIR , with
spectral slope αMIR = 1.97 ± 0.22 (see Fig. 3.13). From the 10.5 µm continuum flux
we infer an X-ray luminosity, LX ∼ 8 × 1043 erg s−1, for the SMGs in our sample at
< z >∼ 2.0. Encouragingly, this estimate is in close agreement with the absorption
corrected rest-frame 0.5–8 keV X-ray luminosities found for the SMGs in the Chandra
Deep Field (Alexander et al. 2005a), < LX >= 5 × 1043 erg s−1. To assess the
contribution of the AGN to the energetics of the SMGs we first estimate the far-
IR luminosities of the SMGs using the observed radio–far-IR correlation for SMGs
(Kovacs et al. 2006), yielding an average far-IR luminosity of LIR ∼ 5 × 1045 erg s−1.
We then use the approach of Alexander et al. (2005a) and Menendez-Delmestre et
al. (2007), adopting the X-ray-to-FIR luminosity ratio typically found for quasars
(LX/LIR ' 0.05; Alexander et al. 2005a) to estimate that the AGN in SMGs
contribute LIR ' 1.6 × 1045 erg s−1, or . 35% of the SMG’s far-IR luminosities.
As discussed earlier, due to the biases towards including mid-IR bright SMGs in our
sample, it is likely that the AGN contribution estimated here is biased high. It is also

65
very likely that some fraction of this red continuum arises from dust emission heated
by very deeply enshrouded starbursts in these SMGs and so we claim this as a firm
upper limit to the AGN contribution in typical SMGs.
With an SMG composite dominated by PAH features, it is clear that the bolo-
metric luminosity of SMGs is in general dominated by star formation. However, the
individual mid-IR SMG spectra display modest variation in AGN contribution and
in some cases reveal the presence of an AGN that remains invisible at other wave-
lengths (see Table 3.4). In particular, there is evidence that SMMJ123553.26 is a
Compton-thick AGN: it is undetected in the X-ray but is bright and dominated by
continuum emission in the mid-IR and displays no mid-IR signatures of star formation
(see Fig. 3.2). Extrapolating from its mid-IR spectrum, we estimate a hot dust lumi-
nosity 12, L6µm ∼ 2.0× 1045 erg s−1. Following the procedure described by Alexander
et al. (2008b) we use the 0.5–2 keV observed luminosity for SMM J123553.26 (Alexan-
der et al. 2005a) to derive a rest-frame 1.6–24.8 keV luminosity, which we convert to
an intrinsic X-ray luminosity, L2−10keV < 2×1042 erg s−1, assuming an X-ray spectral
index, Γ = 1.4. On the basis of the X-ray-to-6µm luminosity ratio of this SMG, we
find that it lies significantly below the X-ray-to-6µm luminosity relationship found
for nearby AGN, suggesting that this source hosts a luminous Compton-thick AGN
(e.g., Alexander et al. 2008b). However, we note that this SMG lies very close to a
number of mid-IR bright sources, which complicates the deblending of the individual
flux contributions in MIPS 24 µm imaging (Hainline et al. 2009). We detect only a
single source in the IRS 2D spectrum. While this coincides with the position expected
for SMM J123553.26, it remains possible that the measured mid-IR flux of this source
does not correspond to the X-ray source.
3.4.8 Comparison to SMGs in Other Samples
With a sample of 23 detected SMGs in this work, plus nine from Valiante et al.
(2007) and 13 from Pope et al. (2008), we have statistics to allow an adequate eval-
12ν Lν = 4πD2LS6µm × ν6µm/(1 + z)

66
Figure 3.13 The composite spectrum of 22 SMGs detected in our sample as shownin Fig. 3.4. The dashed curve is the mid-IR composite spectrum of 13 starburst-dominated low-redshift galaxies from Brandl et al. (2006), scaled down to matchthe SMG composite spectrum at 7.7µm. The dash-dotted line is the power-lawcomponent (νSν ∼ ν−α, αMIR ∼ 1.97) that best represents the continuum in thecomposite SMG that is unaccounted for by the starburst template. See § 3.4.7 fordetails.

67
uation of the mid-IR properties of the SMG population as a whole. The majority
of SMGs display dominant PAH features atop an underlying power-law continuum,
that potentially arises from an AGN.
Together with results published in parallel mid-IR studies (Lutz et al. 2005;
Menendez-Delmestre et al. 2007; Valiante et al. 2007; Pope et al. 2008), we are
uncovering the range in mid-IR properties present within this galaxy population:
mid-IR spectra that correspond to dominant starbursts, with varying AGN con-
tributions to their bolometric luminosity. We find only one clear example of a
continuum-dominated source with a prominent broad feature centered at λ ∼ 8 µm,
SMM J163650.43 (Menendez-Delmestre et al. 2007). Three other SMGs in our sample
display featureless continuum-dominated spectra (SMMJ105238.30, SMM J123553.26,
and SMM J221737.39). In the sample of nine detected SMGs presented by Valiante et
al. (2007) and Lutz et al. (2005), SMMJ02399-0136 displays PAH features overlaying
a particularly strong continuum, and is thus classified as a source powered by equal
contributions of star formation and a Compton-thick AGN (Valiante et al. 2007). Out
of the 13 SMGs in the GOODS-North field, SMM J123600.15 (C1; Pope et al. 2008)
also displays PAH features on a steeply rising continuum and is classified as an SMG
with a 44% AGN contribution to the bolometric luminosity.
We note that 25% of the SMGs in our sample lie at redshifts z . 1.2, which is a
redshift range not covered by the other SMG mid-IR studies. This extension to lower
redshifts provides us with an extended insight into the longer mid-IR wavelengths,
λ & 11.5 µm, for a crucial comparison between SMGs and potential local analogs.
This longer wavelength coverage is also very useful for constraining better the mid-IR
continuum in these sources, and so for measuring features such as the 9.7 µm silicate
absorption.
To determine explicitly the effect of including these longer wavelengths, we recalcu-
lated our results considering only the composite spectrum shortwards of λ = 11.5 µm.
In this case, we find that the composite spectrum of the SMGs in our sample is well fit
by the starburst template from Brandl et al. (2006) with an additional shallower con-
tinuum (αMIR ∼ 0.94± 0.31), which translates into a . 30% AGN contribution. This

68
Figure 3.14 (Left:) The integrated flux of the 7.7 µm PAH feature as a function ofnarrow-line Hα flux for SMGs in our sample and for local galaxies. The Hα fluxes arecorrected for extinction, typically by a factor of 2–3. Hα fluxes for the low redshiftstar-forming galaxies are taken from Armus et al. (1989), Heckman et al. (1990),Veilleux et al. (1999), Buat et al. (2002) and Lira et al. (2002). An uncertainty of∼ 10% is associated with the fluxes of the 7.7 µm PAH features for the low-redshiftsystems and this uncertainty is smaller than the points in the graph. The dottedline represents a simple best linear fit for both the low- and high-redshift samples,demonstrating the clear correlation between these parameters. We see that PAHintegrated fluxes correlate well with narrow-line Hα and that SMGs extend the localrelation out to the PAH- and Hα-bright region. (Right:) PAH luminosities as afunction of IR luminosity for the SMGs in our sample and for those in Pope et al.(2008) and Lutz et al. (2005). We use total IR luminosities from C05, correctedby approximately a factor of two, following Kovacs et al. (2006). We also includeaperture-corrected PAH luminosities of low-redshift nuclear starbursts (Brandl et al.2006) and local ULIRGs (Armus et al. 2007). The dotted line shows a simple bestlinear fit to local nuclear starbursts. The error bar represents the typical uncertaintiesin the observations.

69
power-law index is significantly lower than that corresponding to the best power-law
fit determined for the full composite spectrum in Fig. 3.13, αMIR = 1.97± 0.22. The
AGN contribution derived for the short-wavelength SMG composite is in agreement
with the results of Pope et al. (2008), where the redshift range of the SMGs studied
is restricted to z & 1.2.
3.5 Discussion
We compare the mid-IR properties of the SMGs in our sample with those of starburst-
dominated low-redshift galaxies (Brandl et al. 2006), select local ULIRGs from the
Bright IRAS sample (Armus et al. 2006, 2007) and the mid-IR selected sources of
Sajina et al. (2007). We use PAH luminosities, PAH relative intensities, the steepness
of the continuum and the strength of silicate absorption to compare the level of star-
forming activity, the energetics in radiation environments and the distribution of cold
and warm dust in these galaxies.
SMGs have among the most luminous PAH emission of any population in the
universe, displaying levels of activity which are unseen in local samples (Fig. 3.8).
This result reflects the significant increase in star-formation activity in the high-
redshift SMG population which underpins the thousand-fold increase in the space
density of ULIRGs out to z ∼ 2 (C05). A similar increase in PAH luminosity has
been seen by Desai et al. (2007), who investigated the strength of the 6.2 µm PAH
feature in ULIRGs at low and intermediate redshifts (z . 1) and found that ultra-
luminous sources at high redshift have PAH EWs larger than any present in the local
Universe.
We find that PAH luminosities display no dependence on continuum slope or
continuum mid-IR color. Hot dust located close to an AGN would contribute to an
enhanced continuum emission at the shorter mid-IR wavelengths (λ . 10 µm), and
so we associate mid-IR spectra displaying flatter continua with the likely presence of
an unobscured AGN. The presence of large PAH luminosities in SMGs with a flat
mid-IR spectrum suggests that even in the presence of an AGN, PAH molecules are

70
abundant in these galaxies. Under the PAH destruction scenario (see Voit 1992),
highly energetic photons from an AGN overcome the PAH binding energy, deplete
the population of PAH molecules and thus reduce the observed PAH luminosity.
Rather than a decrease in PAH luminosity, we find that SMGs with flatter continua
generally have lower PAH EWs. Similar results have been recently discussed in the
context of low-redshift ULIRGs by Desai et al. (2007), where a decrease in EWs
for the 6.2 and 11.3 µm PAH features is observed with increasing 24 µm rest-frame
luminosity. Together with these results, our findings suggest that an increase in the
dust continuum dilutes the prominence of PAH features with respect to the local
continuum. Our study allows us to extend the validity of this PAH-dilution scenario
out to the higher redshifts of SMGs.
3.5.1 PAH Luminosities as a Star-Formation Rate Indicator
In Fig. 3.14 we compare the strength of the observed PAH features with familiar SFR
indicators: Hα and the total IR-luminosity (Kennicutt 1998). In the past, authors
have explored the use of the mid-IR light as a measure of galaxy SFRs. Elbaz et
al. (2002) claim that the flux measured in the 6.75 µm ISO band is related to the
total IR luminosity, which in the absence of an AGN is taken to be a good tracer of
star-forming activity (Kennicutt 1998). Roussel et al. (2001) and Forster Schreiber
et al. (2004) showed that there exists a correlation between ISO 6.75 µm light and
Hα luminosity in local spirals and starburst galaxies. With the advent of much more
sensitive Spitzer 8 µm IRAC results, Wu et al. (2005) and Alonso-Herrero et al. (2006)
confirmed that the 8 µm band flux is closely associated with the star formation taking
place in low-redshift (z . 0.2) luminous infrared galaxies with L8−1000 µm < 1012 L.
The interest in using the 7.7 µm PAH emission as a SFR indicator is that with
it we are able to remove the continuum contribution to the 8 µm band, which in
the presence of an AGN may be substantial and even dominant (see for example
the continuum-dominated SMGs in Fig. 3.2: SMMJ123553.26, SMM J163650.43 and
SMM J221737.39). We find that the 7.7 µm PAH flux in SMGs correlates with the
71
extinction-corrected Hα flux (see Fig. 3.14). We emphasize that even though the same
UV stellar radiation field is the source of excitation for the Hα and the PAH emission
features, the excitation processes are quite distinct: Hα emission arises from ionized
gas surrounding young O stars, while PAH emission is produced by the stochastic
heating of very small dust grains (Draine & Li 2007). It has been further shown that
PAHs can still be excited by the longer-wavelength photons of B stars. Therefore,
even though the apparent correlation does not have a physically trivial explanation,
it suggests that PAH emission can indeed be used as a tracer of recent star formation.
We do not find any correlation between PAH EWs and the Hα luminosities: SMGs
with low EWs may also display luminous Hα emission. This suggests that even
for SMGs with a significant AGN mid-IR contribution high SFRs are inferred. We
note that the use of Hα as a SFR indicator is vulnerable to uncertainties, even if
it has been corrected for extinction using the Hβ/Hα Balmer decrement (Takata et
al. 2006). Additional extinction, unaccounted for by the Balmer decrement, may
be present and thus remains a caveat. Indeed, as we show in the next section, the
degrees of extinction (AV ) estimated for the mid-IR emission in SMGs are significantly
higher than measured from the Balmer decrement, as the latter only measures the
extinction to regions which are detectable in Hα, with the most extincted regions not
contributing at all.
3.5.2 Dust Distribution in SMGs
The range in silicate optical depths we find in SMGs, τ9.7µm ∼ 0.05–1.5, falls below
the typical values reported for both local ULIRGs and AGNs (< τ9.7 µm >∼ 1.5;
Shi et al. 2006; Hao et al. 2007). Recent work by Desai et al. (2007) measured the
strength of silicate-absorption features in a large sample of low-redshift ULIRGs from
the Bright IRAS Sample to find that cold ULIRGs, with the steeper mid-IR spectra
S25µm/S60µm . 0.2, have deeper silicate-absorption features than warm ULIRGs, with
S25µm/S60µm & 0.2. We find that SMGs have τ9.7µm values close to that of warm
ULIRGs, such as IRAS FSC05189−252, and to the median value found for star-

72
forming low-redshift galaxies (<τ9.8 µm >= 0.24 ± 0.10; see Fig. 3.10). Our observed
silicate optical depths correspond to a median visual extinction of AV ∼ 6, assuming
AV = (18± 2)× τ9.7 µm (Draine 2003).
The strength of the silicate feature can provide insight into the distribution of
dust along the line of sight. The strong silicate absorption measured for cold low-
redshift ULIRGs can be explained by a small, deeply embedded source with large
amounts of obscuring dust along the line of sight (Levenson et al. 2007). Shallower
silicate-absorption features and the presence of silicate emission, such as found in
both the high-redshift mid-IR-selected sources presented by Sajina et al. (2007) and
in cold low-redshift ULIRGs suggest that in the mid-IR there is a direct view to the
hot thermal continuum source, possibly through a clumpy obscuring medium.
The observed 7.7/6.2 PAH ratios of the SMGs (Fig. 3.9) are also significantly
lower than those seen in local nuclear starburst and ULIRG populations. This ratio
is potentially sensitive to ionization and reddening, with softer radiation fields and
lower obscuration leading to lower 7.7/6.2 ratios. When taken with the differences
in silicate absorption, both these results can be explained by a single cause: lower
extinction towards the mid-IR line and continuum emitting regions within SMGs,
compared to either local nuclear starbursts or ULIRGs. These latter populations
are dominated by star-formation activity in highly compact regions and the lower
extinction in the SMGs suggests the mid-IR visible star formation in these galaxies
is likely to occur in a more extended component, more similar to the activity in the
disks of “normal” star-forming galaxies in the local Universe.
Evidence for extended star formation within SMGs has also been found at other
wavelengths. High-resolution MERLIN/VLA observations of two samples of SMGs
have revealed radio morphologies extending out to ∼ 1′′ or ∼ 8 kpc in size (Chapman
et al. 2004; Biggs & Ivison 2008). These two studies find that ∼ 85% of the combined
sample of 24 SMGs have extended radio emission, while only ∼ 15% appear to be
dominated by an unresolved component. Adopting radio emission as a proxy for far-
IR emission, these results suggest that massive star formation is occurring on ∼ 5 kpc
scales within SMGs. This is in contrast to results for local ULIRGs, where the far-IR
73
emission is confined to a compact nuclear region of ∼ 1–2 kpc in size (Charmandaris
et al. 2002). Further evidence for physically extended star formation within SMGs
has come from studies of their rest-frame optical emission lines. Swinbank et al.
(2006) mapped Hα emission from eight SMGs with integral field spectroscopy and
found Hα structures extending to 1–2′′ or ∼ 8–16 kpc in size. These results differ,
however, from the extent of molecular gas emission in SMGs: sub-arcsecond resolution
millimeter imaging of CO emission from six SMGs with the IRAM Plateau de Bure
Interferometer suggests compact warm gas distributions in these galaxies, with sizes
. 2 kpc (Tacconi et al. 2006, 2008). These observations typically target the high-J
CO transitions, which trace warm and dense gas, so it remains possible that there are
more extended reservoirs of cold gas on 2 kpc scales within these systems which
could fuel their extended star formation. Our mid-IR results give further evidence
towards a more extended distribution of the star-forming regions in SMGs, in contrast
to the compact nuclear starbursts seen in similarly luminous local galaxies.
3.6 Conclusions
SMGs are an enigmatic population which have been proposed to undergo a tremen-
dous amount of star-forming activity, in order to explain their ultra-luminous infrared
emission. The high stellar masses and SFRs inferred for these galaxies have prompted
the idea that SMGs are the likely progenitors of today’s most massive galaxies. How-
ever, the contribution from AGN activity to the bolometric luminosity has remained
a caveat to these results. We present the largest sample of SMGs observed in the
mid-IR with Spitzer IRS. Our main results are:
1. At the individual level, we find that 80% of SMGs in our sample display strong
PAH features, with L7.7µm ∼ 1043–1045 erg s−1. This confirms for a large sample of
SMGs that this is a population undergoing intense star formation, including some of
the most intense star-formation events ever witnessed in the Universe.
2. We find only three cases of SMGs with continuum-dominated spectra (12%
of our sample), which indicates that even though SMGs appear to be starburst-
74
dominated as an ensemble, some diversity is present within the sample.
3. We find that SMGs have a spread in optical depths as measured by the strength
of the silicate absorption feature at λ ∼ 9.7 µm. However, the mean value is signif-
icantly less than local ULIRGs or low-redshift nuclear starburst-dominated galaxies.
This difference suggests that SMGs have lower dust obscuration to their mid-IR con-
tinuum emitting regions than local ULIRGs.
4. Comparison of PAH flux ratios, S7.7µm/S11.3µm, suggests that SMGs host similar
radiation environments to local star-forming galaxies. However, the S7.7µm/S6.2µm
PAH ratio is lower in SMGs than in local nuclear starbursts or ULIRGs. This can
most easily be explained if the extinction to these regions is lower in SMGs than in
the local populations.
5. Our composite SMG spectra allow us to make more reliable measurements of
the potential AGN contribution as revealed by an enhanced hot-dust continuum at
λrest ∼ 10.5 µm. We make conservative assumptions regarding the AGN contribu-
tion and find that the relative contribution of an AGN with respect to star-formation
activity remains low. With a maximum AGN contribution of . 35% to the total lu-
minous output, SMGs are clearly a galaxy population dominated by intense starburst
activity.
6. We conclude that the detailed mid-IR spectra of SMGs show several differences
with either local ULIRGs or nuclear starbursts. These differences can be most easily
explained by a difference in the extinction to the mid-IR continuum and line emitting
regions of these galaxies, with the SMGs showing systematically lower extinction.
Given the compact geometry of the mid-IR emission from local ULIRGs, the difference
in extinction we see argues that the mid-IR emission in SMGs, both continuum and
PAH-emission, arises in a more extended component ( 1–2 kpc). This supports
radio and Hα studies which indicate that star formation in SMGs is extended on
scales of ∼ 5 kpc, far larger than seen in local ULIRGs.
Acknowledgements We thank Alexandra Pope, Elisabetta Valiante, Anna Sajina
and Bernard Brandl for facilitating results and/or reduced spectra of their Spitzer

75
samples for proper comparison to our galaxies in this work. We are also grateful to
Laura Hainline, Patrick Ogle, Vandana Desai and James Geach for helpful discus-
sions.