chapter 3 geographical profile of the …shodhganga.inflibnet.ac.in/bitstream/10603/40603/8/12...48...
TRANSCRIPT

48
Chapter 3
Geographical Profile of the Ambedkarnagar District
3.1 Historical Background
The district of Ambedkarnagar was formed from the Faizabad district by the
then Chief Minister Ms. Mayawati on September 29, 1995. The district was named
Ambedkarnagar in the memory of the father of the Indian constitution, Dr. Bhim Rao
Ambedkar for his work done for the upliftment of the depressed classes, women and
other weaker sections of the society.
3.2 Physical Setting
3.2.1 Location and Boundary
Ambedkarnagar district is located on the North-Eastern part of Uttar Pradesh.
It lies between 26o 09‟ N to 26
o 40‟ N latitudes and 82
o 12‟ E to 83
o 05‟ E longitudes.
It is bounded on the north by Basti and Sant Kabir Nagar districts, on the north-east
by Gorakhpur district, on the south by Sultanpur district, on the west by Faizabad
district and on the east by Azamgarh district (Fig. 3.1). The district has a total area of
2,361 km2 and having a population of 20,26, 876. The total length of the district from
east to west is approximately 75 km and the breadth from north to south is about 42
km.
Administratively, district have four tehsils (sub-divisions) namely, Akbarpur,
Tanda, Alapur, Jalalpur. The district is divided into nine development blocks namely
Akbarpur, Katehri, Bhiti, Tanda, Baskhari, Ramnagar, Jalalpur, Jahangirganj and
Bhiyaon (District Planning Map, 2005).
3.2.2 Relief and Structure
The district of Ambedkarnagar forms a part of the central Ganga basin. There
are many opinions regarding the age of this basin. According to Edward Suess, it is a
fore deep formed in the front of the resistant mass of the peninsula when the Thythyan
sediments were thrusted southward and compressed against them.

49
Source: NATMO, New Delhi, 2010.
Fig. 3.1: Study Area

50
In another view it is a sag in the crust formed between northward drifting
Indian continent and the comparatively soft sediments accumulated in the Tythyan
basin when the latter were crumpled up and lifted up into mountain system (Krishnan,
S.S., 1915). Sir Sydney Burrad (1915), considered it to be a rift valley bounded by
parallel faults on either side. Another view, at present, is that it has been formed by
buckling down of northern border of the peninsular shield beneath the sediments
thrust over it from the north. Stratigraphically, the Ganga basin is built up of layers of
sands and clays filling up a deep depression between the peninsula and the Himalayas.
These bodies of sands and clays were deposited directly on the eroded surface of
Bundelkhand Granitic Basement, which in recent times has been designated as the
Faizabad High.
As far as the thickness of the sediments overlying the Ganga basin is
concerned, different estimations have been made. Oldham estimated the depth of
sediments in Ganga basin between 4,000-6,000 metres, and Burrad considered it 32
km. Based on the investigation by Oil and Natural Gas Commission through
aeromagnetic, ground magnetic and deep wells and structural wells drilled at different
places, the depth of sediment varies from place to place. The Sharda and the Gandak
depression have more than 6,000 metres deep sediments overlying the Vindhyan
formation.
Geologically, the alluvium deposits have been categorized as Khadar and
Bhangar. The Khadar land or newer alluvium is confined to terraces of flood plains
of rivers and their tributaries. They are light in colour and poor in calcareous matter
and composed of chiefly sand, silt and clay. However, the bhangar lands or older
alluvium are the level plain above the flood plain of rivers. The most important
material in bhangar land is clay which at some places becomes loam or sandy loam.
3.2.2.1 Relief Features
Generally, the district consists of a level plain of uniform character. The
variation in flatness is caused by various rivers, streams and drainage channels which
flow along the length of the district from north-west to south-east. Numerous small
depressions (Jhils or lakes) without any natural outlet are found scattered all over the
district (fig. 3.2).
On the basis of its physical appearance the district may be divided into two
units - the lowlands and the uplands.

51
The Lowland
The lowlands, which are locally known as Manjha, consist of alluvial deposits
of Ghagra river. The extension of the land is not continous but broken in nature. Their
width varies and is narrow along the northern boundary of Jahangirganj and
Ramnagar blocks and rather extensive along the northern boundary of Baskhari and
Tanda blocks.
The lowlands are bounded by high bank of river Ghagra which is at most
places, clearly defined but fluctuates north and south as a result of erosion and
deposition. This is marked by a large stretch of wasteland in which the thick growth
of Jhao, Tamarisk, and Kaseri provide shelter for wild animals.
Source: NATMO, New Delhi, 2010. Fig. 3.2
The Uplands
Beyond the lowland lie the upland or Bhangar and remain mostly unaffected
by the annual floods. The uniformity of the land is broken by the presence of
numerous lakes, tals (ponds), and tributaries of Ghagra namely Tons-Majohi system.

52
Some patches of usar (saline and alkaline soils) lands are also found in the Tanda and
Bhiti blocks.
3.2.3 Drainage System
The study area has a number of rivers and streams, which follows the general
slope of the land and run from west to east. The principal rivers are the Ghagra, Tons
and Majohi. The Ghagra has its source in snowy peaks in Himalayas while the other
rivers originate from lakes in the plains. The streams of the area are seasonal in nature
and their discharge varies from nothing in hot season to the hundred of cubic metres
per second during rainy seasons. Some important rivers of the district are as:
The Ghagra
It is the main river of the region, and is also known as Sarju or Saryu. The
river rises in Himalayas and enters the Ganga plain where it is known as Karmali. The
river forms a natural boundary with the districts, which are situated at the north border
of the Ambedkarnagar district. Tanda, Jahangirgarj, Ramnagar and Baskhari blocks
are situated at this river and these blocks are fully utilizing the water resource of the
river (Fig. 3.3).
The volume of the water in the river varies from season to season. During the
rainy season, the river attains immense size and floods considerable area, causing
much damage to life, property and standing crops. In the older days, the Ghagra was
the principal waterway of the district but the construction of permanent bridges on the
river and an increase in road transport facilities, the river is no more used for bulk
transportation of goods and population. The Ghagra does not have any important
tributary in the district and receives water from various minor streams.
The Tons
River Tons is the second important river of the district and consist of two
streams i.e. Murha and Bisui. Both join each other near Haripur, a village in Katehri
block of the district. The Murha originates from a lake near Rudauli in Barabanki
district and the Bisui, the southern feeder of the system, has its source of origin in the
district of Sultanpur. The chief tributary of the Tons is Majohi which originates from
a depression in the district and flows eastwards to join the main river in the district of
Azamgarh (Fig. 3.3)
Lakes
There are numerous large and small lakes spread over the district. These lakes
may be divided into two classes on the basis of their origin. First, there are some lakes

53
which have originated on account of meandering action of rivers but most of them are
connected with the rivers by small channels.
The second type of lakes consists of those depressions which are connected
with the rivers in which water collects during rainy season, often flooding the
surrounding areas. The remaining lakes are of independent nature without any outlet.
Main lakes in the district are Devhat and Hanswar lakes situated in Baskhari block
and Darvan in Katehri block. These lakes are used in irrigating large areas resulting in
better productivity in the region.
Source: NATMO, New Delhi, 2010. Fig. 3.3
3.2.4 Soils
The soils of the Ambedkarnagar district are alluvium and fall into two types:
the new alluvium and the old alluvium. They are also known as Khadar and Bhangar
respectively. The khadar lands are found in narrow strips along the river Ghagra and
other rivers in the district and vary in texture from sand to silty sand. The bhangar
soils vary from sandy loam to stiff clay depending upon topography and drainage.
Sometimes this soil is characterised by the presence of calcareous concentrations,

54
which are called khadar and are found at various depths (fig. 3.4). The soils of the
district may be classified as:
Sandy Soil (Baluva)
The soils of khadar, adjacent to river banks are marked sandy but away from
these banks, it improves in texture and shows an increase in per centage of silt. The
sandy soil is utilized for cultivation of millet and Kharif pulses while the silty sand is
used for the production of millet in Kharif and Barley or Gram in Rabi season.
Loamy Soil (Domat)
This type of soil covers a major portion of the district. The surface soil is
yellow to brown in colour with brownish yellow subsoil. Owing to light and open
texture of the soil, its water retention capacity is low but it can be made capable of
producing good crops if irrigation facilities are provided.
Clayey Loam (Matiyar)
The matiyar soil is characterised by yellowish grey colour at surface and dark
colour in lower horizon. As compared with domat soil, it is rich in clay and its water
retention capacity is high. The calcareous materials are leached down from the surface
at various depths where they are accumulated to form kankar nodules. This soil
responds well to transplanted rice.
Saline and Alkaline Soils (Usar)
The usar soils of the area are to be especially mentioned. The most striking
feature of the soils is the irregularity of their distribution (Fig. 3.4). It is very difficult
to show the extent of these soils as they are interspersed with small pieces of fertile
lands. The Himalayan river and their tributaries have played an important role in the
formation of usar soils in the region. These rivers transport salts in solutions, which
go on percolating into the sub-soil of the region. In those areas, which suffer from low
rainfall and have no proper surface drainage, these salts keep on accumulating by
leaching from the neighbouring regions. During the dry months, the solvable salts are
sucked-up in solution by capillary action to the surface and are deposited there in the
form of white efflorescence. In this way, the lands that have been impregnated with
these salts have been described as usar lands.

55
Source: NATMO, New Delhi, 2010. Fig. 3.4
3.2.5 Climate
The climate of the district resembles that of eastern Uttar Pradesh. It is
characterized by a rhythm of seasons, which are produced by south-west and north-
east monsoon. The reversal of winds takes place twice in a year. The climate of the
district may be classified into three distinct seasons.
1. The Cold Weather Season (November to February)
2. The Hot Weather Season (March to Mid June)
3. The Season of Rains (Mid June to October)
The cold weather season prolongs from the month of November to February.
In the month of November, the belt of high pressure extends from north-west India
and covers the whole of the Uttar Pradesh. The temperature beings to decline and the
maximum and minimum are 32.15oC and 8.95
oC respectively, in this month. The
prevailing winds blow from west to east and are influenced by pressure distribution
and pattern of the Himalayas.
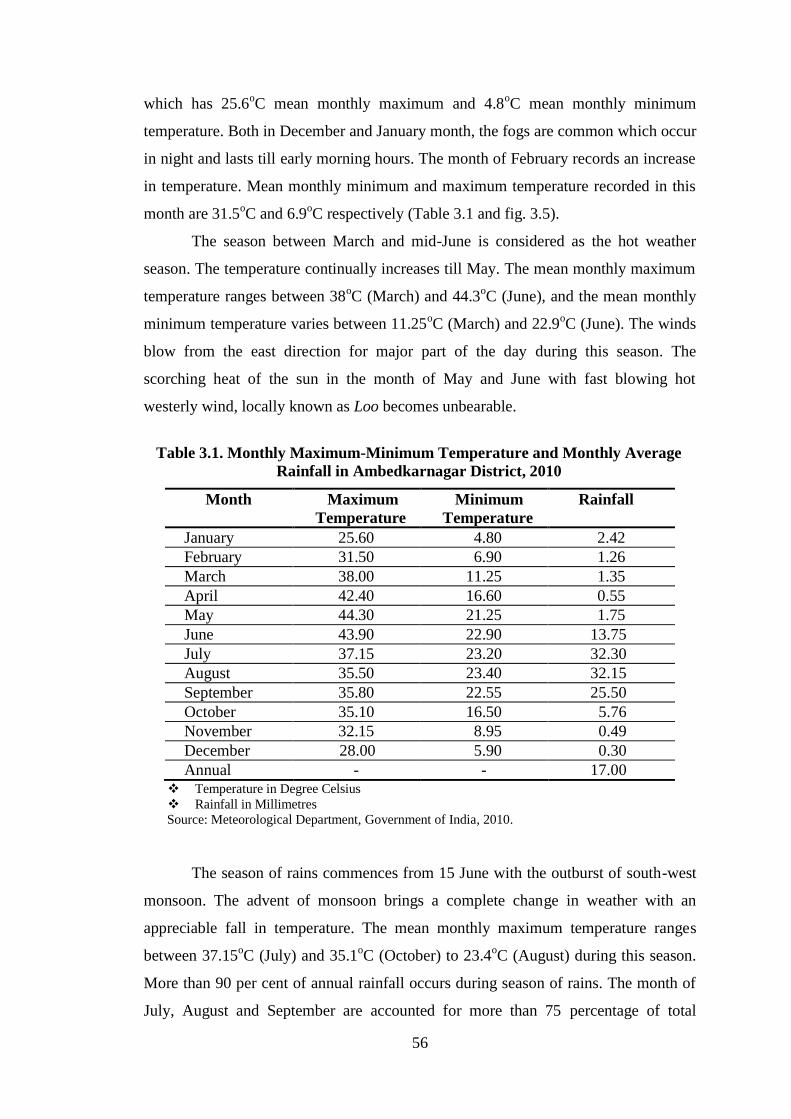
However, the months of December and January register decrease both in
maximum and minimum temperature. January is the coldest month of the district,
56
which has 25.6oC mean monthly maximum and 4.8
oC mean monthly minimum
temperature. Both in December and January month, the fogs are common which occur
in night and lasts till early morning hours. The month of February records an increase
in temperature. Mean monthly minimum and maximum temperature recorded in this
month are 31.5oC and 6.9
oC respectively (Table 3.1 and fig. 3.5).
The season between March and mid-June is considered as the hot weather
season. The temperature continually increases till May. The mean monthly maximum
temperature ranges between 38oC (March) and 44.3
oC (June), and the mean monthly
minimum temperature varies between 11.25oC (March) and 22.9
oC (June). The winds
blow from the east direction for major part of the day during this season. The
scorching heat of the sun in the month of May and June with fast blowing hot
westerly wind, locally known as Loo becomes unbearable.
Table 3.1. Monthly Maximum-Minimum Temperature and Monthly Average
Rainfall in Ambedkarnagar District, 2010
Month Maximum
Temperature
Minimum
Temperature
Rainfall
January 25.60 4.80 2.42
February 31.50 6.90 1.26
March 38.00 11.25 1.35
April 42.40 16.60 0.55
May 44.30 21.25 1.75
June 43.90 22.90 13.75
July 37.15 23.20 32.30
August 35.50 23.40 32.15
September 35.80 22.55 25.50
October 35.10 16.50 5.76
November 32.15 8.95 0.49
December 28.00 5.90 0.30
Annual - - 17.00 Temperature in Degree Celsius
Rainfall in Millimetres
Source: Meteorological Department, Government of India, 2010.
The season of rains commences from 15 June with the outburst of south-west
monsoon. The advent of monsoon brings a complete change in weather with an
appreciable fall in temperature. The mean monthly maximum temperature ranges
between 37.15oC (July) and 35.1
oC (October) to 23.4
oC (August) during this season.
More than 90 per cent of annual rainfall occurs during season of rains. The month of
July, August and September are accounted for more than 75 percentage of total

57
precipitation of the season. The month of July records maximum rainfall (32.30 cm)
and about 50 per cent days of the month receive more than 0.3 mm rainfall each day.
The direction of the wind is generally eastern and north-eastern throughout the rainy
season.
Source: NATMO, New Delhi, 2010. Fig. 3.5
3.2.6 Flora
The district of Ambedkarnagar occupies a very insignificant percentage of
total area under forest cover. It accounts only 0.11 per cent of total area. The
vegetation of the district is spread over the region in the form of scattered patches in
the midst of cultivated land. Generally, they are concentrated along the rivers, drains
(nalas) and to the usar lands. The vegetation consists of the forests, bushes and long
old grasses.
The area under forest shows an uneven spatial distribution. The highest
concentration of forest is found in Tanda block. About 33.33 per cent of the total
forest area of the district is found in this block (Table 3.2). Akbarpur block occupies
the second place with forest concentration of about 25.55 per cent. The block of
Bhiyaon, Bhiti, Jalalpur and Ramnagar have the forest concentration ranging between

58
6-10 per cent of the total area under forest. Rest of the blocks has less than 5 per cent
of the total area under the forest cover. The block of Jahangirganj occupies the lowest
concentration of forest cover, i.e. about 0.37 per cent of the total forest area of the
district (Fig. 3.6).
Table 3.2. Area (in hectare) under Forest in Ambedkarnagar District, 2010-11
S.
No. Block
Area
(in Hectare)
Percentage of Total
Forest Area
1. Bhiti 23 8.52
2. Katehri 12 4.44
3. Akbarpur 69 25.56
4. Tanda 90 33.33
5. Baskhari 10 3.70
6. Ramnagar 18 6.67
7. Jahangirganj 01 0.37
8. Jalalpur 21 7.78
9. Bhiyaon 26 9.63
Total 270 100.00
Source: District Statistical Office, Ambedkarnagar District, 2010-11.
Fig. 3.6

59
3.2.7 Fauna
The mammals, birds, reptiles and fishes usually found in the upper Indo-
Gangetic plain are found in this district. Domestic animals such as Oxen, Horses,
Cows, Buffaloes, Goats, Donkeys, etc., are mainly associated with agriculture. The
number and variety of the wild animals found in the district are not remarkable and
the ordinary species, which occur throughout the region, to the south of the Ghagra,
are found here. Large types of carnivores such as Tiger, Panther, and Leopard are
almost absent. Smaller varieties such as Wolves, Jackals, Foxes, Hyenas, etc., are
usually be found in the scattered patches of jungle in almost all the tahsils (sub-
divisions) and cause occasional havoc for cattle.
Among the herbivorous animals, Orient Deer, Antelope and Nilgai are found
in large numbers in herds. Nilgai is found along the Ghagra and in patches of dhak
jungle, mostly in southern and central parts of Katehri block and in the south-west of
Akbarpur block. It multiplies quickly and causes great damages to crops. The rapidly
multiplying hares and field mice are even more harmful to the crops than the Nilgais,
and become a problem for the cultivators.
The varieties of birds that are generally found in the district are the same as
those found within the adjoining tracts. The most common among these are the House
Crow, Kite and Sparrow. The Weaverbird (Baya), Waxbill (Lal munia), Malposter
cafer (Bulbul), Cuckoo (Koel), the spotted Dove, the ordinary and the green Pigeons
and the Papiha are other garden birds found everywhere in the district. The Indian
Parakeet (Hiraman tota) and the rose-ringed Parakeet, which cause damage to the
mango and guava crops, are found in large numbers and live in big flocks. The
majority of aquatic birds are migratory, various types of ducks such as Lalsar, Saman,
Leda, Ghoghila, Surkhab, Sikhpar and some types of Crane are fairly common, and
visit the lakes of the district at the beginning of the winter and provide ample game
throughout that season.
Fish find an important place in the fauna of the district and are found in
perennial rivers, lakes, ponds and artificial reservoirs. Their main species are Rohu
(Labeo rohita), Moh (Notopterus chitala), Sidhri (Barbus spp.), Mangur (Clarias
mangur), Tengra (Mystus spp.), Sal (Ophiocephalus spp.), Singhi (Heteropneustes
fossilis) and Khursa (Labeo gonius). Prawn (Jhinga) is also abundant in the Ghagra
river during the rainy season.

60
Different varieties of snakes both poisonous and non-poisonous, such as the
deadly Cobra, the Russel‟s viper, the harmless Dumuhi, the Phetar, Chital,
Ghorkarait, Gehwan and Dhamin are generally found and a number of people fall
victims to snake-bite every year (U.P. District Gazatteer, Faizabad, 1960).
3.3 Cultural Setting
3.3.1 Population
The most distinctive vision over any landscape is the distributional pattern of
population in spatial context. It plays an important role in the development of a
region. Although the marketing activity is an integral part of the settlement system,
the demographic characteristics also control the market activity of the study area.
With a population of about 2.02 million and an area of 2,361 sq km, the
Ambedkarnagar district is one of the most densely populated districts of the Uttar
Pradesh.
3.3.1.1 Growth of Population
Population growth in an area is an index of its economic development, social
awakening, cultural background, historical events, and political ideology (Chandna,
1980). Table 3.3 highlights the decadal growth of population in the Ambedkarnagar
district in the period 1901-2011.
Table 3.3. Decadal Growth of Population in Ambedkarnagar District
(1901-2011)
Census Year Decadal Growth
(%)
1901 -
1911 _
5.81
1921 + 1.55
1931 + 2.81
1941 + 9.51
1951 + 12.30
1961 + 11.46
1971 + 20.75
1981 + 24.15
1991 + 25.45
2001 + 24.40
2011 + 18.30
Source: District Statistical Office, Ambedkarnagar District, 2010-11
& Census of India 2011.

61
3.3.1.2 Distribution and Density of Population
Table 3.4 shows the distribution of population in the district. It clearly
indicates that there is considerable variation in the number of people living in
different blocks. The main causes for this uneven distribution can be attributed to the
existence of plain and fertile land, the level of urbanization, industrialization and the
facilities of market, transportation and communication. The distribution of population
in each block is controlled by physical conditions and socio-economic causes.
Akbarpur block has the highest share of population (16.56 per cent) of the study area,
followed by Jalalpur (13.80 per cent), Tanda (12.32 per cent), Ramnagar (10.26 per
cent), Katehri (10.03 per cent), Bhiyaon (9.78 per cent), Baskhari (9.53 per cent),
Jahangirganj (9.17 per cent) and Bhiti (8.55 per cent).
Table 3.4. Block wise Distribution of Population, Area and Density of Population in
Ambedkarnagar District, 2010-11
S.
No Block
Area
(km2)
Population Density
(Persons/ km2)
1. Bhiti 209.76 1,73,312
(8.55) 826
2. Katehri 253.33 2,03,340
(10.03) 802
3. Akbarpur 410.52 3,35,680
(16.56) 817
4. Tanda 323.73 2,49,635
(12.32) 771
5. Baskhari 204.31 1,93,140
(9.53) 945
6. Ramnagar 228.04 2,07,975
(10.26) 912
7. Jahangirganj 219.94 1,85,923
(9.17) 845
8. Jalalpur 298.51 2,79,806
(13.80) 937
9. Bhiyaon 212.89 1,98,065
(9.78) 930
Total 2,361.03 20,26,876
(100.00) 858
Figure in bracket shows percentage.
Source: District Statistical Office, Ambedkarnagar District, 2010-11.
Since, density of population shows the relationship between population and
area, it also refers to the population pressure per unit area. Hence, it is a good
indicator of human concentration. The amount of density varies due to the availability
of favourable conditions in an area such as soil, climate, productivity of land and
water resources, etc.
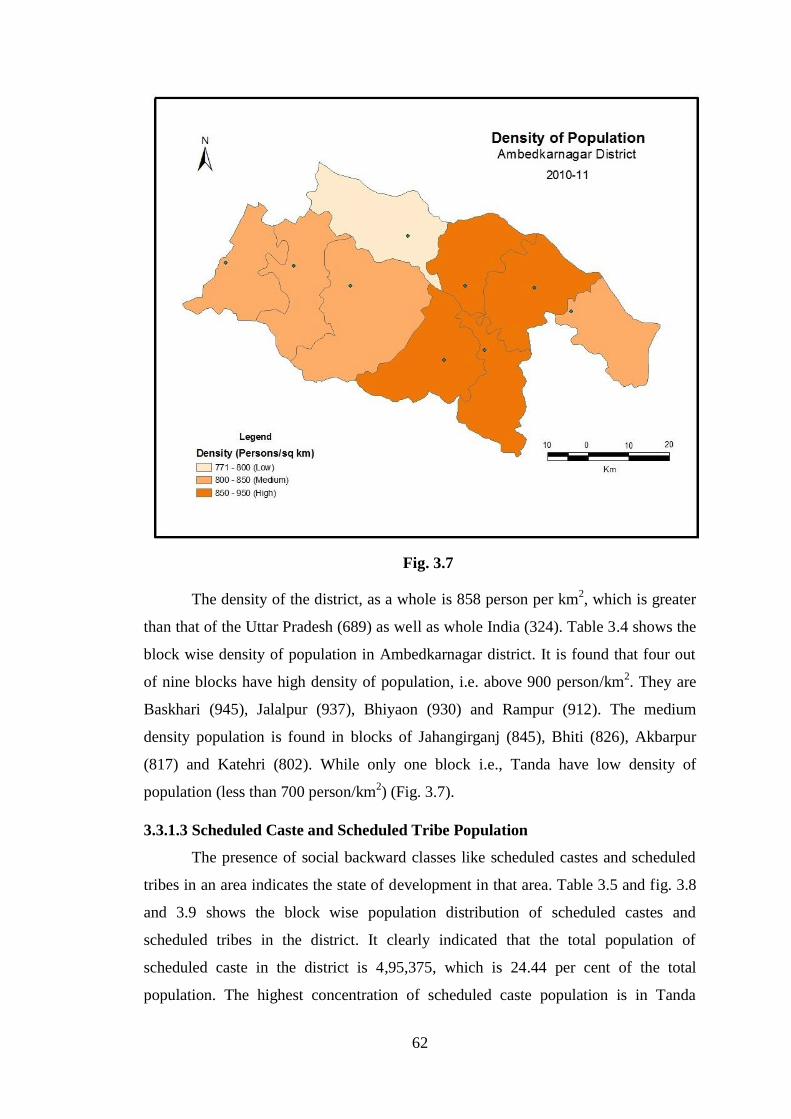
62
Fig. 3.7
The density of the district, as a whole is 858 person per km2, which is greater
than that of the Uttar Pradesh (689) as well as whole India (324). Table 3.4 shows the
block wise density of population in Ambedkarnagar district. It is found that four out
of nine blocks have high density of population, i.e. above 900 person/km2. They are
Baskhari (945), Jalalpur (937), Bhiyaon (930) and Rampur (912). The medium
density population is found in blocks of Jahangirganj (845), Bhiti (826), Akbarpur
(817) and Katehri (802). While only one block i.e., Tanda have low density of
population (less than 700 person/km2) (Fig. 3.7).
3.3.1.3 Scheduled Caste and Scheduled Tribe Population
The presence of social backward classes like scheduled castes and scheduled
tribes in an area indicates the state of development in that area. Table 3.5 and fig. 3.8
and 3.9 shows the block wise population distribution of scheduled castes and
scheduled tribes in the district. It clearly indicated that the total population of
scheduled caste in the district is 4,95,375, which is 24.44 per cent of the total
population. The highest concentration of scheduled caste population is in Tanda

63
(31.54 per cent), followed by Jahangirganj (30.89 per cent), Jalalpur (30.41 per cent),
Ramnagar (28.01 per cent), Baskhari (28 per cent), Bhiyaon (26.65 per cent), Katehri
(23.95 per cent), Akbarpur (23.40 per cent) and Bhiti (22.98 per cent).
Table 3.5. Block wise Population of Scheduled Caste and Scheduled Tribe in
Ambedkarnagar District, 2010-11
S.
No. Block
Total
Population
Scheduled Caste Scheduled Tribe
Population
Share in
total
population
(%)
Population
Share in
total
population
(%)
1. Bhiti 1,73,312 34,404 22.96 37 0.021
2. Katehri 2,03,340 43,041 23.95 3 0.001
3. Akbarpur 3,35,680 73,029 23.40 18 0.005
4. Tanda 2,49,635 71,269 31.54 46 0.018
5. Baskhari 1,93,140 47,463 28.00 - -
6. Ramnagar 2,07,975 51,643 28.01 - -
7. Jahangirganj 1,85,923 50,133 30.89 1 0.000
8. Jalalpur 2,79,806 77,908 30.41 38 0.013
9. Bhiyaon 1,98,065 46,485 26.65 - - Total 20,26,876 4,95,375 24.44 143 0.007
Source: District Statistical Office, Ambedkarnagar District, 2010-11.
Fig. 3.8

64
The share of scheduled tribe population to the total population is very
nominal. It is only 0.01 per cent of the total population. Among the total 9 blocks, 3
blocks do not have any scheduled tribe population. They are Baskhari, Ramnagar and
Bhiyaon. Other blocks having scheduled tribe population are Bhiti (0.02 per cent),
Tanda (0.02 per cent), Akbarpur (0.01 per cent) and Jalalpur (0.01 per cent) (fig. 3.9).
Fig. 3.9
3.3.1.4 Literacy
Literacy is essential for socio-economic development, which indicates overall
development of a region. Literacy unlocks the potential of an individual. Literacy and
development go hand in hand, and the casual relationship between the two is
undisputedly established.
Table 3.6 exhibits the block wise number of literates and percentage of
literacy in Ambedkarnagar district during 2010-11. Out of total population, 9,54,537
persons are literate in the district. Therefore, the literacy rate of the district is 58.75
per cent. There is a great variation between male and female literacy rates in the

65
district. The male literacy rate is 71.71 per cent whereas the female literacy is only
45.58 per cent. The table also shows that the urban literacy rate (72.54 per cent) is
much higher than the rural as well as the district average.
Table 3.6. Block wise Literates and Percentage of Literacy in Ambedkarnagar
District, 2010-11
S.
No. Block
Literates Literacy (%)
Male Female Total Male Female Total
1. Bhiti 42,845 24,707 67,552 70.20 40.96 55.67
2. Katehri 50,508 29,838 80,346 69.54 41.25 55.41
3. Akbarpur 85,799 51,124 1,36,923 66.92 41.22 54.28
4. Tanda 64,133 39,482 1,30,615 68.73 44.74 57.63
5. Baskhari 48,931 32,134 81,065 72.26 47.79 60.23
6. Ramnagar 56,417 35,304 91721 72.83 44.30 58.36
7. Jahangirganj 53,547 33,620 87,167 75.14 45.41 59.99
8. Jalalpur 74,689 46,,346 1,21,035 71.57 45.15 58.47
9. Bhiyaon 48,402 28257 76,659 70.50 39.90 54.96
Total Rural 5,25,271 3,20,812 8,73,083 70.85 43.41 57.22
Total Urban 61,781 46,673 1,08,454 79.40 65.12 72.54
Total District 5,87,052 3,67,485 9,54,537 71.71 45.58 58.75 Source: District Statistical Office, Ambedkarnagar District, 2010-11.
Note : The literacy % is related to the population with age 7+.
Fig. 3.10

66
The analysis shows that there is regional variation of literacy from one block
to another. The highest literacy rate was recorded in Baskhari block (60.23), followed
by Jahangirganj (59.99), Jalalpur (58.47), Ramnagar (58.36), Tanda (57.63), Bhiti
(55.67), Katehri (55.41), Bhiyaon (54.96) and Akbarpur (54.28) (fig.3.10).
3.3.1.5 Occupational Structure
The social and economic development of any region depends on the number of
persons who are economically active and the quality and regularity of their work. The
proportion of economically active population in various occupations indicates the
economic profile of various groups of society. The term „occupation‟ means „doing a
certain type of work‟. „Work‟ may be defined as a participation in economically
productive activity. However, a person doing any type of economically productive
activity is a worker. Thus, work involved not only actual work but also effective
supervision and direction of work. According to Census of India (2001), the main
worker has been classified into four groups, i.e. cultivator, agricultural labourer,
worker engaged in household industry and other worker. Table 3.7 and fig. 3.11
shows block wise economic classification of population in the district. Out of total
workers 6,77,980, the dominant group consist of cultivators having a share of 51.24
per cent. Cultivators and agricultural labours together represent 69.39 per cent to the
total work force in the district. The share of peoples engaged in household industries
and other non-agricultural occupations are 30.51 per cent.
Table 3.7. Block wise Occupational Structure of Population in Ambedkarnagar
District, 2010-11
S.
No. Block
Total
workers Cultivator
Agricultural
labourers
Workers in
Household
industry
Other
workers
1. Bhiti 66678 18626 5686 1191 4695
2. Katehri 103820 25194 8417 1720 6385
3. Akbarpur 167575 40663 16431 5058 19713
4. Tanda 104375 24044 11359 5015 21203
5. Baskhari 87998 17831 8675 4890 14780
6. Ramnagar 85681 26628 6604 2617 7191
7. Jahangirganj 74350 19707 6594 2436 6361
8. Jalalpur 130972 27935 10130 7016 18610
9. Bhiyaon 86036 25958 6352 1649 4843
Total
677980
(100.00)
226586
(51.24)
80248
(18.15)
31595
(7.14)
103781
(23.47)
Figures in bracket shows percentage.
Source: District Statistical Office, Ambedkarnagar District, 2010-11.

67
Fig. 3.11
3.3.2 Agriculture
3.3.2.1 Land Use Pattern
Agriculture occupies the most important place in the economy of
Ambedkarnagar district. About 91 per cent population lives in villages where main
occupation is agriculture, and they are mostly depends upon agriculture for their
livelihood. About 2,26,586 cultivators and 80,248 agricultural labourers are engaged
in agricultural activities in the district. The main feature of the area is the diversified
form of agriculture, in term of cultivation of crops. The main crops are wheat, paddy
(rice), barley, jowar (sorghum), bajra (pearl millet), maize, and pulses. The cash
crops like sugarcane, potato, etc. are also grown. For understanding the status of
agriculture in Ambedkarnagar district, it is essential to analyse the various categories
of land use in the district. It may be helpful in understanding the existing status of
agriculture and limitations of its development.
Table 3.8 shows that the total reporting area of the district is 2,36,103 hectares
in 2010-11, whereas the total forest area is only 270 hectares, which is about 0.11 per

68
cent of the total reported area, while net sown area occupies 1,67,701 hectares i.e.
71.03 per cent. The rest of the land has been classified mainly as land not available for
cultivation, other uncultivated land, old fallows and current fallows. The category,
land not available for cultivation includes land put to non-agricultural use and barren
and uncultivable land, which account for 16.19 per cent of the total reported area. The
area under this category consists of permanent pastures land, land under
miscellaneous tree crops and grooves and cultivable wasteland. They occupy 0.25,
1.89 and 1.85 per cent of total reported area respectively. However, the area occupied
under fallows and current fallows during 2010-11 is 5,976 and 10,811 hectares
respectively. It accounted for 2.53 and 4.58 per cent of total reported area. Table 3.8
shows different categories of land use, in term of percentage of area, which shows
regional variation among different blocks.
3.3.2.2 Cropping Pattern
For the area under study, agriculture is the main stay of economy of the
inhabitants. The soil of this area is very fertile and suitable for intensive cultivation.
Diversified form of agriculture, in term of cultivation of crops, is the main feature of the
area. The major cultivated crops of the area are rice, wheat, pulses, oilseeds, coarse
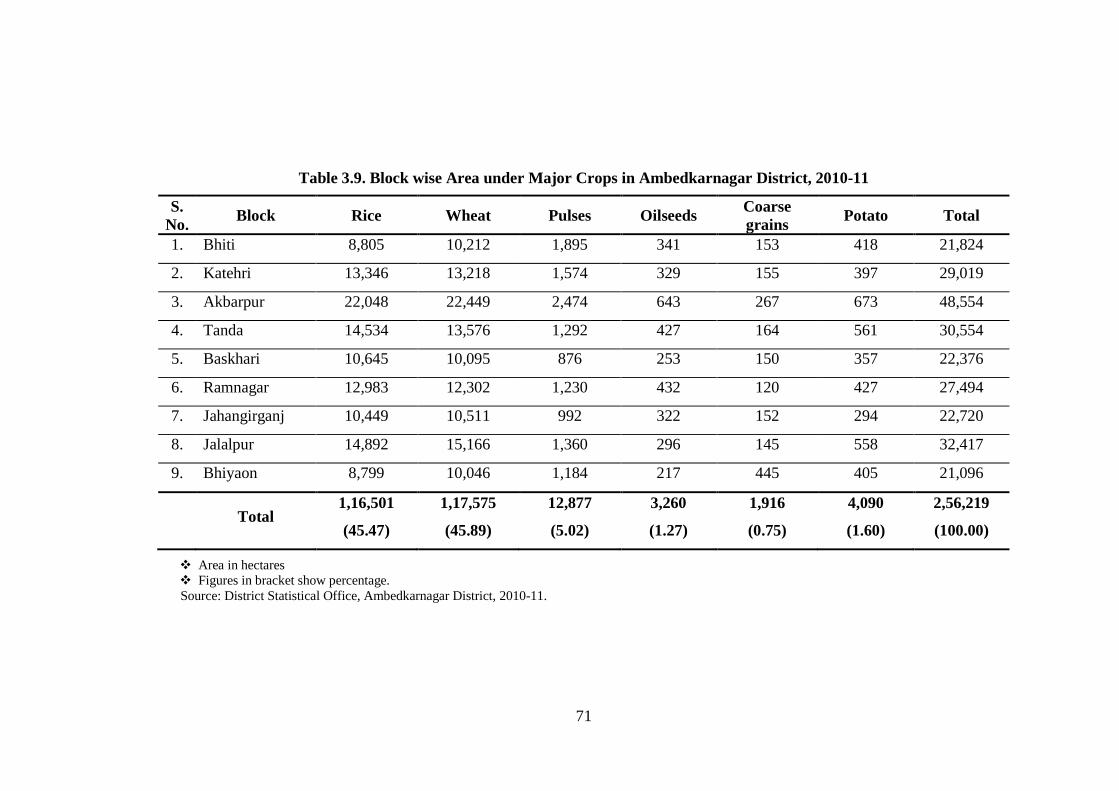
grains, etc. The total cropped area of the district is 2,81,811 hectares during 2010-11.
The study shows that wheat and rice are the dominant crops of the district.
Wheat is cultivated in 1,17,575 hectares of land, and account for 45.89 per cent of total
cropped area, whereas rice is cultivated in 1,16,501 hectares, occupying 45.47 per cent
of the total cropped area. While the shares of pulses, potato, oilseeds and coarse grains
i.e. jowar (sorghum), bajra (pearl millet) and makka (maize) is 5.02 per cent, 1.60 per
cent, 1.27 per cent and 0.75 per cent respectively to the total cropped area (Table 3.9).
Block wise analysis indicates a great regional variation of area under major crops in
different blocks of the district.
3.3.2.3 Livestock Husbandry
Livestock husbandry is emerging one of the most important value added farming
systems adopted in the study area. It is an important segment of agricultural system as
well as integral part of rural economy. It is the most important source of food security
as it provides meat and milk and other dairy products. It is also looked as having a
latent potential and boon for employment generation and poverty alleviation in poor
resource regions.

69
In the district, the important species of livestock are cattle, buffalo, goat, sheep
and pig. Cattle accounts for the highest proportion of livestock (37.74 per cent)
followed by buffalo (37.21 per cent), goat (20.15 per cent), pig (2.48 per cent) and
sheep (2.18 per cent) (Table 3.10 and fig. 3.12). Block wise analysis indicates that there
is a regional variation in the proportion of various species of livestock in different
blocks of the district.
Fig. 3.12

70
Table 3.8. Block wise Land use Pattern in Ambedkarnagar District, 2010-11
S
No. Block
Total
reported
area
Net sown
area
Area sown
more than
once
Present
fallow
land
Other
fallow
land
Barren
cultivable
waste
Barren and
uncultivable
land
Pasture
land
Land under
misc. trees
and grooves
Forest
Land put
to non-
agricultural
uses
1. Bhiti 20,976 15,211 9,666 1,572 425 345 319 58 341 23 2,682
2. Katehri 25,333 18,725 12,772 1,967 250 698 302 242 553 12 2,584
3. Akbarpur 41,079 30,933 22,126 2,597 172 862 921 103 547 69 4,870
4. Tanda 31,650 17,981 15,576 1,048 1,226 734 472 36 1,886 90 8,175
5. Baskhari 20,834 14,389 10,184 233 616 277 248 25 377 10 4,657
6. Ramnagar 22,804 16,694 13,358 729 504 270 330 49 171 18 4,039
7. Jahangirganj 21,994 15,973 9,129 700 569 205 319 14 239 01 3,974
8. Jalalpur 30,247 21,837 13,234 1,532 1,093 563 582 32 285 21 4,306
9. Bhiyaon 21,189 15,958 8,065 433 1,121 415 219 24 61 26 2,932
Total
2,36,103
(100)
1,67,701
(71.03)
11,411
(48.33)
10,811
(4.58)
5,976
(2.53)
4,369
(1.85)
3,714
(1.57)
583
(0.25)
4,460
(1.89)
270
(0.11)
38,219
(16.19)
Area in hectares
Figures in bracket show percentage.
Source: District Statistical Office, Ambedkarnagar District, 2010-11.
71
Table 3.9. Block wise Area under Major Crops in Ambedkarnagar District, 2010-11
S.
No. Block Rice Wheat Pulses Oilseeds
Coarse
grains Potato Total
1. Bhiti 8,805 10,212 1,895 341 153 418 21,824
2. Katehri 13,346 13,218 1,574 329 155 397 29,019
3. Akbarpur 22,048 22,449 2,474 643 267 673 48,554
4. Tanda 14,534 13,576 1,292 427 164 561 30,554
5. Baskhari 10,645 10,095 876 253 150 357 22,376
6. Ramnagar 12,983 12,302 1,230 432 120 427 27,494
7. Jahangirganj 10,449 10,511 992 322 152 294 22,720
8. Jalalpur 14,892 15,166 1,360 296 145 558 32,417
9. Bhiyaon 8,799 10,046 1,184 217 445 405 21,096
Total
1,16,501
(45.47)
1,17,575
(45.89)
12,877
(5.02)
3,260
(1.27)
1,916
(0.75)
4,090
(1.60)
2,56,219
(100.00)
Area in hectares
Figures in bracket show percentage.
Source: District Statistical Office, Ambedkarnagar District, 2010-11.

72
Table 3.10. Block wise Different Livestock in Ambedkarnagar District, 2010-11
Figures in bracket show percentage.
Source: District Statistical Office, Ambedkarnagar District, 2010-11.
S.
No. Block Cattle Buffalo Goat Pig Sheep Others Total
1. Bhiti 32,475
(44.69)
26,247
(36.12)
9,682
(13.33)
1,873
(2.58)
2,267
(3.12)
119
(0.16)
72,663
(100.00)
2. Katehri 36,634
(45.81)
27,940
(34.94)
11,500
(14.38)
2,453
(3.07)
1,293
(1.62)
140
(0.18)
79,960
(100.00)
3. Akbarpur 47,037
(44.62)
35,254
(33.44)
18,871
(17.90)
2,664
(2.53)
126
(1.20)
334
(0.32)
1,05,425
(100.00)
4. Tanda 19,770
(27.76)
28,270
(39.70)
18,978
(26.65)
2,605
(3.66)
1,266
(1.78)
319
(0.44)
71,208
(100.00)
5. Baskhari 15,931
(27.64)
21,944
(38.07)
15,705
(27.24)
2,498
(4.33)
1,383
(2.40)
184
(0.32)
57,645
(100.00)
6. Ramnagar 18,517
(33.13)
21,313
(38.13)
14,239
(25.47)
497
(0.89)
1,211
(2.17)
119
(0.21)
55,896
(100.00)
7. Jahangirganj 16,712
(32.78)
19,367
(37.99)
13,258
(26.01)
454
(0.89)
1,065
(2.09)
126
(0.25)
50,982
(10.00)
8. Jalalpur 28,769
(40.80)
25,670
(36.40)
13,227
(18.76)
988
(1.40)
1,799
(2.55)
61
(0.09)
70,514
(100.00)
9. Bhiyaon 18,911
(32.77)
25,454
(44.11)
9,867
(17.10)
1,387
(2.40)
2,003
(3.47)
87
(0.15)
57,709
(100.00)
Total
2,34,756
(37.74)
2,31,459
(37.21)
1,25,327
(20.15)
15,419
(2.48)
13,552
(2.18)
1,489
(0.24)
6,22,002
(100.00)

73
3.3.2.4 Agricultural Inputs
(i) Seeds
Table 3.11 shows the block wise availability of seed centres in
Ambedkarnagar district. The study indicates that the total seed sale centres in the
district are 260. There is block wise variation in the number of sale centres, the
highest (39) in Akbarpur block, whereas lowest (16) in Bhiti block. There is also a
great variation between the number of public and private seed selling centres. The
cooperative and agriculture department shares around 44 per cent of the total seed
selling centres, whereas the remaining 56 per cent selling centres are private in nature.
Figures also shows that the seed sale centres under the cooperative and
agricultural department are also performing the work of seed godown centres in
different blocks of the district. There are in total 216 seed godown centres in the
district, out of which 53 per cent comes under the cooperative and agricultural
departments, whereas remaining 47 per cent are private in nature.
The availability of seed sale and godown centres are also varies significantly
among rural and urban areas of the district. About 87 per cent of the seed sale centres
of the district are comes under rural areas, whereas remaining 13 per cent belongs to
urban areas. Similarly, more than 97 per cent of the seed godowns are situated in rural
areas, leaving only less than 3 per cent under urban areas of the district.
Table 3.11. Block wise Distribution of Seed Centres in Ambedkarnagar District,
2010-11 S.
No.
Block
Seed Sale Centre Seed Godown Centre
Cooperative
Dept.
Agri.
Dept. Others Total
Cooperative
Dept.
Agri.
Dept. Others Total
1. Bhiti 7 1 8 16 7 1 10 18 2. Katehri 11 1 12 24 11 1 10 22 3. Akbarpur 17 0 22 39 17 0 17 34
4. Tanda 13 0 12 25 13 0 13 26
5. Baskhari 10 1 12 23 10 1 9 20 6. Ramnagar 11 1 17 29 11 1 10 22 7. Jahangirganj 11 1 15 27 11 1 10 22
8. Jalalpur 13 0 9 22 13 0 13 26 9. Bhiyaon 10 1 11 22 10 1 9 20
Total Rural 103 6 118 227 103 6 101 210
Total Urban 3 3 27 33 3 3 0 6
Total District 106
(40.77)
9
(3.46)
145
(55.77)
260
(100.00)
106
(49.07)
9
(4.17)
101
(46.76)
216
(100.00)
Figures in bracket show percentage.
Source: District Statistical Office, Ambedkarnagar District, 2010-11.

74
(ii) Agricultural Implements
Table 3.12 shows the spatial distribution of different types of agricultural
implements in Ambedkarnagar district. The study indicates that still the use of
wooden ploughs are high as compared to the iron ploughs. There are total 50,629
wooden ploughs whereas iron ploughs numbered only 9,086 in the district. There is a
great block wise variation in the use of both types of ploughs. The use of wooden
ploughs is highest in Akbarpur block (22.08 per cent) whereas lowest in Baskhari
block (3.88 per cent). In the case of iron plough, the highest concentration is again
recorded in Akbarpur block (21.67 per cent) whereas lowest concentration is recorded
in Tanda block (2.69 per cent).
The use of advance harrow and cultivator, advance thrasher machines, sprayer
and sowing instruments are also very common these days. There are 16,050 advance
harrow and cultivator, 29,324 advance thrasher machines, 4,419 sprayers and 3,819
sowing instruments in the district. The use of advance harrow and cultivator is highest
in Akbarpur block (22.16 per cent) and lowest in Jahangirganj (3.47 per cent). There
is a great regional variation in the use of advance sowing instruments. It varies from
1,719 (45.01 per cent) in Baskhari block and 18 (0.47 per cent) in Jahangirganj.
The study indicates that the use of tractors increased over the last few decades.
Farmers and cultivators prefer tractors than other means because their use increases
farm efficiency and saves time. There are total 11,773 tractors in district. Out of this,
the share of tractors in Akbarpur block are 2,763 (23.47 per cent), followed by 1,487
(12.63 per cent) in Jalalpur, 1,482 (12.59 per cent) in Tanda and 1,363 (11.57 per
cent) in Bhiyaon, etc.

75
Table 3.12. Block wise Different Agricultural Implements in Ambedkarnagar District, 2010-11
S.
No. Block
Plough Advance
harrow
and
cultivator
Advance
thrasher
machine
Sprayer
Advance
sowing
instrument
Tractor Wooden Iron
1. Bhiti 9,018
(17.81)
640
(7.04)
711
(4.43)
2,688
(9.17)
407
(9.21)
228
(5.97)
692
(5.88)
2. Katehri 8,534
(16.85)
786
(8.65)
1,149
(7.16)
4,381
(14.94)
627
(14.19)
172
(4.50)
1,055
(8.96)
3. Akbarpur 11,179
(22.08)
1,969
(21.67)
3,557
(22.16)
5,180
(17.66)
1,267
(28.67)
292
(7.65)
2,763
(23.47)
4. Tanda 2,713
(5.36)
244
(2.69)
1,846
(11.50)
3,373
(11.50)
698
(15.79)
1,146
(30.01)
1,482
(12.59)
5. Baskhari 1,966
(3.88)
569
(6.26)
1,296
(8.07)
2,529
(8.62)
453
(10.25)
1,719
(45.01)
1,178
(10.01)
6. Ramnagar 2,487
(4.91)
1,414
(15.56)
1,528
(9.52)
2,485
(8.47)
113
(2.56)
28
(0.73)
1,057
(8.98)
7. Jahangirganj 2,247
(4.44)
947
(10.42)
557
(3.47)
2,330
(7.96)
131
(2.96)
18
(0.47)
696
(5.91)
8. Jalalpur 5,402
(10.67)
741
(8.16)
2,826
(17.60)
3,069
(10.46)
314
(7.11)
188
(4.93)
1,487
(12.63)
9. Bhiyaon 7,083
(13.99)
1,776
(19.55)
2,583
(16.09)
328
(11.22)
409
(9.26)
28
(0.73)
1,363
(11.57)
Total 50,629
(100.00)
9,086
(100.00)
16,050
(100.00)
29,324
(100.00)
4,419
(100.00)
3,819
(100.00)
11,773
(100.00)
Figures in bracket show percentage.
Source: District Statistical Office, Ambedkarnagar District, 2010-11.

76
(iii) Irrigation
Table 3.13 shows the block wise status of irrigation facilities in
Ambedkarnagar district. Study shows that canal and tube wells are the most important
source of irrigation in the study area. The total length of canal present in the district is
721 km. Almost all the blocks of the district have canals except Bhiti. The south-
western part of the district has very low concentration of canal irrigation (Fig. 3.11).
There is a regional variation among different blocks in canal irrigation. It varies
between 181 km (25.10 per cent) in Tanda and 33 km (4.58 per cent) in Jahangirganj.
Now, the scope of permanent wells as a source of irrigation is declining. There are
393 wells in the district, of which 114 wells (29.01 per cent) are situated in Bhiti
block only, followed by 83 (21.22 per cent), 59 (15.01 per cent), 52 (13.23 per cent)
in Akbarpur, Katehri and Jalalpur blocks respectively.
Table 3.13. Block wise Status of Sources of Irrigation in Ambedkarnagar
District, 2010-11
S.
No. Block
Canal length
(Km)
Permanent
well
(No.)
Government
tube well
(No.)
Private
tube well
(No.)
1. Bhiti -
114
(29.01)
16
(13.22)
5,150
(8.84)
2. Katehri 102
(14.15)
59
(15.01)
14
(11.57)
6,221
(10.68)
3. Akbarpur 40
(5.55)
83
(21.22)
16
(13.22)
10,291
(17.66)
4. Tanda 181
(25.10)
11
(2.80)
11
(9.09)
7,022
(12.05)
5. Baskhari 91
(12.62)
9
(2.21)
13
(10.74)
4655
(7.99)
6. Ramnagar 112
(15.53)
5
(1.27)
12
(9.92)
6589
(11.31)
7. Jahangirganj 33
(4.58)
33
(8.40)
11
(9.09)
5,342
(9.17)
8. Jalalpur 59
(8.18)
52
(13.23)
15
(12.40)
8,545
(14.67)
9. Bhiyaon 103
(14.09)
27
(6.87)
13
(10.74)
4,443
(7.63)
Total
721
(100.00)
393
(100.00)
121
(100.00)
58,258
(100.00) Figures in bracket indicate percentage to total.
Source: District Statistical Office, Ambedkarnagar District, 2010-11.

77
(iv) Fertilizers
The total consumption of the fertilizer in the district is 46,727 kg. The demand
and consumption of Nitrogenous fertilizers is very high as compared to the other
types. Out of total consumption, nitrogenous fertilizers shares 79.09 per cent (36,957
kg), whereas phosphorus and potash shares 17.53 per cent and 3.38 per cent
respectively (Table 3.14). The block wise study of fertilizers shows regional variation
among different blocks of the district, which ranges between 8.51 per cent in Bhiyaon
and 14.55 per cent in Akbarpur block.
Table 3.14. Block wise Consumption of Different Types of Fertilizers in
Ambedkarnagar District, 2010-11
S.
No. Block
Type of Fertilizer Total
(kg) Nitrogen
(kg)
Phosphorus
(kg)
Potash
(kg)
1. Bhiti 3,941 755 137 4,833 (10.34)
2. Katehri 4,053 826 155 5,053 (10.81)
3. Akbarpur 5,020 1,470 315 6,800 (14.55)
4. Tanda 4,494 1,031 206 5,726 (12.25)
5. Baskhari 4,246 682 121 5,044 (10.79)
6. Ramnagar 3,684 844 154 4,682 (10.02)
7. Jahangirganj 3,820 822 160 4,802 (10.28)
8. Jalalpur 4,549 1,053 211 5,809 (12.43)
9. Bhiyaon 3,150 707 121 3,978 (8.51)
Total 36,957 (79.09) 8,190 (17.53) 1,580 (3.38) 46,727 (100.00)
Figures in bracket show percentage.
Source: District Statistical Office, Ambedkarnagar District, 2010-11.
3.3.3 Industries
Industrially, the Ambedkarnagar district is a backward district of Uttar Pradesh.
The industrial units in the district comprise of registered mills, small scale industrial
units and village and cottage industrial units.
3.3.3.1 Registered Mills -
There are 50 registered mills (Agro based, textile, sugarcane, paper, etc.) in the
district and 1569 persons were employed in 2010-11, as shown in table 3.15.
3.3.3.2 Small Scale Industries -
The small-scale industries are those that have total investment including land
assets, buildings, machinery, and equipment not more than 3 crore irrespective of
number of persons employed. During the year 2010-11, there are 2,006 small-scale

78
industrial units in the district. The number of units varies from block to block (160 to
314). The small-scale industries which are mainly depend upon local available raw
materials employ 7,504 persons.
3.3.3.3 Village and Cottage Industries -
Villages and Cottage industries are those, which are under the commission of
khadi and village industries. These industries whether using mechanical or electrical
power or not, are carried on in the house of artisans and occasionally in small karkhana
(workshop) where not more than 9 workers are employed. Cottage industries, also
called household industries, are organized by individuals with private resources and
with the help of members of the households. These industries use locally available
resources and skills, e.g. carpet weaving, handloom and handicraft industry etc. There
are 1,325 khadi and village industries in the district, both in cooperative and private
sectors. Total 4,456 persons were employed in such type of industries in
Ambedkarnagar district during 2010-11 (table 3.15).
Table 3.15. Block wise Distribution of Industries in Ambedkarnagar District, 2010-11
S.
No. Block
Registered Mills Small scale
Industries
Village and
Cottage Industries
(Khadi Industries)
No. of
units
Employed
persons
No. of
units
Employed
Persons
No. of
units
Employed
Persons
1. Bhiti 1 0 179 652 39 155
2. Katehri 19 9 197 721 211 397
3. Akbarpur 14 219 314 1,149 210 859
4. Tanda 11 1,299 300 1,081 223 950
5. Baskhari 1 8 206 753 73 218
6. Ramnagar - - 182 667 109 210
7. Jahangirganj 1 8 215 816 80 139
8. Jalalpur 2 17 253 1,080 200 810
9. Bhiyaon 1 9 160 585 180 718
Total 50 1,569 2,006 7,504 1,325 4,456
Source: District Statistical Office, Ambedkarnagar District, 2010-11.
Table 3.16 shows number of different types of industrial units with the agencies
operating them.

79
Table 3.16. Types and Number of Working Industrial Units in Ambedkarnagar
District, 2010-11
S.
No. Industrial Units
Operated by
Panchayat
Registered
Cooperative
Society
Private Total
1. Khadi Industry 0 3 0 3
2. Changed Rural
Industry by Khadi
Village Industry
0 23 1,299 1,322
3. Small Scale Industry
Units
120 213 12,126 12,459
Total Rural and
Small Scale
Industry (1+2+3)
120 239 13,425 13,784
4. Total Employees
(1+2)
0 126 4,330 4,456
5. Employees in Small
Scale Industry Units
(3)
272 2398 18,010 20,680
Employees in Rural
and Small Scale
Industry (1+2+3)
272 2,524 22,340 25,136
Source: District Statistical Office, Ambedkarnagar District, 2010-11.
3.3.4 Transportation
Transport network play a key role in spatial development of nodes as well as
regional development. Movement of people and goods seek the help of these media.
Transport system is a mirror of economic development and material prosperity.
In fact, development, being multi-dimensional process, rest upon the resources
of any region in general and infrastructural facilities like transport and communication
in particular. It is the transport which helps in the movement of raw materials, fuel,
machinery, etc. to the points of production and finished products to the points of
marketing and consumption. The transport also helps in the better and maximum
utilization of resources of any backward region by linking the same with the relatively
more advanced and developed one.
The Ambedkarnagar district is served by a total road length of 1,963 km. The
distribution of road length is not uniform in all blocks of the district. It varies among the
blocks ranging between 158 km (Katehri) and 321 km (Akbarpur) (Fig. 3.13).
Moreover, only 18.12 percent villages of the district are linked directly with
metalled road network. Table 3.17 shows the number of villages located at various
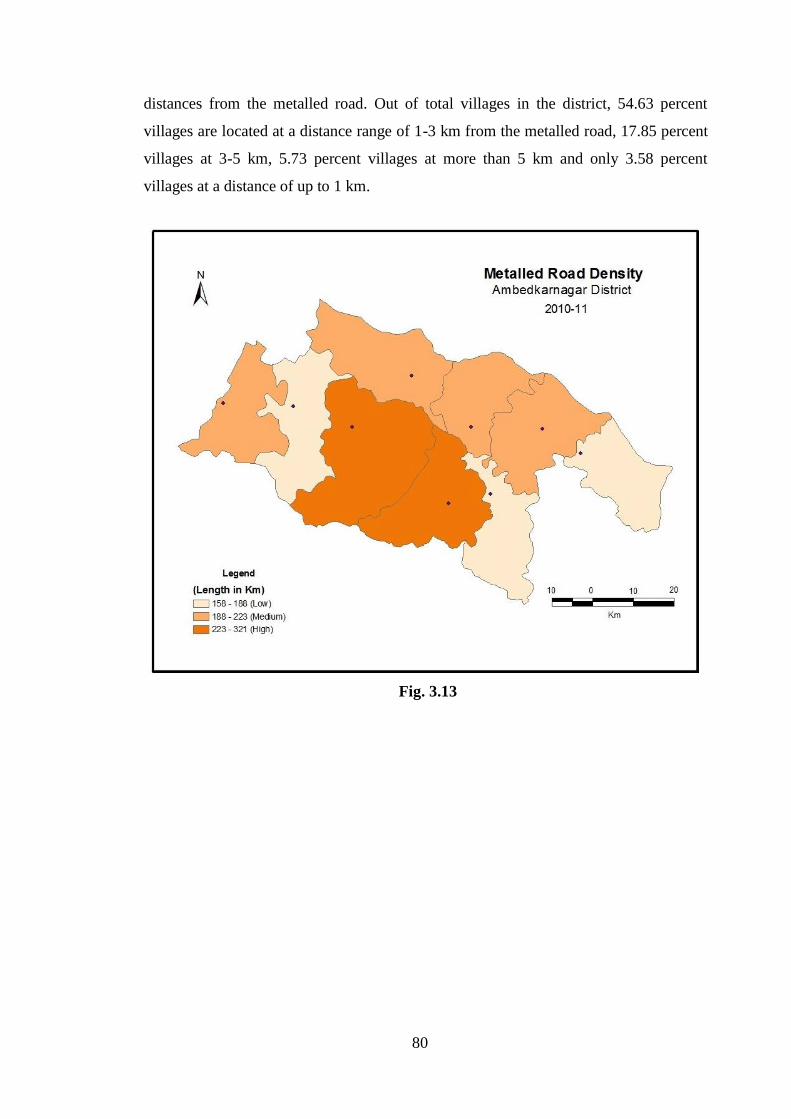
80
distances from the metalled road. Out of total villages in the district, 54.63 percent
villages are located at a distance range of 1-3 km from the metalled road, 17.85 percent
villages at 3-5 km, 5.73 percent villages at more than 5 km and only 3.58 percent
villages at a distance of up to 1 km.
Fig. 3.13

81
Table 3.17. Block wise Length of Metalled Road and Distribution of Villages on the basis of Distance from the Metalled
Road in Ambedkarnagar District, 2010-11
S. No. Block
Total metalled
roads in block
(km)
Distribution of Villages on the basis of Distance from the Metalled Road
Metalled Road
within the village < 1 km 1-3 km 3-5 km > 5 km Total
1. Bhiti 204
(10.39)
35
(20)
8
(4.57)
102
(58.28)
26
(14.86)
4
(2.28)
175
(100.00)
2. Katehri 158
(8.05)
29
(16.02)
2
(1.10)
68
(37.57)
64
(35.36)
18
(9.94)
181
(100.00)
3. Akbarpur 321
(16.35)
38
(16.96)
3
(1.33)
122
(54.46)
44
(19.64)
17
(7.59)
224
(100.00)
4. Tanda 206
(10.49)
30
(12.40)
11
(4.54)
145
(59.92)
43
(17.77)
13
(5.37)
242
(100.00)
5. Baskhari 223
(11.36)
22
(18.18)
4
(3.30)
55
(45.45)
27
(22.31)
13
(10.74)
121
(100.00)
6. Ramnagar 221
(11.26)
50
(26.31)
10
(5.26)
98
(51.58)
25
(13.16)
7
(3.68)
190
(100.00)
7. Jahangirganj 188
(9.58)
36
(15.38)
16
(6.84)
159
(67.95)
14
(5.98)
9
(3.85)
234
(100.00)
8. Jalalpur 273
(13.91)
37
(22.020
2
(1.19)
9
(53.5700
34
(20.24)
5
(2.98)
168
(100.00)
9. Bhiyaon 169
(8.61)
28
(20.00)
4
(2.86)
76
(54.28)
22
(15.71)
10
(7.14)
140
(100.00)
Total 1,963
(100.00)
305
(18.21)
60
(3.58)
915
(54.63)
299
(17.85)
96
(5.73)
1,675
(100.00)
Figures in bracket show percentage.
Source: District Statistical Office, Ambedkarnagar District, 2010-11.

82
Communication
Table 3.18 shows the block wise distribution of different communication
services in the district. There are 350 post offices in the district. It varies from block
to block ranging between 32 in Baskhari and 50 in Akbarpur block. In case of public
PCO, there is a great regional variation among different blocks of the district, which
ranges between 40 (4.11 per cent) in Bhiyaon and 203 (20.86 per cent) in Tanda
block. The situation of private telephone is near about same to that of previous one,
where the block of Bhiyaon and Tanda shares 710 (4.97 per cent) and 3,045 (21.33
per cent) of the total number of telephones respectively.
Table 3.18. Block wise Number of Different Communication Services in
Ambedkarnagar District, 2010-11
S.
No. Block
Post
Offices
Telegraph
Offices PCO Telephone
1. Bhiti 43 1 50 899
2. Katehri 36 2 55 750
3. Akbarpur 50 3 183 881
4. Tanda 37 3 203 3,045
5. Baskhari 32 2 155 3,016
6. Ramnagar 35 1 68 872
7. Jahangirganj 41 2 65 1,115
8. Jalalpur 39 2 154 2,985
9. Bhiyaon 37 3 40 710
Total 350 19 973 14,273 Source: District Statistical Office, Ambedkarnagar District, 2010-11.
3.3.5 Banking Facilities
Financial institutions like banks are one of the important components in the
process of socio-economic development for any region. It is the banking system
which regulates the monetary resources in the region. It includes commercial banks,
cooperative banks, primary agricultural banks, credit societies etc. These institutions
promote saving on one side and investment in the other. These institutions are some
time also called as “facilitators”. It provides loans to the traders, farmers, business
units, and small and cottage industries owner for a short period of time, so they can
fulfill their immediate needs.

83
Table 3.19. Block wise Distribution of Village Banking Facilities, 2010-11
S.
No. Block
Types of Banks
Total Cooperative
Banks
Commercial/
Rural Banks
Primary
Agricultural
Banks
1. Bhiti 7 18 7 32
(10.49)
2. Katehri 10 17 10 37
(12.13)
3. Akbarpur 6 18 15 39
(12.79)
4. Tanda 4 12 13 29
(9.51)
5. Baskhari 5 14 13 32
(10.49)
6. Ramnagar 9 29 18 56
(18.36)
7. Jahangirganj 6 10 10 26
(8.52)
8. Jalalpur 7 11 15 33
(10.82)
9. Bhiyaon 4 9 8 21
(6.89)
Total 58
(19.02)
138
(45.24)
109
(35.74)
305
(100.00)
Figures in bracket show percentage.
Source: District Statistical Office, Ambedkarnagar District, 2010-11.
Table 3.19 shows the block wise village banking facilities in the district. In
total, there are 305 banks in the district, out of which 58 (19.02 per cent) are
cooperative banks, 138 (45.24 per cent) are commercial/rural banks whereas 109
(35.74 per cent) are primary agricultural banks. Through these banks, the farmers and
cultivators get loans and other economic support and in turn, they deposit their
earnings and profits for getting further interest. The block wise study shows that the
block of Ramnagar have highest number of banks i.e. 56 (18.36 per cent) in the
district, whereas Bhiyaon block have only 21 (6.89 per cent) banks (fig 3.14). The
number of banks in other blocks are Akbarpur (39), Katehri (33), Bhiti and Baskhari
(32 each), Tanda (29) and Jahangirganj (26).

84
Fig. 3.14
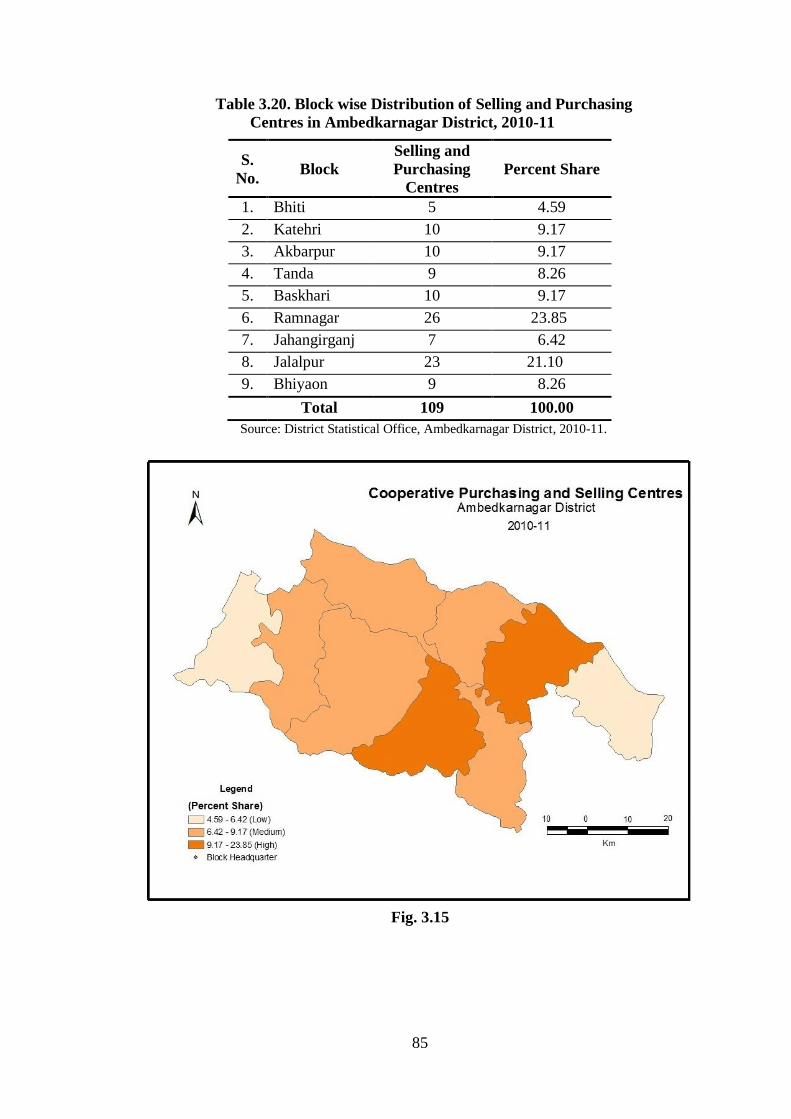
3.3.6 Purchasing and Selling Centres
In rural areas, cooperative purchasing and selling centres act as a linkage
between small farmers and big traders to sell their produces. There they get suitable
prices for their produce. These centres act as incentives for farmers to produce crops.
They ensure selling of produce even for those who can‟t go to big selling centres.
Table 3.20 shows the distribution of selling and purchasing centres in different
blocks of the Ambedkarnagar district. The study indicates that there are 109
cooperative sale and purchase centres in the district. Fig 3.15 shows that there is a
great regional variation among different blocks as far as such sale and purchase centre
is concern. It varies between 5 (4.59 per cent) in Bhiti and 26 (23.85 per cent) in
Ramnagar, followed by 23 (21.10 per cent) in Jalalpur and 10 each (9.17 per cent) in
Katehri, Akbarpur and Baskhari, respectively.
85
Table 3.20. Block wise Distribution of Selling and Purchasing
Centres in Ambedkarnagar District, 2010-11
S.
No. Block
Selling and
Purchasing
Centres
Percent Share
1. Bhiti 5 4.59
2. Katehri 10 9.17
3. Akbarpur 10 9.17
4. Tanda 9 8.26
5. Baskhari 10 9.17
6. Ramnagar 26 23.85
7. Jahangirganj 7 6.42
8. Jalalpur 23 21.10
9. Bhiyaon 9 8.26
Total 109 100.00
Source: District Statistical Office, Ambedkarnagar District, 2010-11.
Fig. 3.15

86
References
Burrad, S.S. (1915). Origin of the Gangetic Trough: Commonly called the Himalayan
Fore-deep, Proceeding of Royal Society, London, Vol. 91-A, pp. 220-238.
Census of India (2001). Provisional Population Totals, Office of the Registrar General
and Census Commissioner, India, Ministry of Home Affairs.
Chandna, R.C. (1980). Introduction to Population Geography, Kalyani Publishers,
Ludhiana, p. 31.
District Planning Map (2005). National Atlas and Thematic Mapping Organization,
D.S.T., Kolkata.
Krishnan, S.S. (1915). Geology of India and Burma, Madras, p. 511.
Suess, E. (1904-24). The Face of the Earth, Oxford, Vol.5.
U.P. District Gazetteers - Faizabad (1960). pp. 23-25.