chapter 3 developing and testing resident-reported quality ... · developing and testing...
TRANSCRIPT

Chapter 3
Developing and Testing Resident-Reported Quality of Life Measures
This chapter describes our approach to developing Quality of Life (QOL) measures and
the results of scale development during two waves of data collection. It begins with a review
of the background on QOL measurement, especially for nursing home residents and the state
of the art of QOL measurement at the time we began the project. It describes the fielding
and psychometric work on two iterations of QOL measures, and the domain structure of those
measures. It also discusses the extent to which residents with cognitive impairment are able
to complete direct interviews on their QOL.
Background
QOL Measurement in General
QOL tends to be the subject matter of novelists and philosophers. In the last few decades
of the 20th century, it also became the province of psychometricians, health services researchers,
and health policy-makers, who have tried to translate the construct into one or more scales to use
to measure the deliberate outcomes of health interventions or consequences of health care gone
wrong. QOL is sometimes contrasted with more narrow outcomes related to physical health.
Some scholars simply use QOL as a summary term, connoting a multidimensional appraisal
of a variety of important aspects of life, including health outcomes (Arnold, 1991). When used
this way, QOL is either summarized into a single score or profiled in a series of scores reflecting
different components or domains of QOL. The term health-related quality of life (HRQOL)
narrows the QOL concept to aspects of life affected by a person’s health condition and its
treatment; literally hundreds of HRQOL measures are available, some relating to general health-
related QOL and some to QOL related to a specific disease. Thinking about adults of all ages,
Page 3.1

some commentators state that the “agreed upon” domains of HRQOL are: physical health and
functioning, emotional health, cognitive functioning, role performance and work productivity,
sexual functioning, and life satisfaction. To reduce such dimensions to a smaller number of
items, the SF-36 measure was created; it has been further shortened and it’s various versions are
frequently used to measure QOL (Ware Jr. & Sherbourne, 1992). In the same vein, the World
Health Organization has created the WHOQOL, a 28-item questionnaire that includes items
tapping a wide range of physical, functional, psychological, social, and satisfaction elements
(Kuyken & Orley, 1994) and the EuroQol reduces HRQOL to 5 items, each tapping one domain:
mobility, self care, usual activities, pain/discomfort, and anxiety/depression (Dolan, 1997).
In some health contexts, HRQOL is narrowly interpreted. For example, in the 1960s
measures of the ability to perform tasks of daily living was proposed as a way of looking at
outcomes for rehabilitation patients that went beyond disease parameters to consider QOL
(Katz, Ford, Moskowitz, Jackson, & Jaffee, 1963). Four decades later, the widespread
acceptance of ADL scales remains a substantial accomplishment, yet the ability to toilet, eat,
transfer, dress, and bathe independently should hardly be equated with having a good QOL.
Similarly, in the oncology literature, a disease-free interval sometimes stands in for QOL, but
now broader applications in oncology look to psychological well-being and social involvement
as signifying QOL. Because the conditions of the lives of older people are significantly altered
when they move to nursing homes, a broader concept of QOL is indicated than mere HRQOL.
QOL Measurement for Older People
We literally identified thousands of articles on QOL with a key word search. Less common
are articles that deal with QOL of older people. It is reasonable to assume that the dimensions
relevant to QOL might change for seniors compared to younger adults.
Page 3.2

Three edited volumes have appeared since 1991 summarizing QOL for elders (Abeles,
Gift, & Ory, 1994; Birren, Lubben, Rowe, & Deutchman, 1991; Noelker & Harel, 2001).
Taken together, the chapters in these books cover a wide variety of topics, including social,
psychological, environmental, functional, health, and family dimensions.
In the first of these volumes, Lawton proposed a model of QOL that would include
behavioral competence (assessed by third parties), perceived QOL (with items paralleling
behavioral competence spheres but assessed through the subjective appraisal of the older
person), environmental dimensions (i.e. objective features of the social and physical environment
that might influence outcomes), and psychological well-being, the latter perceived as “the
ultimate outcome in a causal model (Lawton, 1991, p. 11).” In this formulation, Lawton also
stressed that QOL has temporal dimensions including reflection on the past and expectation of
the future as well as appraisal of the present, a comment also made by Atchley, in his emphasis
on the need for cues in the present that reinforce identity (Atchley, 1991), and by Svensson, in
his claim that people who evaluate their QOL “must engage in some form of autobiographical
process with the intention of evaluating and synthesizing the meanings and involvements that
have been experienced so far (p.258), and that those who compose a successful synthesis are
most likely to experience a good QOL (Svensson, 1991). Similarly, Katz and Gurland posit
a holistic concept that they call “an irreducible network of interwoven parts, encompassing the
elders themselves (mind, body, and spirit), their animate and inanimate environment, their life
experiences in time and space, and the functions or powers created by the interwoven parts”
(p. 341) (Katz & Gurland, 1991).
Anita Stewart proposed a conceptual framework laying out 14 domains of QOL for
older people: physical functioning, self maintenance, usual activities, social functioning, sexual
Page 3.3

functioning & intimacy, psychological well-being and distress, cognitive functioning, pain
and discomfort, energy/fatigue, sleep, self-esteem, sense of mastery, perceived health, and life
satisfaction; many of these domains were organized into sub-categories (Stewart & King, 1994).
QOL is clearly a multidimensional construct, but which and how many dimensions are
appropriate to tap when considering the well-being of older individuals who receive LTC
is less clear.
QOL for Nursing Home Residents
As part of the nursing home regulatory reforms of 1987, CMS previously had already
developed the MDS and had accomplished substantial work in developing quality of care
indicators. Therefore, our work at the University of Minnesota called for developing QOL
measures that reflected domains that were either omitted from or not especially emphasized in
the MDS. We needed to determine what elements should be examined for nursing home
residents with reasonably good cognitive functioning. Adding to the complexity, we also needed
to consider how, if at all, we could assess QOL of residents with moderate or severe cognitive
impairment for whom inferences about their QOL are difficult to make..
The inquiry needs to be brought to older long-term care consumers themselves. The
exercise of asking older people what is important to them with reference to their QOL is an
essential step in defining the constructs, but is fraught with peril. If older people with no need
for long-term care are polled, they may have different and higher expectations for their QOL
than their more frail counterparts. They may also be more willing to perceive that a decent QOL
is possible even when one has contracted difficult conditions (e.g., stroke, Parkinson’s disease,
severe arthritis, dementia) that create the need for long-term care. Given problems in learning
directly about the values and preferences of nursing-home residents, the information is most
Page 3.4

often gathered on small samples of the residents easiest to interview or engage in focus groups.
These limitations notwithstanding, research evoking the resident voice on the elements of a
good QOL tends to find that residents care about aspects of relationships, activity, stimulation,
and security (Abt Associates, 1996; Cohn & Sugar, 1991; NCCNHR, 1865). Commentators also
stress the importance of control and autonomy, bringing both theory and empirical findings to
buttress that contention (Abeles, 1991; Kane et al., 1997).
Our review identified several researchers who were working to develop simple self-report
QOL measures that could be completed by residents with substantial dementia. Most noteworthy
is a 13-item rating of aspects of life developed by Rebecca Logsdon and others (Logsdon,
Gibbons, McCurry, & Terri, 1999) and a longer dementia QOL battery (D-QOL) developed by
Meryl Brod, Anita Stewart, and others, which includes self-rating on presence of various
emotions (Brod, Stewart, Sands, & Walton, 1999; Stewart, Sherbourne, & Brod, 1996). The
D-QOL comprises 5 QOL domains: aesthetics; positive affect, negative affect, self-esteem, and
feelings of belonging. Other approaches permit merging data provided by residents themselves,
family members, and staff. One such approach of Rabins and colleagues was the ADHLQ,
which has five domains: social interaction; awareness of self; feeling and mood; enjoyment of
activities; and response to surroundings (Rabins, Kasper, Kleinman, Black, & Patrick, 1999).
Collectively, these efforts gave credence to the idea that it would be possible to obtain QOL data
directly from residents. Though some of the tools elicit only binary data, others, including the
Brod et al. tool successfully used 5-point scales.
Similarly Schnelle and Simmons reported success with measures gleaned directly from
nursing home residents who participated in their studies of urinary incontinence treatment
(Simmons et al., 1997). During the late 1990's under a small business grant from the National
Page 3.5

Institute on Aging, Uman and colleagues from the Los Angeles firm, Vial Research, tested an
approach to self-reported quality, which they called Resident Experience and Assessment of Life
or REAL (Uman, 1995; Uman & Urman, 1997). Using the REAL, interviewers hired by the
firm asked the resident a variety of direct questions including factual ones as to whether they
received help with a variety of ADL functions. At the time we reviewed it, the REAL generated
6 factors: Help and Assistance; Communication with Staff; Autonomy and Choice;
Companionship; Safety and Security; Food and Environment. The response choices were yes-
no. What few preliminary data were then available showed little variation among residents on
their responses to the REAL items.1
A tendency can be noted to use satisfaction measures as the major resident-reported gage of
nursing home quality and to conflate satisfaction results with QOL. When this contract was let
in 1998, both nursing home national trade associations were in the midst of developing self-
reported satisfaction tools, and many individual facilities and nursing home chains had their own
satisfaction ratings. Some authorities proposed using the MDS-derived QI’s combined with
resident and family satisfaction surveys as overall quality measures.
By definition, measuring satisfaction entails eliciting a subjective appraisal from the
resident, but satisfaction can include many domains besides QOL, including appraisals of various
aspects of care (Smith, 2000: Cohen-Mansfield, Ejaz, & Werner, 2000; Zimmerman & Bowers,
2000. We found a huge number of nursing home satisfaction tools, partly as a result of our 5-
state survey described in Chapter 2. Additionally, the American Association of Homes and
Services for the Aging had done a survey of its members and identified hundreds of similar tools.
1We were able to locate little published data on the REAL. On a recent visit, the developer’s
Website claimed relationships between REAL items and MDS-derived Quality Indicators. We last visited the site, htpp//www.vitalresearch.com, August 23, 2003.
Page 3.6

These tools typically have not been studied for their psychometric properties and the facilities
utilizing them typically use convenience samples and obtain low response rates.
New regulatory standards on QOL and on Residents’ Rights were promulgated in 1987.
These standards emphasize the maintenance of the dignity of the individual, provision of
individual choices and opportunities for participation in their own care planning, their choices
for how to spend their time, and facility governance, as well as respecting each resident’s
individuality and preferences. The Residents’ Rights standard additionally asserts rights to
association, privacy, information, and the full gamut of civil rights of citizens. Because these
elements have been associated with nursing home QOL and are part of what the surveyors seek
to enforce, they needed to be incorporated into the QOL measures.
Identifying QOL Domains
Approach
One of the first tasks in this project was to identify QOL domains. Although it is feasible to
develop brief unidimensional measures to stand in for QOL, most authorities view QOL as a
multidimensional construct. The work performed under this CMS Task Order was meant to give
attention to important elements of well being in nursing homes that are not well captured by
existing measures of quality of care and health outcomes. The Task Order specified, for
example, that perceived health, ability to perform activities of daily living (ADL), cognitive
ability, and emotional health (all aspects that are sometimes considered part of a QOL construct)
were outside our scope. These exclusions were logical because many brief self-report measures
have been well-established to measure those constructs. Accordingly, we emphasized the
psychological and social aspects of QOL.
Page 3.7

Domain Selection
To establish domains of QOL, we undertook the following steps:
• Review of literature on aspects of a good life for older people, and studies of what is important to older people with disabilities, including those in nursing homes. Among the many sources used for this work, an important source was the qualitative, more “anthropological” components of the Abt evaluation of the nursing home survey process (Abt Associates, 1996). Also useful were focus group and interview studies that directly queried older people about the relative importance of various aspects of their everyday life in contributing to their well-being ((Bowers & Joyce, 1996) (Degenholtz, Kane, & Kivnick, 1997; Green, Hawes, Wood, & Windsong, 1998; Kane et al., 1997; NCCNHR, 1865; Salmon & Weber, 1998), anthropological and ethnographic treatments of life and work in nursing homes (Bennett, 1980; Diamond, 1992) (Gubrium, 1993), (Henderson, 1995; Henderson & Vespari, 1995; Lidz, Fischer, & Anrold, 1992) Lidz, Fischer & Arnold, 1992; (Retsinas, 1986) (Shield, 1988); psychological analysis of the stresses of nursing home life and how to ameliorate them (Tobin, 1991, 1999); and first hand or fictionalized accounts by nursing home residents or front-line staff (Laird, 1985; Tisdale, 1987) (Tulloch, 1975, 1995).
• Review of existing summary measures of “psychosocial” QOL to identify the domains.
These include general QOL measures and measures tailored to people with dementia.
• Discussion with a wide variety of stakeholders (providers, regulators, professionals, family councils, advocates) and with identified technical consultants to the project.2
2For example, helpful input was gathered at a stakeholders meeting assembled by HCFA (CMS) in September
1998, the 1998 national meeting of the American Association of Survey and Certification Agencies and a 1998 meeting of the Minnesota Survey and Certification workers, meetings of American Association of Homes and Services for the Aging’s state affiliate in Minnesota and regional affiliate in Rochester, NY; meetings of the American Health Care Association state affiliates in Minnesota and Florida, a Family Council Workshop sponsored by the Minnesota Advocacy Center for Long-Term Care; and a meeting sponsored by the California Health Care Foundation during which multiple stakeholders considered what consumers want to know in selecting nursing homes. Among the organizations sending material for review were: the American Dietetic Association, the National Association of Social Workers, the American Association of Home and Services for Aging, the American Health Care Association, and several hospice organizations. Individual comments at various times were made by Sarah Greene Burger, National Citizens Coalition for Nursing Home Reform; Dale Dannefer, Rochester, NY; Rosemary Fagin, Lifespan of Greater Rochester; Iris Freeman, Minnesota Advocacy Center for Long-Term Care; Charlene Harrington, University of California at San Francisco; Mary Jane Koren, Samuels Foundation, New York, NY; LuMarie Polivka-West, Florida Health Care Association; J. Munroe, Life Services Network of Illinois; Mary Tellis-Nyack, Beverly Enterprises; William Thomas, The Eden Alternative; Catherine Unsino, New York City; Kimberly Van Haitsma, Philadelphia Geriatric Center; Carter Catlett Williams, Rochester, NY; and Keren Brown Wilson, Assisted Living Concepts, Portland, OR. We made site visits to selected nursing homes where we made observations and conducted discussions about the nature of a good QOL with key staff; these include Evergreen Retirement Community in Oshkosh, WI; Catholic Eldercare in Minneapolis, MN; Jewish Home for the Aged and Monroe County Community Hospital in Rochester, NY; and Fairport Baptist Home, in Fairport, NY. In-person or telephone discussions were held with state regulatory officials in states where the field work was planned, often followed up by written materials describing best practices in QOL matters. Contacts included: Brenda Klutz, California Department of Health Services; Laura Leeds and Kathleen Cantaben, New York State Department of Health; Polly Lever, Florida Agency for Health Care Administration; Kathy Morris Bill Conroy, New Jersey Health Department; and Michael Triplett and Mary Absolon from the Minnesota Health Department.
Page 3.8
• Review of the statues and F-tags in current use related to QOL. These “QOL F-tags” fall under a variety of standards besides the one labeled “QOL.” It was important to ensure that the content related to specific deficiencies that surveyors are expected to cite was covered under the proposed domains.
As a result of the above activities, we identified 11 domains that, taken together, could
provide an overview of QOL. These are: autonomy, individuality, dignity, privacy, enjoyment,
meaningful activity, relationships, security, comfort, spiritual well-being, and functional
competence. Table 3.1 identifies the QOL domains and their definition.
Further Review of Existing Measures
We took the following steps to identify and review existing measures of overall QOL and
of the eleven selected outcome domains.
• We used key words to search the published literature on topics such as loneliness, spiritual well-being, social activity, social relationships, autonomy, and dignity.
• Typically, we identified one or more recent review articles for each domain, which, in
turn, led us to more specific instruments, articles, and researchers. We also reviewed recent books and journal issues dealing with assessment of older people (Gallo, Reichel, & Anderson, 1995; Rubenstein, Wieland, & Bernabei, 1995). In this effort, we were assisted because the investigators were in the process of writing a sequel to their 1981 book on assessment tools for use with older people (Kane & Kane, 2000) and had been reviewing materials for that new book in 1997 and 1998.
• We cross-referenced these searches with terms like “aging” and “nursing homes” for both
the domain-specific reviews and the reviews of general literature on “QOL” and “health-related QOL,” where much of the voluminous literature is not pertinent to our context or target group.
• We searched for measures developed for assisted living setting serving older people. A
key marketing tool of assisted living is that it will offer residents a better QOL than does the nursing home and, therefore, it was of interest to see whether and how that concept had been made operational.
• We conducted a specific literature review on QOL measures for people with Alzheimer’s
disease or other dementia.
• We conducted a specific literature review for measures of physical environments for older people.
Page 3.9

Page 3.10
• We examined measures developed for various studies, such as the cooperative trial of Alzheimer’s Special Care Units in nursing homes. This was facilitated by the fact that three of the principals for the CMS QOL study were investigators in that Initiative and had access to the assessment materials developed (Teresi, Lawton, Ory, & Holmes, 1994).
• We contacted investigators based on summaries of their research abstracts, and we wrote
for and received a large number of measures that were mentioned in the program of the 1997 Gerontological Society of America.
Comments about Existing Tools
Having assembled and reviewed hundreds of instruments that might be used to measure
overall QOL for seniors or one of our QOL domains, we made the following generalizations
about the state of the QOL measurement in nursing homes at the time our study began.
• QOL measures varied enormously in their length, level of synthesis, and number and nature of domains tapped. No single measure could be taken off the shelf and used for QOL in nursing homes.
• Many measures that are meant to be summary measures of all aspects of functioning
including physical such as the SF-36 (Ware Jr., 1996) and its shorter version, the SF-12 (Ware, Kosinski, & Keller, 1996) give little attention to the constructs that are specific to a good QOL in nursing homes.
• Many existing measures in use to measure QOL for older people are too highly
summarized to be a good guide to or measure of the effects of quality improvement efforts, nor do they tap specifically into the dimensions of QOL that are part of the federal nursing home regulations, such as dignity, individualization, and autonomy or self-determination.
• Some promising approaches are still new and without established psychometric
properties or norms.
• Considerable effort has been made to measure satisfaction of nursing home residents and their family members, including tools developed by the industry. The tendency of most residents to report satisfaction is a generic problem noted in the literature.
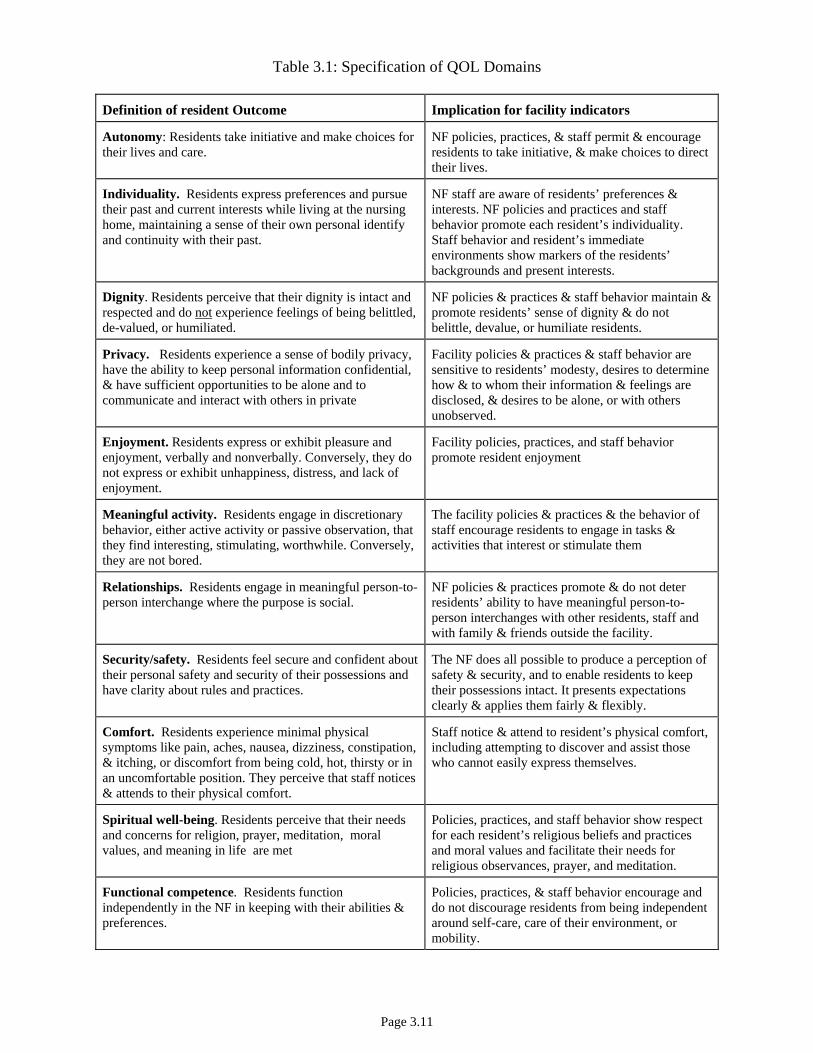
Table 3.1: Specification of QOL Domains
Definition of resident Outcome Implication for facility indicators
Autonomy: Residents take initiative and make choices for their lives and care.
NF policies, practices, & staff permit & encourage residents to take initiative, & make choices to direct their lives.
Individuality. Residents express preferences and pursue their past and current interests while living at the nursing home, maintaining a sense of their own personal identify and continuity with their past.
NF staff are aware of residents’ preferences & interests. NF policies and practices and staff behavior promote each resident’s individuality. Staff behavior and resident’s immediate environments show markers of the residents’ backgrounds and present interests.
Dignity. Residents perceive that their dignity is intact and respected and do not experience feelings of being belittled, de-valued, or humiliated.
NF policies & practices & staff behavior maintain & promote residents’ sense of dignity & do not belittle, devalue, or humiliate residents.
Privacy. Residents experience a sense of bodily privacy, have the ability to keep personal information confidential, & have sufficient opportunities to be alone and to communicate and interact with others in private
Facility policies & practices & staff behavior are sensitive to residents’ modesty, desires to determine how & to whom their information & feelings are disclosed, & desires to be alone, or with others unobserved.
Enjoyment. Residents express or exhibit pleasure and enjoyment, verbally and nonverbally. Conversely, they do not express or exhibit unhappiness, distress, and lack of enjoyment.
Facility policies, practices, and staff behavior promote resident enjoyment
Meaningful activity. Residents engage in discretionary behavior, either active activity or passive observation, that they find interesting, stimulating, worthwhile. Conversely, they are not bored.
The facility policies & practices & the behavior of staff encourage residents to engage in tasks & activities that interest or stimulate them
Relationships. Residents engage in meaningful person-to-person interchange where the purpose is social.
NF policies & practices promote & do not deter residents’ ability to have meaningful person-to-person interchanges with other residents, staff and with family & friends outside the facility.
Security/safety. Residents feel secure and confident about their personal safety and security of their possessions and have clarity about rules and practices.
The NF does all possible to produce a perception of safety & security, and to enable residents to keep their possessions intact. It presents expectations clearly & applies them fairly & flexibly.
Comfort. Residents experience minimal physical symptoms like pain, aches, nausea, dizziness, constipation, & itching, or discomfort from being cold, hot, thirsty or in an uncomfortable position. They perceive that staff notices & attends to their physical comfort.
Staff notice & attend to resident’s physical comfort, including attempting to discover and assist those who cannot easily express themselves.
Spiritual well-being. Residents perceive that their needs and concerns for religion, prayer, meditation, moral values, and meaning in life are met
Policies, practices, and staff behavior show respect for each resident’s religious beliefs and practices and moral values and facilitate their needs for religious observances, prayer, and meditation.
Functional competence. Residents function independently in the NF in keeping with their abilities & preferences.
Policies, practices, & staff behavior encourage and do not discourage residents from being independent around self-care, care of their environment, or mobility.
Page 3.11

• As already noted, considerable emphasis had been given to measure well-being,
including QOL, for people with dementia in nursing homes. Some of these measures concentrate on behavioral symptoms exhibited by the person with dementia, which tend to render caregiving difficult but may not always equate with a poor QOL as experienced by the person with dementia. Most of the approaches for examining functioning of the person with dementia rely on the summary reports of caregivers. In staff report or caregiver report measures, we give the greatest credence to those that have highly specific reference points for the way each item is defined. The MOSES tool is one of the better-established tools of this nature, and we drew on it for our own line-staff report measure. The development and testing of self-report measures of QOL directly with people with dementia is a newer phenomenon.
• Extant tools to examine QOL of nursing home residents were more pertinent to people
with dementia than to a cognitively intact resident. This was also true of the tools to rate physical environments, many of which were developed for studies of dementia special care units.
Measurement Development: Wave 1
As Chapter 2 indicated, our intent was to field a longer instrument in Wave 1 than might be
practicable in order to identify the items to preserve in longer and shorter scale. The shorter
scales were then to be tested at Wave 2. We further intended to use Wave 1 to determine how
well nursing home residents with various states of cognitive ability would be able to participate
in the interview. Thus, in Wave 1 we drew a random stratified sample of residents in each of 50
facilities (including those with higher and lower cognitive functioning).
Questionnaire
As a result of all the review and preliminary work described, we identified an item pool for
the identified 11 QOL domains. As indicated in Chapter 1, our intent was to develop self-report
measures to which nursing-home residents would respond directly. After pre-testing eighty-
eight (88) candidate items were fielded in Wave 1 for the 11 QOL domains. Preliminary
assignments to domains ranged from 4-13 items. The QOL items were embedded in a longer
questionnaire that also included: some demographic data, self-assessment of emotional state,
Page 3.12

and a series of summary items rating QOL (a general statement for each QOL domain and one
for life as a whole), and a series of items on satisfaction. The Wave 1 questionnaire is found
in Volume 2, Appendix B.
One of the innovative features of our approach was the effort to combine a more graduated
set of response categories for residents who could use them with a reversion to a binary response
set for those who could not handle Likert scales for any or all the questionnaire. Accordingly,
seventy-two (72) of these potential QOL items provided a 4-point Likert response format,
usually with the choice, “often, sometimes, rarely, never.” The protocol required that the
interviewers encourage the respondent to reply using Likert formats. After 3 attempts to evoke a
Likert-type response, the interviewer offered respondents a response choice of “mostly yes” or
“mostly no.” Of the remaining 13 QOL candidate items, 7 were asked in a dichotomous format
from the outset. These included questions for which a Likert response would make no sense.
These included 3 items in the social relationship category (i.e. considering any resident to be a
close friend, having a confidante, and being a confidante), 3 meaningful activity items (i.e.
developing a new interest, continuing with an old interest, and leaving the facility grounds for a
non-medical reason), and 1 individuality item (bringing something to the nursing home that
made the resident feel at home). Four (4) questions were posed in terms of whether some
activity (e.g., taking walks, taking of baths, being outdoors, and participating in religious
observances) happened too much, not enough, or the right amount; these trichotomous questions
were eventually treated dichotomously with the right amount contrasted to “too much” or “not
enough.” Finally, one item had 5 possible choices and one had three.
Emotional well-being. We adapted part of the Dementia-QOL scale (Brod, et al., 1999;
Page 3.13

Stewart, Sherbourne, & Brod, 1996) to measure emotional well-being.3 Residents were asked
how often they experienced 10 feeling states (lonely, happy, bored, angry, contented, worried,
interested in things, sad, afraid, and looking forward to the future) during the last few weeks
(often, sometimes, rarely, or never). As with the QOL items, we developed an alternative format
for the emotions, which simply asked whether or not they had felt the particular emotion in the
last two weeks. This combined scale yielded a Cronbach alpha of .80. According to Lawton’s
model of QOL, self reported QOL (one of his four dimensions) should be correlated with
emotional health, another dimension in his schema (Lawton, 1991).
Satisfaction. Also, for comparison with our QOL measures, we asked 4 global questions,
each on a 4-point scale, about satisfaction tapping the nursing home’s services and programs,
their own room and bathroom; the physical setting other than their room and bathroom; and the
likelihood of recommending the nursing home to a friend. A comparable yes-no fall-back format
was for residents who could not use the Likert option. The combined scale had an alpha of .75.
Summary ratings. Residents rated the QOL in their nursing home according to 11 summary
items (each reflecting a QOL domain) and his/her life as a whole. For example, we asked,
“considering your life at __, how would you rate the quality of your life as far as feeling
physically comfortable: excellent, good, fair, poor.” “Having the privacy you want?” These
ratings too offered both Likert and binary response formats.
Data Collection
All English-speaking residents over 65 were eligible for the sample unless comatose or in a
vegetative state. No sampled residents were eliminated for interviews without in-person
3The DQOL included 5 ratings of kinds of enjoyment, 24 ratings of feeling states, and an overall QOL rating. Subjects rated the frequency of each feeling state on 5-point scales. This work established the ability of people with dementia to complete multiple ratings. We modified the approach by selecting fewer feeling states and used a four-point response scale, which mirrored the response set for our other QOL items.
Page 3.14
screening; 325 residents who could not be roused or respond coherently to a screening protocol
based on securing responses to a greeting were not interviewed. Interviews were attempted for
all others, but interviewers were permitted to abort the interview if residents gave non-responsive
or incoherent answers to 8 of the 13 comfort items on the first page of the questionnaire.
Interviews lasted 45 to 90 minutes and were ordinarily conducted in residents’ rooms.
Occasionally, because of residents’ schedules or fatigue levels, interviews were done in several
sittings. Divided data collection was needed for only 5% of the QOL interviews. Using the
Likert responses did not account for longer interviews; interview length was increased when the
resident was gregarious or in need of help in becoming oriented to the interview.
Wave 1 Findings
Developing a scoring system
Because residents could shift between the Likert-type and binary response options during
the interview, we generated a procedure to combine the two response formats. As a first step in
achieving comparability across the two response options, we applied z-transformations for each
item, separately for the Likert and dichotomous response options. The results of these z-
transformations were combined into one variable that included information from all residents
who had answered the question, regardless of response option chosen. For each of these
combined z-transformed items, we examined the “yes” and “no” responses relative to the Likert-
type responses. For the majority of items, the “yes” and “no” responses corresponded to 3.8 and
1.5 respectively in the metric of the Likert-type responses. Because our goal was to create a
simple method of interpolating these dichotomous responses into the Likert-type responses, we
adopted this recoding scheme for all items that offered both response sets.
Using this information, the following transformation was used to generate item scores for all
Page 3.15

individuals who provided a valid response (i.e., Likert-type or “yes/no”): most positive Likert =
4; positive binary = 3.8, positive Likert = 3, negative Likert = 2, negative binary = 1.5, most
negative Likert = 1. In applying these scales we required that 75% of all items needed for the
scale be completed, in which case we imputed the items with missing or “don’t know” responses
to the mean of that scale for the particular individual. For the small number of dichotomous
items, we coded yes as 4 and 1 as no, so as not to count positive responses on important
questions (e.g., having any resident as a close friend, having a confidante, developing a new
interest) as less than the Likert style questions that were scored between 4 and 1. The 5 possible
responses to the question “How often have you been outside? “ were scored using equal intervals
between 4 and 1, and the item “Do you consider one or more staff members to be a friend” was
scored as 4 for “more than one,” 3 for “one,” 1 for “none.” We required that 75% of items be
completed for scales with 4 items and at least 66% for scales with 5 or more items,
in which cases we imputed the missing items to the mean of that individual for the scale. No
missing items were allowed for the 3 item scale.
Validation and Item reduction.
We specified a priori which items we thought should load on each of the 11 domains, with
the domain assignments ranging from 14 to 4 items. Although we fielded 88 candidate items, we
eliminated 12 items from analyses because of highly skewed distributions or high rates of non-
response. Confirmatory factor analysis (CFA) on the remaining 76 items suggested that the
individuality and relationship domains were practically indistinguishable (r =.99). Because the
reliability of the individuality scale was poor (alpha = .56), we dropped this domain. The
resultant model had 10 factors and fit the data well (Π2 = 6024, df=2310, p<.0001; RMSEA =
.044; CFI = .973).
Page 3.16

We assessed concurrent validity by testing the hypothesis that each QOL domain is
positively correlated with overall satisfaction and with better emotional well-being. We also
tested the hypothesis that each domain would be associated with the single summary rating of
that domain by regressing each domain score on all summary items.
Each question was developed to tap at least one domain; in some cases an item could readily
have been logically placed in more than one domain. We used regression models to test the
relationship between the domain scale scores and the summary items that were considered to
assess each domain. Likewise we used the same approach to examine the linkage between the
single item that reflected overall QOL and each of the domain scales.
To develop and test the domain scores we used a data set comprised of those respondents
who were able to answer at least 85% of the Likert response items for the domain-related
questions. We then combined these respondents with those who were able to answer 85% of
these items using either Likert formats or a dichotomous response format. To pool the two
response formats, we created Z scores for the Likert responders and interpolated the dichotomous
responses into these. All analyses were then conducted using the z-scored data.
The first step in creating the domain scores was to specify the most appropriate domain for
each question. Several key project staff participated in an exercise of independent ratings and
differences were resolved prior to submitting the final list.
This part of the analysis utilized the reliability routine in SPSS. Specifically, for each QOL
domain, we calculated the alpha reliability of the items that were a priori assigned to that
domain. We then went through an iterative process where we eliminated individual items that
had low item-total correlations, and then examined how that impacted the reliability.
From this process, we created a set of long QOL subscales for the 11 domains. As table 3.2
Page 3.17
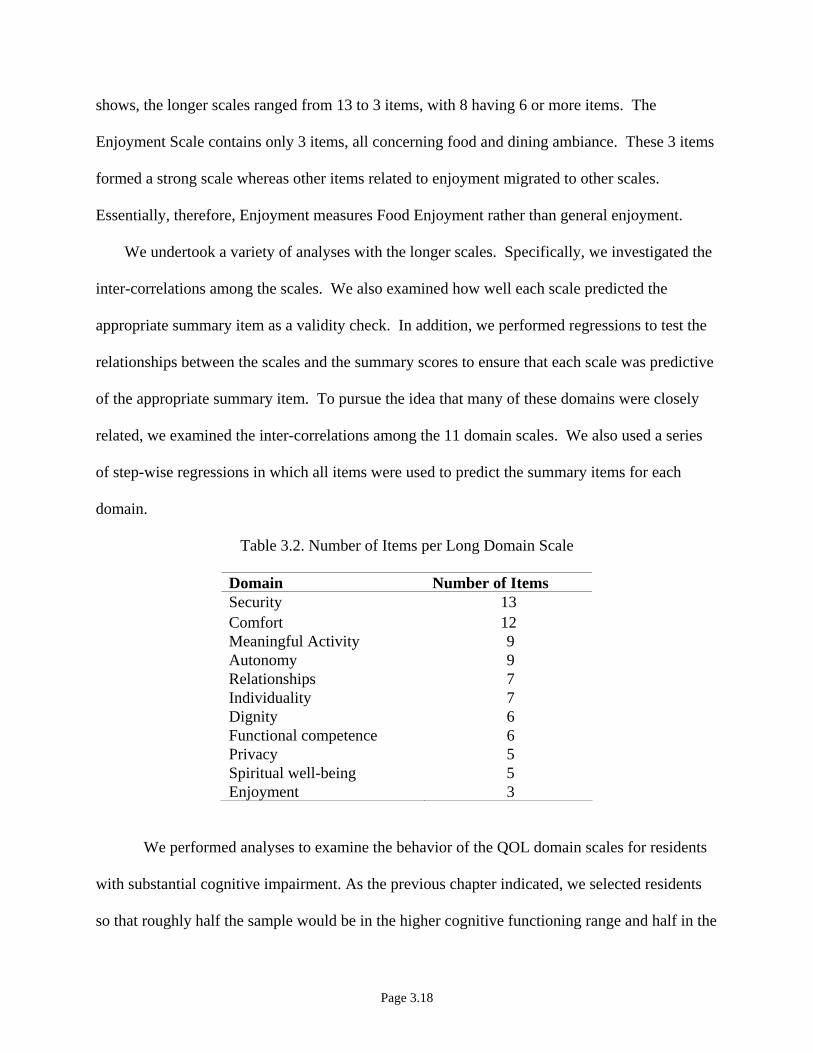
shows, the longer scales ranged from 13 to 3 items, with 8 having 6 or more items. The
Enjoyment Scale contains only 3 items, all concerning food and dining ambiance. These 3 items
formed a strong scale whereas other items related to enjoyment migrated to other scales.
Essentially, therefore, Enjoyment measures Food Enjoyment rather than general enjoyment.
We undertook a variety of analyses with the longer scales. Specifically, we investigated the
inter-correlations among the scales. We also examined how well each scale predicted the
appropriate summary item as a validity check. In addition, we performed regressions to test the
relationships between the scales and the summary scores to ensure that each scale was predictive
of the appropriate summary item. To pursue the idea that many of these domains were closely
related, we examined the inter-correlations among the 11 domain scales. We also used a series
of step-wise regressions in which all items were used to predict the summary items for each
domain.
Table 3.2. Number of Items per Long Domain Scale
Domain Number of Items Security 13 Comfort 12 Meaningful Activity 9 Autonomy 9 Relationships 7 Individuality 7 Dignity 6 Functional competence 6 Privacy 5 Spiritual well-being 5 Enjoyment 3
We performed analyses to examine the behavior of the QOL domain scales for residents
with substantial cognitive impairment. As the previous chapter indicated, we selected residents
so that roughly half the sample would be in the higher cognitive functioning range and half in the
Page 3.18

lower using a scoring process based on each resident’s MDS. The approach resulted in a score of
0-5, as shown in Table 3.3. For analytic purposes we divided into groups of residents with scores
of 0-2 for higher cognitive functioning (42.5%) and 3-5 for lower cognitive functioning (57.5%).
Table 3.3. Distribution of Cognitive Scores in Overall Sample
Cognitive score Percent of residents 0 18.4. 1 11.3 2 12.8 3 12.7 4 29.0 5 15.8
After performing the basic psychometric analyses on the first scales that we developed, we
attempted to create shorter versions. To do this we relied on cluster analysis. The goal of this
analysis was to select the items within each domain scale that best preserved the integrity of the
scale and discriminated that domain score from the others.
Response Rates Wave 1
Table 3.4 provides descriptive statistics for the entire sample (1988) and 4 sub-samples:
those for whom we could calculate no domains, those for whom we could calculate 1-4 domains,
those for which we could calculate 5-8 domains, and those for whom we could calculate and 9 or
more domains (N=1125).4 Sixty (60) per cent or more residents could respond sufficiently for
scale calculation, and residents who could complete any domains were likely to complete all or
most. Gender made no difference in completion rates, but older age, poorer ADL functioning,
poorer cognitive functioning, and longer length of stay were all highly significantly related to a
4 As a result of factor analysis, we eventually created 10 long scales. We then reduced the scale length in a procedure described in this chapter. As different items are used for domains and different imputation rules, the numbers who complete by domain change slightly. The principles remain the same: we could calculate domain scores for about 60% of residents. Given the
Page 3.19

lesser likelihood of being able to complete the questionnaire. Although older residents were less
likely to complete, nonetheless, we were able to construct QOL scores from large numbers of
very old residents; 71% of the whole sample were 81 or older and 67% of those for whom we
could complete 9-11 domain scores were 81 or older (not shown in the table). The relationship
between MDS-cognition score and completion was strong, but again some residents with poor
cognition were able to complete the tool. Of the 1988 in the sample, 44.5% had cognitive scores
of 4 or 5; we could calculate 9 or more domain scales from 24% of that group, compared to 45%
of those with scores of 0 and 1. Conversely, 24% of the 1225 residents for whom we could
calculate 9 or more domain scores fell in the 4-5 cognitive score range. Because the sampling
method was based on enumeration of the census 2-3 weeks prior to interviewing, very short-stay
residents are under-represented and only 14% had been admitted within the last 3 months.
similarities, we do not repeat these analyses for each version of the scales.
Page 3.20

Table 3.4. Description of Sample by Scale Completion for Long Scales (in Percents)
Number of Domains Completed Trait
Total sample
N=1988 0
N=672 1-4
N=104 5-8
N=87 9-11
N=1125 Female 76.7 80 75 76 75
Mean age * 85.3 86.6 86.7 87.4 84.2 Cognition score †
0 (best) 19 4 9 9 29
1 11 4 5 10 16
2 13 5 15 14 17
3 13 10 14 18 14
4 29 38 40 40 22 5 16 39 16 8 2
Cognitive group* 0-2 13 29 33 33 43 3-5 87 71 67 67 57
Mean Months Length of Stay*
32.56 40.9 33.52 26.68 27.94
ADL group# Needs help with 0-2 ADLS
75
55 73 82 86
Needs help with 3-5 ADLS 25 45 27 18 14 Bed mobility and/or
eating*
Needs help with neither 79 60 78 86 91 Needs help with one or both 21 40 22 14 9
* All significant differences are at p <0.000. Chi-squares were used for categorical variables (gender, ADL group, cognitive group, and those needing help with bathing and/or toileting [not tabled].) ANOVAs were used for age and length of stay. † Percentage may be more or less than 100% due to rounding. # ADLs used in this scale are: bed mobility, eating, transferring, toilet use, and dressing.
Page 3.21

Alpha Reliabilities for Longer Scales: Wave 1
Table 3.5 shows the Chronbach’s alpha coefficients for the each domain score for the two
cognitive groups. Ideally, alpha coefficients should be above .7. For those with higher cognitive
functioning, this test was met in 7 domain scores and came close to being met in 3 more (.64 or
better). Only the score for individuality fell short of the standard for alpha reliabilities. The
coefficients for the lower cognitive group are almost as good. More fail the .70 test but all but
one has an alpha score .63 or above. Again the poorest performing domain was individuality.
Table 3.5. Long Scales: Scale Reliability by Cognition Level
Alpha for long scales Domain
N Cog score
0, 1, 2
N Cog Score
3, 4, 5 Comfort 418 .72 357 .67 Functional competence 436 .82 505 .80 Privacy 411 .74 438 .67 Autonomy 293 .64 206 .68 Dignity 488 .77 561 .77 Meaningful activity 406 .64 335 .63 Enjoyment 487 .71 594 .72 Individuality 438 .57 347 .54 Relationships 470 .70 463 .68 Security 369 .79 282 .76 Spiritual well-being 425 .65 428 .64
Residents with Lower Cognitive Functioning
The numbers of residents from whom we have data available to construct scales vary
with the criterion applied to the data. For example, Table 3.6 shows these “response rates”
using two criteria: residents able to answer 85% or more of the questions when Likert items
are combined with dichotomous items; and residents able to answer 75% of the questions using
either the Likert or dichotomous format. Using the less stringent criterion, 16% of the lower
cognitive group and 55% of the higher cognitive group were able to provide useful responses.
Page 3.22

Table 3.6. Percent of Useful Respondents by Different Completeness Rules
% Usable Responders
% of questions answered
All respondents High cognitive (0-2 MDS)
Low cognitive (3-5 MDS)
75+% of questions answered with combined dichotomous & Likert formats
32.3
54.6
15.9
85% of questions answered with combined Likert & dichotomous formats
25.8
45.1
11.5
Because the patterns of responses for the groups with higher and lower cognitive functioning
are important in suggesting strategies that might be useful in tapping the QOL for those who
cannot reliably respond, we examined the differences in these patterns in several ways. The first
approach was to see how cognitive status affected the overall QOL scores. When cognitive
status was added as an explanatory variable in the regression on facility score for each domain,
it did not produce a substantial effect size, as measured in proportions of a standard deviation.
In all but individuality the effect size was less than 0.3; for privacy, enjoyment and comfort the
effect size was less than 0.2. Table 3.7 shows mean QOL scores by cognition group.
Because cognitive status is closely linked to response mode (i.e., Likert or dichotomous),
we regressed both the cognitive status and type of response on the domain scores. Response
mode was not significant in any, but cognitive status was significant in four domains: comfort,
enjoyment, individuality, and privacy. However, the direction of the effect was equally divided.
The mean scores for resident groups with higher and lower cognitive groups for each domain
are shown in Table 3.7. Because these are Z scores, the neutral mean score is 0.
Page 3.23

Page 3.24
Table 3.7. Long Scales: Mean Z-Scores of Residents by Cognition
Domain Higher cognition group mean
Lower cognition group mean
Autonomy -.04 .03 Comfort* .037 -.053 Dignity -.04 .05 Enjoyment* .08 -.08 Functional competence -.007 .006 Individuality* -.06 .09 Meaningful activity .02 -.02 Privacy* -.08 .11 Relationships -.03 .05 Security .003 -.02 Spiritual well-being -.02 .03
*Statistically significant differences between those with higher and lower cognitive function.
Long Scales: Correlations Among Domains
Although we have been able to develop psychometrically sound domain scores, the domains
themselves overlap each other both conceptually and statistically. Not only did they largely
yield a single factor in the original exploratory factor analysis, but the correlations among the
domains are considerable, as shown in Table 3.8. Five correlation coefficients are above 0.5
and 34 are above 0.4.

Page 3.25
Table 3.8. Summary Score Correlations for Individual Residents
A.Physical Comfort
B. Functional competence
C. Privacy
D. Autonomy
E. Dignity
F. Meaningful
activity
G. Enjoyment
H. Individuality
I. Relation-
ships
J. Security
K. Spiritual
well-being
l. Life as a whole
A. Physical comfort
1.00 .391
.350 .440 .339 .384 .453 .396 .326 .385 .296 .469
B. Functional competence
1.00 .333 .420 .303 .339 .385 .435 .334 .311 .294 .318
C. Privacy
1.00 .476
.436 .397 .373 .406 .309 .430 .319 .350
D. Autonomy
1.00 .498 .467 .474 .504 .394 .416 .362 .451
E. Dignity
1.00 .406 .389 .409 .336 .445 .324 .395
F. Meaningful
activity
1.00 .535 .528 .477 .357 .394 .419
G. Enjoyment
1.00 .589 .474 .411 .357 .590
H. Individuality
1.00 .481 .434 .376 .487
I. Relationships
1.00 .404 .419 .410
J. Security
1.00 .370 .409
K. Spiritual
well-being
1.00 .417
l. Life as a whole
1.00

To test the validity of domain scales we regressed the summary measures for each domain
against each domain scale. The results are shown in Table 3.9. When all respondents are
considered, the corresponding summary measure was significantly correlated with the domain
scale every time; however, so too were several other summary scores. When responders with
higher cognitive function were examined separately, the pattern was maintained. The only
exception was for individuality. The pattern held for the lower cognitive-functioning group with
two exceptions (comfort and individuality).
Table 3.9. Regressions to Predict Scale Scores Using Domain Summary Items
All High cognitive Low cognitive
Domain
N
Summary item match
Other summary item match
Summary item match
Other summary item match
Summary item match
Other summary item match
Comfort
775 Yes Dig, Pri Yes Dig, FC No
Functional competence
941 Yes Aut, Ind Yes Aut, SWB Yes Ind
Privacy 849 Yes Dig, FC, Sec Yes Yes
Autonomy 499 Yes FC, Rel Yes FC, Rel Yes
FC, Ind, Rel
Dignity 1049 Yes Cmf, Pri, Rel, Sec
Yes Cmf, MA, Rel
Yes Enj, Pri
Meaningful activity
741 Yes Enj, FC, Ind, Rel
Yes FC, Rel Yes Dig, Sec
Enjoyment 981 Yes Aut, Cmf, MA
Yes Cmf Yes Aut, Cmf, MA
Individuality 785 Yes Enj, MA, Rel
No Enj, MA No Rel
Relation-ships
933 Yes SWB Yes Dig, Enj Yes
Security 651 Yes Cmf, Dig, FC, Pri
Yes Cmf, FC Yes Cmf, FC, Pri
Spiritual well-being
853
Yes
Enj, MA
Yes
Enj, MA
Yes
MA
*The N varies by domain, with most of the large difference between the 1049 who contributed to the data on dignity and the 499 who contributed to the data on autonomy accounted for by variation in the numbers of lower cognitive functioning residents for whom the scale was available. For example, this ranged from 206 for autonomy to 561 for dignity.
Page 3.26

Another test of validity was obtained by regressing the domain scores against the ultimate
summary measure, the respondent’s rating of life as a whole. As shown in Table 3.10, among
the group with higher cognitive functioning four domains are significantly related to life as a
whole (comfort, meaningful activity, individuality, and spiritual well-being). Among the group
with lower cognitive functioning, four domains are also significant but they are largely different
(enjoyment, security and spiritual well-being, as well as relationships which is negatively
correlated).
Table 3.10. Long Scales: Regression of Domains with “Life as a Whole” by Cognitive Status
Domain Total (N = 747 )
High cognitive (N = 499 )
Low cognitive (N = 248 )
Comfort .060 .114* -.056
Functional competence -.035 -.073 .084
Privacy -.042 -.068 .026
Meaningful activities .101* .113* .063
Enjoyment .105* .077 .190*
Individuality .158* .197* .088
Relationships -.009 .042 -.174*
Security .135* .057 .242*
Spiritual well-being .175* .154* .234*
Autonomy .040 .045 -.098
Dignity .007 .087 -.002
* Statistically significant relationship to life as a whole, p <.05.
Shorter Scales: Wave 1
We next used cluster analysis to produce a short version of the instrument that could be even
more useful in a practical nursing-home setting while maintaining the hypothesized domain
structure. A list of all 45 possible pairings of the 10 remaining domains was constructed. The
items for each pair were then subjected to a cluster analysis using the squared Euclidean distance
as the similarity metric and Ward's method was the clustering algorithm. The resulting
Page 3.27

dendrogram was examined to determine whether the items did indeed form two clusters that
corresponded to the a priori classifications of the items. Items that were frequently assigned to
domains that did not match the a priori assignment were eliminated. This approach makes few
assumptions about the distribution of the data; and, because it uses a limited number of items in
each step, it reduces the loss of power due to item non-response. In addition, cluster analysis
enabled us to maximize the independence of the domains. This effort produced a parsimonious
subset of 42 items. Finally, we used CFA to validate the domain structure of the short version of
the scale. We tested a 10 factor congeneric model with a 2nd order factor structure in which all
10 of the QOL domains loaded onto one higher order factor (i.e., the latent variable QOL).
Results of the CFA on the final version of the short scales supported a 10 factor structure
with 42 items. The data fit the model well (Π2=2441, df=1024, p<.000; RMSEA = .041; CFI =
.985). Table 3. 11 presents the standardized CFA regression weights for each item. All
parameters were statistically significant (Figure 3.1). The paths from the 2nd order overall QOL
factor (labeled QOL) to each domain were statistically significant. The regression weights
ranged from .194 for comfort to .471 for functional competence.
Page 3.28

Comfort
Relationships
.
Enjoyment
Dignity
QOL
Functional Competence
Security
.450 .359
.471
Meaningful Activities
Figure 3.1. D
The rest of the analy
domains confirmed by th
.194
.387
..
Spiritual Well-being
Autonomy
399
.258
.374
.295
Privacy
.301
omain loadings on overall QOL based on the second order confirmatory factor analysis of the short scales.
ses related to the short scales developed at Wave 1 are based on the 10
e Confirmatory Factor Analysis rather than 11 domains.
Page 3.29

Table 3.11. Standardized Regression Coefficients of Observed Variables on Latent QOL Factors
Domains Abbreviated Items* Coefficient
Comfort
Too cold .347
So long in same position it hurts .537
In physical pain .516
Bothered by noise in own room .512
Bothered by noise elsewhere in NH .488
Gets a good night’s sleep. .500
Security
Possessions are safe .458
Clothes lost or damaged in laundry .388
Confident can get help when needed .799
Can get doctor or nurse quickly .687
Afraid because of how self or others treated .465
Meaningful Activity
Gets outdoors as much as wants. .424
How often gets outdoors .437
Enjoyable things to do at NH on weekends .576
Enjoys organized activities at nursing home .552
Gives help to others .380
Relationships
Easy to make friends at nursing home .628
Considers any resident to be close friend .380
Staff stop just to have friendly conversation .557
Consider 1 or more staff to be a friend .574
NH makes it easy for family & friends to visit .577
Functional Competence
Easy to get around room by self .674
Easily can reach things you need .692
Can get to bathroom quickly anywhere in nursing home .583
Can easily reach toilet articles .750
Take care of things & room as much as wanted .603
Page 3.30

Table 3. 11, continued
Domains Abbreviated Items* Coefficient
Enjoyment
Like the food here .771
Enjoy mealtimes at NH .746
Get favorite foods here .592
Privacy
Can be alone when want to .624
Can make a private phone call .476
Can visit with someone in private .744
Can be together with other resident in private .731
Staff knock & wait before entering .436
Dignity
Staff treats you politely .690
Staff treats you with respect .731
Staff handles you gently .697
Staff respects your modesty .596
Staff takes time to listen to you .569
Autonomy
Go to bed at the time you want .554
Get up in the morning when you want .453
Can you decide what clothes to wear .459
Successful in making changes at NH .470
Spiritual Well-Being
Participate in religious activities .390
Religious observances have meaning .413
Feel your life has meaning .759
Feel at peace .678 *Item text has been shortened because of space considerations.
Page 3.31

Table 3.12 shows the alpha reliability for the shortened scales for the entire group and by
cognition status. The N varies for each analysis because the number of respondents for whom we
could construct the domains varies. All standardized domain scores range from 4 (better QOL)
to 1 (worse QOL). The mean scores tended to be positive (higher than 2) but considerable
variation was present. As shown in Table 3.12, the measures of internal consistency (Cronbach’s
alpha) of each scale ranged from .77 for functional competence to .53 for meaningful activity.
We compared the alpha reliability for the high cognitive group to the low cognitive group by
calculating 95% confidence interval around the alpha from the high cognitive group. The alpha
coefficients from the low cognitive group were not statistically different than the high cognitive
group except for privacy and enjoyment. The reliability of these two scales in the low cognitive
group was .66.
Page 3.32

Page 3.33
Table 3.12. Reliability of Domain Scores by Cognitive Function
Alpha
N
mean (sd) all hi cognition low cognition
Comfort 1066 3.02 (.06) .62 .63 .59
Security 931 3.40 (.56) .65 .66 .62
Meaningful activity 907 2.69 (.72) .53 .53 .53
Relationships 992 3.07 (.70) .64 .63 .66
Functional competence 962 3.25 (.74) .77 .76 .79
Enjoyment 1081 3.22 (.73) .71 .73 .66*
Privacy 849 3.34 (.63) .70 .72 .66*
Dignity 1076 3.67 (.43) .76 .76 .75
Autonomy 766 3.30 (.64) .59 .58 .60
Spiritual well-being 966 3.15(.70) .64 .65 .61
* Alpha in the low cognition group was significantly different from the high cognition group at p <.05.
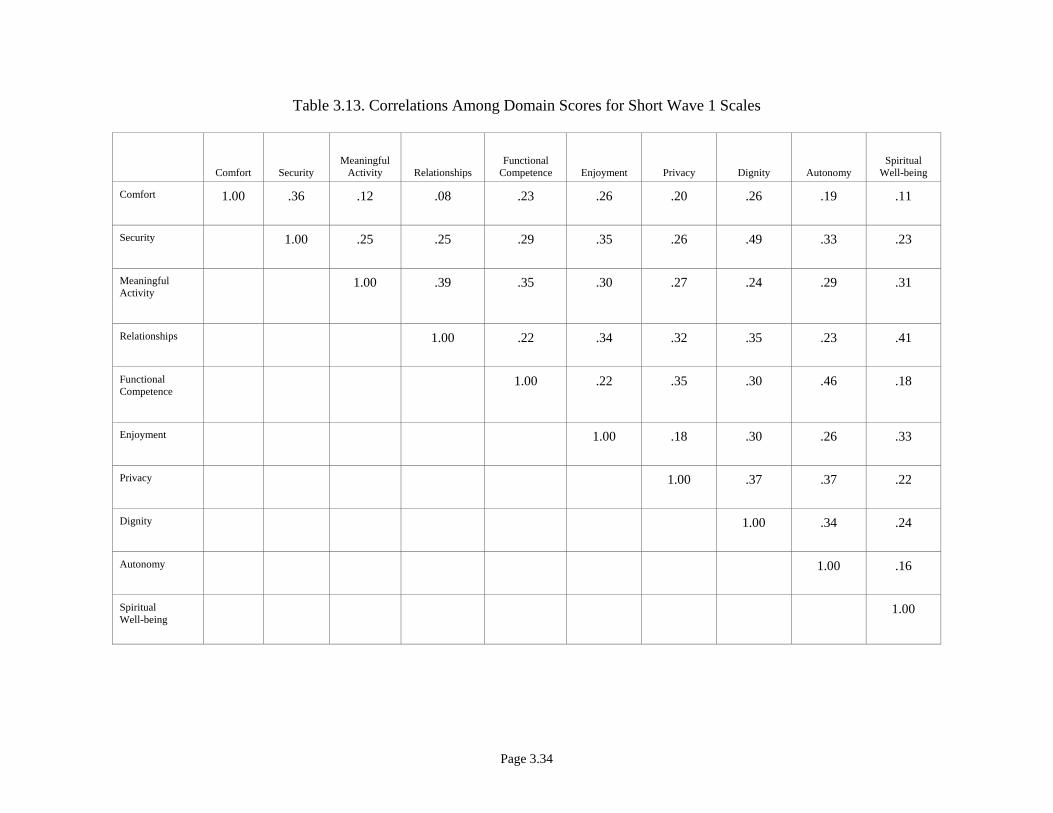
As Table 3.13 shows, correlations among domains reinforced the CFA in demonstrating that
the domains are correlated but sufficiently independent to reinforce that different constructs are
being measured. Only 3 of 45 possible correlations between pairs of domains exceeded .4
(between dignity and security, functional competence and autonomy, and spiritual well-being
and relationships. None of the possible pairs had a correlation of .5 or more and 28 of them were
.3 or less.
Page 3.34
Comfort SecurityMeaningful
Activity RelationshipsFunctional
Competence Enjoyment Privacy Dignity AutonomySpiritual
Well-being
Comfort
1.00 .36 .12 .08 .23 .26 .20 .26 .19 .11
Security
1.00 .25 .25 .29 .35 .26 .49 .33 .23
Meaningful Activity
1.00 .39 .35 .30 .27 .24 .29 .31
Relationships
1.00 .22 .34 .32 .35 .23 .41
Functional Competence
1.00 .22 .35 .30 .46 .18
Enjoyment
1.00 .18 .30 .26 .33
Privacy
1.00 .37 .37 .22
Dignity
1.00 .34 .24
Autonomy
1.00 .16
Spiritual Well-being
1.00
Table 3.13. Correlations Among Domain Scores for Short Wave 1 Scales

We compared each QOL domain score with scales measuring two constructs that we
expected to be related but not redundant: emotional well-being and satisfaction. Table 3.14
shows the results for the emotions scale. The correlation coefficients were all statistically
significant, but the patterns of correlations suggest that the emotions score was sufficiently
different from the QOL scales that different constructs are being measured. Table 3.15 shows
the same result when the domain scores are correlated with the global satisfaction scale.
Correlations were performed separately by cognitive stratum. Again correlations were in the
desired direction, statistically significant, and at level that suggests the constructs are related
but different.
Table 3.14 Correlations between QOL Short Scales and Emotions by Cognition Group
Correlations* with Emotions Scale† QOL domain
All residents Residents with high cognitive function
( 0-2)
Residents with low cognitive function (3-5)
Comfort .40 .42 .35
Security .42 .38 .48
Meaningful activity .29 .30 .26
Relationships .27 .24 .30
Functional competence .29 .27 .31
Enjoyment .35 .33 .39
Privacy .24 .22 .29
Dignity .33 .33 .34
Autonomy .29 .30 .27
Spiritual well-being .34 .37 .29 *All correlations are significant at the 0.01 level using two-tailed tests.
†Emotions summed for the scale are: happy, sad, contented, angry, afraid, worried, bored, interested in things, lonely, and looking forward to the future. The alpha for this summative scale is .80.
Page 3.35
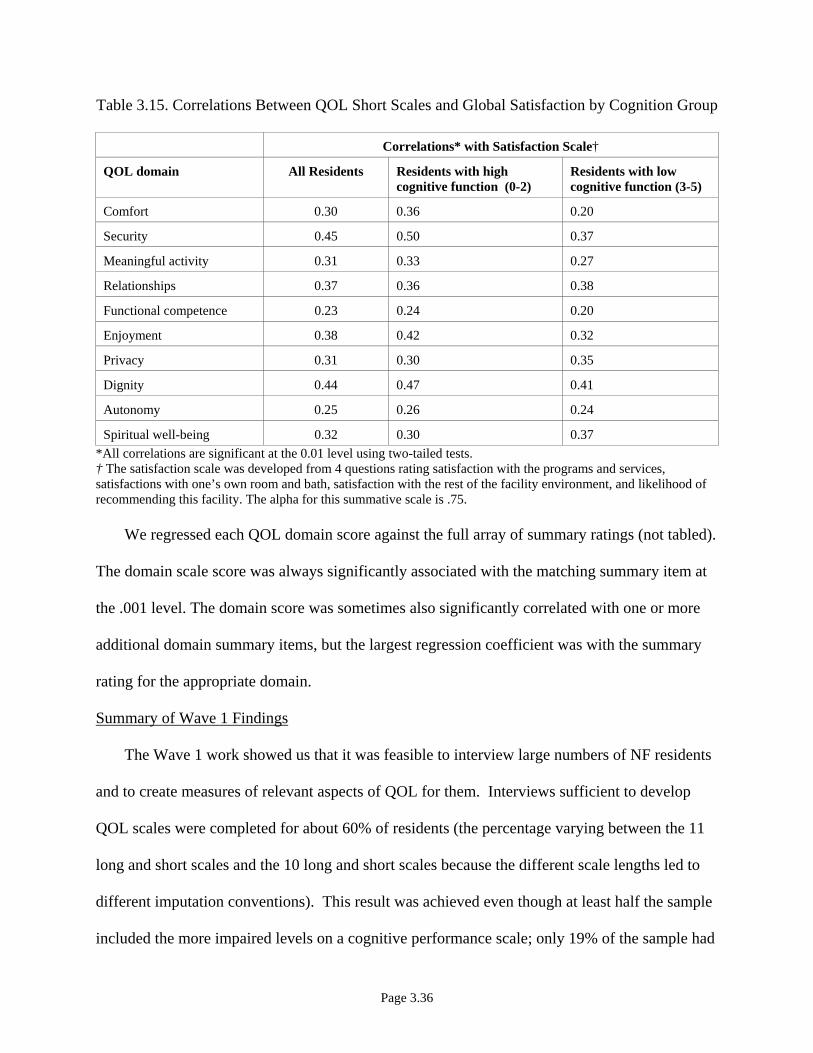
Table 3.15. Correlations Between QOL Short Scales and Global Satisfaction by Cognition Group
Correlations* with Satisfaction Scale†
QOL domain All Residents Residents with high cognitive function (0-2)
Residents with low cognitive function (3-5)
Comfort 0.30 0.36 0.20
Security 0.45 0.50 0.37
Meaningful activity 0.31 0.33 0.27
Relationships 0.37 0.36 0.38
Functional competence 0.23 0.24 0.20
Enjoyment 0.38 0.42 0.32
Privacy 0.31 0.30 0.35
Dignity 0.44 0.47 0.41
Autonomy 0.25 0.26 0.24
Spiritual well-being 0.32 0.30 0.37 *All correlations are significant at the 0.01 level using two-tailed tests. † The satisfaction scale was developed from 4 questions rating satisfaction with the programs and services, satisfactions with one’s own room and bath, satisfaction with the rest of the facility environment, and likelihood of recommending this facility. The alpha for this summative scale is .75.
We regressed each QOL domain score against the full array of summary ratings (not tabled).
The domain scale score was always significantly associated with the matching summary item at
the .001 level. The domain score was sometimes also significantly correlated with one or more
additional domain summary items, but the largest regression coefficient was with the summary
rating for the appropriate domain.
Summary of Wave 1 Findings
The Wave 1 work showed us that it was feasible to interview large numbers of NF residents
and to create measures of relevant aspects of QOL for them. Interviews sufficient to develop
QOL scales were completed for about 60% of residents (the percentage varying between the 11
long and short scales and the 10 long and short scales because the different scale lengths led to
different imputation conventions). This result was achieved even though at least half the sample
included the more impaired levels on a cognitive performance scale; only 19% of the sample had
Page 3.36

a perfect score cognitive score, and 17% had the worst possible cognitive score. By comparison,
among all residents in the sample nursing homes from which the samples were drawn, 13% had a
perfect score and 29% had a score of 5, suggesting that we somewhat over-sampled those with
higher cognition. A 1993 national sample of nursing home residents using the same scale found
slightly better rates of cognitive functioning; 16% had no cognitive impairment and 23% were
severely impaired.
We confirmed 10 distinct factors that each related to an overall construct of QOL in both
longer and shorter scales. The merit of the shorter scales is practicality; although for some
domains the difference in length is no more than 1 item, the security, comfort, and autonomy
scales were shortened respectively by 8, 7, and 4 items. Longer scales will still be useful for
more in-depth exploration of quality improvement efforts related to a particular domain.
The scales performed well in several tests of concurrent validity (correlation with a
summary item for the particular scale, correlation with ratings of emotion, and correlation with
global satisfaction ratings). We make no claim, however, that we have tapped the entire
construct of QOL. For some purposes, measures of affect, functional status, and self-perceived
health should be fielded along with our measures to produce a more fully rounded picture of
QOL. Self-reported measures of such domains are readily available in the gerontology literature,
and could be added to our battery for research or quality assurance purposes. Indeed, we did
include affect measures in this study for purposes of concurrent validity testing and found them
correlated, as expected. Continued pursuit of a measure of individuality seems warranted given
its theoretical importance.
Page 3.37

Wave 2 Findings
Between Wave 1 and Wave 2, we made small modifications to item wording. We also
redesigned the Individuality scale, which had worked poorly in Wave 1. We tested that scale
with a purposive sample of 200 residents in volunteering nursing homes, achieving a .8 alpha
reliability. Based on this pilot work, the 6 items fielded for individuality were:
• Taking all staff together, nurses, aides, and others, does the staff know about your interests and what you like?
• Do staff members know you as a person?
• Are people working here interested in your experiences and the things you have done in your life?
• Do staff here take your preferences seriously?
• Do residents here know you as a person?
• Are your personal wishes and interests respected here?
The tool additionally contained 6 comfort items, 5 functional competence items, 5 privacy items,
5 dignity items, 6 meaningful activity items, 5 relationship items, 4 autonomy items, 3 enjoyment
items, 5 security items, and 4 spiritual well-being items. With the 6 individuality items, the
protocol contained 54 items.
In Wave 2, we improved the formatting of the items and developed stronger quality control
procedures to avoid inadvertently missing items. As with Wave 1, we used Likert response sets
for most of the items with a binary fall back.
For Wave 2 sampling, we secured census information from the nursing homes, excluded
persons under age 65 and persons in a coma or vegetative state, and approached all other
residents in random order for QOL interviewing. As before, we eliminated residents who could
not be roused or participate in a simple screening conversations, or who failed to give coherent
Page 3.38

or usable responses to 4 of the first 6 questions. In addition, after the interview, the
questionnaire was reviewed and, if the resident did not answer the items sufficiently for us to
construct at least 9 of the 11 scale scores, that resident was replaced. Our goal was to obtain 28
completed interviews for analysis in each of 60 facilities. In 1 facility, we secured fewer than 20
completed questionnaires and replaced the facility. In all others, we were able to complete 28
interviews even when staff warned us this would be impossible because of cognitive impairment
in the facility. The number of people we needed to approach to obtain 28 interviews ranged
widely; in a few facilities we had almost exhausted the census to do so.
Table 3.16 describes the sample at Wave 2. The final sample included 1676 residents,
all of whom completed the items needed for 9 to 11 domains. (Although we observed the same
imputation rules as we had for Wave 1, our modified format was easier for residents to complete
and we had very few missing data.) Because we draw a random sample of the residents
immediately before we visited, we were able to have a much larger representation of shorter stay
residents. As with Wave1, we were able to interview large numbers of people who fell in the
more disabled half of the scoring that we used for cognitive functioning. We used the same 0-5
score for cognitive functioning as we did in Wave 1, and 48.9% of the sample had scores of 3-5,
connoting the lower end of cognitive functioning.
Once again we performed Confirmatory Factor Analysis (CFA) using all 54 items. This
time, as Figure 3.2 shows, we were able to confirm the 11 factors. Table 3.17 displays the
correlations among the domains, showing that they are related but independent. The dignity and
security domains and the autonomy and privacy domains are the most intercorrelated.
Page 3.39

Page 3.40
Table 3.16. Characteristics of Wave 2 Sample
Trait Proportion of sample Female 72.7% Mean age 83.6 Cognition score
0 21.7% 1 14.1% 2 15.3% 3 14.3% 4 27.7% 5 6.9%
Cognitive score group 0 – 2 (higher) 51.1 3 – 5 (lower) 48.9
ADL impairments 0 5.9 1 7.8 2 7.8 3 14.2 4 30.9 5 33.4
ADL score group 0 – 2 21.5 3-5 78.5
Bed mobility and/or eating Needs help w/ neither 29.5 Needs help w/ 1 or both 70.5 Mean of length of stay (months) 23.97 Length of Stay
0 - 1 month 8.9 1 - 2 months 6.2 2 - 3 months 5.2 3 - 4 months 4.3 4 - 5 months 4.2 5 - 6 months 3.7 6 - 12 months 15.5 > 12 months 52.2
LOS group 0 - 3 months 20.2 > 3 months 79.8

Page 3.41
Comfort Functional
Competence Privacy DignityMeaningful Activities Enjoyment Individuality Relationships Security
Spiritual Well-being Autonomy
Comfort
1.000 0.223 0.195 0.304 0.183 0.266 0.171 0.143 0.356 0.123 0.210
Functional Competence
1.000 0.370 0.278 0.384 0.294 0.211 0.250 0.250 0.166 0.419
Privacy
1.000 0.348 0.337 0.220 0.271 0.300 0.299 0.142 0.363
Dignity
1.000 0.320 0.355 0.457 0.399 0.531 0.244 0.380
Meaningful Activity
1.000 0.355 0.378 0.426 0.262 0.386 0.348
Enjoyment
1.000 0.371 0.310 0.353 0.345 0.323
Individuality
1.000 0.565 0.400 0.383 0.345
Relationships
1.000 0.273 0.359 0.345
Security
1.000 0.178 0.341
Spiritual Well-being
1.000 0.207
Autonomy
.000 1
Table 3.17. Correlations among Domains: Wave 2
Correlations are all significant at the 0.01 level using 2-tailed tests.

Page 3.42
CMF
PRI
QoL
ENJ
SWB
AUT
SEC
MA
DIG
REL
FC
FCMF1
cmf1
.43
FCMF2
cmf2
.60
FCMF3
cmf3
FCMF4
fc1
FCMF5
cmf5
DFC1
cmf4
DFC2
fc2
DFC3
fc3
DFC4
fc4
.77
DFC5
fc5
.70
DPRI5pri5
.32DPRI4pri4
.65DPRI3pri3 .66
DPRI2pri2 .47
DPRI1pri1
.65
DDIG5dig5
.59DDIG4dig4
.71DDIG3dig3
.65DDIG2dig2
.78DDIG1dig1 .72
DMA5ma5
.37DMA4ma4
.58DMA3ma3
.55DMA_A2ma2 .47
DMA_A1ma1.44
DREL5
rel5
DREL4
rel4
DREL3
rel3
DREL_A2
rel2
.46
DREL1
rel1
.62
FSEC5
sec5
.37
DSEC4
sec4
.74
DSEC3
sec3
.73
FSEC2
sec2
.21
DSEC1
sec1
.45
DAUT1 aut1.59
DAUT2 aut2.67
DAUT3 aut3.54
DAUT4 aut4
.40
DSWB2 swb2.84
DSWB3 swb3
.34
DSWB4 swb4
.25
DENJ1 enj1.79DENJ2 enj2.77
DENJ3 enj3.60
DSWB1 swb1
.52 .50
.82
DCMF6
cmf6
.33
.74
e_cmf e_fc
e_pri
e_dig
e_ma
e_swb
e_aut
e_sece_rel
e_enj
.37 .66.74
.90
.68
.44
.59
.88
.47.83
.56
.94
.33
.80
.67
.69.82
.73
.70
.71
.81
.57
.59 .55 .53
.58
IND
DIND1 e1.59
DIND2 e2.60
DIND3 e3
.61
DIND4 e4
.68
DIND5 e5
.49
DIND6 e6
.66
.79
e_ind.61
Figure 3.2. Confirmatory Factor Analysis, Wave 2. 11 Domain: With cases of those who answered all 53 questions (959 cases). Model Fit Index: Ration of Chi-Square over degree of freedom: 3.24; RMSEA: 0.048. CMF is Comfort, FC is Functional Competence, AUT is Autonomy, SBW is Spiritual Well-being, IND is Individuality, MA is Meaningful Activity, REL is Relationships, DIG is Dignity, PRI is Privacy, ENJ is Enjoyment, SEC is security and QOL is Quality of Life.

Page 3.43
Table 3.18 Regression to Predict Scale Wave 2 Scores Using Summary Items for the Domains
Domain Total High COG (MDS 0,1,2) Low COG
N Summary Match Items
Others matched N
Summary match items
Others matched N
Summary match items
Others matched
Comfort 1448 Yes Privacy, Enjoyment,Security, Spiritual Well-being
748 Yes Privacy, Enjoyment 694 No Functional Competence, Enjoyment, Security, Spiritual Well-being
Functional Competence
1448 Yes Privacy, Autonomy,Enjoyment, Relationships
748 Yes Privacy 694 Yes Autonomy, Enjoyment,Individuality
Privacy 1445 Yes Functional Competence,Autonomy, Security
747 Yes Autonomy, Spiritual Well-being
692 Yes Relationships
Dignity 1447 Yes Comfort, Autonomy,Relationships, Security,
747 Yes Comfort, Relationships 694 Yes Comfort
Meaningful Activity
1444 Yes Functional Competence,Autonomy, Enjoyment, Relationships, Security, Spiritual Well-being
747 Yes Functional Competence,Privacy, Enjoyment, Relationships, Spiritual Well-being
692 Yes Functional Competence,Autonomy, Enjoyment, Relationships, Security
Enjoyment 1422 Yes Comfort, FunctionalCompetence, Meaningful Activity, Security
738 Yes Comfort, FunctionalCompetence, Meaningful Activity
678 Yes Comfort, Meaningful Activity, Security
Individuality 1427 Yes Comfort, Functional Competence, Autonomy, Dignity, Meaningful Activity, Relationships
739 Yes Comfort, Dignity, Meaningful Activity, Relationships
683 Yes Comfort, Autonomy, Dignity, Functional Competence, Meaningful Activity, Security, Relationships
Relationships 1449 Yes Autonomy, Meaningful Activity, Spiritual Well-being
748 Yes Comfort, MeaningfulActivities, Spiritual Well-being
695 Yes Autonomy, Enjoyment,Meaningful Activity, Spiritual Well-being
Security 1444 Yes Comfort, Privacy,Dignity, Individuality, Security
748 Yes Comfort, Privacy, Dignity 690 Yes Comfort, Dignity
Spiritual Well-being
1443 Yes Privacy, MeaningfulActivity, Enjoyment, Individuality, Relationships, Security
745 Yes Functional Competence,Meaningful Activity, Enjoyment, Relationships, Security
693 Yes Autonomy, MeaningfulActivity, Enjoyment, Security
Autonomy 1448 Yes FunctionalCompetence, Individuality, Relationships
747 Yes Functional Competence 695 Yes Functional Competence,Individuality, Relationships

Conclusions from Wave 2
In summary, the new individuality items work, and we were able to confirm 11 domains in
Wave 2. The scales continued to have adequate scale properties. We were able to interview
residents in the same proportions as we did in Wave 1. Without an elaborate stratified sample, a
pure random sample resulted in a sample well balanced between residents with better and worse
cognitive functioning as measured by the MDS. As we had found with Wave 1, we were able to
interview and complete scales for residents who had poor MDS-derived cognitive scores.
Page 3.44

References Abeles, R. P. (1991). Sense of control, quality of life, and frail older people. In J. E. Birren & J.
E. Lubben & J. C. Rowe & D. E. Deutchman (Eds.), The Concept and Measurement of Quality of Life in the Frail Elderly (pp. 297-314). San Diego, CA: Academic Press.
Abeles, R. P., Gift, H. C., & Ory, M. G. (Eds.). (1994). Aging and Quality of Life. New York:
Springer Publishing Company. Abt Associates. (1996). Evaluation of the Long Term Care Survey Process (Final Report ).
Cambridge, MA: Abt Associates Inc. Arnold, S. B. (1991). Measurement of quality of life in the frail elderly. In J. E. Birren & J. E.
Lubben & J. C. Rowe & D. E. Deutchman (Eds.), The Concept and Measurement of Quality of Life in the Frail Elderly. San Diego, CA:: Academic Press.
Atchley, R. C. (1991). Influence of Aging on Perceptions and Expressions of the Self. In J. E.
Birren & J. E. Lubben & J. C. Rowe & D. E. Deutchman (Eds.), The Concept and Measurement of Quality of Life in the Frail Elderly. San Diego, CA: Academic Press.
Bennett, C. (1980). Nursing Home Life: What It Is and What It Could Be. New York, NY:
Tiresias Presss. Birren, J. E., Lubben, J. E., Rowe, J. C., & Deutchman, D. E. (Eds.). (1991). The Concept and
Measurement of Quality of Life in the Frail Elderly. San Diego: Academic Press, Inc. Bowers, B., & Joyce, M. (1996). Quality Care: The Perspective of Physically disabled
Consumers ( Vol. wisconsin Department of Health and Family Services). Madison, WI. Brod, M., Stewart, A. L., Sands, L., & Walton, P. (1999). Conceptualization and measurement of
quality of life in dementia; The Dementia Quality of Life Instrument (DQoL). The Gerontologist, 39(1), 25-35.
Cohen-Mansfield, J., Ejaz, F. K., & Werner, P. (Eds.). (2000). Satisfaction Surveys in Long Term
Care. Springer Publishing Company: New York. Cohn, J., & Sugar, J. A. (1991). Determinants of quality of life in institutions: Perceptions of
frail older residents, staff, and families. In J. E. Birren & J. E. Lubben & J. C. Rowe & D. E. Deutchman (Eds.), The Concept and Measurement of Quality of Life in the Frail Elderly (pp. 28-49). San Diego: Academic Press, Inc.
Degenholtz, H. D., Kane, R. A., & Kivnick, H. Q. (1997). Care-related preferences and values of
elderly community-based LTC consumers: Can case managers learn what's important to clients? The Gerontologist, 37(6), 767-777.
Page 3.45
Diamond, T. (1992). Making Gold Gray: Narratives of Nursing Home Care. Chicago: University of Chicago Press.
Dolan, P. (1997). Modeling valuations for EuroQol health states. Medical Care, 35(11), 1095-
1098. Gallo, J. J., Reichel, W., & Anderson, L. M. (Eds.). (1995). Handbook of Geriatric Assessment.
Gaithersburg, MD: Aspen. Green, A., Hawes, C., Wood, M., & Windsong, C. (1998). How do family members define
quality in assisted living? Generations,, 21(4), 34-36. Gubrium, J. (1993). Speaking of Life. Hawthorne, N.Y.: Aldine de Gruyter. Helmes, E., Csapo, K. G., & Short, J. A. (1987). Standardization and validation of the
Multidimensional Observational Scale for Elderly Subjects (MOSES). Journal of Gerontology, 42, 395-405.
Henderson, J. N. (1995). The culture of care in a nursing home: Effects of a medicalized model
of long-term care. In J. Neil Henderson & M. D. Vespari (Eds.), The Culture of Long-Term Care: Nursing Home Ethnography (pp. 37-54). Wesport, CT: Bergin & Garvey.
Henderson, L. N., & Vespari, M. D. (Eds.). (1995). The Culture of Long-Term Care: Nursing
Home Ethnography. Westport, CT: Bergin & Garvey. Kane, R. A., Caplan, A. L., Urv-Wong, E. K., Freeman, I. C., A., A. M., & Finch, M. D. (1997).
Everyday matters in the lives of nursing home residents: Wish for and perception of choice and control. Journal of American Geriatrics Society, 45(9), 1086-1093.
Kane, R. L., & A., K. R. (Eds.). (2000). Assessing Older Persons: Measures, Meaning, and
Practical Applications. New York: Oxford University Press. Katz, S., Ford, A. B., Moskowitz, R. W., Jackson, B. A., & Jaffee, M. W. (1963). Studies of
illness in the aged. The index of ADL: A standardized measure of biological and psychosocial function. Journal of American Medical Association, 185(12), 914-919.
Katz, S., & Gurland, B. J. (1991). Science of quality of life in elders: Challenge and
opportunity. In J. E. Birren & J. E. Lubben & J. C. Rowe & D. E. Deutchman (Eds.), The Concept and Measurement of Quality of Life in the Frail Elderly (pp. 335-343). San Diego: Academic Press, Inc.
Kuyken, W., & Orley, J. (1994). Development of the WHOQOL: Rationale and current status.
International Journal of Mental Health, 23(3), 24-56. Laird, C. (1985). Limbo. Novato, CA: Chandler & Sharpe Publishers.
Page 3.46
Lawton, M. P. (1991). A multidimensional view of quality of life in frail elders. In J. E. Birren &
J. E. Lubben & J. C. Rowe & D. E. Deutchman (Eds.), The Concept and Measurement of Quality of Life in the Frail Elderly (pp. 3-27). San Diego: Academic Press, Inc.
Lidz, C. W., Fischer, L., & Anrold, R. M. (1992). The Erosion of Autonomy in Long-Term Care.
New YOrk: Oxford University Press. Logsdon, R., Gibbons, L. E., McCurry, S. M., & Terri, L. (1999). Quality of life in Alzheimer's
disease: Patient and caregiver reports. Journal of Mental Health and Aging, 5(1), 21-32. NCCNHR, National Citizen's Coalition for Nursing Home Reform (1865). A Consumer
Perspective on Quality of Care: The Resident’s Point of View. Washington, DC: NCCNHR. Noelker, L. S., & Harel, Z. (Eds.). (2001). Linking Quality of Long-Term Care and Quality of
Life. New York: Springer Publishing Company. Rabins, P. V., Kasper, J. D., Kleinman, L., Black, B. S., & Patrick, D. L. (1999). Concepts and
methods in the development of the ADHRQ: An instrument for assessing health-related quality of life in persons with Alzheimer's disease. Journal of Mental Health and Aging, 5(1), 33.
Retsinas, J. (1986). It's OK, Mom: The Nursing Home from a Sociological Perspective. New
York, NY: Tiresias Press. Rubenstein, L., Wieland, D., & Bernabei, R. (1995). Geriatric assessment technology: the state
of the art. Milan, Italy: Eidtrice Kurtis. Salmon, J., & Weber, S. M. (1998). Exploring quality of Life in Long-Term Care: A Pilot Study.
Paper presented at the Gerontological Society of America Annual Meeting. Shield, R. R. (1988). Uneasy Endings. Ithica, NY: Cornell University Press. Simmons, S. F., Schnelle, J. F., Uman, G. C., Kulvicki, A. D., Lee, K. O., & Ouslander, J. G.
(1997). Selecting nursing home residents for satisfaction surveys. Gerontologist, 37(4), 543-550.
Smith, M. A. (2000). Satisfaction. In Robert L. Kane & R. A. Kane (Eds.), Assessing Older
Persons: Measures, Meaning, & Practical Applications (pp. 261-399). New York: Oxford University Press.
Stewart, A. L., & King, A. C. (1994). Conceptualizing and measuring quality of life in older
populations. In R. P. Abeles & H. C. Gift & M. G. Ory (Eds.), Aging and Quality of Life (pp. 27-54). New York: Springer Publishing Company.
Page 3.47

Stewart, A. L., Sherbourne, C. D., & Brod, M. (1996). Measuring Health-Related Quality
of Life in Older and Demented Populations. In B. Spilker (Ed.), Quality of Life and Pharmacoeconomics in Clinical Trials (Second ed., pp. 819-830). Philadelphia: Lippincott-Raven.
Svensson, T. (1991). Intellectual exercise and quality of life in the frail elderly. In J. E. Birren &
J. E. Lubben & J. C. Rowe & D. E. Deutchman (Eds.), The Concept and Measurement of Quality of Life in the Frail Elderly (pp. 256-275). San Diego, CA: Academic Press.
Teresi, J., Lawton, M. P., Ory, M., & Holmes, D. (1994). Measurement issues in chronic care
populations: Dementia special care. Journal of Alzheimer Disease and Associated Disorder, 8(Suppl 1), S144-S183.
Tisdale, S. (1987). Harvest Moon. New York: Henry Holt & Company. Tobin, S. S. (1991). Personhood in Advanced Old Age. New York:
Springer Publishing Company. Tobin, S. S. (1999). Preservation of Self in the Oldest Years. New York:
Springer Publishing Company. Tulloch, G. J. (1975). A Home is Not a Home (Life Within a Nursing Home). New York:
Seabury. Tulloch, G. J. (1995). A Resident's View of Autonomy. In L. M. S. Gamroth, J. Tornquist,
E. M. (Ed.), Enhancing Autonomy in Long-Term Care: Concepts and Strategies (pp. 109-120). New York: Springer.
Uman, G., C,, & Urman, H. N. (1997). Measuring consumer satisfaction in nursing home
residents. Nutrition, 13(7-8), 705-707. Ware, J. E., Kosinski, M., & Keller, S. D. (1996). A 12-item short-form health survey:
Construction of scales and preliminary tests of reliability and validity. Medical Care, 34(3), 220-233.
Ware Jr., J. E. (1996). The SF-36 Health Survey. In B. Spilker (Ed.), Quality of Life and
Pharmacoeconomics in Clinical Trials (Second ed., pp. 337-346). Philadelphia: Lippincott-Raven.
Ware Jr., J. E., & Sherbourne, C. D. (1992). The MOS 36-item short-form health survey (SF-36).
I. Conceptual framework and item selection. Medical Care, 30(6), 473-483. Zimmerman, D. R., & Bowers, B. J. (2000). Satisfaction surveys and other sources of
information on quality of long-term care. In J. Cohen-Mansfield & F. K. Ejaz & P. Werner (Eds.), Satisfaction Surveys in Long-Term Care. New York, NY: Springer.
Page 3.48