chapter 26 - pearsoncmg.comptgmedia.pearsoncmg.com/.../ftpress/bookreg/9780131873667/ch26.pdf ·...
TRANSCRIPT
Statistical Analysis
Chapter 26

FT Press 2007. All Rights Reserved.
Business and Competitive Analysis. By C. Fleisher & B. Bensoussan.
Ch26.2
• Short Description• Background• Strategic Rationale & Implications• Strengths & Advantages• Weaknesses & Limitations• Process for Applying Technique• FAROUT
Ch26. Statistical Analysis

FT Press 2007. All Rights Reserved.
Business and Competitive Analysis. By C. Fleisher & B. Bensoussan.
Ch26.3
Short Description• Statistical analysis involves the manipulation of data
using a variety of mathematical formulae and description of situations using mathematical concepts.
• It enables simple description of complex situations and can give predictive insights.
Ch26. Statistical Analysis

FT Press 2007. All Rights Reserved.
Business and Competitive Analysis. By C. Fleisher & B. Bensoussan.
Ch26.4
Background• Statistics involves summarizing, analysing, and
graphing data. • Introduces objectivity.• Interpretation is crucial to the value of statistics. • Reduces uncertainty in decision making.• The design of the data collection and the method
of analysis are very important.
Ch26. Statistical Analysis
FT Press 2007. All Rights Reserved.
Business and Competitive Analysis. By C. Fleisher & B. Bensoussan.
Ch26.5
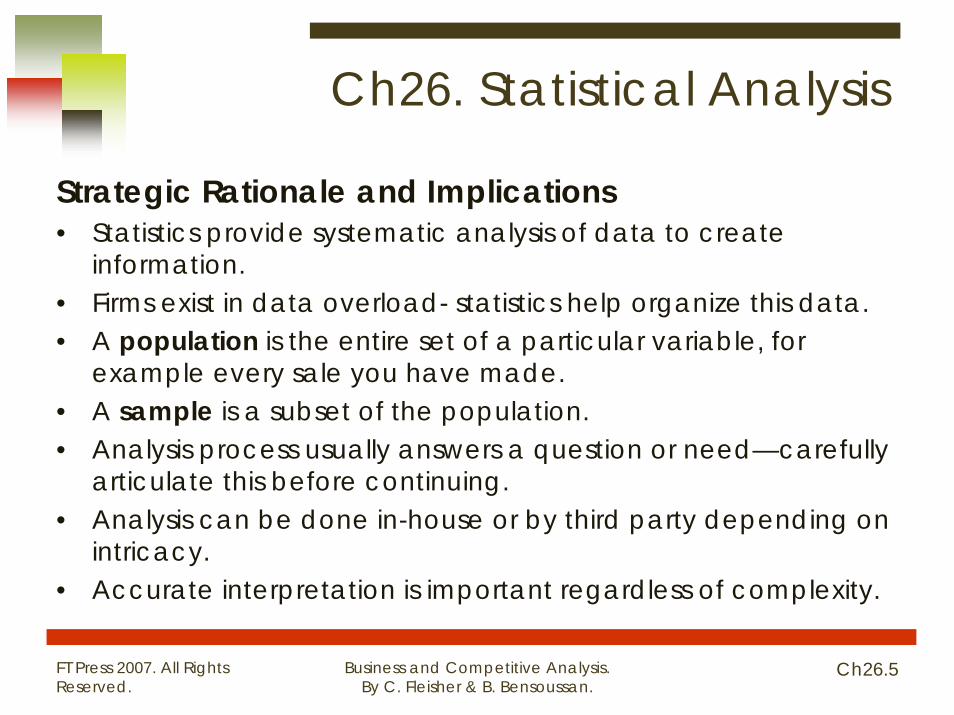
Strategic Rationale and Implications• Statistics provide systematic analysis of data to create
information.• Firms exist in data overload- statistics help organize this data.• A population is the entire set of a particular variable, for
example every sale you have made. • A sample is a subset of the population.• Analysis process usually answers a question or need—carefully
articulate this before continuing.• Analysis can be done in-house or by third party depending on
intricacy.• Accurate interpretation is important regardless of complexity.
Ch26. Statistical Analysis

FT Press 2007. All Rights Reserved.
Business and Competitive Analysis. By C. Fleisher & B. Bensoussan.
Ch26.6
Strengths and Weaknesses• It provides systematic and objective methods for
examining data and extracting information.• Can be used to simplify complex problems.• Computers make statistical analysis accessible.• Inferences made by statistical analysis can also
inform decision-making.• Can provide objective information about business’
performance, customers, and environment.• Neutrality removes politics.
Ch26. Statistical Analysis

FT Press 2007. All Rights Reserved.
Business and Competitive Analysis. By C. Fleisher & B. Bensoussan.
Ch26.7
Weaknesses and Limitations• Statistical analysis is very easy to misuse and
misinterpret. • The process of designing a statistical analysis is very
important and complex. • Interpretation of the results must be quality
(causation vs. correlation).• Results are sometimes “spun” to serve a purpose.• Statistics are necessarily backwards facing.• Predicting of probability is difficult.
Ch26. Statistical Analysis

FT Press 2007. All Rights Reserved.
Business and Competitive Analysis. By C. Fleisher & B. Bensoussan.
Ch26.8
Process for Applying the TechniquePercentage changes• Percentages are some of the most basic statistics
used:
• Interpretation of percentage increases or decreases can be complicated by a couple of circumstances.
p = (x-y)/y x 100where: p is the percentage change
x is the new valuey is the old value
Ch26. Statistical Analysis

FT Press 2007. All Rights Reserved.
Business and Competitive Analysis. By C. Fleisher & B. Bensoussan.
Ch26.9
Process for Applying the Technique• Comparing percentage changes across groups:
• In town A sales increased from 50 to 65 and in town B sales increased from 50 to 52. The percentage increase for A is 30 per cent, while for B it is 4 per cent.
• Consider population growth in town A and town B to see whether there is more to the story.
• Per capita rates are generally expressed as a figure per 100,000 and calculated as follows:
c = x/p x 100,000where: c is the per capita rate
x is the value of interestp is the total population
Ch26. Statistical Analysis

FT Press 2007. All Rights Reserved.
Business and Competitive Analysis. By C. Fleisher & B. Bensoussan.
Ch26.10
Process for Applying the Technique– If the population of town A had increased from
10,000 to 15,000 over the year and town B had no 8000, what do per capita sales tell us about the performance of the respective teams?
• The other potential complication for interpreting percentage change is where some other factor has had an influence over the time period.
• In other circumstances it may take some research to explain an unusual change.
Ch26. Statistical Analysis

FT Press 2007. All Rights Reserved.
Business and Competitive Analysis. By C. Fleisher & B. Bensoussan.
Ch26.11
Process for Applying the TechniquePercentiles and quartiles
– Percentiles provide a ranking within a range of data.– Percentiles divide a sample or population into 100 parts.
• To work out which score represents a particular percentile you must first arrange your data in increasing order.
• Then work out which score by multiplying n (the total number of data points) by P/100.
• The percentile will occur at m the nearest whole number greater than or equal to n x P/100 (either the mth value in the list of the mean of the mth and the (m+1)th values).
Ch26. Statistical Analysis

FT Press 2007. All Rights Reserved.
Business and Competitive Analysis. By C. Fleisher & B. Bensoussan.
Ch26.12
Process for Applying the Technique
Normal distribution and bell curve.– Distribution refers to the
pattern of distribution of measurements for x (along the x-axis) against the number of instances, or the frequency of the measurements (y-axis).
– A normal distribution:
Ch26. Statistical Analysis

FT Press 2007. All Rights Reserved.
Business and Competitive Analysis. By C. Fleisher & B. Bensoussan.
Ch26.13
Process for Applying the Technique• Summarizing data with one value — central
tendency.– The mean is a measure for the average value of
a set of numeric data.Xmean = (X1 + X2 + X3 + … Xn)/nwhere: xmean is the mean value of the samplen is the total number of values you are looking at in your sample
X1 is the first data point, X2 is the second data point … Xn is the last data point
Ch26. Statistical Analysis

FT Press 2007. All Rights Reserved.
Business and Competitive Analysis. By C. Fleisher & B. Bensoussan.
Ch26.14
Process for Applying the Technique• Median
– The observations you have made are arranged in order of magnitude and the median is the central point in the array.
– The median can be very useful where your data ranges over a wide set of values, some of which is very large or very small compared with most.
• Mode – The mode is the most frequently recorded value for an
observation. – You can have more than one mode in a distribution. – The mode is not generally used to summarise numeric
data, but is very useful as a single value summary with categorical information.
Ch26. Statistical Analysis

FT Press 2007. All Rights Reserved.
Business and Competitive Analysis. By C. Fleisher & B. Bensoussan.
Ch26.15
Process for Applying the Technique• Standard deviation
– The standard deviation gives a measure for the distribution of measures within your sample in relation to the mean.
– Where you are using the mean to describe the ‘average’ value of your data, the standard deviation assumes a normal distribution of data.
– Standard deviation is calculated from the residuals, or differences, between each data point and the mean.
s = √((X1- xmean)2 + (X2 - xmean)2 … (Xn - xmean)2)/(n - 1))where: s is the standard deviation for the sample you are looking atn is the total number of values in the sampleX1 is the first data point, X2 is the second data point … Xn is last data pointXmean is the mean value of the sample
Ch26. Statistical Analysis

FT Press 2007. All Rights Reserved.
Business and Competitive Analysis. By C. Fleisher & B. Bensoussan.
Ch26.16
Process for Applying the Technique
• Standard deviation Cont’d– Can use software to
compute standard deviation.
– 68% value x will appear within one standard deviation of the mean.
– 96% within 2 standard deviations.
– If the standard deviation is close to the amount of the mean then it would be considered high.
Ch26. Statistical Analysis

FT Press 2007. All Rights Reserved.
Business and Competitive Analysis. By C. Fleisher & B. Bensoussan.
Ch26.17
Process for Applying the Technique• Comparing data
– Statistics are often used to test whether there is a real (significant) difference between two groups.
– Example: test whether your attrition rate among your customers had changed over time (or not).
– A null hypothesis proposes that there is no difference.– The test used to compare means of two groups: the t-test.
t = (mean1 - mean2)/standard error of the difference between the means
Ch26. Statistical Analysis

FT Press 2007. All Rights Reserved.
Business and Competitive Analysis. By C. Fleisher & B. Bensoussan.
Ch26.18
Process for Applying the Technique
• Regression analysis– Looking at two instances of
the same value can be useful for investigating changes in it over time.
– Ex: height and weight for a sample of people.
– Relationships between the two properties or values plotted on a scatter plotare summarized by a line. This is called regression analysis of the data.
0
10
20
30
40
50
60
70
80
90
150 160 170 180 190
Series1
Scatter plot of weight against height
SOURCE: Adapted from McNeil D, Middledorp J, Petersons M and Shaw P, Modern statistics: an introduction, Macquarie University, 1994
Ch26. Statistical Analysis

FT Press 2007. All Rights Reserved.
Business and Competitive Analysis. By C. Fleisher & B. Bensoussan.
Ch26.19
Process for Applying the Technique
• Regression Analysis Cont’d– Straight lines: draw in a line
approximately fitting the data
0
10
20
30
40
50
60
70
80
90
150 160 170 180 190
Series1
Ch26. Statistical Analysis
FT Press 2007. All Rights Reserved.
Business and Competitive Analysis. By C. Fleisher & B. Bensoussan.
Ch26.20
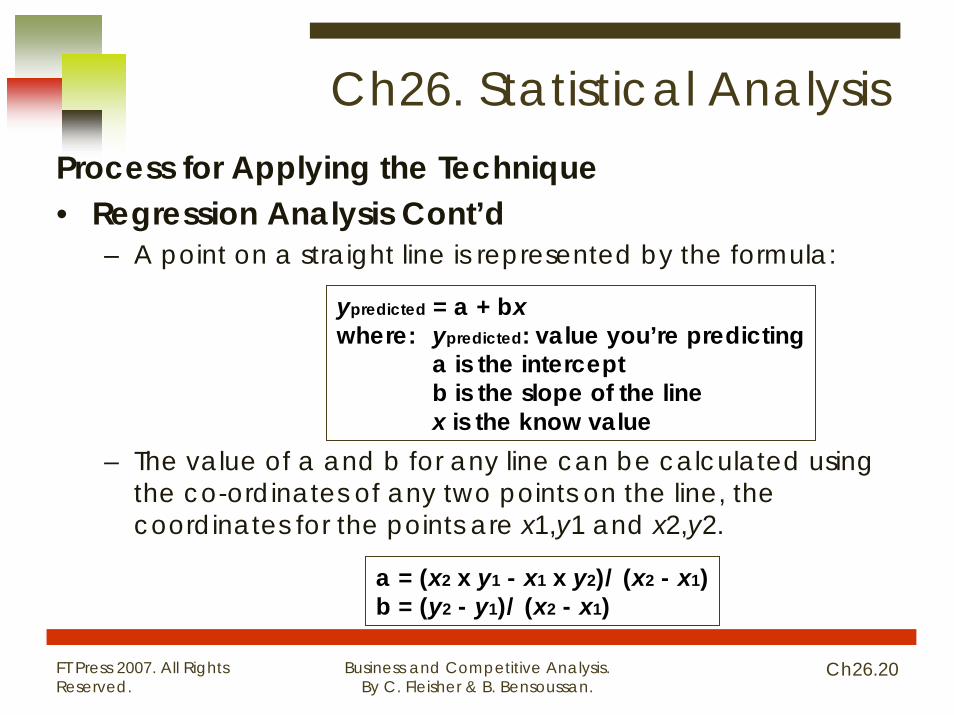
Process for Applying the Technique• Regression Analysis Cont’d
– A point on a straight line is represented by the formula:
– The value of a and b for any line can be calculated using the co-ordinates of any two points on the line, the coordinates for the points are x1,y1 and x2,y2.
ypredicted = a + bxwhere: ypredicted: value you’re predicting
a is the intercept b is the slope of the linex is the know value
a = (x2 x y1 - x1 x y2)/ (x2 - x1)b = (y2 - y1)/ (x2 - x1)
Ch26. Statistical Analysis

FT Press 2007. All Rights Reserved.
Business and Competitive Analysis. By C. Fleisher & B. Bensoussan.
Ch26.21
Process for Applying the Technique• Regression Analysis Cont’d
– Goodness of Fit• The ‘goodness-of-fit’ of your data to the line tests the
accuracy of the formula for your line in predicting new values for y by finding the standard deviation of the residuals, or more precisely from the sum of squares of the residuals:
sresiduals = (y1 - y1as predicted by formula)2
+ (y2 - y2as predicted by formula)2 … + (yn - yn as predicted by formula)2
Ch26. Statistical Analysis
FT Press 2007. All Rights Reserved.
Business and Competitive Analysis. By C. Fleisher & B. Bensoussan.
Ch26.22
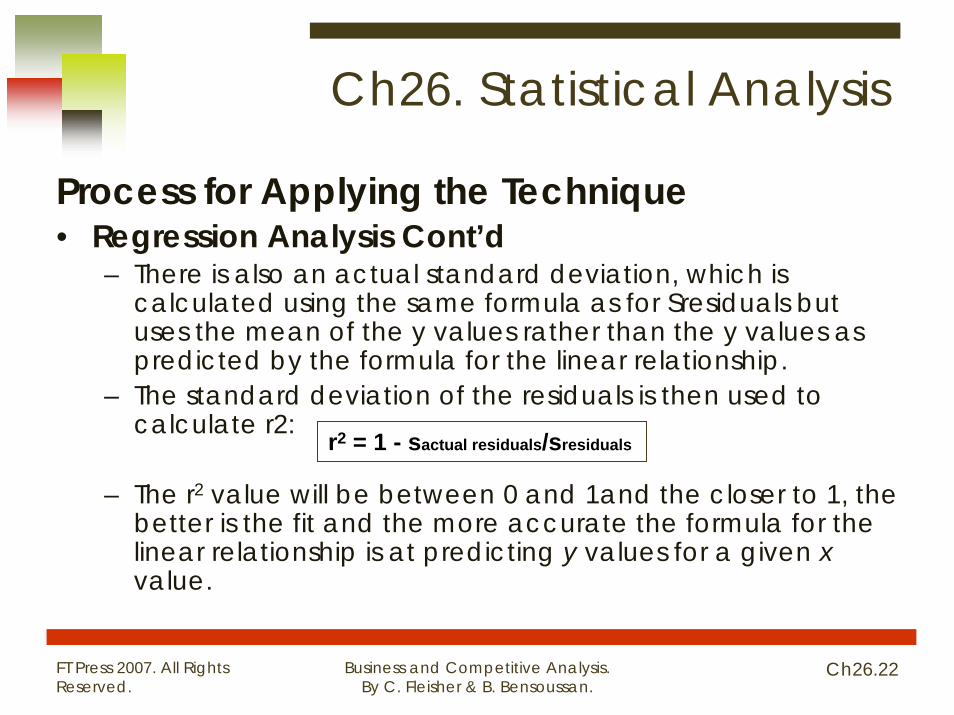
Process for Applying the Technique• Regression Analysis Cont’d
– There is also an actual standard deviation, which is calculated using the same formula as for Sresiduals but uses the mean of the y values rather than the y values as predicted by the formula for the linear relationship.
– The standard deviation of the residuals is then used to calculate r2:
– The r2 value will be between 0 and 1and the closer to 1, the better is the fit and the more accurate the formula for the linear relationship is at predicting y values for a given xvalue.
r2 = 1 - sactual residuals/sresiduals
Ch26. Statistical Analysis

FT Press 2007. All Rights Reserved.
Business and Competitive Analysis. By C. Fleisher & B. Bensoussan.
Ch26.23
Process for Applying the Technique
• Regression Analysis Cont’d– Lines that are not straight
• Ex: exponential curve.• Here the relationship is
represented by the formula:
• Reverse of this is the hyperbolic curve.
0
10
20
30
40
50
60
0 5 10 15
Series1
Exponential curve
ypredicted = a + b x x2
Ch26. Statistical Analysis

FT Press 2007. All Rights Reserved.
Business and Competitive Analysis. By C. Fleisher & B. Bensoussan.
Ch26.24
Process for Applying the Technique• Interpreting relationships found by regression
analysis– Linear relationships cannot be used to
approximate values for any possible value of x.– Should only be used over the range of the
original data. – Formula for a linear relationship does not imply
that changes in x cause changes in y.
Ch26. Statistical Analysis
FT Press 2007. All Rights Reserved.
Business and Competitive Analysis. By C. Fleisher & B. Bensoussan.
Ch26.25
Process for Applying the Technique• Correlation
– A form of regression analysis.– Widely used.– Gives an indication of the tendency for one thing to occur
in relation to the tendency for another to occur. – The correlation coefficient calculated for the data
indicates the strength of the association between the two properties.
– It will be number between -1 and 1. – The closer the absolute value of the correlation coefficient
is to 1, the stronger the association.– Does not prove the existence of a cause and effect
relationship.
Ch26. Statistical Analysis
FT Press 2007. All Rights Reserved.
Business and Competitive Analysis. By C. Fleisher & B. Bensoussan.
Ch26.26
Process for Applying the Technique• P-values
– P-values are used to describe the significance of a statistical finding.
– They relate in part to the number of observations used to reach the conclusion and the magnitude of the observations.
– A null hypothesis proposes that there is no difference between two groups.
– Where a p-value is given as 0.05, this means that if the null hypothesis is true you would only have a 5 % chance of getting the results from a sample group that you in fact got.
Ch26. Statistical Analysis
FT Press 2007. All Rights Reserved.
Business and Competitive Analysis. By C. Fleisher & B. Bensoussan.
Ch26.27
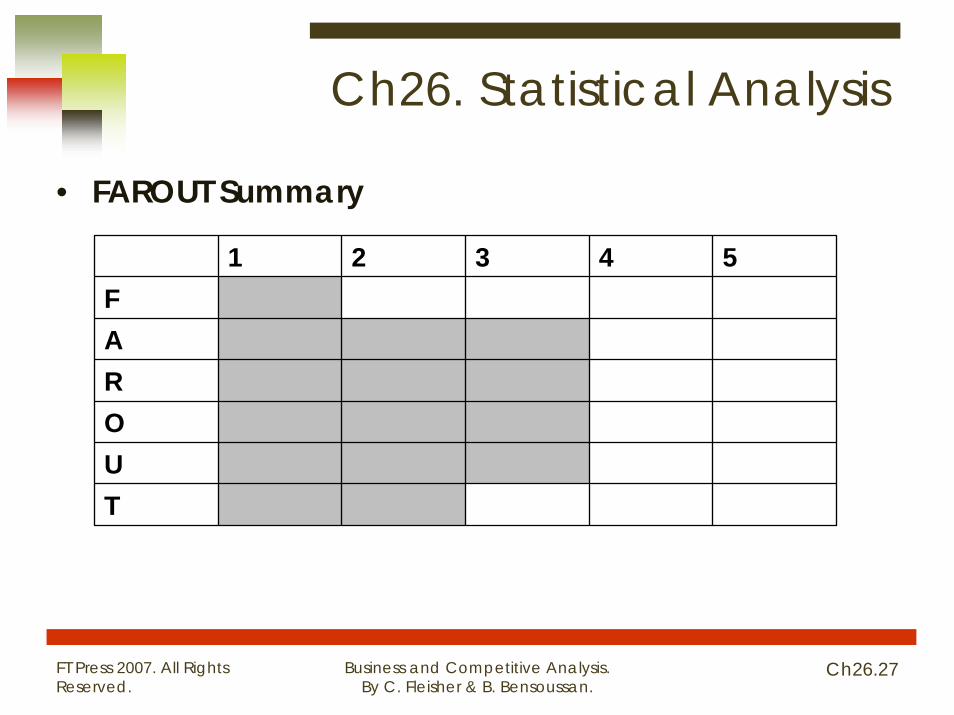
• FAROUT Summary
1 2 3 4 5FAROUT
Ch26. Statistical Analysis

FT Press 2007. All Rights Reserved.
Business and Competitive Analysis. By C. Fleisher & B. Bensoussan.
Ch26.28
Related Tools and Techniques• Financial Statement and Ratio Analysis• Benchmarking• Competitor Cash Flow Analysis• Patent Analysis
Ch26. Statistical Analysis

FT Press 2007. All Rights Reserved.
Business and Competitive Analysis. By C. Fleisher & B. Bensoussan.
Ch26.29
For More About Statistical Analysis and 23 Other Useful
Analysis Methods, see:
Fleisher, Craig S. and Babette E. Bensoussan
Business and Competitive Analysis: Effective Application of
New and Classic Methods
Upper Saddle River, NJ2007
Ch26. Statistical Analysis