chapter 22 testing protocols - american petroleum...
TRANSCRIPT

This document is not an API Standard; it is under consideration within an API technical committee but has not received all approvals required to become an API Standard. It shall not be reproduced or circulated or quoted, in whole or in part, outside of API committee activities except with the approval of the Chairman of the committee having jurisdiction and staff of the API Standards Dept. Copyright API. All rights reserved.
Working Group Draft
MANUAL OF PETROLEUM MEASUREMENT STANDARDS
Chapter 22 – Testing Protocols Section 5 – Flow Computer Calculations

This document is not an API Standard; it is under consideration within an API technical committee but has not received all approvals required to become
an API Standard. It shall not be reproduced or circulated or quoted, in whole or in part, outside of API committee activities except with the approval of the
Chairman of the committee having jurisdiction and API staff.
Copyright API. All rights reserved.
Working Group Draft 47: FEBRUARY 2018 P a g e | i
This document is not an API Standard; it is under consideration within an API technical committee but has not received all approvals required to become
an API Standard. It shall not be reproduced or circulated or quoted, in whole or in part, outside of API committee activities except with the approval of the
Chairman of the committee having jurisdiction and API staff.
Copyright API. All rights reserved.
Working Group Draft 47: FEBRUARY 2018 P a g e | ii
TableofContents
INTRODUCTION ............................................................................................................................................................... 1
1. SCOPE ..................................................................................................................................................................... 2
2. FIELD OF APPLICATION ............................................................................................................................................ 2
3. DEFINITION, SYMBOLS, & ABREVIATIONS ................................................................................................................ 3
3.1 DEFINITIONS .................................................................................................................................................................. 3
3.1.1 TERM 1 – DEFINITION 1 ................................................................................................................................................... 3
3.2 SYMBOLS ...................................................................................................................................................................... 3
3.3 ABBREVIATIONS .............................................................................................................................................................. 3
4. REFERENCES AND ADDITIONAL READING................................................................................................................. 3
4.1 REF 1. .......................................................................................................................................................................... 3
5. PARAMETER VARIATIONS AFFECTING DEVICE PERFORMANCE ................................................................................. 3
5.1 DYNAMIC CALCULATIONS ................................................................................................................................................. 3
5.2 AMBIENT TEMPERATURE .................................................................................................................................................. 3
6. MANDATORY TESTS ................................................................................................................................................ 3
6.1 TEST CONDITIONS ........................................................................................................................................................... 3
6.2 TEST INSTALLATION ......................................................................................................................................................... 4
6.2.1 STATIC TESTING .............................................................................................................................................................. 4
6.2.2 DYNAMIC TESTING .......................................................................................................................................................... 5
6.3 TEST RESULTS ................................................................................................................................................................ 5
6.4 BASELINE (IDEAL CONDITION) TESTING ............................................................................................................................... 6
6.4.1 STATIC TESTING .............................................................................................................................................................. 6
6.5 NON‐IDEAL CONDITION TESTING ....................................................................................................................................... 6
6.6 SPECIAL TESTING ............................................................................................................................................................ 6
6.7 TESTING DOCUMENTATION ............................................................................................................................................... 6
6.8 TESTING PROCEDURE ....................................................................................................................................................... 7
6.8.1 BASELINE (IDEAL CONDITION) TESTING ............................................................................................................................... 7
6.8.2 NON‐IDEAL CONDITION TESTING ....................................................................................................................................... 9
6.8.2.1 DYNAMIC FLOW TESTING (FLOW TESTING) ...................................................................................................................... 9
6.8.2.2 AMBIENT TEMPERATURE TESTING ................................................................................................................................ 11
7. TEST FACILITY REQUIREMENTS ............................................................................................................................... 11
7.1 AUDIT PROCESS ............................................................................................................................................................ 11
7.2 LAB / FACILITY QUALIFICATION ........................................................................................................................................ 12
7.3 VALIDITY / PRECISION OF LAB / FACILITY RESULTS ............................................................................................................... 12
8. UNCERTAINTY ANALYSIS AND CALCULATION .......................................................................................................... 12

This document is not an API Standard; it is under consideration within an API technical committee but has not received all approvals required to become
an API Standard. It shall not be reproduced or circulated or quoted, in whole or in part, outside of API committee activities except with the approval of the
Chairman of the committee having jurisdiction and API staff.
Copyright API. All rights reserved.
Working Group Draft 47: FEBRUARY 2018 P a g e | iii
8.1 TYPES OF UNCERTAINTY CALCULATIONS ............................................................................................................................ 12
8.1.1 TEST FACILITY UNCERTAINTY ........................................................................................................................................... 12
8.1.2 DEVICE UNCERTAINTY .................................................................................................................................................... 13
8.2 HOW TO CALCULATE UNCERTAINTY .................................................................................................................................. 13
8.2.1 STATIC TESTING ............................................................................................................................................................ 13
8.2.2 DYNAMIC TESTING ........................................................................................................................................................ 13
8.2.3 AMBIENT TEMPERATURE TESTING .................................................................................................................................... 13
8.3 PRESENTATION OF UNCERTAINTY TEST REPORT .................................................................................................................. 13
9. TEST REPORT .......................................................................................................................................................... 13
9.1 STATIC TESTING ............................................................................................................................................................ 14
9.1.1 AGA REPORT NUMBER 8 TESTING ................................................................................................................................... 14
9.1.2 API MPMS CHAPTER 14.3 TESTING ................................................................................................................................ 15
9.1.3 AGA REPORT NUMBERS 7 AND 9 TESTING ........................................................................................................................ 16
9.1.4 AGA REPORT NUMBER 11 TESTING ................................................................................................................................. 16
9.2 DYNAMIC TESTING ........................................................................................................................................................ 17
9.3 AMBIENT TEMPERATURE TESTING .................................................................................................................................... 18
ANNEX A (NORMATIVE): TEST POINTS FOR STATIC TESTING OF AGA REPORT NUMBER 8 CALCULATIONS ........................ 19
ANNEX B (NORMATIVE): TEST POINTS FOR STATIC TESTING OF API MPMS CHAPTER 14.3 CALCULATIONS ....................... 19
ANNEX C (NORMATIVE): TEST POINTS FOR STATIC TESTING OF AGA REPORT NUMBERS 7 AND 9 CALCULATIONS ............ 22
ANNEX D (NORMATIVE): TEST POINTS FOR STATIC TESTING OF AGA REPORT NUMBER 11 CALCULATIONS ...................... 22
ANNEX E (NORMATIVE): FLOW PATTERNS AND PARAMETERS FOR DYNAMIC TESTING OF API MPMS CHAPTER 14.3
CALCULATIONS ............................................................................................................................................................... 23
ANNEX F (NORMATIVE): FLOW PATTERNS AND PARAMETERS FOR DYNAMIC TESTING OF AGA REPORT NUMBERS 7 AND 9
CALCULATIONS ............................................................................................................. ERROR! BOOKMARK NOT DEFINED.
ANNEX G (NORMATIVE): FLOW PATTERNS AND PARAMETERS FOR DYNAMIC TESTING OF AGA REPORT NUMBER 11
CALCULATIONS ............................................................................................................. ERROR! BOOKMARK NOT DEFINED.

This document is not an API Standard; it is under consideration within an API technical committee but has not received all approvals required to
become an API Standard. It shall not be reproduced or circulated or quoted, in whole or in part, outside of API committee activities except with
the approval of the Chairman of the committee having jurisdiction and API staff.
Copyright API. All rights reserved.
Working Group Draft 47: FEBRUARY 2018 P a g e | 1
INTRODUCTION This document defines the testing and reporting protocols for devices used to calculate flowrates and/or volumes from meters measuring gaseous hydrocarbon fluids. This protocol is designed to supply industry with a comparable description of the capabilities of these devices when they are used under similar operating conditions. The objectives of this Testing Protocol are to: 1. Ensure that the user of any flow computing device knows the performance characteristics of the device over an applicable range as defined by tests, 2. Facilitate both the understanding and the introduction of new technologies, 3. Provide a standardized vehicle for validating manufacturers’ performance specifications, 4. Provide information about relative performance characteristics of the flow computing devices under standardized testing protocol. 5. Quantify the uncertainty of these devices and define the operating and installation conditions for which the stated uncertainties apply. To accomplish these objectives, the testing protocol defines the test limits for operating conditions of the devices, and the requirements of the facility or facilities to perform the tests. This standard encompasses any device capable of calculating flowrates, masses, and/or volumes.

This document is not an API Standard; it is under consideration within an API technical committee but has not received all approvals required to
become an API Standard. It shall not be reproduced or circulated or quoted, in whole or in part, outside of API committee activities except with
the approval of the Chairman of the committee having jurisdiction and API staff.
Copyright API. All rights reserved.
Working Group Draft 47: FEBRUARY 2018 P a g e | 2
1. SCOPE This API MPMS Chapter is intended to be a standardized guideline to determine and document the fidelity of implementation of the API MPMS calculations standards. As with all standards developed under 22.1, this standard includes a listing of parameters affecting the performance of the devices, a description of the tests required, requirements for the test facility, a data reporting format, and an uncertainty determination methodology.
2. FIELD OF APPLICATION The field of application for this testing protocol is limited to devices that are used in the measurement of gaseous hydrocarbon fluids in the petroleum, energy, and petrochemical industries.

This document is not an API Standard; it is under consideration within an API technical committee but has not received all approvals required to
become an API Standard. It shall not be reproduced or circulated or quoted, in whole or in part, outside of API committee activities except with
the approval of the Chairman of the committee having jurisdiction and API staff.
Copyright API. All rights reserved.
Working Group Draft 47: FEBRUARY 2018 P a g e | 3
3. DEFINITION, SYMBOLS, & ABREVIATIONS (WILL BE ADDRESSED BEFORE SUBCOMMITTEE BALLOT)
3.1 Definitions The following definitions are used in this standard:
3.1.1 Calculation Version Indentifier– an auditable (see API MPMS Chapter 21.1) unique identifier used to distinguish any changes to the calculation methodology of a flow computer
3.1.2 Uncertainty (of measurement) - The amount by which an observed or calculated value may depart from the true value
3.2 Abbreviations
4. REFERENCES AND ADDITIONAL READING (WILL BE ADDRESSED BEFORE SUBCOMMITTEE BALLOT)
4.1 Ref 1.
5. PARAMETER VARIATIONS AFFECTING DEVICE PERFORMANCE
5.1 Dynamic Calculations The ability of the flow computer to accurately calculate accumulated volume or mass over a period of time with varying inputs. Calculations are typically performed as directed by API MPMS Chapter 21.1 “Electronic Flow Measurement”.
6. MANDATORY TESTS
6.1 Test Conditions Unless otherwise noted, all testing should be performed at:
room temperature (70° F +\- 10° F)
ambient pressure
relative humidity of less than 60%

This document is not an API Standard; it is under consideration within an API technical committee but has not received all approvals required to
become an API Standard. It shall not be reproduced or circulated or quoted, in whole or in part, outside of API committee activities except with
the approval of the Chairman of the committee having jurisdiction and API staff.
Copyright API. All rights reserved.
Working Group Draft 47: FEBRUARY 2018 P a g e | 4
6.2 Test Installation
6.2.1 General
Figure 1 ‐ Flow Computer Test Installation
The flow computer and the reference calculator shall receive the same inputs as shown in Figure 1. The inputs may come from one of several sources:
‐ Signal Generator ‐ Transmitters ‐ User Interface ‐ Imported File
6.2.2 Static Testing If the flow computer does not have the ability to override inputs from an integrated secondary device, then actual inputs must be used.All inputs for static testing will be required to be “fixed” at exact values for the span of testing. Depending on the equipment being used for testing, this may be done in one of two ways. If the flow computer allows, the fixed values of the primary variables should be entered directly into the appropriate memory locations. This method will produce the best results as it

This document is not an API Standard; it is under consideration within an API technical committee but has not received all approvals required to
become an API Standard. It shall not be reproduced or circulated or quoted, in whole or in part, outside of API committee activities except with
the approval of the Chairman of the committee having jurisdiction and API staff.
Copyright API. All rights reserved.
Working Group Draft 47: FEBRUARY 2018 P a g e | 5
eliminates all possible error introduction based on the hardware elements of a flow computer (A-D converters, ambient temperature sensitivity, etc.).
Alternatively, if fixed entries are not supported or are impractical, the user is permitted to use external devices to simulate primary variables (dry block, hand pumps) as long as they are certified to have accuracies of at least twice the flow computer inputs and are traceable to national standards. When using external sources for pressure, temperature, differential pressure, and/or frequency, the user should verify that the signal from the external source is being transmitted and converted accurately. If this method is being utilized, then the vendor must make available a “snap shot” feature that will allow the user to capture the instantaneous inputs and resulting outputs (including all available intermediate values) for one quantity calculation period of the flow computer. This will allow the user to capture exact values entered for testing to offset any deviations between the ideal fixed values and the actual value.
6.2.3 Dynamic Testing For the dynamic testing, the setup is similar to the static testing, but the inputs for temperature, pressure, and flow input (differential pressure or frequency) shall be variable. The reference calculator shall capture and calculate at least one time per second. Alternatively, if the flow computer has the capability of logging the required variables used in each calculation period and the results of each calculation period (volume, mass, etc) and exporting these results to an external file which can be utilized for the reference calculations, this is an acceptable method. When calculations are performed at least one time per second, results shall be compared directly to values captured and calculated by the reference calculator.
6.3 Test Results
The calculation outputs of the flow computers shall be compared to reference calculations performed independently on the same data sets. The reference used shall be independent in that:
- It shall be agreed upon by all involved parties - It should be performed by a third party or third party software - A reference spreadsheet has been created for these tests and is included in the
purchase of this document

This document is not an API Standard; it is under consideration within an API technical committee but has not received all approvals required to
become an API Standard. It shall not be reproduced or circulated or quoted, in whole or in part, outside of API committee activities except with
the approval of the Chairman of the committee having jurisdiction and API staff.
Copyright API. All rights reserved.
Working Group Draft 47: FEBRUARY 2018 P a g e | 6
Because the non-ideal testing involves the capability of the flow computer to average over time, the reference calculation of the total volumes shall be the sum of calculations performed at least once per second.
6.4 Baseline (Ideal Condition) Testing
6.4.1 Static Testing The purpose of static testing is to confirm the result of the “flow calculations”. The result will be a one calculation result based on assumed ideal and “fixed” inputs for the primary variables as well as gas composition. Static testing shall test over the ranges of the applicable standard as well as near and outside the boundary conditions of all the variables of the applicable standard. If a test causes an error or alarm in the flow computer, that error shall be noted in the report. The following static flow computer tests shall be performed if applicable:
AGA Report Number 8, and AGA Report Number 5 or GPA 2172 Calculations
API MPMS Chapter 14.3 Calculations
AGA Report Numbers 7 and 9 Calculations
AGA Report Number 11 Calculations
Many of the above tests can be performed simultaneously so that testing time can be reduced. Testing should be performed to the latest edition of the above standards, but it may be tested to any edition. The edition of the standard that the tests are performed to shall be documented.
6.5 Non-Ideal Condition Testing
To determine the ability of the flow computer to properly calculate and sum volumes over a time period, the following tests must be performed:
Dynamic Flow Testing
6.6 Special Testing
If the end user or manufacturer requires any testing to determine the effect of any other parameter on the performance of a flow computer, that parameter may be tested under this protocol. For example, the end user may require that the calculations are accurate when the flow computer is exposed to steady vibrations over time, or when used with other calculations such as ISO 5167, Gross I, Gross II, NX-19, GERG, etc.
6.7 Testing Documentation
The raw data and test condition records of all tests shall be saved for future reference.

This document is not an API Standard; it is under consideration within an API technical committee but has not received all approvals required to
become an API Standard. It shall not be reproduced or circulated or quoted, in whole or in part, outside of API committee activities except with
the approval of the Chairman of the committee having jurisdiction and API staff.
Copyright API. All rights reserved.
Working Group Draft 47: FEBRUARY 2018 P a g e | 7
6.8 Testing Procedure
6.8.1 General The sections below detail the minimum information that is necessary to determine the static performance of a flow computer to calculate specific iterations. It may be useful for the manufacturer to record intermediate calculation values in order to determine the source of any calculation issues. Many of the below tests can be performed simultaneously so that testing time can be reduced.
6.8.2 Baseline (Ideal Condition) Testing 6.8.2.1 AGA Report Number 8, and AGA Report Number 5 or GPA 2172
Calculations
Static testing shall determine the ability of the flow computer to calculate fluid properties of combinations of compositions, temperatures, and pressures per AGA Report Number 8. The Method used to calculate fluid properties shall be identified (i.e. Gross I, Gross II, Detail, etc.). Heating values shall be calculated utilizing either AGA Report Number 5 or GPA 2172. The method of calculation shall be identified.
The following parameters shall be input into the flow computer:
Pressure
Temperature
Composition (in mole percent) o Methane o Nitrogen o Carbon Dioxide o Ethane o Propane o Water o Hydrogen Sulfide o Hydrogen o Carbon Monoxide o Oxygen o Isobutane o Butane o Isopentane o Pentane o Hexane o Heptane o Octane o Nonane
This document is not an API Standard; it is under consideration within an API technical committee but has not received all approvals required to
become an API Standard. It shall not be reproduced or circulated or quoted, in whole or in part, outside of API committee activities except with
the approval of the Chairman of the committee having jurisdiction and API staff.
Copyright API. All rights reserved.
Working Group Draft 47: FEBRUARY 2018 P a g e | 8
o Decane o Helium o Argon o Neopentane, if applicable, (and how neopentane is handled)
The flow computer shall provide the calculated compressibility (Zb, Zf), relative density and heating value. Base conditions may vary per user. At a minimum, the testing should cover the points listed in ANNEX A.
6.8.2.2 API MPMS Chapter 14.3 Calculations
Static testing shall determine the ability of the flow computer to calculate fluid flow rates per API MPMS Chapter 14.3.
The following parameters shall be input into the flow computer:
Differential Pressure
Pressure (absolute or gauge and atmospheric)
Temperature
Either 1. Flowing Density and Base Density 2. Or Composition and Base Conditions
Dynamic Viscosity (either fixed or calculated)
Isentropic Exponent
Pipe Diameter
Thermal Expansion Factor of Pipe
Pipe Diameter Reference Temperature
Orifice Diameter
Thermal Expansion Factor of Plate
Orifice Diameter Reference Temperature
Static Pressure Tap Location (If selectable)
The flow computer shall provide the calculated:
Volume Flowrate at User Defined Base Conditions
Mass Flow Rate (optional)
The actual test points are listed inANNEX B.
6.8.2.3 AGA Report Numbers 7 and 9 Calculations
Static testing shall determine the ability of the flow computer to calculate fluid flow rates per AGA Report Numbers 7 and 9. The flow computer may have the ability to perform piecewise linearization of the K-Factor.
The following parameters shall be input into the flow computer:

This document is not an API Standard; it is under consideration within an API technical committee but has not received all approvals required to
become an API Standard. It shall not be reproduced or circulated or quoted, in whole or in part, outside of API committee activities except with
the approval of the Chairman of the committee having jurisdiction and API staff.
Copyright API. All rights reserved.
Working Group Draft 47: FEBRUARY 2018 P a g e | 9
Flow Rate (eg Frequency, Counts per Unit Time, Modbus, etc)
Either 1. Flowing Density and Base Density 2. Or Composition, Flowing Conditions, and Base Conditions
K-Factor
Meter Factor
Linearization/Curve Fit Methodology (if applicable)
Linearization/Curve Fit Pairs/Values (if applicable)
The flow computer shall provide the calculated:
Volume Flowrate
Volume Flowrate at User Defined Base Conditions
The actual test points are listed inANNEX C.
6.8.2.4 AGA Report Number 11 Calculations
Static testing shall determine the ability of the flow computer to calculate fluid flow rates per AGA Report Number 11.
The following parameters shall be input into the flow computer:
Flow Rate (eg Frequency, Counts per Unit Time, Modbus, etc)
Either 1. Flowing Density and Base Density 2. Or Composition, Flowing Conditions, and Base Conditions
K-Factor
Meter Factor
Linearization/Curve Fit Methodology (if applicable)
Linearization/Curve Fit Pairs/Values (if applicable)
The flow computer shall provide the calculated:
Mass Flowrate
Volume Flowrate
Volume Flowrate at User Defined Base Conditions
The actual test points are listed inANNEX C.
6.8.3 Non-Ideal Condition Testing
6.8.3.1 Dynamic Flow Testing Three tests, each lasting for two hours, shall be performed. Test 1 is a steady state test. Tests 2 and 3 shall be conducted with varying line pressure and either

This document is not an API Standard; it is under consideration within an API technical committee but has not received all approvals required to
become an API Standard. It shall not be reproduced or circulated or quoted, in whole or in part, outside of API committee activities except with
the approval of the Chairman of the committee having jurisdiction and API staff.
Copyright API. All rights reserved.
Working Group Draft 47: FEBRUARY 2018 P a g e | 10
differential pressure or frequency/counts per time interval. The flow patterns are discussed in depth in ANNEX D.
It is not possible to simulate the flow patterns exactly while performing or simulating flow testing. Therefore, the following data must be recorded independently no less than once per second:
Pressure
Temperature
Differential Pressure (if API MPMS Chapter 14.3 Testing)
Frequency or counts per time interval (if AGA Report Numbers 7 and 9 or 11 Testing)
Calculations from the flow computer shall be collected according to API MPMS Chapter 21.1 guidelines for a quantity transaction record.
6.8.3.1.1 Simulation of Inputs For flow computers with analog transmitters, the differential pressure input can be simulated using a function generator(s) to simulate the flow computer inputs.
For flow computers using digitally interfaced or integral transmitters, the differential pressure input can be simulated using a function generator and I/P (current to pressure) transmitter.
Some flow computers have the ability to import a file with 1 second data for calculation inputs such as differential pressure, static pressure, pulse counts or frequency and flowing temperature with a determined pattern as well as logging 1 second results of the calculations. This is an acceptable method to simulate inputs.
6.8.3.1.2 Data Collection and Algorithm Verification These tests are intended to test the flow computer algorithm only and not the performance of the secondary devices. As such, the simulated inputs have to be considered and accounted for in the algorithm testing:
• For flow computers that can log the process inputs along with a time stamp, these differences can be significantly minimized or eliminated.
• For flow computers that do not log this information, a second flow computer or data acquisition system can be used to measure and log the process variables. Care must be taken to calibrate the second flow computer/data acquisition system to the flow computer under test in order to minimize comparison differences.
Figure 2 provides a block diagram of the data acquisition and verification process.

This document is not an API Standard; it is under consideration within an API technical committee but has not received all approvals required to
become an API Standard. It shall not be reproduced or circulated or quoted, in whole or in part, outside of API committee activities except with
the approval of the Chairman of the committee having jurisdiction and API staff.
Copyright API. All rights reserved.
Working Group Draft 47: FEBRUARY 2018 P a g e | 11
Figure 2 ‐ Block Diagram of Test Set‐up and Algorithm Verification Process
Note: The output of digital function generators provide flow computer inputs that have very accurate and repeatable flow computer wave form and frequency inputs. The output of digital function generators combined with an I/P provides flow computer inputs that have repeatable wave form and frequency inputs. The I/P output response tends to distort the function generator input and may result in an over‐damped or under‐damped output. This effect has to be accounted for by independently measuring the I/P output at a frequency equal to or faster than the flow computer sampling frequency. After calibrating the independent transmitters to the flow computer transmitters or adjusting for calibration differences, these measurements can be used to calculate the expected flow computer averages, integral value and flow time for testing purposes. See Figure D‐1 and Figure D‐2 for examples of I/P outputs.
7. TEST FACILITY REQUIREMENTS
7.1 Audit Process
The test facility performing the tests shall provide evidence that the tests are performed in accordance with requirements of this standard. This evidence shall be provided at the

This document is not an API Standard; it is under consideration within an API technical committee but has not received all approvals required to
become an API Standard. It shall not be reproduced or circulated or quoted, in whole or in part, outside of API committee activities except with
the approval of the Chairman of the committee having jurisdiction and API staff.
Copyright API. All rights reserved.
Working Group Draft 47: FEBRUARY 2018 P a g e | 12
request of any user of the facility. Providing documentation that the tests were performed in accordance with the applicable test procedure is the responsibility of the test facility. A manufacturer using a third party calibration facility can request the system uncertainty of the testing facility to ensure the validity of the tests. The extent of the audit is determined by the user of the facility and must be consistent with relevant national and/or international standards.
7.2 Lab / Facility Qualification The test facility conducting the performance evaluation test for the flow computer shall either: 1) Have ISO 17025 or equivalent certification for the applicable flow computer testing 2) provide the calculation details 3) be certified by a third party for the measurement uncertainty of each of the variables
monitored and reported in the test results 4) Utilize the reference standard Microsoft Excel spreadsheet supplied with this protocol All references used to establish the measurement uncertainty or performance specifications of the flow computer must be traceable to national or internationally recognized standards. The system uncertainty of the calibration facility and each monitored variable included in the Test Report for establishing the performance of the flow computer shall include the measurement uncertainty with a 95% confidence interval. If requested by the user of the facility, the test facility shall provide the documentation of the procedure and calculation method used to establish the system uncertainty and frequency of verification, unless the performance uncertainty of the facility is certified and periodically verified by a nationally recognized third party. If the system uncertainty is certified by a third party, a copy of the valid certification would satisfy this requirement.
7.3 Validity / Precision of Lab / Facility Results If the test facility meets all the user requirements and any additional requirements defined in the testing protocol, then the results of the test shall be considered valid.
8. UNCERTAINTY ANALYSIS AND CALCULATION
8.1 Types of Uncertainty Calculations
8.1.1 Test Facility Uncertainty As this standard is a testing protocol to determine the ability of a flow computer to perform calculations, the uncertainty associated with the testing facility is assumed to be negligible, provided that the test facility meets the requirements set forth in Section 7.

This document is not an API Standard; it is under consideration within an API technical committee but has not received all approvals required to
become an API Standard. It shall not be reproduced or circulated or quoted, in whole or in part, outside of API committee activities except with
the approval of the Chairman of the committee having jurisdiction and API staff.
Copyright API. All rights reserved.
Working Group Draft 47: FEBRUARY 2018 P a g e | 13
8.1.2 Device Uncertainty The device uncertainty as defined by this standard is the deviation of the flow computer calculations for the test being performed from the test facility calculations reported in percent.
8.2 How to Calculate Uncertainty
8.2.1 Static Testing The uncertainty associated with the static testing is the deviation of the flow rate calculated by the computer under test from the flow rate calculated by the test facility.
8.2.2 Dynamic Testing The uncertainty associated with the dynamic testing is the deviation of the volume calculated by the flow computer under test from the volume calculated by the test facility.
8.3 Presentation of Uncertainty Test Report The uncertainties associated with the testing shall be included in the report summary information.
9. TEST REPORT
9.1 General All reports associated with testing to this protocol shall include the following information:
Flow Computer Manufacturer Testing Facility Type of Test (Static, Dynamic, or Ambient Temperature) Calculations Tested (AGA 8, API 14.3, AGA 7/9, or AGA 11) Test Date(s) Calculation Code Revision Identifier
Static tests performed outside of boundary conditions, as defined in Annex A and Annex B, are not calculation tests, but tests of how the flow computer responds to crossing the boundary. For tests with parameter(s) outside of the boundary condition, the numerical result does not need to be reported. For tests outside of the boundary condition, the behavior of the flow computer shall be reported. For example, the behavior could be reported as:
A numerical result was reported An alarm was reported An error was reported Flow Computer stopped the calculation Flow Computer uses the last “good” value

This document is not an API Standard; it is under consideration within an API technical committee but has not received all approvals required to
become an API Standard. It shall not be reproduced or circulated or quoted, in whole or in part, outside of API committee activities except with
the approval of the Chairman of the committee having jurisdiction and API staff.
Copyright API. All rights reserved.
Working Group Draft 47: FEBRUARY 2018 P a g e | 14
OtherEvent and alarm logs should be collected and reported following the static testing.
9.2 Static Testing
9.2.1 AGA Report Number 8 Testing A summary of the testing shall include the total number of points tested and the maximum deviation noted from the reference value. The summary shall include a description of the reference calculation software and/or methodology.
The following parameters and calculations shall be reported for each point:
Inputs o Pressure o Temperature o Composition (in mole percent)
Methane Nitrogen Carbon Dioxide Ethane Propane Water Hydrogen Sulfide Hydrogen Carbon Monoxide Oxygen Isobutane Butane Isopentane Pentane Hexane Heptane Octane Nonane Decane Helium Argon Neopentane, if applicable, (and how neopentane is handled)
Outputs o Flow Computer Under Test
Flowing Compressibility Base Compressibility Heating Value

This document is not an API Standard; it is under consideration within an API technical committee but has not received all approvals required to
become an API Standard. It shall not be reproduced or circulated or quoted, in whole or in part, outside of API committee activities except with
the approval of the Chairman of the committee having jurisdiction and API staff.
Copyright API. All rights reserved.
Working Group Draft 47: FEBRUARY 2018 P a g e | 15
Relative Density o Reference Calculation
Flowing Compressibility Base Compressibility Heating Value Relative Density
o Deviations Flowing Compressibility Base Compressibility Heating Value Relative Density
9.2.2 API MPMS Chapter 14.3 Testing A summary of the testing shall include the total number of points tested and the maximum deviation noted from the reference value. The summary shall include a description of the reference calculation software and/or methodology.
The following parameters and calculations shall be reported for each point:
Inputs o Differential Pressure o Pressure (absolute or gauge and atmospheric) o Temperature o Base Conditions o Either
1. Flowing Density and Base Density 2. Or Composition and Base Conditions
o Dynamic Viscosity o Isentropic Exponent o Pipe Diameter o Thermal Expansion Factor of Pipe o Pipe Diameter Reference Temperature o Orifice Diameter o Thermal Expansion Factor of Plate o Orifice Diameter Reference Temperature o Compressible or Incompressible Fluid (Is expansion factor
calculated?) o Static Tap Location
Outputs o Flow Computer Under Test
Mass Flow Rate

This document is not an API Standard; it is under consideration within an API technical committee but has not received all approvals required to
become an API Standard. It shall not be reproduced or circulated or quoted, in whole or in part, outside of API committee activities except with
the approval of the Chairman of the committee having jurisdiction and API staff.
Copyright API. All rights reserved.
Working Group Draft 47: FEBRUARY 2018 P a g e | 16
o Volume Flowrate at User Defined Base ConditionsReference Calculation Mass Flow Rate
o Volume Flowrate at User Defined Base ConditionsDeviations Mass Flow Rate
9.2.3 Volume Flowrate at User Defined Base ConditionsAGA Report Numbers 7 and 9 Testing
A summary of the testing shall include the total number of points tested and the maximum deviation noted from the reference value. The summary shall include a description of the reference calculation software and/or methodology.
The following parameters and calculations shall be reported for each point:
Inputs o Flow Rate (eg Frequency, Counts per Unit Time, Modbus, etc) o Either
1. Flowing Density and Base Density 2. Or Composition, Flowing Conditions, and Base Conditions
o K-Factor o Meter Factor, if supported in the EFM, o Linearization/Curve Fit Methodology, if supported in the EFM o Linearization/Curve Fit Pairs/Values, if supported in the EFM
Outputs o Flow Computer Under Test
Volume Flowrate o Volume Flowrate at User Defined Base ConditionsReference
Calculation Volume Flowrate
o Volume Flowrate at User Defined Base ConditionsDeviations Volume Flowrate
9.2.4 Volume Flowrate at User Defined Base ConditionsAGA Report Number 11 Testing
A summary of the testing shall include the total number of points tested and the maximum deviation noted from the reference value. The summary shall include a description of the reference calculation software and/or methodology.
The following parameters and calculations shall be reported for each point:
Inputs o Flow Rate (eg Frequency, Counts per Unit Time, Modbus, etc) o Either

This document is not an API Standard; it is under consideration within an API technical committee but has not received all approvals required to
become an API Standard. It shall not be reproduced or circulated or quoted, in whole or in part, outside of API committee activities except with
the approval of the Chairman of the committee having jurisdiction and API staff.
Copyright API. All rights reserved.
Working Group Draft 47: FEBRUARY 2018 P a g e | 17
1. Flowing Density and Base Density 2. Or Composition, Flowing Conditions, and Base Conditions
o K-Factor o Meter Factor o Linearization/Curve Fit Methodology o Linearization/Curve Fit Pairs/Values
Outputs o Flow Computer Under Test
Mass Flowrate Volume Flowrate, if supported by EFM
o Volume Flowrate at User Defined Base ConditionsReference Calculation Mass Flowrate Volume Flowrate, if supported by EFM
o Volume Flowrate at User Defined Base ConditionsDeviations Mass Flowrate Volume Flowrate, if supported by EFM
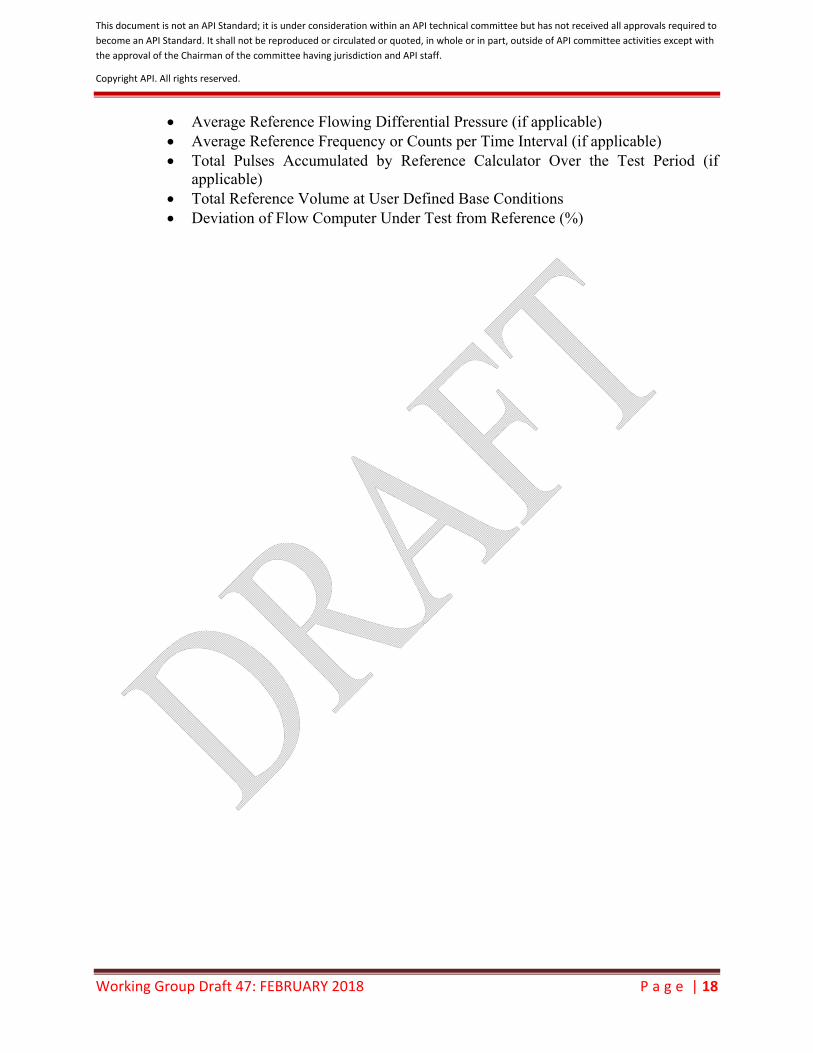
9.3 Volume Flowrate at User Defined Base ConditionsDynamic Testing A summary of the testing shall include the total number of tests and the deviation from the testing facility calculations for each test. The summary shall include a description of the reference calculation software and/or methodology. The following parameters and calculations shall be reported for each test:
Pattern Gas Composition Flow Time Integral Value Base Conditions Base Density Ambient Temperature Atmospheric Pressure Average Flow Computer Under Test Flowing Temperature Average Flow Computer Under Test Flowing Pressure Average Flow Computer Under Test Flowing Differential Pressure (if applicable) Average Flow Computer Under Test Frequency or Counts per Time Interval (if
applicable) Total Pulses Accumulated by Flow Computer Under Test Over the Test Period (if
applicable) Total Flow Computer Under Test Volume at User Defined Base Conditions Average Reference Flowing Temperature Average Reference Test Flowing Pressure
This document is not an API Standard; it is under consideration within an API technical committee but has not received all approvals required to
become an API Standard. It shall not be reproduced or circulated or quoted, in whole or in part, outside of API committee activities except with
the approval of the Chairman of the committee having jurisdiction and API staff.
Copyright API. All rights reserved.
Working Group Draft 47: FEBRUARY 2018 P a g e | 18
Average Reference Flowing Differential Pressure (if applicable) Average Reference Frequency or Counts per Time Interval (if applicable) Total Pulses Accumulated by Reference Calculator Over the Test Period (if
applicable) Total Reference Volume at User Defined Base Conditions Deviation of Flow Computer Under Test from Reference (%)

This document is not an API Standard; it is under consideration within an API technical committee but has not received all approvals required to
become an API Standard. It shall not be reproduced or circulated or quoted, in whole or in part, outside of API committee activities except with
the approval of the Chairman of the committee having jurisdiction and API staff.
Copyright API. All rights reserved.
Working Group Draft 47: FEBRUARY 2018 P a g e | 19
ANNEX A (normative): Test Points for Static Testing ofAGA Report Number 8, and AGA Report Number 5 or GPA 2172 Calculations Each calculation shown below is designed to test one parameter. A total of at least 83 calculations must be verified for this testing. The parameters not listed for each test shall be within the Normal Operating range listed in AGA 8. For calculations (3) through (49), the test is observational, that is to see how the flow computer reacts when components are near or outside limits set by the standard. The calculation of the following points shall be performed:.
1) AGA 8 Table A.3-1 Examples 1-20 2) At least one calculation with each of the following compositions:
Table A‐ 1 ‐ Compositions to be tested (Johansen & Johnson, 2011)
Component
Component Mole Fraction Percent for Indicated Gases
Gulf Coast
Amarillo Ekofisk High N2 High
N2/CO2 CEESI Iowa
CEESI Colorado
High Methane 96.5222 90.6724 85.9063 81.441 82.212 95.4850 84.8128 Ethane 1.8186 4.5279 8.4919 3.3 4.303 1.8984 10.6707 Propane 0.4596 0.828 2.3015 0.605 0.895 0.1770 1.7673
Hydrogen 0 0 0 0 0 0.1599 0 Nitrogen 0.2595 3.1284 1.0068 13.465 5.702 1.5987 0.409 Carbon Dioxide
0.5956 0.4676 1.4954 0.985 7.585 0.5995 2.1109
i-Butane 0.0977 0.1037 0.3486 0.1 0.151 0.0154 0.08 n-Butane 0.1007 0.1563 0.3506 0.104 0.152 0.02013 0.1258 i-Pentane 0.0473 0.0321 0.0509 0 0 0.005 0.0115 n-Pentane 0.0324 0.0443 0.048 0 0 0.003 0.01 Helium 0 0 0 0 0 0.03497 0
n-Hexane 0.0664 0.0393 0 0 0 0.003 0.002
3) Temperature at low boundary (-200°F) 4) Temperature below low boundary (-201°F) 5) Temperature at high boundary (760°F) 6) Temperature above high boundary (761°F) 7) Pressure at high boundary (40000 psia) 8) Pressure above high boundary (40001 psia) 9) Methane above low boundary of normal range (46 mol%) 10) Methane below low boundary of normal range (44 mol%) 11) Nitrogen above high boundary of normal range (51 mol%) 12) Nitrogen below high boundary of normal range (49 mol%) 13) Carbon Dioxide above high boundary of normal range (31 mol%) 14) Carbon Dioxide below high boundary of normal range (29 mol%)

This document is not an API Standard; it is under consideration within an API technical committee but has not received all approvals required to
become an API Standard. It shall not be reproduced or circulated or quoted, in whole or in part, outside of API committee activities except with
the approval of the Chairman of the committee having jurisdiction and API staff.
Copyright API. All rights reserved.
Working Group Draft 47: FEBRUARY 2018 P a g e | 20
15) Ethane above low boundary of normal range (11 mol%) 16) Ethane below low boundary of normal range ( 9 mol%) 17) Propane above high boundary of normal range (5 mol%) 18) Propane below high boundary of normal range (3 mol%) 19) Propane above high boundary of extended range (13 mol%) 20) Propane below high boundary of extended range (11 mol%) 21) Total Butanes above high boundary of normal range (1.1 mol%) 22) Total Butanes below high boundary of normal range (0. 9 mol%) 23) Total Butanes above high boundary of extended range (6.1 mol%) 24) Total Butanes below high boundary of extended range ( 5.9 mol%) 25) Total Pentanes above high boundary of normal range (0.31 mol%) 26) Total Pentanes below high boundary of normal range (0.29 mol%) 27) Total Pentanes above high boundary of extended range (4.1 mol%) 28) Total Pentanes below high boundary of extended range (3.9 mol%) 29) Hexanes plus above high boundary of normal range (0.21 mol%) 30) Hexanes plus below high boundary of normal range (0.19 mol%) 31) Helium above high boundary of normal range (0..21 mol%) 32) Helium below high boundary of normal range (0.19 mol%) 33) Helium above high boundary of extended range (3.1 mol%) 34) Helium below high boundary of extended range (2.9 mol%) 35) Hydrogen above high boundary of normal range (11 mol%) 36) Hydrogen below high boundary of normal range (9 mol%) 37) Carbon Monoxide above high boundary of normal range (31 mol%) 38) Carbon Monoxide below high boundary of normal range (29 mol%) 39) Argon above high boundary of extended range (1.1 mol%) 40) Argon below high boundary of extended range (0.9 mol%) 41) Oxygen above high boundary of extended range (22 mol%) 42) Oxygen below high boundary of extended range (20 mol%) 43) Water above high boundary of normal range (0.051 mol%) 44) Water below high boundary of normal range (0.049 mol%) 45) Hydrogen Sulfide above high boundary of normal range (0.021 mol%) 46) Hydrogen Sulfide below high boundary of normal range (0.019 mol%) 47) One component with negative value (<0 mol%) 48) One component with greater than 100 mol% value 49) Neopentane (if device has entry for Neopentane) set to non-zero value – document if
Neopentane is added to N-Pentane

This document is not an API Standard; it is under consideration within an API technical committee but has not received all approvals required to
become an API Standard. It shall not be reproduced or circulated or quoted, in whole or in part, outside of API committee activities except with
the approval of the Chairman of the committee having jurisdiction and API staff.
Copyright API. All rights reserved.
Working Group Draft 47: FEBRUARY 2018 P a g e | 21
ANNEX B (normative): Test Points for Static Testing of API MPMS Chapter 14.3 Calculations Each calculation shown below is designed to test one parameter. The other parameters shall be within the Normal Operating ranges listed in API MPMS Chapter 14.3. If flow computer maximums and minimums are not specified, user specified maximum and minimum values may be used. For calculations (2) through (28), the test is observational, that is to see how the flow computer reacts when components are near or outside limits set by the standard. The calculation of the following points shall be performed:
1) API MPMS Chapter 14.3 Part 4 Examples 2) Orifice Diameter at low boundary (0.45 inches) 3) Orifice Diameter below low boundary (0.44 inches) 4) Pipe Diameter at low boundary (2 inches) 5) Pipe Diameter below low boundary (1.9 inches) 6) Beta Ratio at low boundary (0.2) 7) Beta Ratio below low boundary (0.19) 8) Beta Ratio at high boundary (0.75) 9) Beta Ratio above high boundary (0.76) 10) Reynolds Number at low boundary (4000) 11) Reynolds Number below low boundary (3900) 12) Pressure Ratio at low boundary (0.75) 13) Pressure Ratio below low boundary (0.74) 14) Differential Pressure at low flow cutoff 15) Differential Pressure below low flow cutoff 16) Differential Pressure at zero 17) Differential Pressure at flow computer maximum 18) Differential Pressure above flow computer maximum 19) Temperature at flow computer minimum 20) Temperature below flow computer minimum 21) Temperature at flow computer maximum 22) Temperature above flow computer maximum 23) Pressure at zero absolute 24) Pressure below zero absolute 25) Pressure at flow computer maximum 26) Pressure above flow computer maximum 27) Orifice Diameter larger than pipe diameter 28) Viscosity at zero

This document is not an API Standard; it is under consideration within an API technical committee but has not received all approvals required to
become an API Standard. It shall not be reproduced or circulated or quoted, in whole or in part, outside of API committee activities except with
the approval of the Chairman of the committee having jurisdiction and API staff.
Copyright API. All rights reserved.
Working Group Draft 47: FEBRUARY 2018 P a g e | 22
ANNEX C (normative): Test Points for Static Testing of AGA Report Numbers 7, 9, and 11 Calculations
Each calculation shown below is designed to test one parameter. For calculations (4 and 5) and (9) through (48), the test is observational, that is to see how the flow computer reacts when components are near or outside limits set by the standard. The other parameters shall be within the Normal Operating ranges listed in AGA Report Numbers 7, 9, and 11. The calculation of the following points shall be performed:
1) Flow Rate (eg Frequency, Counts per Unit Time, Modbus, etc) at zero 2) Flow Rate at low flow cutoff if applicable 3) Flow Rate below low flow cutoff if applicable 4) Flow Rate at flow computer max 5) Flow Rate above flow computer max 6) For Piecewise Linearization, if supported in the EFM,:
a. 1 point below lowest linearization point b. 1 point above highest linearization point c. 1 point between each linearization point
7) For Point to Point Interpolation, if supported in the EFM,: a. 1 point below lowest interpolation point b. 1 point above highest interpolation point c. 1 point between each interpolation point
8) For Curve Fit, if supported in the EFM,: a. 1 point below curve fit range b. 1 point above curve fit range c. At least 5 points throughout curve fit range
9) K-Factor, if K-Factor supported in the EFM, at zero 10) K-Factor, if K-Factor supported in the EFM, below zero 11) Meter Factor, if Meter Factor supported in the EFM, at zero 12) Meter Factor, if Meter Factor supported in the EFM, below zero

This document is not an API Standard; it is under consideration within an API technical committee but has not received all approvals required to
become an API Standard. It shall not be reproduced or circulated or quoted, in whole or in part, outside of API committee activities except with
the approval of the Chairman of the committee having jurisdiction and API staff.
Copyright API. All rights reserved.
Working Group Draft 47: FEBRUARY 2018 P a g e | 23
ANNEX D (normative): Flow Patterns and Parameters for Dynamic Testing
D.1 Test 1 – Square Wave Test
The square wave input should have a minimum frequency value below the no flow cutoff, a maximum value of approximately 80% of calibrated range and a frequency that will result in one or more complete cycles during the EGM volume calculation interval.
D.1.1 OBJECTIVE
To test the flow computer flow time calculation algorithm. By using a square wave that alternates between “on-flow” for 50% of the calculation
interval and off flow for 50% of the calculation interval, issues with calculating and reporting flow time can be exposed.
To test the calculation of averages of integral value and differential pressure, static pressure and temperature averages.
Because the averages are only done when the differential pressure is above the no flow cutoff, the averages of differential pressure should be approximately equal to the maximum square wave differential pressure value for either linear or square root averages.
D.1.2 EXPECTED RESULTS
D.1.2.1 Expected Results for Flow Time
Testing of a flow computer with one-second sampling and a one-minute calculation interval with a 1/60 hertz square wave will expose rounding or truncating issues in the one-hour reported flow time. For a one-hour test the flow time should be 50% of the hour or 1800 seconds. For flow computer inputs simulated directly from the function generator this estimate is reasonably accurate but for inputs simulated from a function generator and I/P the flow computer input may be distorted and the flow time should be calculated from the independent measurements. An estimate of the maximum flow time error for the above example is:
The maximum flow time error for the one-minute calculation is +/- 1 second in 30
seconds or . The error should be random over the one-hour accumulation interval so the error
should reduce by the square root of the number of samples or . Using the 0.22% (4 seconds) as a 1 σ uncertainty estimate, the 3 σ uncertainty
estimate would be 0.66% (12 seconds). The one-hour flow time should match to within 0.22% to 0.66% (4 to 12 seconds) of
the estimated/ calculated flow time for either flow computer simulated input condition.
D.1.2.2 Expected Results for Differential Pressure
Testing of a flow computer with one-second sampling and a one-minute calculation interval with a 1/60 hertz square wave will result in a differential pressure that is equal to the square wave maximum value. For a one hour test with differential pressure alternating between below no flow cutoff and 80%, the differential pressure average should be 80% for a flow
%67.1301
%22.060%67.1

This document is not an API Standard; it is under consideration within an API technical committee but has not received all approvals required to
become an API Standard. It shall not be reproduced or circulated or quoted, in whole or in part, outside of API committee activities except with
the approval of the Chairman of the committee having jurisdiction and API staff.
Copyright API. All rights reserved.
Working Group Draft 47: FEBRUARY 2018 P a g e | 24
computer with inputs simulated directly from the function generator. For inputs simulated from a function generator and I/P, the differential pressure should be calculated from the independent measurements. For a differential pressure range of 100 "H2O the average differential pressure should be 80% of 100 "H2O or 80 "H2O. An estimate of the maximum flow differential pressure error for the above example is:
The maximum differential pressure error for the one-minute calculation is ±1 one sample being between no flow cutoff and 80 "H2O or a maximum error of
%33.3100))3080(80( . The error should be random over the one-hour accumulation interval so the error
should reduce by the square root of the number of samples or . Because the maximum one-minute error is used, the 3σ uncertainty estimate stays at
0.43% (0.35 "H2O) and the 1σ uncertainty estimate is 0.14%. The one-hour flow time averages should match to within 0.14% to 0.43% (0.11 to
0.35 "H2O) of the estimated/calculated differential pressure for either flow computer simulated input condition.
Figure D1 and Figure D2 show measured differential pressure outputs simulated by a function generator and I/P.
Figure D 1 ‐ Example of an Over‐damped I/P Output
%43.060%3.3
Square Wave Test Measured I/P Output (Over-damped I/P)
0
50
100
150
200
250
09:00:00 09:07:30 09:15:00 09:22:30 09:30:00 09:37:30 09:45:00 09:52:30 10:00:00
Time
Dif
fere
nti
al
Pre
ss
ure
(In
che
s)

This document is not an API Standard; it is under consideration within an API technical committee but has not received all approvals required to
become an API Standard. It shall not be reproduced or circulated or quoted, in whole or in part, outside of API committee activities except with
the approval of the Chairman of the committee having jurisdiction and API staff.
Copyright API. All rights reserved.
Working Group Draft 47: FEBRUARY 2018 P a g e | 25
Figure D 2 – Example of an Under‐damped I/P Output
Note: The static pressure, on differential pressure digital transmitters with integral upstream static pressure measurement, will have the same pressure as the differential pressure simulated input if the low pressure is open to the atmosphere. Because this value of static pressure may be significantly below the desired static pressure range, three techniques may be used to get the static pressure into a more typical range.
1) Use a fixed value of static pressure.
2) Configure an atmospheric pressure that will result in a desired static pressure. (For example a differential pressure of 80 "H2O is approximately 2.89 psi. Configuring an atmospheric pressure of 500 psi will result in a simulated static pressure of 500 psia to 502.89 psia.)
3) Calibrate the static pressure transmitter to output a static pressure that is a multiple of the simulated pressure. (For example a differential pressure of 80 "H2O is approximately 2.89 psi. Calibrating the static pressure to 100 times the simulated input will result in a simulated static pressure of 0 psi to 289 psia.)
4) It is acceptable to provide the input values for DP as well as Static Pressure from a file with 1 second data if the EFM is capable of importing and using the data points in the file.
D.1.2.3 Expected Results for Static Pressure, and Temperature Calculation Checks
Static pressure and temperature calculations should be checked. If fixed values of pressure and temperature are used their averages should be exact. If live inputs of pressure and temperature are used, their estimated values and expected errors should be calculated the same way as differential pressure.
Note: For static pressure using an exaggerated atmospheric pressure, the static pressure averaging error should be significantly reduced from the differential pressure error. For example a static pressure with an atmospheric pressure of 500 psi and an 80 "H2O simulated differential pressure would have an input range of 500 psi to 502.89 psi and the square wave should have a value of 502.89.
Square Wave Test Measured I/P Output (Under-damped I/P)
-50
0
50
100
150
200
250
300
350
09:00:00 09:07:30 09:15:00 09:22:30 09:30:00 09:37:30 09:45:00 09:52:30 10:00:00
Time
Inc
hes

This document is not an API Standard; it is under consideration within an API technical committee but has not received all approvals required to
become an API Standard. It shall not be reproduced or circulated or quoted, in whole or in part, outside of API committee activities except with
the approval of the Chairman of the committee having jurisdiction and API staff.
Copyright API. All rights reserved.
Working Group Draft 47: FEBRUARY 2018 P a g e | 26
Note: For static pressure using an exaggerated static pressure range, the static pressure average error would be larger than the differential pressure due to the range of the real static pressure and transmitter accuracy limitations.
D.1.2.4 Expected Results for Volume Recalculation Check
D.2 Refer to API MPMS Chapter 21.1 Annex C for an acceptable Correction Methodolgy. It is advisable to test the Host software used for re-calculation purposes to validate re-calculations are performed correctly.Test 2 - Saw Tooth Wave Test
The saw tooth wave should have a minimum input of approximately 10% of calibrated range below the no flow cutoff, a maximum input of approximately 80% of calibrated range and a frequency that results in 3 to 10 even cycles during the one hour accumulation interval.
D.2.1 OBJECTIVE
To test the averaging algorithm under a set of conditions that can be reasonably accurately simulated using an I/P and to test the type of input averaging. (i.e. linear flow time or square root flow time averaging)
Because the value of differential is uniformly increased/decreased between the low differential pressure no flow cutoff and the minimum/maximum differential pressure, these values can be used to estimate the value of the linear or square root averages or estimated using the independent I/P output measurements.
To test the calculation of flow time Flow time can be estimated from the no flow cutoff and the saw tooth maximum and
minimum values.
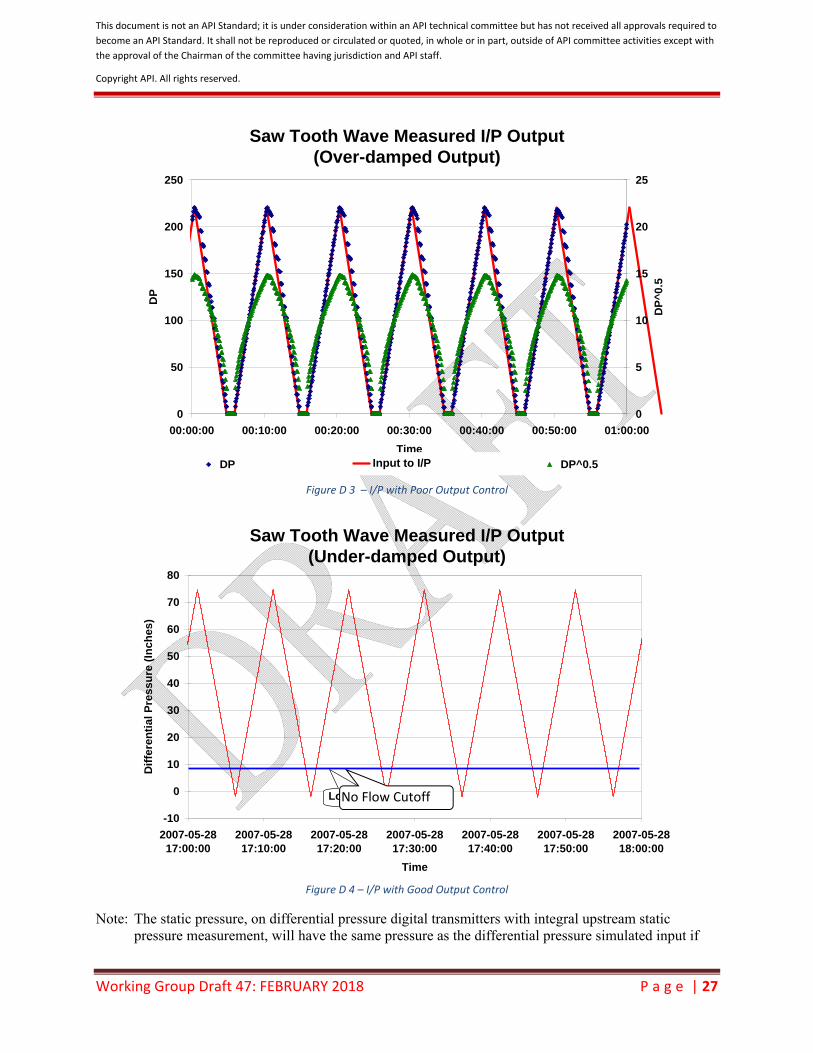
D.2.2 EXAMPLES OF I/P SIMULATED SAW TOOTH OUTPUTS
Two examples of measured I/P outputs are shown below. Figure D3 shows an I/P with poor output control. In this case the independent measurements of the simulated output need to be used to calculate the estimated averages. Figure D4 shows an I/P output with good output control. In this case the averages can be calculated from either the no flow cutoff and the minimum/maximum differential pressure or the independent measurements of the simulated output.
This document is not an API Standard; it is under consideration within an API technical committee but has not received all approvals required to
become an API Standard. It shall not be reproduced or circulated or quoted, in whole or in part, outside of API committee activities except with
the approval of the Chairman of the committee having jurisdiction and API staff.
Copyright API. All rights reserved.
Working Group Draft 47: FEBRUARY 2018 P a g e | 27
Figure D 3 – I/P with Poor Output Control
Figure D 4 – I/P with Good Output Control
Note: The static pressure, on differential pressure digital transmitters with integral upstream static pressure measurement, will have the same pressure as the differential pressure simulated input if
Saw Tooth Wave Measured I/P Output (Under-damped Output)
-10
0
10
20
30
40
50
60
70
80
2007-05-2817:00:00
2007-05-2817:10:00
2007-05-2817:20:00
2007-05-2817:30:00
2007-05-2817:40:00
2007-05-2817:50:00
2007-05-2818:00:00
Time
Dif
fere
nti
al
Pre
ssu
re (
Inc
hes
)
Low DP Cut-off
Saw Tooth Wave Measured I/P Output (Over-damped Output)
0
50
100
150
200
250
00:00:00 00:10:00 00:20:00 00:30:00 00:40:00 00:50:00 01:00:00
Time
DP
0
5
10
15
20
25
DP
^0
.5
DP Inut to I/P DP^0.5Input to I/P
No Flow Cutoff

This document is not an API Standard; it is under consideration within an API technical committee but has not received all approvals required to
become an API Standard. It shall not be reproduced or circulated or quoted, in whole or in part, outside of API committee activities except with
the approval of the Chairman of the committee having jurisdiction and API staff.
Copyright API. All rights reserved.
Working Group Draft 47: FEBRUARY 2018 P a g e | 28
the low pressure is open to the atmosphere. Because this value of static pressure may be significantly below the desired static pressure range, three techniques may be used to get the static pressure into a more typical range.
1) Use a fixed value of static pressure.
2) Configure an atmospheric pressure that will result in a desired static pressure. (For example a differential pressure of 80 "H2O is approximately 2.89 psi. Configuring an atmospheric pressure of 500 psi will result in a simulated static pressure of 500 psia to 502.89 psia.)
3) Configure the static pressure transmitter to output a static pressure that is a multiple of the simulated pressure. (For example a differential pressure of 80 "H2O is approximately 2.89 psi. Configuring the static pressure to 100 times the simulated input will result in a simulated static pressure of 0 psi to 289 psia.)
4) It is acceptable to provide the input values for DP as well as Static Pressure from a file with 1 second data if the EFM is capable of importing and using the data points in the file.
D.2.3 EXPECTED RESULTS
D.2.3.1 Expected Results for Averages and Flow Time Calculations
Similar flow time and average/integral value calculations to those calculated for the square wave test are expected.
Note: The one exception will be pressure averages if the static pressure is configured to a multiple of the actual static pressure. The difference is an indication of transmitter accuracy limitations, not flow computer averaging algorithm problems.
D.2.3.2 Expected Results for Volume Recalculation
Similar flow volume recalculation results to those calculated for the square wave test are expected.
Note: The one exception will be if the static pressure is configured to a multiple of the actual static pressure. This will cause additional differences to be introduced due to changing pressure in the compressibility calculations for each integral value period versus using the hourly average pressure to calculate compressibility in the one hour recalculation.
D.3 Why Use Simulated Inputs That Repeat an Integer Number of times for the Hour or Comparison Period?
By using simulated inputs that repeat an integer number of times during the comparison period, time differences between the averages calculated by the flow computer and the estimates/measurements are minimized. This can be demonstrated by exaggerating the off-set in the differential pressure trends that are used in independent and flow computer averaging algorithm processes. Figure D5 shows the differential pressure trend starting 5 minutes later that the flow computer. Notice the highlighted last five minutes of the trend on the late trend on the left and the highlighted first five of the trend on the right. The highlighted portion of the graphs in Figure D5 are magnified in Figure D6 and demonstrates that the last five minutes of the late trend matches the first five minutes of the on-time trend. Since both algorithms use the same trend from 17:05 to 18:00 and the start and end trends match, the one hour trends processed by both algorithms are the same and the time difference is negated. This compensation effect is independent of time difference as long as the trend multiple is an integer of the comparison interval.

This document is not an API Standard; it is under consideration within an API technical committee but has not received all approvals required to
become an API Standard. It shall not be reproduced or circulated or quoted, in whole or in part, outside of API committee activities except with
the approval of the Chairman of the committee having jurisdiction and API staff.
Copyright API. All rights reserved.
Working Group Draft 47: FEBRUARY 2018 P a g e | 29
Figure D 5– Example of One Hour Differential Pressure Trend with a Five Minute Offset
Figure D 6 – Late Trend Last 5 Minutes Matches First 5 Minutes of the On‐Time Trend
Saw Tooth Wave I/P Output - Flow Computer Time(One Hour DP With 5 Minute Off-set)
-10
0
10
20
30
40
50
60
70
80
2007-05-2817:05:00
2007-05-2817:15:00
2007-05-2817:25:00
2007-05-2817:35:00
2007-05-2817:45:00
2007-05-2817:55:00
2007-05-2818:05:00
Time
Dif
fere
nti
al
Pre
ssu
re (
Inc
hes
)
Low DP Cut-off
Saw Tooth Wave I/P Output - Flow Computer Time(One Hour DP As Seen By the Flow Computer)
-10
0
10
20
30
40
50
60
70
80
2007-05-2817:00:00
2007-05-2817:10:00
2007-05-2817:20:00
2007-05-2817:30:00
2007-05-2817:40:00
2007-05-2817:50:00
2007-05-2818:00:00
Time
Dif
fere
nti
al P
ress
ure
(In
che
s)
Low DP Cut-off
2007-05-2817:55:00
2007-05-2818:05:00
-10
0
10
20
30
40
50
60
70
80
2007-05-2817:00:00
2007-05-2817:10:00
Dif
fere
nti
al P
ress
ure
(In
ches
)