chapter 22 - gripping ifrs icap 2008 (solution of graded questions)
DESCRIPTION
- Gripping IFRS ICAP 2008 (Solution of graded questions)TRANSCRIPT
Solutions to Gripping IFRS : Graded Questions
Statement of cash flows
Kolitz & Sowden-Service, 2009 Chapter 22: Page 1
Solution 22.1 a) Debenture discount is written off against profit before tax, but has no cash flow
implications. Hence, the cash actually received on the issue of the debentures is reflected under financing activities in the year of issue and the amount of debenture discount written off is adjusted for under non-cash items in the notes to the Statement of cash flows every year.
b) As for debenture discount written off, the impairment of goodwill must be added back to
profit before tax as an adjustment for non-cash flow items. c) Deferred tax is a book entry with no cash flow implications. The tax paid amount per the
Statement of cash flows should therefore only consist of the payments made for the year. d) An under-provision of tax in the previous year will have to be made good in the current
year. It is therefore normally included in the payments for the year and must be considered when calculating these payments.
e) The actual cash flow for the year is C2 000. This is therefore the amount that must be
included on the Statement of cash flows.
Solutions to Gripping IFRS : Graded Questions
Statement of cash flows
Kolitz & Sowden-Service, 2009 Chapter 22: Page 2
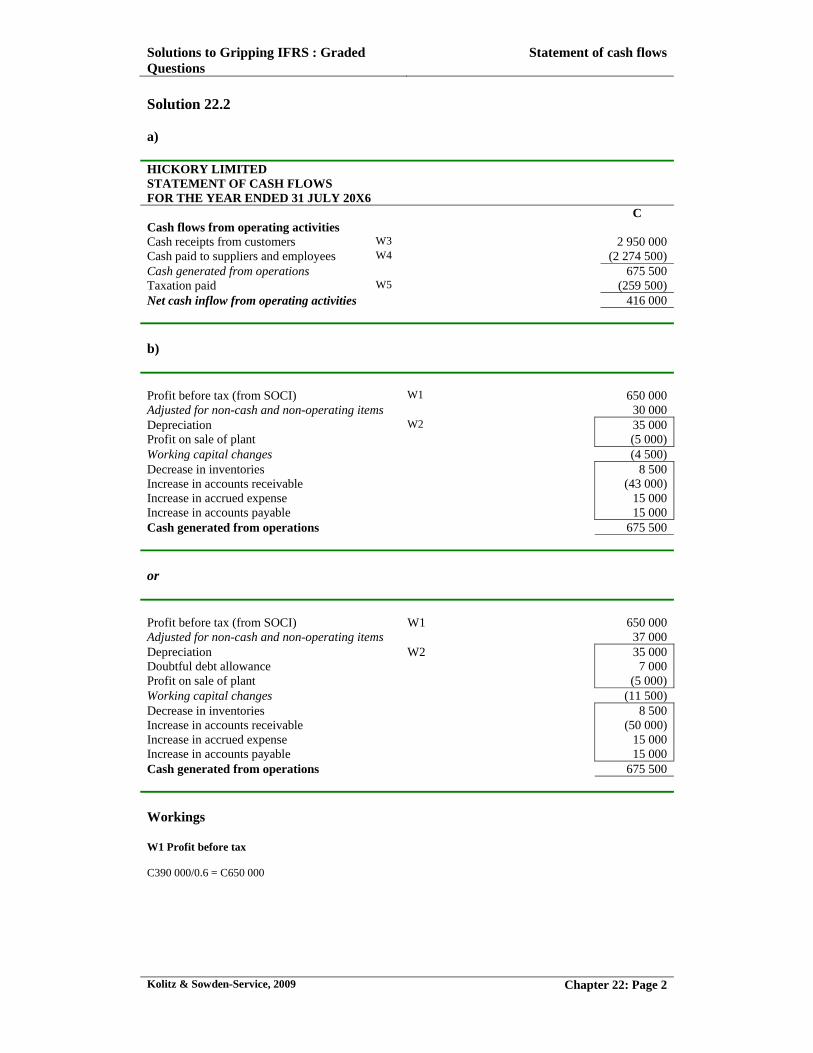
Solution 22.2 a) HICKORY LIMITED STATEMENT OF CASH FLOWS FOR THE YEAR ENDED 31 JULY 20X6 C Cash flows from operating activities Cash receipts from customers W3 2 950 000 Cash paid to suppliers and employees W4 (2 274 500) Cash generated from operations 675 500 Taxation paid W5 (259 500) Net cash inflow from operating activities 416 000
b) Profit before tax (from SOCI) W1 650 000 Adjusted for non-cash and non-operating items 30 000Depreciation W2 35 000Profit on sale of plant (5 000) Working capital changes (4 500) Decrease in inventories 8 500 Increase in accounts receivable (43 000) Increase in accrued expense 15 000 Increase in accounts payable 15 000 Cash generated from operations 675 500
or Profit before tax (from SOCI) W1 650 000 Adjusted for non-cash and non-operating items 37 000Depreciation W2 35 000 Doubtful debt allowance 7 000 Profit on sale of plant (5 000) Working capital changes (11 500) Decrease in inventories 8 500 Increase in accounts receivable (50 000) Increase in accrued expense 15 000 Increase in accounts payable 15 000 Cash generated from operations 675 500
Workings W1 Profit before tax C390 000/0.6 = C650 000
Solutions to Gripping IFRS : Graded Questions
Statement of cash flows
Kolitz & Sowden-Service, 2009 Chapter 22: Page 3
Solution 22.2 continued …
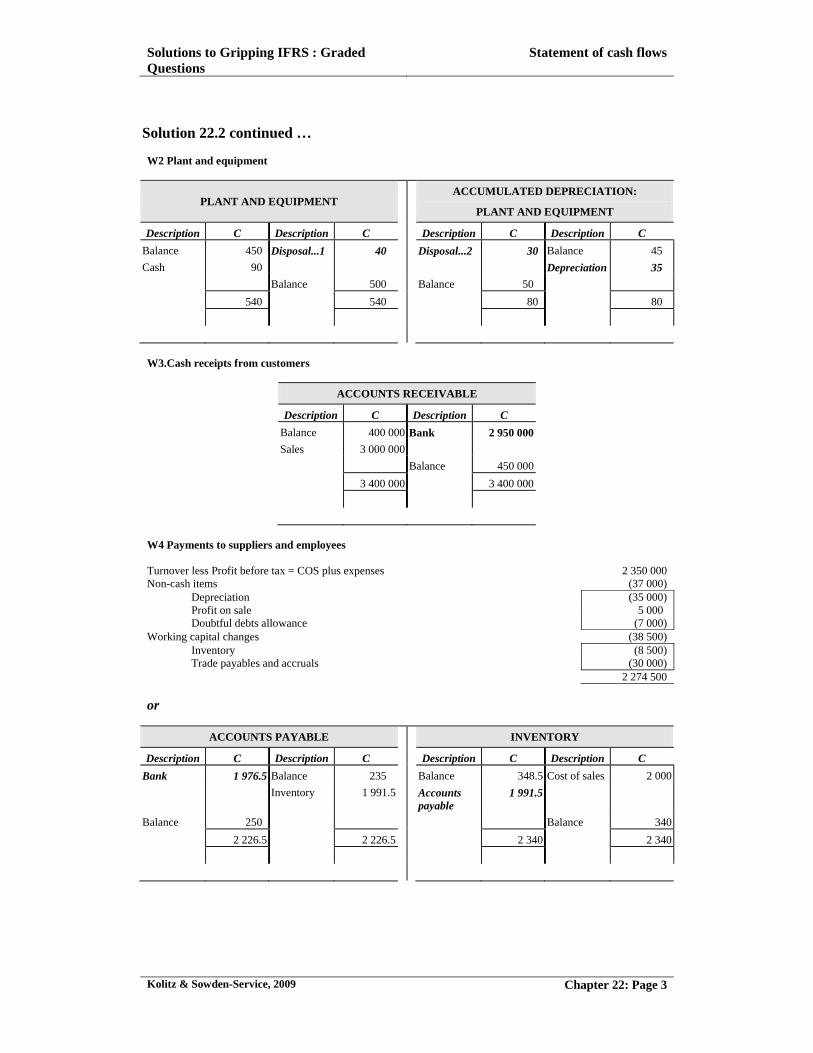
W2 Plant and equipment
PLANT AND EQUIPMENT ACCUMULATED DEPRECIATION:
PLANT AND EQUIPMENT
Description C Description C Description C Description C
Balance 450 Disposal...1 40 Disposal...2 30 Balance 45
Cash 90 Depreciation 35
Balance 500 Balance 50
540 540 80 80
W3.Cash receipts from customers
ACCOUNTS RECEIVABLE
Description C Description C
Balance 400 000 Bank 2 950 000
Sales 3 000 000
Balance 450 000
3 400 000 3 400 000
W4 Payments to suppliers and employees Turnover less Profit before tax = COS plus expenses 2 350 000 Non-cash items (37 000)
Depreciation (35 000) Profit on sale 5 000 Doubtful debts allowance (7 000)
Working capital changes (38 500) Inventory (8 500) Trade payables and accruals (30 000)
2 274 500 or
ACCOUNTS PAYABLE INVENTORY
Description C Description C Description C Description C
Bank 1 976.5 Balance 235 Balance 348.5 Cost of sales 2 000
Inventory 1 991.5 Accounts payable
1 991.5
Balance 250 Balance 340
2 226.5 2 226.5 2 340 2 340
Solutions to Gripping IFRS : Graded Questions
Statement of cash flows
Kolitz & Sowden-Service, 2009 Chapter 22: Page 4
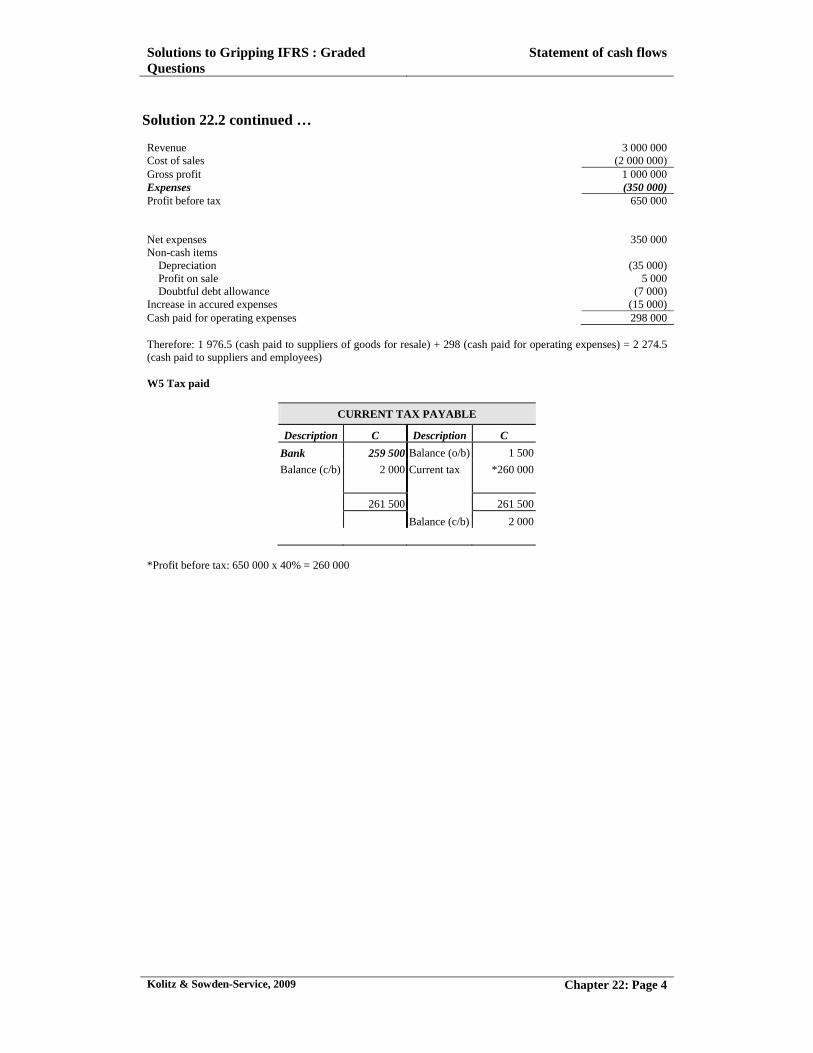
Solution 22.2 continued … Revenue 3 000 000 Cost of sales (2 000 000) Gross profit 1 000 000 Expenses (350 000)Profit before tax 650 000 Net expenses 350 000 Non-cash items
Depreciation (35 000) Profit on sale 5 000Doubtful debt allowance (7 000)
Increase in accured expenses (15 000) Cash paid for operating expenses 298 000 Therefore: 1 976.5 (cash paid to suppliers of goods for resale) + 298 (cash paid for operating expenses) = 2 274.5 (cash paid to suppliers and employees) W5 Tax paid
CURRENT TAX PAYABLE
Description C Description C
Bank 259 500 Balance (o/b) 1 500
Balance (c/b) 2 000 Current tax *260 000
261 500 261 500
Balance (c/b) 2 000
*Profit before tax: 650 000 x 40% = 260 000
Solutions to Gripping IFRS : Graded Questions
Statement of cash flows
Kolitz & Sowden-Service, 2009 Chapter 22: Page 5
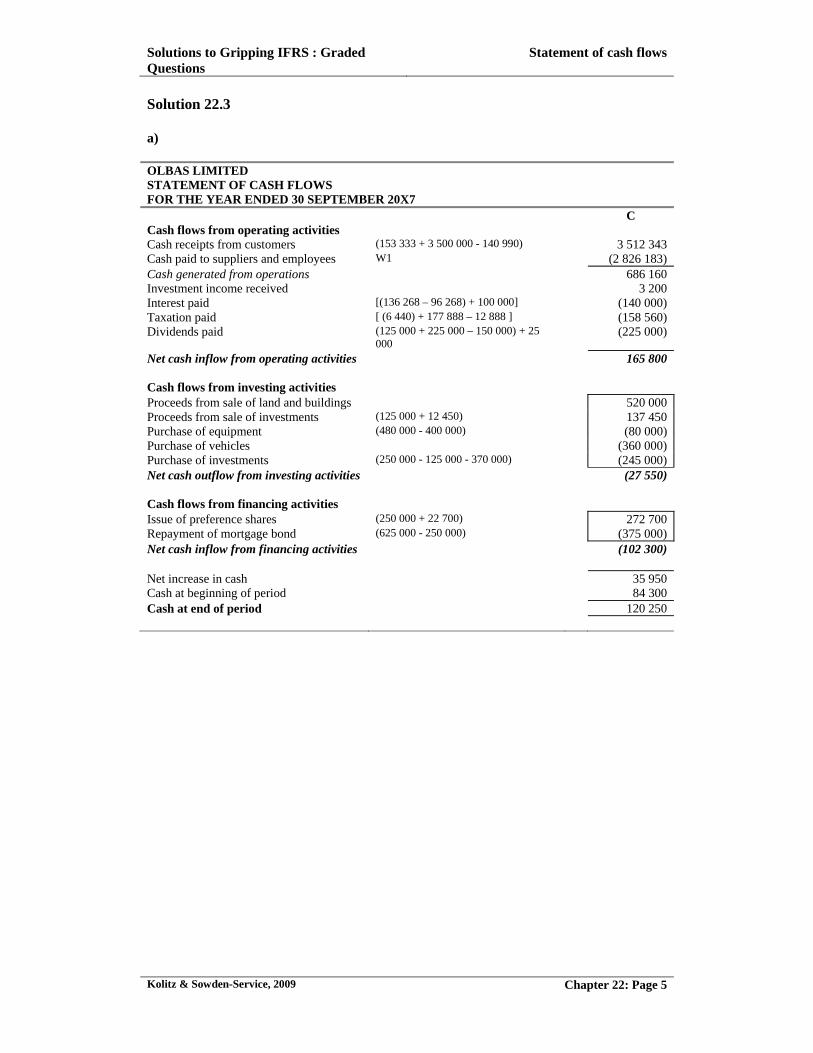
Solution 22.3 a) OLBAS LIMITED STATEMENT OF CASH FLOWS FOR THE YEAR ENDED 30 SEPTEMBER 20X7 C Cash flows from operating activities Cash receipts from customers (153 333 + 3 500 000 - 140 990) 3 512 343 Cash paid to suppliers and employees W1 (2 826 183) Cash generated from operations 686 160Investment income received 3 200 Interest paid [(136 268 – 96 268) + 100 000] (140 000) Taxation paid [ (6 440) + 177 888 – 12 888 ] (158 560)Dividends paid (125 000 + 225 000 – 150 000) + 25
000 (225 000)
Net cash inflow from operating activities 165 800 Cash flows from investing activities Proceeds from sale of land and buildings 520 000 Proceeds from sale of investments (125 000 + 12 450) 137 450 Purchase of equipment (480 000 - 400 000) (80 000) Purchase of vehicles (360 000) Purchase of investments (250 000 - 125 000 - 370 000) (245 000) Net cash outflow from investing activities (27 550) Cash flows from financing activities Issue of preference shares (250 000 + 22 700) 272 700 Repayment of mortgage bond (625 000 - 250 000) (375 000) Net cash inflow from financing activities (102 300) Net increase in cash 35 950Cash at beginning of period 84 300 Cash at end of period 120 250
Solutions to Gripping IFRS : Graded Questions
Statement of cash flows
Kolitz & Sowden-Service, 2009 Chapter 22: Page 6
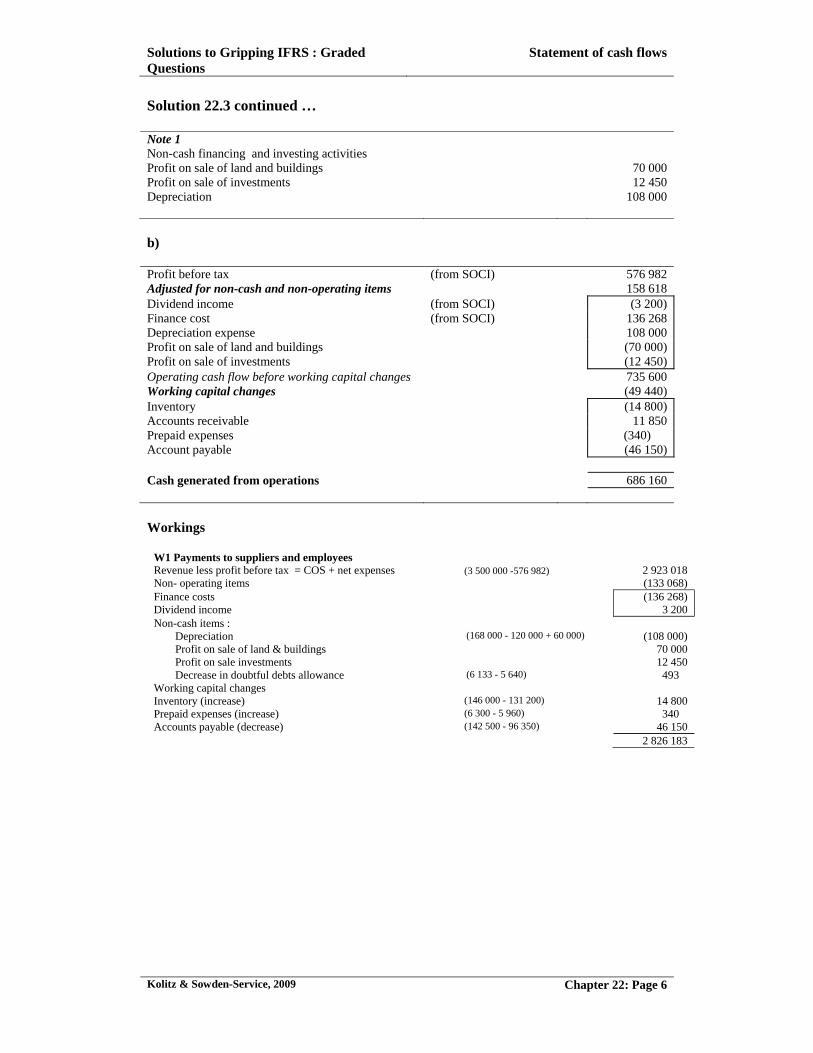
Solution 22.3 continued … Note 1 Non-cash financing and investing activities Profit on sale of land and buildings 70 000 Profit on sale of investments 12 450 Depreciation 108 000 b) Profit before tax (from SOCI) 576 982 Adjusted for non-cash and non-operating items 158 618 Dividend income (from SOCI) (3 200) Finance cost (from SOCI) 136 268 Depreciation expense 108 000 Profit on sale of land and buildings (70 000) Profit on sale of investments (12 450)Operating cash flow before working capital changes 735 600 Working capital changes (49 440) Inventory (14 800) Accounts receivable 11 850 Prepaid expenses (340) Account payable (46 150) Cash generated from operations 686 160 Workings
W1 Payments to suppliers and employees Revenue less profit before tax = COS + net expenses (3 500 000 -576 982) 2 923 018 Non- operating items (133 068) Finance costs (136 268) Dividend income 3 200 Non-cash items :
Depreciation (168 000 - 120 000 + 60 000) (108 000) Profit on sale of land & buildings 70 000 Profit on sale investments 12 450 Decrease in doubtful debts allowance (6 133 - 5 640) 493
Working capital changes Inventory (increase) (146 000 - 131 200) 14 800Prepaid expenses (increase) (6 300 - 5 960) 340 Accounts payable (decrease) (142 500 - 96 350) 46 150 2 826 183
Solutions to Gripping IFRS : Graded Questions
Statement of cash flows
Kolitz & Sowden-Service, 2009 Chapter 22: Page 7
Solution 22.3 continued …
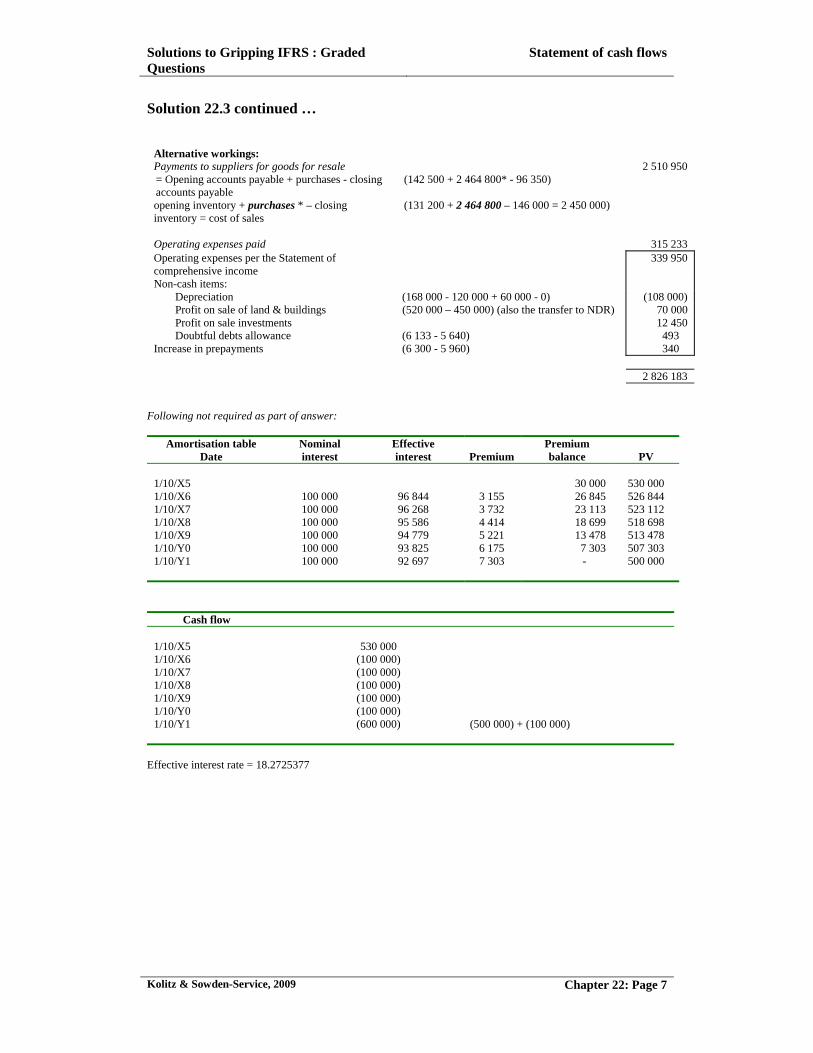
Alternative workings: Payments to suppliers for goods for resale 2 510 950 = Opening accounts payable + purchases - closing accounts payable
(142 500 + 2 464 800* - 96 350)
opening inventory + purchases * – closing inventory = cost of sales
(131 200 + 2 464 800 – 146 000 = 2 450 000)
Operating expenses paid 315 233 Operating expenses per the Statement of comprehensive income
339 950
Non-cash items: Depreciation (168 000 - 120 000 + 60 000 - 0) (108 000) Profit on sale of land & buildings (520 000 – 450 000) (also the transfer to NDR) 70 000 Profit on sale investments 12 450Doubtful debts allowance (6 133 - 5 640) 493
Increase in prepayments (6 300 - 5 960) 340 2 826 183
Following not required as part of answer:
Amortisation table Date
Nominal interest
Effective interest Premium
Premium balance PV
1/10/X5 30 000 530 000 1/10/X6 100 000 96 844 3 155 26 845 526 844 1/10/X7 100 000 96 268 3 732 23 113 523 112 1/10/X8 100 000 95 586 4 414 18 699 518 698 1/10/X9 100 000 94 779 5 221 13 478 513 478 1/10/Y0 100 000 93 825 6 175 7 303 507 303 1/10/Y1 100 000 92 697 7 303 - 500 000
Cash flow 1/10/X5 530 0001/10/X6 (100 000) 1/10/X7 (100 000) 1/10/X8 (100 000) 1/10/X9 (100 000) 1/10/Y0 (100 000) 1/10/Y1 (600 000) (500 000) + (100 000)
Effective interest rate = 18.2725377
Solutions to Gripping IFRS : Graded Questions
Statement of cash flows
Kolitz & Sowden-Service, 2009 Chapter 22: Page 8
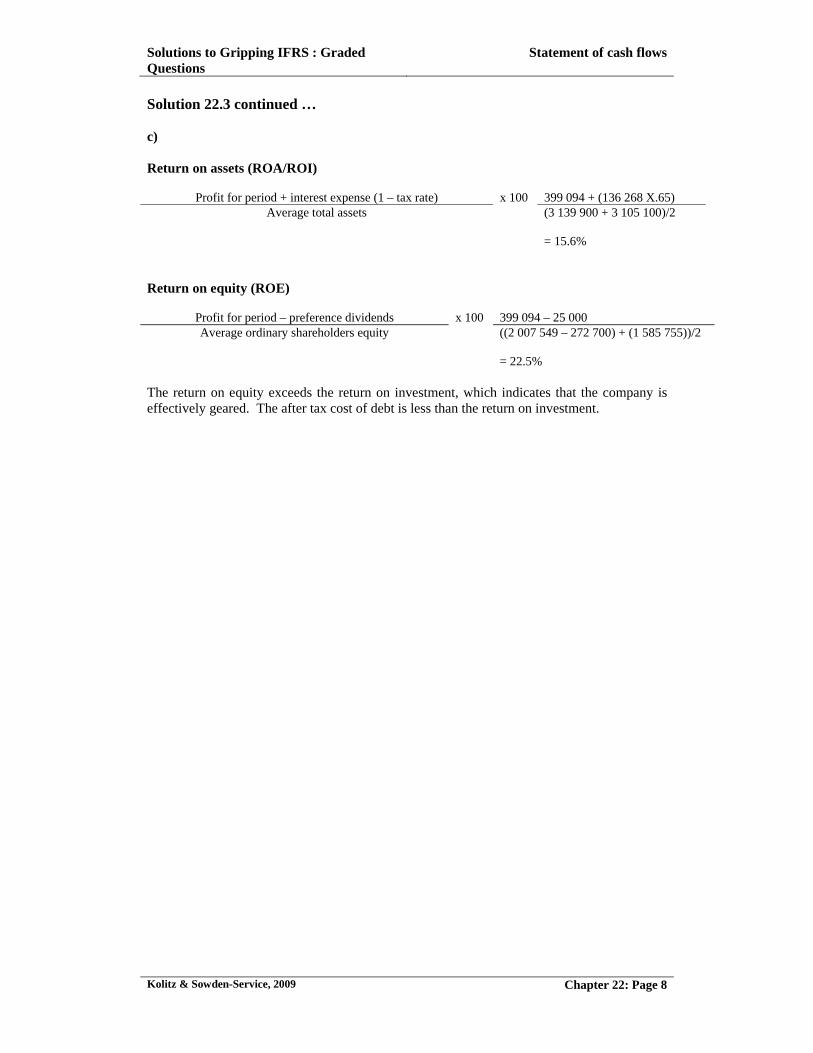
Solution 22.3 continued … c) Return on assets (ROA/ROI)
Profit for period + interest expense (1 – tax rate) x 100 399 094 + (136 268 X.65) Average total assets (3 139 900 + 3 105 100)/2
= 15.6% Return on equity (ROE)
Profit for period – preference dividends x 100 399 094 – 25 000 Average ordinary shareholders equity ((2 007 549 – 272 700) + (1 585 755))/2
= 22.5% The return on equity exceeds the return on investment, which indicates that the company is effectively geared. The after tax cost of debt is less than the return on investment.
Solutions to Gripping IFRS : Graded Questions
Statement of cash flows
Kolitz & Sowden-Service, 2009 Chapter 22: Page 9
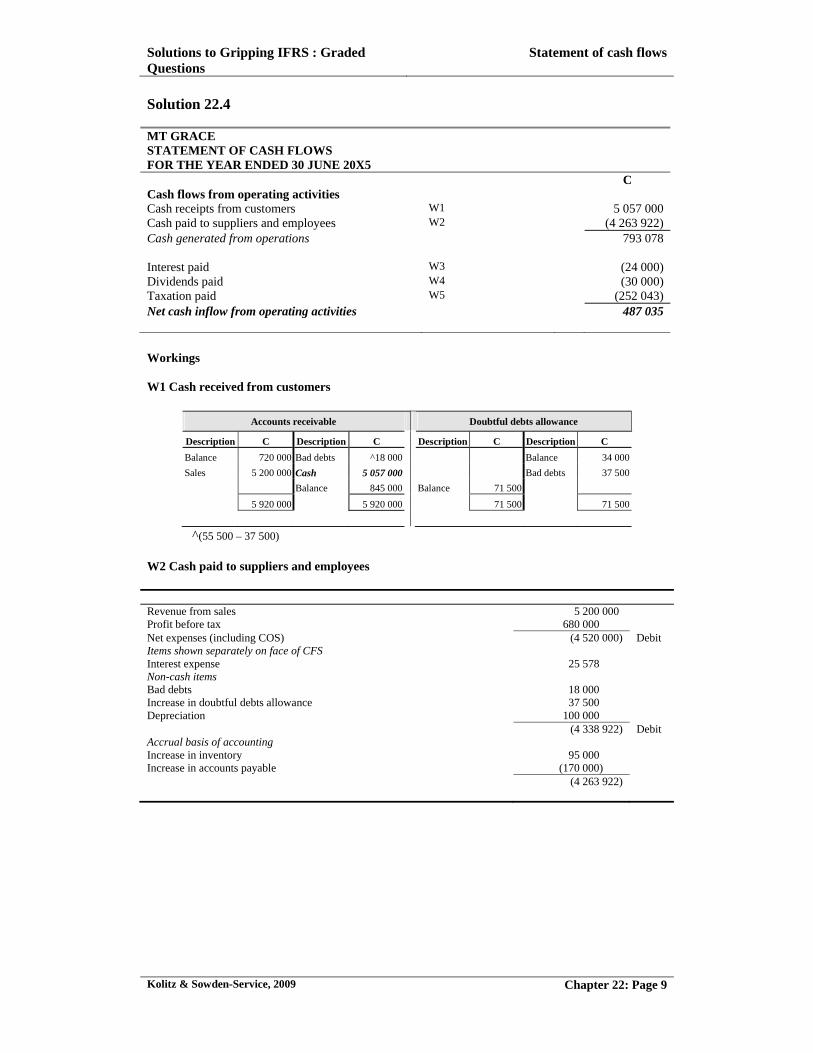
Solution 22.4 MT GRACE STATEMENT OF CASH FLOWS FOR THE YEAR ENDED 30 JUNE 20X5 C Cash flows from operating activities Cash receipts from customers W1 5 057 000 Cash paid to suppliers and employees W2 (4 263 922) Cash generated from operations 793 078 Interest paid W3 (24 000) Dividends paid W4 (30 000) Taxation paid W5 (252 043) Net cash inflow from operating activities 487 035 Workings W1 Cash received from customers
Accounts receivable Doubtful debts allowance
Description C Description C Description C Description C
Balance 720 000 Bad debts ^18 000 Balance 34 000
Sales 5 200 000 Cash 5 057 000 Bad debts 37 500
Balance 845 000 Balance 71 500
5 920 000 5 920 000 71 500 71 500
^(55 500 – 37 500) W2 Cash paid to suppliers and employees Revenue from sales 5 200 000 Profit before tax 680 000 Net expenses (including COS) (4 520 000) Debit Items shown separately on face of CFS Interest expense 25 578 Non-cash items Bad debts 18 000 Increase in doubtful debts allowance 37 500 Depreciation 100 000 (4 338 922) Debit Accrual basis of accounting Increase in inventory 95 000 Increase in accounts payable (170 000) (4 263 922)
Solutions to Gripping IFRS : Graded Questions
Statement of cash flows
Kolitz & Sowden-Service, 2009 Chapter 22: Page 10
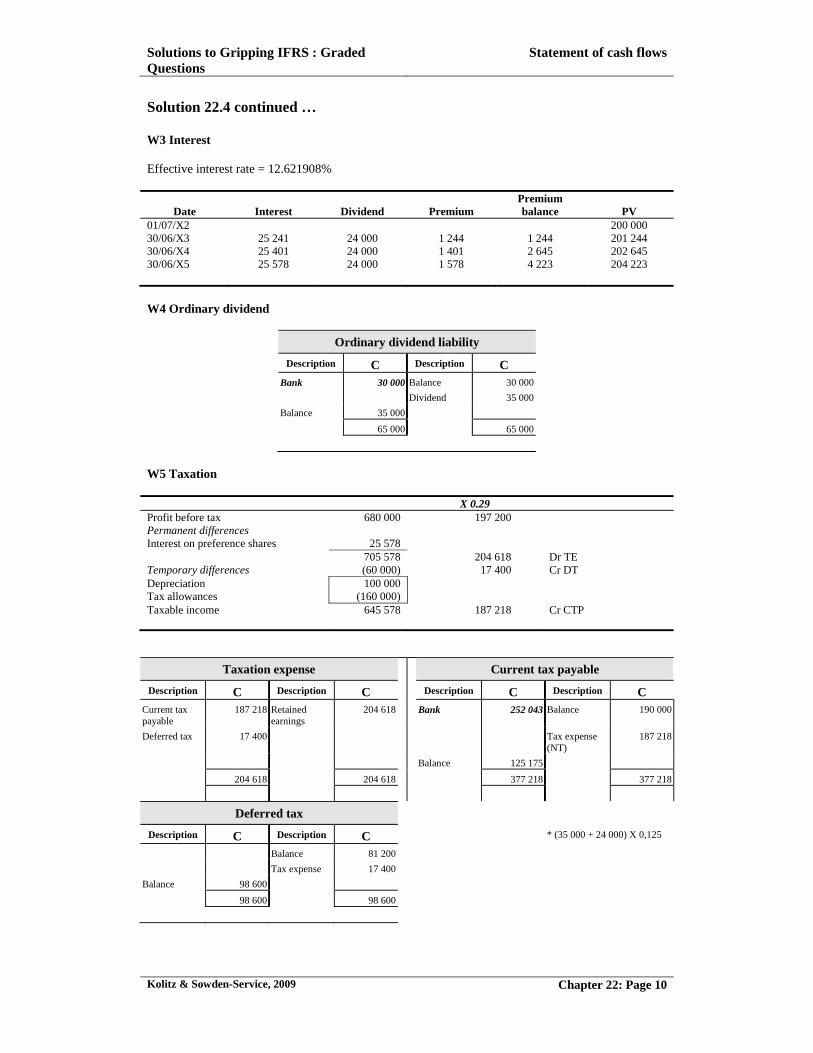
Solution 22.4 continued … W3 Interest Effective interest rate = 12.621908%
Date Interest Dividend Premium Premium balance PV
01/07/X2 200 000 30/06/X3 25 241 24 000 1 244 1 244 201 244 30/06/X4 25 401 24 000 1 401 2 645 202 645 30/06/X5 25 578 24 000 1 578 4 223 204 223 W4 Ordinary dividend
Ordinary dividend liability
Description C Description C Bank 30 000 Balance 30 000
Dividend 35 000
Balance 35 000
65 000 65 000
W5 Taxation
X 0.29 Profit before tax 680 000 197 200 Permanent differences Interest on preference shares 25 578 705 578 204 618 Dr TE Temporary differences (60 000) 17 400 Cr DT Depreciation 100 000 Tax allowances (160 000) Taxable income 645 578 187 218 Cr CTP
Taxation expense Current tax payable
Description C Description C Description C Description C Current tax payable
187 218 Retained earnings
204 618 Bank 252 043 Balance 190 000
Deferred tax 17 400 Tax expense (NT)
187 218
Balance 125 175
204 618 204 618 377 218 377 218
Deferred tax
Description C Description C * (35 000 + 24 000) X 0,125
Balance 81 200
Tax expense 17 400
Balance 98 600
98 600 98 600
Solutions to Gripping IFRS : Graded Questions
Statement of cash flows
Kolitz & Sowden-Service, 2009 Chapter 22: Page 11
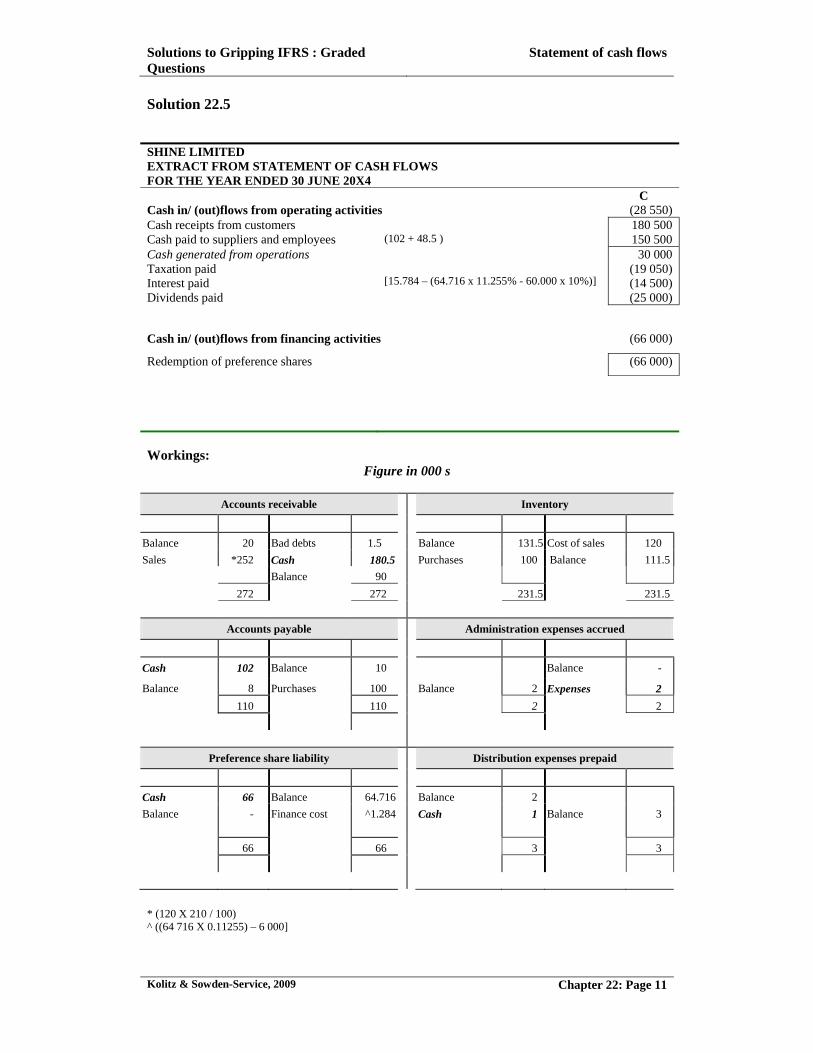
Solution 22.5 SHINE LIMITED EXTRACT FROM STATEMENT OF CASH FLOWS FOR THE YEAR ENDED 30 JUNE 20X4 C Cash in/ (out)flows from operating activities (28 550) Cash receipts from customers 180 500 Cash paid to suppliers and employees (102 + 48.5 ) 150 500 Cash generated from operations 30 000 Taxation paid Interest paid Dividends paid
[15.784 – (64.716 x 11.255% - 60.000 x 10%)]
(19 050) (14 500) (25 000)
Cash in/ (out)flows from financing activities (66 000)
Redemption of preference shares (66 000)
Workings: Figure in 000 s
Accounts receivable Inventory
Balance 20 Bad debts 1.5 Balance 131.5 Cost of sales 120
Sales *252 Cash 180.5 Purchases 100 Balance 111.5
Balance 90
272 272 231.5 231.5
Accounts payable Administration expenses accrued
Cash 102 Balance 10 Balance -
Balance 8 Purchases 100 Balance 2 Expenses 2
110 110 2 2
Preference share liability Distribution expenses prepaid
Cash 66 Balance 64.716 Balance 2
Balance - Finance cost
^1.284 Cash 1 Balance 3
66 66 3 3
* (120 X 210 / 100) ^ ((64 716 X 0.11255) – 6 000]
Solutions to Gripping IFRS : Graded Questions
Statement of cash flows
Kolitz & Sowden-Service, 2009 Chapter 22: Page 12
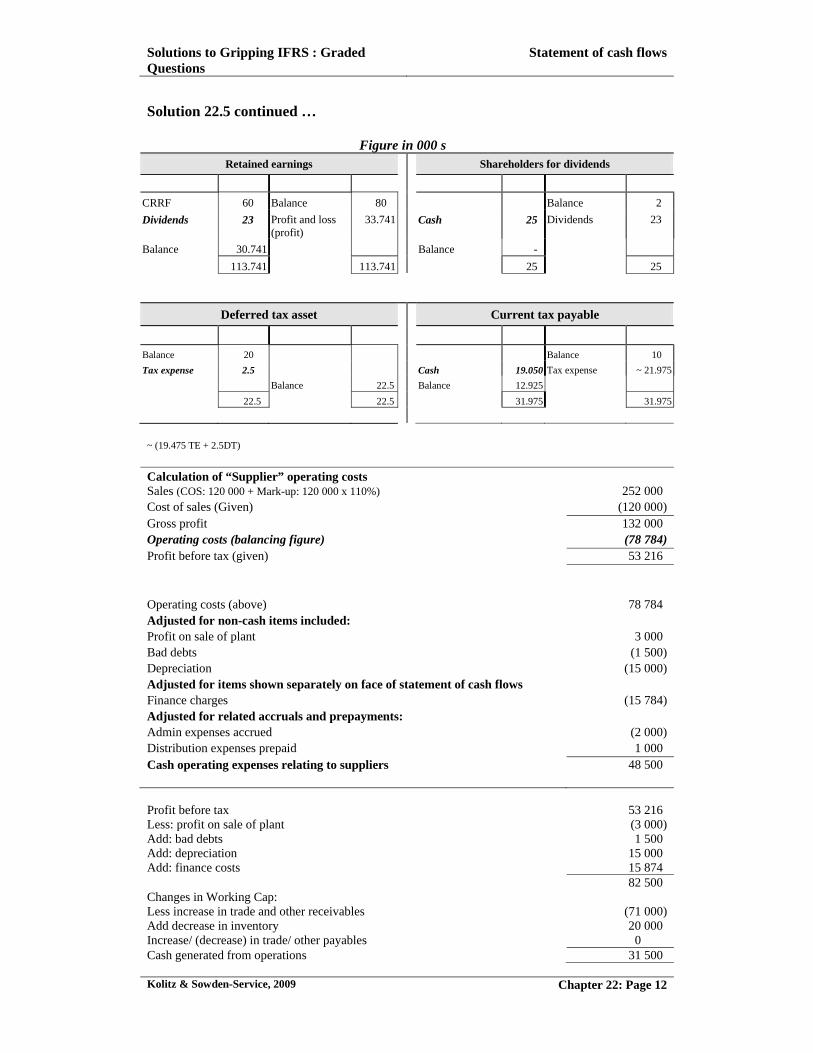
Solution 22.5 continued … Figure in 000 s
Retained earnings Shareholders for dividends
CRRF 60 Balance 80 Balance 2
Dividends 23 Profit and loss (profit)
33.741 Cash 25 Dividends 23
Balance 30.741 Balance -
113.741 113.741 25 25
Deferred tax asset Current tax payable
Balance 20 Balance 10
Tax expense 2.5 Cash 19.050 Tax expense ~ 21.975
Balance 22.5 Balance 12.925
22.5 22.5 31.975 31.975
~ (19.475 TE + 2.5DT) Calculation of “Supplier” operating costs Sales (COS: 120 000 + Mark-up: 120 000 x 110%) 252 000 Cost of sales (Given) (120 000) Gross profit 132 000 Operating costs (balancing figure) (78 784) Profit before tax (given) 53 216 Operating costs (above) 78 784 Adjusted for non-cash items included: Profit on sale of plant 3 000 Bad debts (1 500) Depreciation (15 000) Adjusted for items shown separately on face of statement of cash flows Finance charges (15 784) Adjusted for related accruals and prepayments: Admin expenses accrued (2 000) Distribution expenses prepaid 1 000 Cash operating expenses relating to suppliers 48 500 Profit before tax 53 216 Less: profit on sale of plant (3 000) Add: bad debts 1 500 Add: depreciation 15 000 Add: finance costs 15 874 82 500 Changes in Working Cap: Less increase in trade and other receivables (71 000) Add decrease in inventory 20 000 Increase/ (decrease) in trade/ other payables 0 Cash generated from operations 31 500
Solutions to Gripping IFRS : Graded Questions
Statement of cash flows
Kolitz & Sowden-Service, 2009 Chapter 22: Page 13
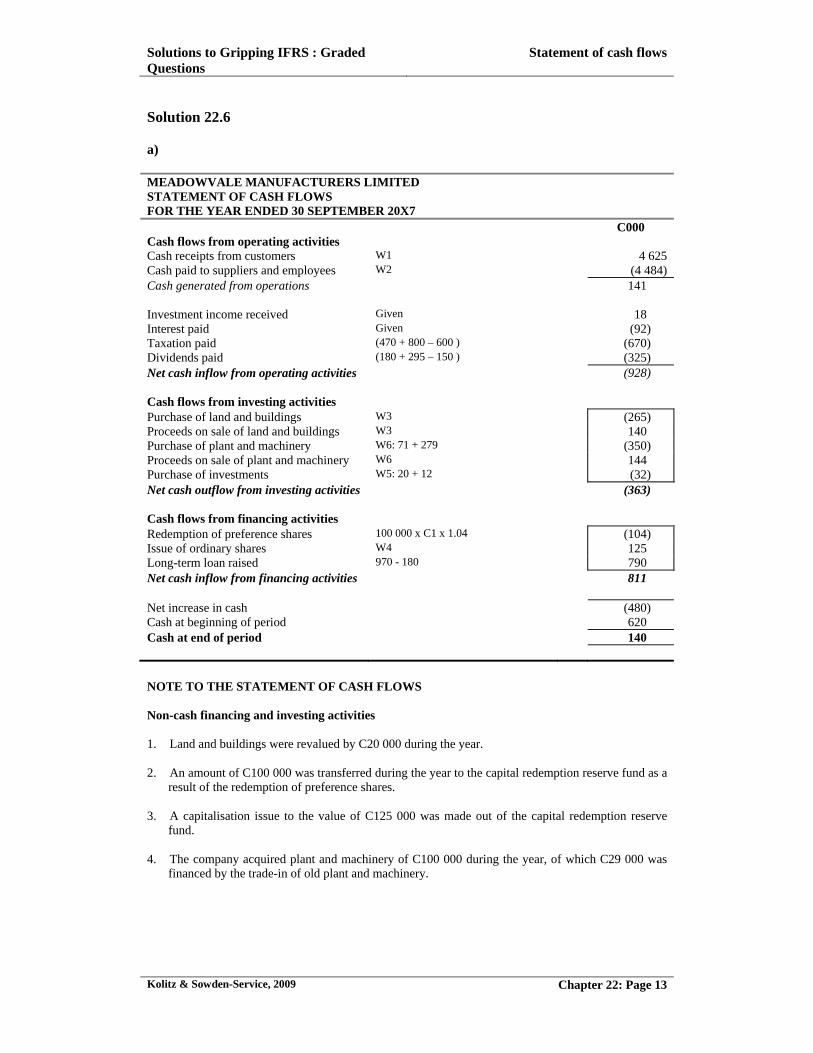
Solution 22.6 a) MEADOWVALE MANUFACTURERS LIMITED STATEMENT OF CASH FLOWS FOR THE YEAR ENDED 30 SEPTEMBER 20X7 C000 Cash flows from operating activities Cash receipts from customers W1 4 625 Cash paid to suppliers and employees W2 (4 484)Cash generated from operations 141 Investment income received Given 18 Interest paid Given (92) Taxation paid (470 + 800 – 600 ) (670) Dividends paid (180 + 295 – 150 ) (325) Net cash inflow from operating activities (928) Cash flows from investing activities Purchase of land and buildings W3 (265) Proceeds on sale of land and buildings W3 140 Purchase of plant and machinery W6: 71 + 279 (350) Proceeds on sale of plant and machinery W6 144 Purchase of investments W5: 20 + 12 (32) Net cash outflow from investing activities (363) Cash flows from financing activities Redemption of preference shares 100 000 x C1 x 1.04 (104) Issue of ordinary shares W4 125 Long-term loan raised 970 - 180 790 Net cash inflow from financing activities 811 Net increase in cash (480) Cash at beginning of period 620 Cash at end of period 140
NOTE TO THE STATEMENT OF CASH FLOWS Non-cash financing and investing activities 1. Land and buildings were revalued by C20 000 during the year. 2. An amount of C100 000 was transferred during the year to the capital redemption reserve fund as a
result of the redemption of preference shares. 3. A capitalisation issue to the value of C125 000 was made out of the capital redemption reserve
fund. 4. The company acquired plant and machinery of C100 000 during the year, of which C29 000 was
financed by the trade-in of old plant and machinery.
Solutions to Gripping IFRS : Graded Questions
Statement of cash flows
Kolitz & Sowden-Service, 2009 Chapter 22: Page 14
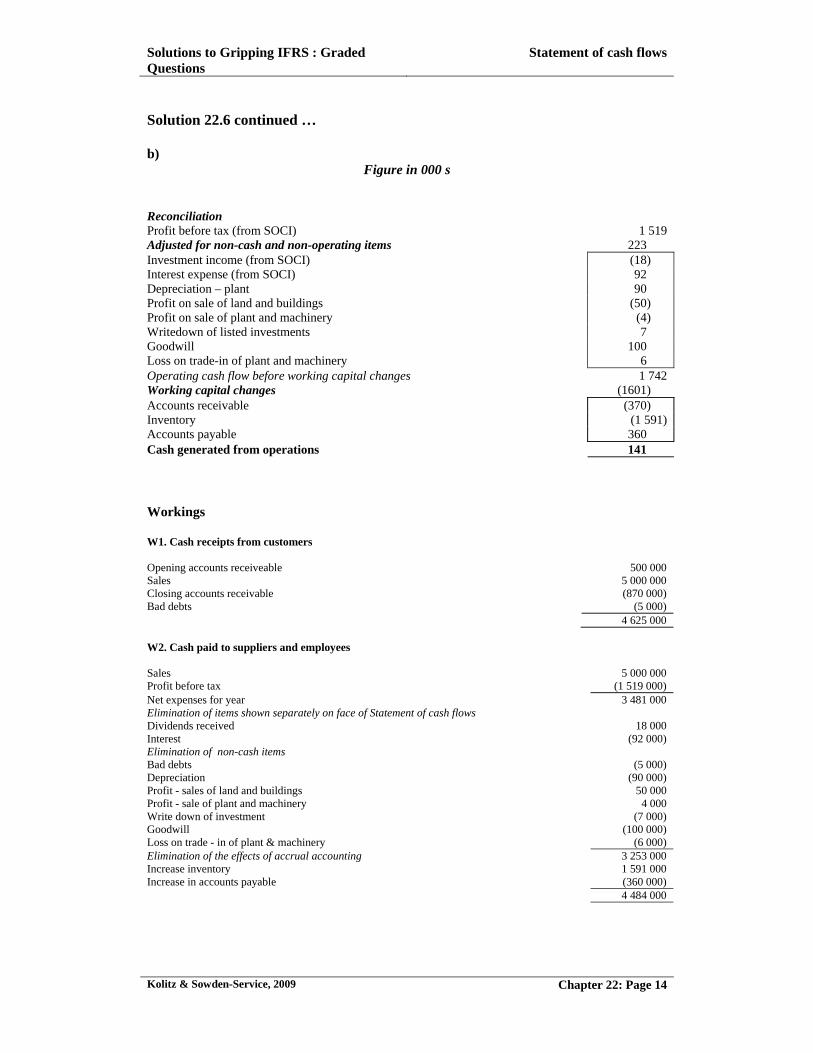
Solution 22.6 continued … b)
Figure in 000 s Reconciliation Profit before tax (from SOCI) 1 519 Adjusted for non-cash and non-operating items 223 Investment income (from SOCI) (18) Interest expense (from SOCI) 92 Depreciation – plant 90 Profit on sale of land and buildings (50) Profit on sale of plant and machinery (4) Writedown of listed investments 7 Goodwill 100 Loss on trade-in of plant and machinery 6 Operating cash flow before working capital changes 1 742Working capital changes (1601) Accounts receivable (370) Inventory (1 591) Accounts payable 360 Cash generated from operations 141 Workings W1. Cash receipts from customers Opening accounts receiveable 500 000 Sales 5 000 000 Closing accounts receivable (870 000) Bad debts (5 000) 4 625 000 W2. Cash paid to suppliers and employees Sales 5 000 000Profit before tax (1 519 000) Net expenses for year 3 481 000 Elimination of items shown separately on face of Statement of cash flows Dividends received 18 000 Interest (92 000) Elimination of non-cash items Bad debts (5 000) Depreciation (90 000) Profit - sales of land and buildings 50 000 Profit - sale of plant and machinery 4 000 Write down of investment (7 000)Goodwill (100 000) Loss on trade - in of plant & machinery (6 000) Elimination of the effects of accrual accounting 3 253 000 Increase inventory 1 591 000 Increase in accounts payable (360 000) 4 484 000
Solutions to Gripping IFRS : Graded Questions
Statement of cash flows
Kolitz & Sowden-Service, 2009 Chapter 22: Page 15
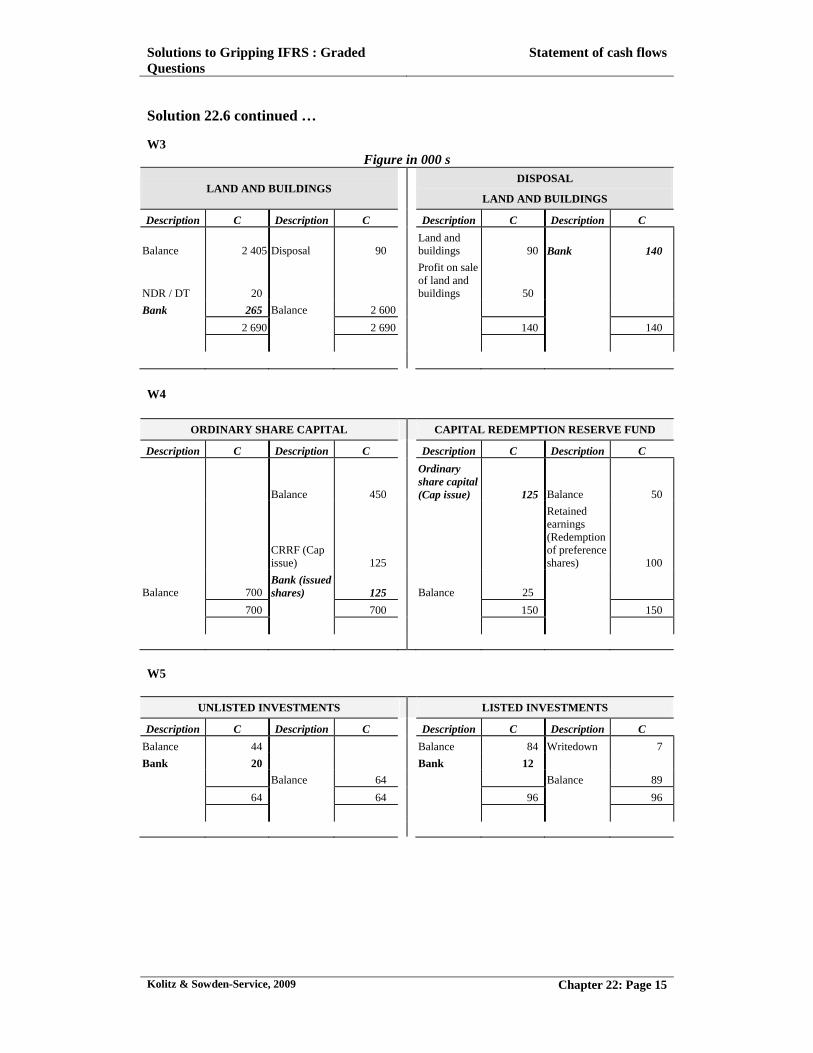
Solution 22.6 continued … W3
Figure in 000 s
LAND AND BUILDINGS DISPOSAL
LAND AND BUILDINGS
Description C Description C Description C Description C
Balance 2 405 Disposal 90 Land and buildings 90 Bank 140
NDR / DT 20
Profit on sale of land and buildings 50
Bank 265 Balance 2 600
2 690 2 690 140 140
W4
ORDINARY SHARE CAPITAL CAPITAL REDEMPTION RESERVE FUND
Description C Description C Description C Description C
Balance 450
Ordinary share capital (Cap issue) 125 Balance 50
CRRF (Cap issue) 125
Retained earnings (Redemption of preference shares) 100
Balance 700 Bank (issued shares) 125 Balance 25
700 700 150 150
W5
UNLISTED INVESTMENTS LISTED INVESTMENTS
Description C Description C Description C Description C
Balance 44 Balance 84 Writedown 7
Bank 20 Bank 12
Balance 64 Balance 89
64 64 96 96
Solutions to Gripping IFRS : Graded Questions
Statement of cash flows
Kolitz & Sowden-Service, 2009 Chapter 22: Page 16
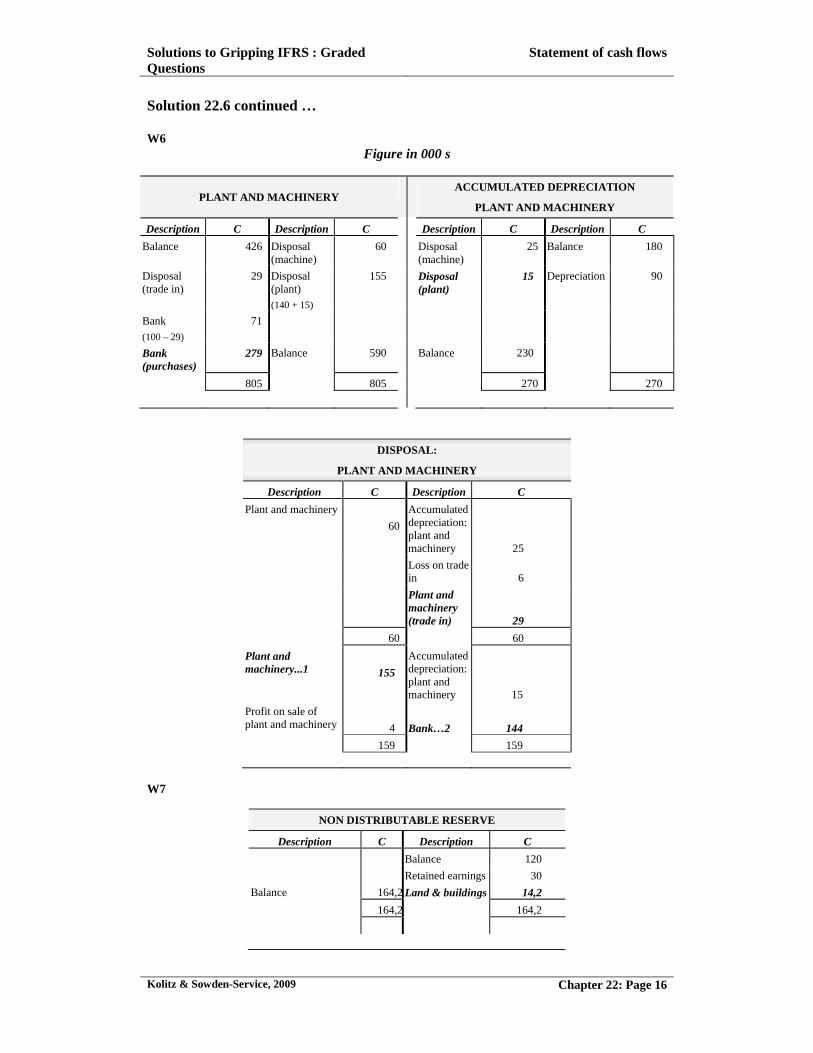
Solution 22.6 continued … W6
Figure in 000 s
PLANT AND MACHINERY ACCUMULATED DEPRECIATION
PLANT AND MACHINERY
Description C Description C Description C Description C
Balance 426 Disposal (machine)
60 Disposal (machine)
25 Balance 180
Disposal (trade in)
29 Disposal (plant) (140 + 15)
155 Disposal (plant)
15 Depreciation 90
Bank
(100 – 29)
71
Bank (purchases)
279 Balance 590 Balance 230
805 805 270 270
DISPOSAL:
PLANT AND MACHINERY
Description C Description C
Plant and machinery
60
Accumulated depreciation: plant and machinery 25
Loss on trade in 6
Plant and machinery (trade in) 29
60 60
Plant and machinery...1
155
Accumulated depreciation: plant and machinery 15
Profit on sale of plant and machinery
4 Bank…2 144
159 159
W7
NON DISTRIBUTABLE RESERVE
Description C Description C
Balance 120
Retained earnings 30
Balance 164,2 Land & buildings 14,2
164,2 164,2
Solutions to Gripping IFRS : Graded Questions
Statement of cash flows
Kolitz & Sowden-Service, 2009 Chapter 22: Page 17
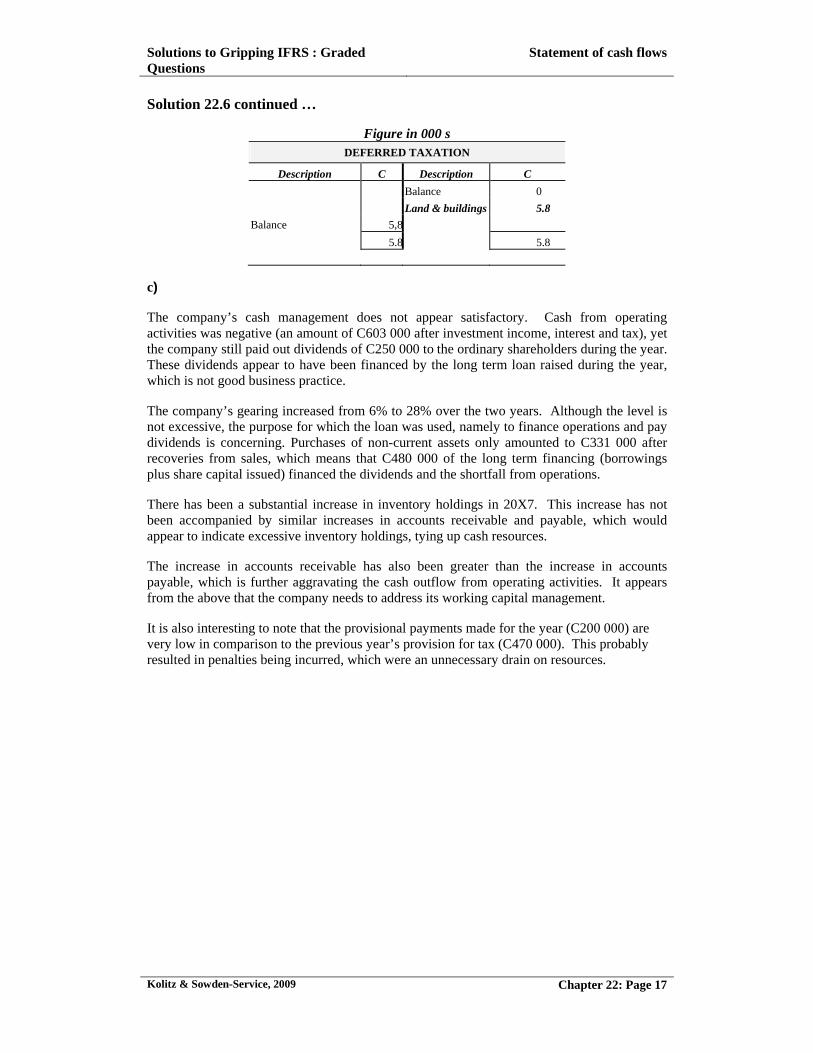
Solution 22.6 continued …
Figure in 000 s DEFERRED TAXATION
Description C Description C
Balance 0
Land & buildings 5.8
Balance 5,8
5.8 5.8
c) The company’s cash management does not appear satisfactory. Cash from operating activities was negative (an amount of C603 000 after investment income, interest and tax), yet the company still paid out dividends of C250 000 to the ordinary shareholders during the year. These dividends appear to have been financed by the long term loan raised during the year, which is not good business practice. The company’s gearing increased from 6% to 28% over the two years. Although the level is not excessive, the purpose for which the loan was used, namely to finance operations and pay dividends is concerning. Purchases of non-current assets only amounted to C331 000 after recoveries from sales, which means that C480 000 of the long term financing (borrowings plus share capital issued) financed the dividends and the shortfall from operations. There has been a substantial increase in inventory holdings in 20X7. This increase has not been accompanied by similar increases in accounts receivable and payable, which would appear to indicate excessive inventory holdings, tying up cash resources. The increase in accounts receivable has also been greater than the increase in accounts payable, which is further aggravating the cash outflow from operating activities. It appears from the above that the company needs to address its working capital management. It is also interesting to note that the provisional payments made for the year (C200 000) are very low in comparison to the previous year’s provision for tax (C470 000). This probably resulted in penalties being incurred, which were an unnecessary drain on resources.
Solutions to Gripping IFRS : Graded Questions
Statement of cash flows
Kolitz & Sowden-Service, 2009 Chapter 22: Page 18
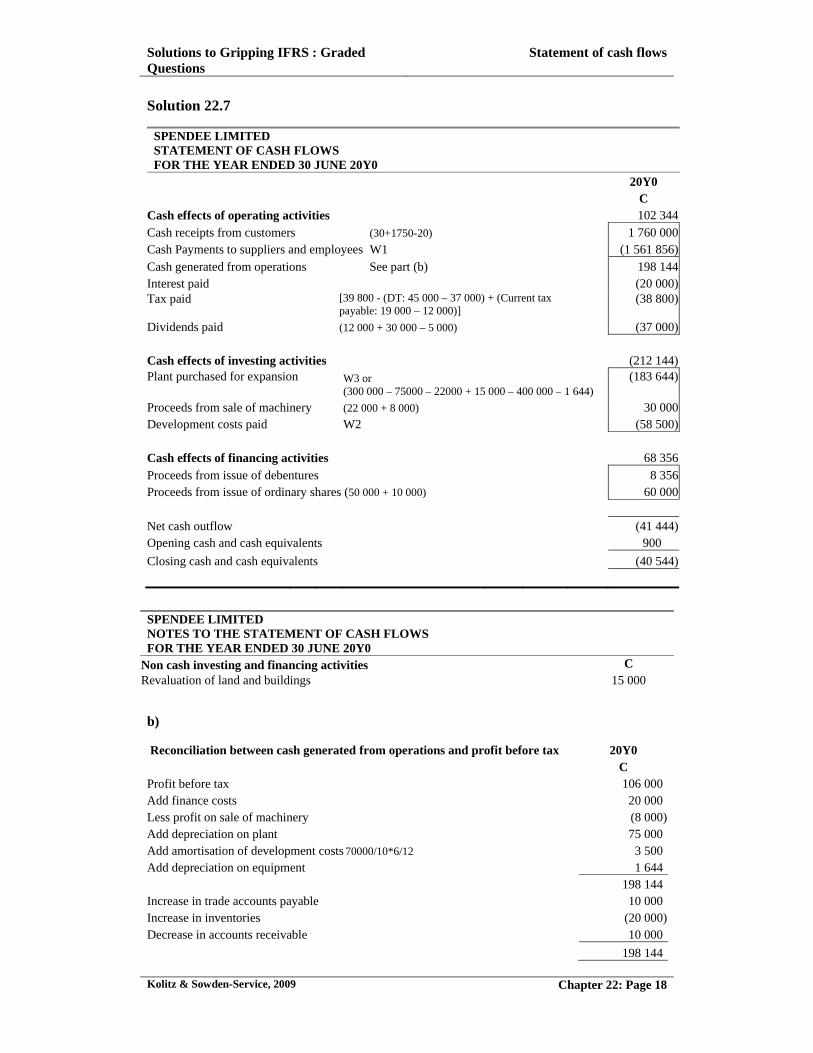
Solution 22.7
SPENDEE LIMITED STATEMENT OF CASH FLOWS FOR THE YEAR ENDED 30 JUNE 20Y0
20Y0 C Cash effects of operating activities 102 344Cash receipts from customers (30+1750-20) 1 760 000Cash Payments to suppliers and employees W1 (1 561 856)Cash generated from operations See part (b) 198 144Interest paid (20 000)Tax paid [39 800 - (DT: 45 000 – 37 000) + (Current tax
payable: 19 000 – 12 000)] (38 800)
Dividends paid (12 000 + 30 000 – 5 000) (37 000) Cash effects of investing activities (212 144)Plant purchased for expansion
W3 or (300 000 – 75000 – 22000 + 15 000 – 400 000 – 1 644)
(183 644)
Proceeds from sale of machinery (22 000 + 8 000) 30 000Development costs paid W2 (58 500) Cash effects of financing activities 68 356
Proceeds from issue of debentures 8 356Proceeds from issue of ordinary shares (50 000 + 10 000) 60 000
Net cash outflow (41 444)Opening cash and cash equivalents 900
Closing cash and cash equivalents (40 544)
SPENDEE LIMITED NOTES TO THE STATEMENT OF CASH FLOWS FOR THE YEAR ENDED 30 JUNE 20Y0
Non cash investing and financing activities C Revaluation of land and buildings
15 000
b)
Reconciliation between cash generated from operations and profit before tax 20Y0 C Profit before tax 106 000Add finance costs 20 000Less profit on sale of machinery (8 000)Add depreciation on plant 75 000Add amortisation of development costs 70000/10*6/12 3 500Add depreciation on equipment 1 644 198 144Increase in trade accounts payable 10 000Increase in inventories (20 000)Decrease in accounts receivable 10 000
198 144
Solutions to Gripping IFRS : Graded Questions
Statement of cash flows
Kolitz & Sowden-Service, 2009 Chapter 22: Page 19
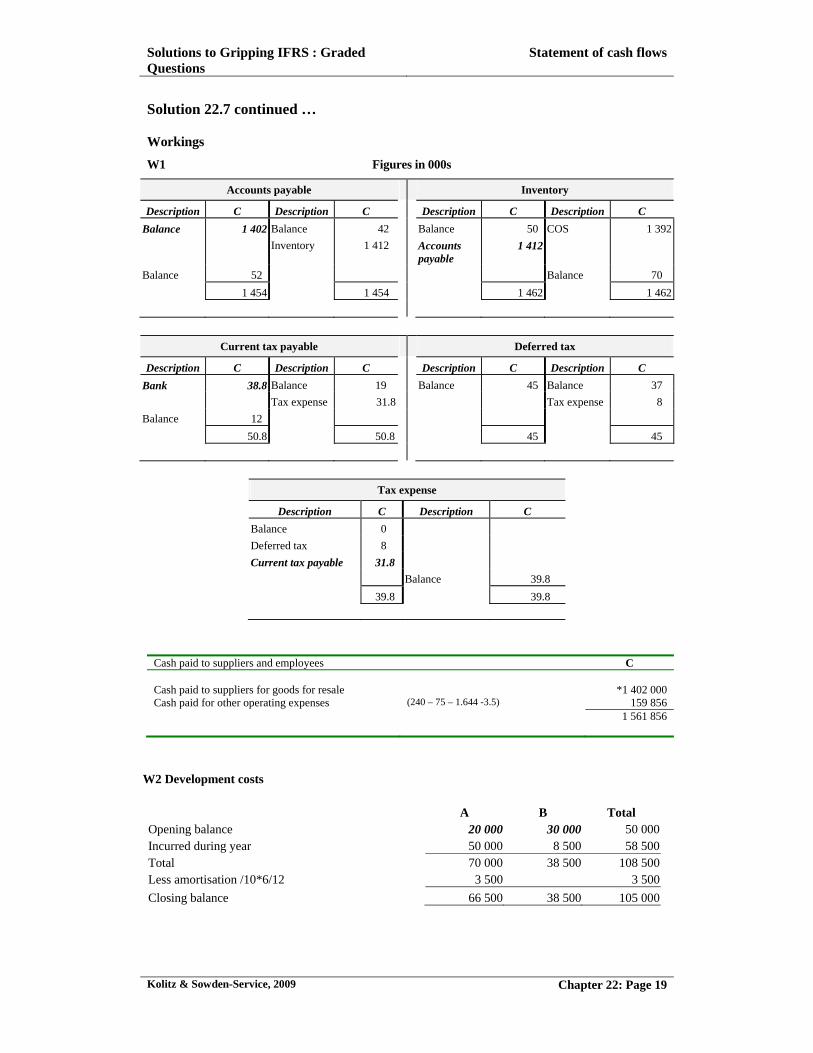
Solution 22.7 continued … Workings
W1 Figures in 000s
Accounts payable Inventory
Description C Description C Description C Description C
Balance 1 402 Balance 42 Balance 50 COS 1 392
Inventory 1 412 Accounts payable
1 412
Balance 52 Balance 70
1 454 1 454 1 462 1 462
Current tax payable Deferred tax
Description C Description C Description C Description C
Bank 38.8 Balance 19 Balance 45 Balance 37
Tax expense 31.8 Tax expense 8
Balance 12
50.8 50.8 45 45
Tax expense
Description C Description C
Balance 0
Deferred tax 8
Current tax payable 31.8
Balance 39.8
39.8 39.8
Cash paid to suppliers and employees C Cash paid to suppliers for goods for resale *1 402 000 Cash paid for other operating expenses (240 – 75 – 1.644 -3.5) 159 856 1 561 856
W2 Development costs A B Total Opening balance 20 000 30 000 50 000 Incurred during year 50 000 8 500 58 500 Total 70 000 38 500 108 500 Less amortisation /10*6/12 3 500 3 500
Closing balance 66 500 38 500 105 000
Solutions to Gripping IFRS : Graded Questions
Statement of cash flows
Kolitz & Sowden-Service, 2009 Chapter 22: Page 20
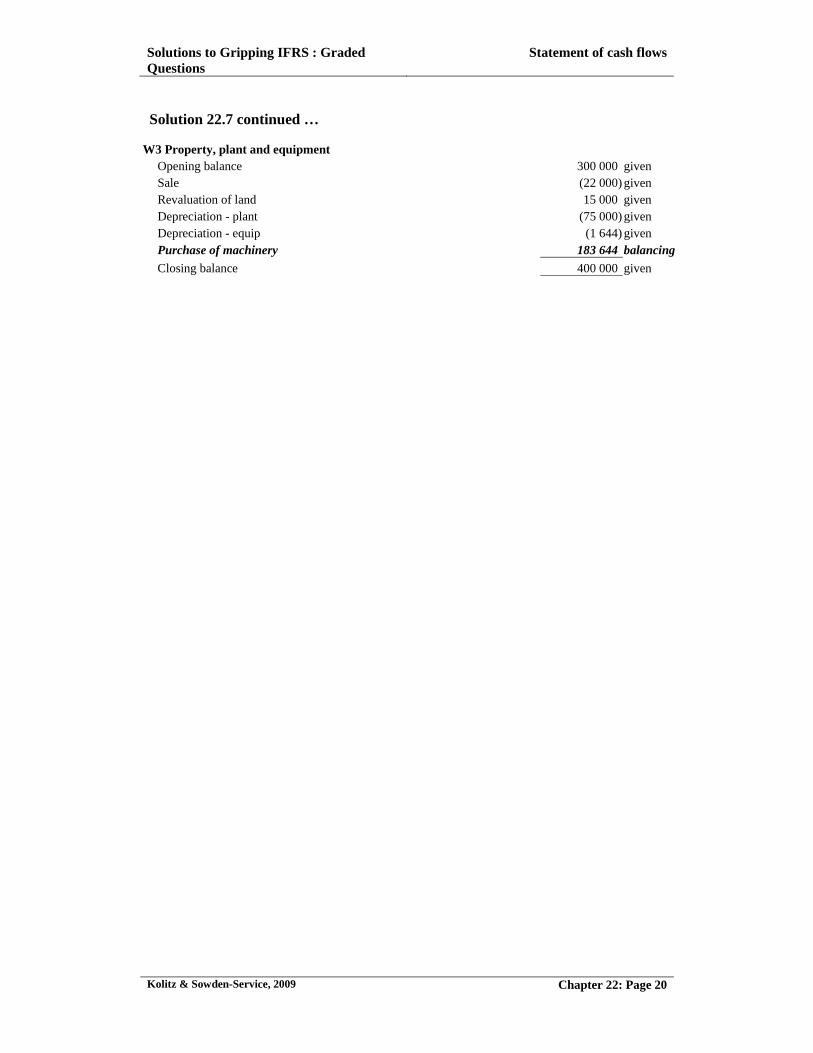
Solution 22.7 continued …
W3 Property, plant and equipment Opening balance 300 000 given Sale (22 000) given Revaluation of land 15 000 given Depreciation - plant (75 000) given Depreciation - equip (1 644) given Purchase of machinery 183 644 balancing
Closing balance 400 000 given
Solutions to Gripping IFRS : Graded Questions
Statement of cash flows
Kolitz & Sowden-Service, 2009 Chapter 22: Page 21
Solution 22.8
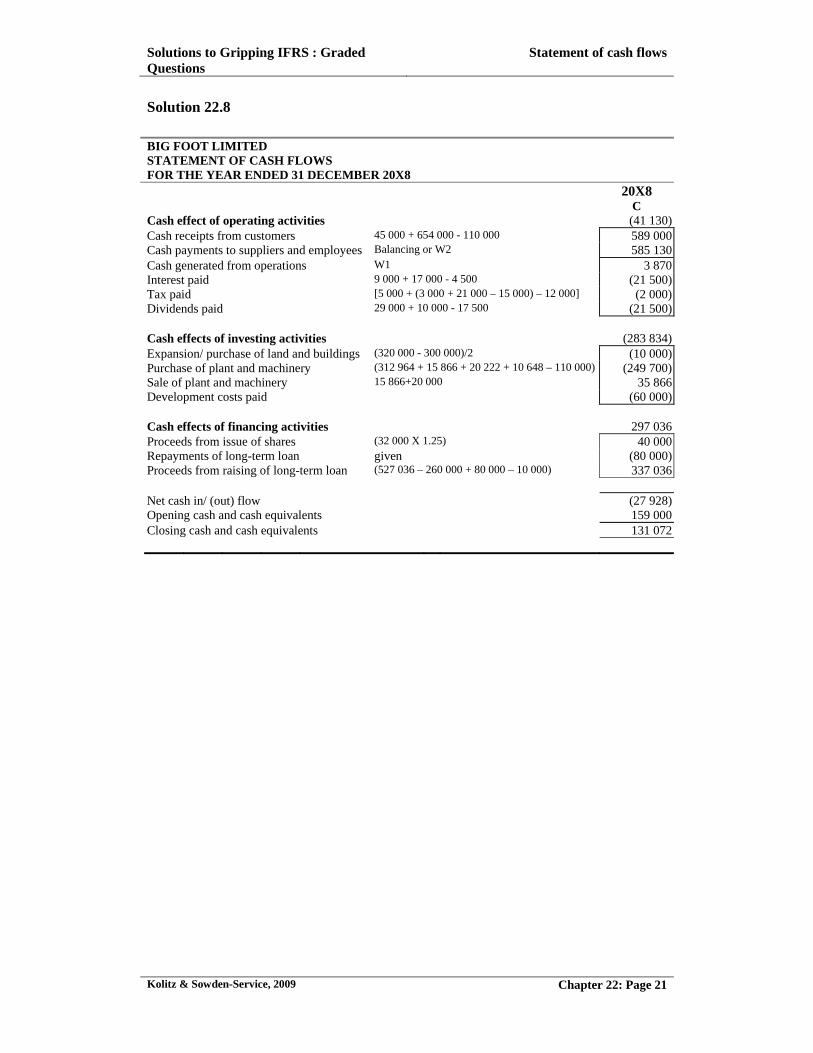
BIG FOOT LIMITED STATEMENT OF CASH FLOWS FOR THE YEAR ENDED 31 DECEMBER 20X8
20X8 C
Cash effect of operating activities (41 130)Cash receipts from customers 45 000 + 654 000 - 110 000 589 000Cash payments to suppliers and employees Balancing or W2 585 130Cash generated from operations W1 3 870Interest paid 9 000 + 17 000 - 4 500 (21 500)Tax paid [5 000 + (3 000 + 21 000 – 15 000) – 12 000] (2 000)Dividends paid 29 000 + 10 000 - 17 500 (21 500)
Cash effects of investing activities (283 834)Expansion/ purchase of land and buildings (320 000 - 300 000)/2 (10 000)Purchase of plant and machinery (312 964 + 15 866 + 20 222 + 10 648 – 110 000) (249 700)Sale of plant and machinery 15 866+20 000 35 866Development costs paid (60 000)
Cash effects of financing activities 297 036Proceeds from issue of shares (32 000 X 1.25) 40 000Repayments of long-term loan given (80 000)Proceeds from raising of long-term loan (527 036 – 260 000 + 80 000 – 10 000) 337 036
Net cash in/ (out) flow (27 928)Opening cash and cash equivalents 159 000Closing cash and cash equivalents 131 072
Solutions to Gripping IFRS : Graded Questions
Statement of cash flows
Kolitz & Sowden-Service, 2009 Chapter 22: Page 22
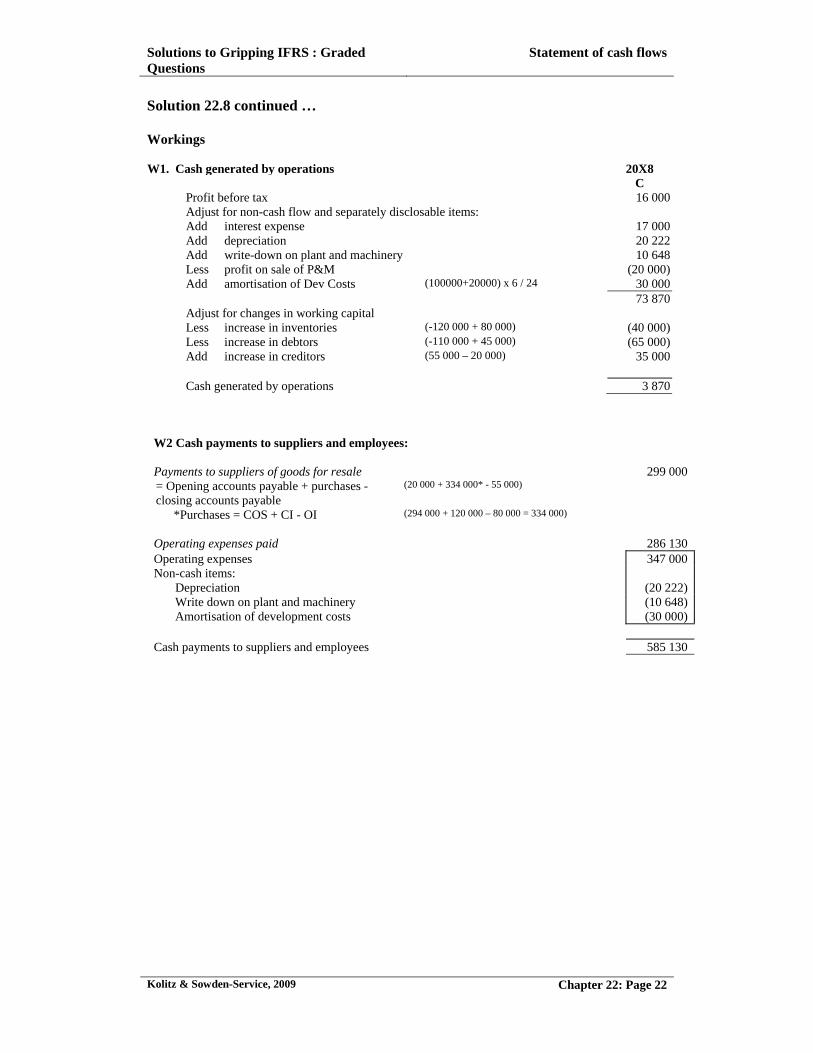
Solution 22.8 continued … Workings
W1. Cash generated by operations 20X8
C Profit before tax 16 000 Adjust for non-cash flow and separately disclosable items: Add interest expense 17 000 Add depreciation 20 222 Add write-down on plant and machinery 10 648 Less profit on sale of P&M (20 000) Add amortisation of Dev Costs (100000+20000) x 6 / 24 30 000 73 870 Adjust for changes in working capital Less increase in inventories (-120 000 + 80 000) (40 000) Less increase in debtors (-110 000 + 45 000) (65 000) Add increase in creditors (55 000 – 20 000) 35 000 Cash generated by operations 3 870
W2 Cash payments to suppliers and employees: Payments to suppliers of goods for resale 299 000 = Opening accounts payable + purchases - closing accounts payable
(20 000 + 334 000* - 55 000)
*Purchases = COS + CI - OI (294 000 + 120 000 – 80 000 = 334 000)
Operating expenses paid 286 130 Operating expenses 347 000 Non-cash items:
Depreciation (20 222) Write down on plant and machinery (10 648) Amortisation of development costs (30 000)
Cash payments to suppliers and employees 585 130
Solutions to Gripping IFRS : Graded Questions
Statement of cash flows
Kolitz & Sowden-Service, 2009 Chapter 22: Page 23
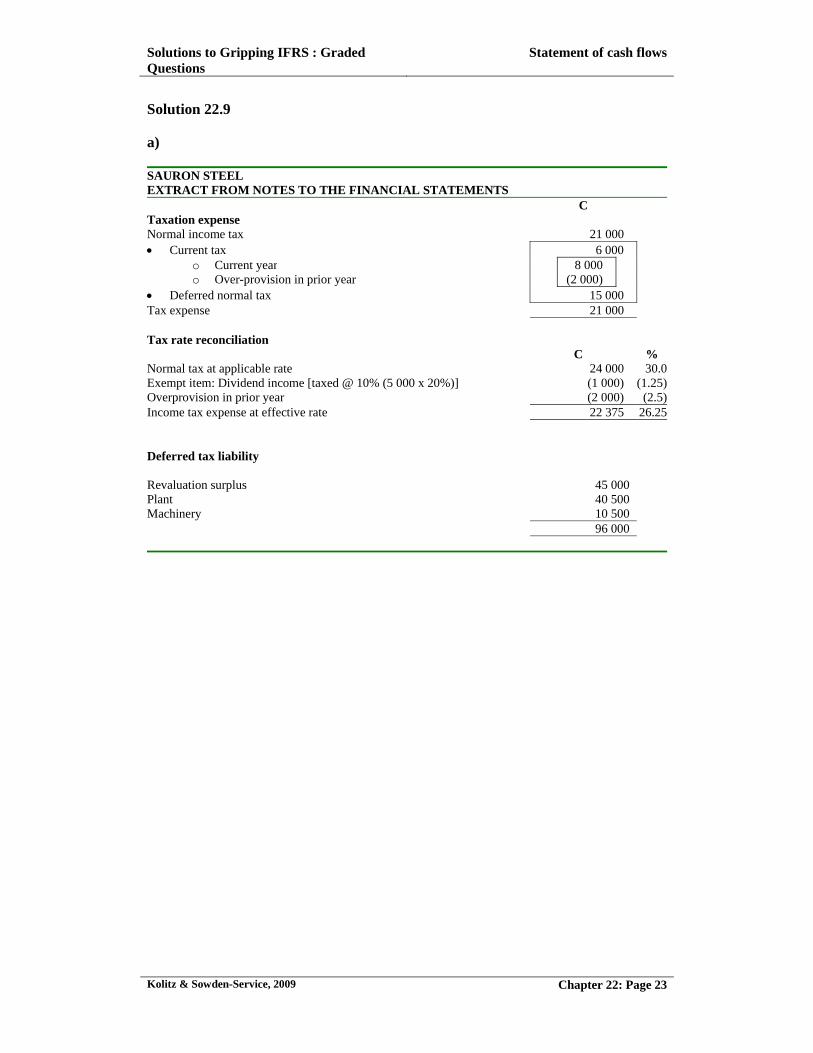
Solution 22.9 a) SAURON STEEL EXTRACT FROM NOTES TO THE FINANCIAL STATEMENTS C Taxation expense Normal income tax 21 000 Current tax 6 000
o Current year 8 000 o Over-provision in prior year (2 000)
Deferred normal tax 15 000 Tax expense 21 000 Tax rate reconciliation
C % Normal tax at applicable rate 24 000 30.0Exempt item: Dividend income [taxed @ 10% (5 000 x 20%)] (1 000) (1.25)Overprovision in prior year (2 000) (2.5)Income tax expense at effective rate 22 375 26.25 Deferred tax liability Revaluation surplus 45 000 Plant 40 500 Machinery 10 500 96 000
Solutions to Gripping IFRS : Graded Questions
Statement of cash flows
Kolitz & Sowden-Service, 2009 Chapter 22: Page 24
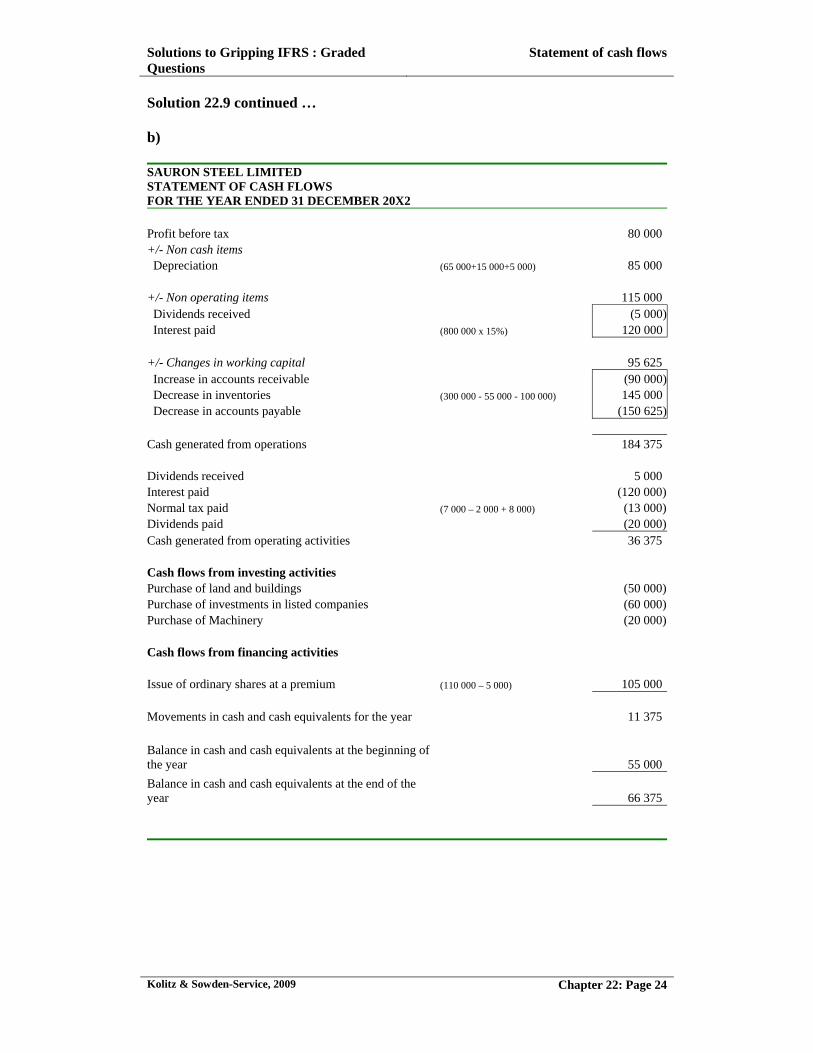
Solution 22.9 continued … b) SAURON STEEL LIMITED STATEMENT OF CASH FLOWS FOR THE YEAR ENDED 31 DECEMBER 20X2 Profit before tax 80 000 +/- Non cash items Depreciation (65 000+15 000+5 000) 85 000 +/- Non operating items 115 000 Dividends received (5 000) Interest paid (800 000 x 15%) 120 000 +/- Changes in working capital 95 625 Increase in accounts receivable (90 000) Decrease in inventories (300 000 - 55 000 - 100 000) 145 000 Decrease in accounts payable (150 625) Cash generated from operations 184 375 Dividends received 5 000Interest paid (120 000)Normal tax paid (7 000 – 2 000 + 8 000) (13 000)Dividends paid (20 000)Cash generated from operating activities 36 375 Cash flows from investing activities Purchase of land and buildings (50 000)Purchase of investments in listed companies (60 000)Purchase of Machinery (20 000) Cash flows from financing activities Issue of ordinary shares at a premium (110 000 – 5 000) 105 000
Movements in cash and cash equivalents for the year 11 375
Balance in cash and cash equivalents at the beginning of the year 55 000
Balance in cash and cash equivalents at the end of the year 66 375
Solutions to Gripping IFRS : Graded Questions
Statement of cash flows
Kolitz & Sowden-Service, 2009 Chapter 22: Page 25
Solution 22.9 continued . . .
Workings
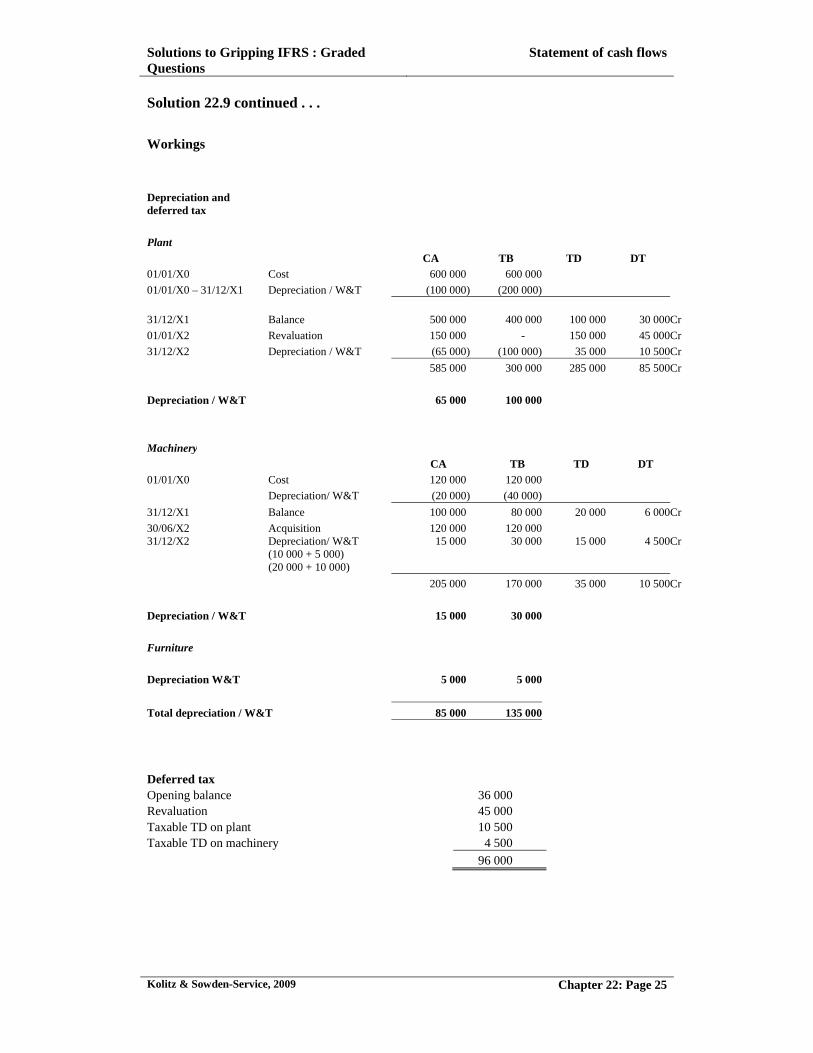
Depreciation and deferred tax
Plant
CA TB TD DT
01/01/X0 Cost 600 000 600 000
01/01/X0 – 31/12/X1 Depreciation / W&T (100 000) (200 000)
31/12/X1 Balance 500 000 400 000 100 000 30 000 Cr
01/01/X2 Revaluation 150 000 - 150 000 45 000Cr
31/12/X2 Depreciation / W&T (65 000) (100 000) 35 000 10 500Cr
585 000 300 000 285 000 85 500Cr
Depreciation / W&T 65 000 100 000
Machinery
CA TB TD DT
01/01/X0 Cost 120 000 120 000
Depreciation/ W&T (20 000) (40 000)
31/12/X1 Balance 100 000 80 000 20 000 6 000 Cr
30/06/X2 Acquisition 120 000 120 000 31/12/X2 Depreciation/ W&T
(10 000 + 5 000) (20 000 + 10 000)
15 000 30 000 15 000 4 500Cr
205 000 170 000 35 000 10 500Cr
Depreciation / W&T 15 000 30 000
Furniture
Depreciation W&T 5 000 5 000
Total depreciation / W&T 85 000 135 000
Deferred tax Opening balance 36 000 Revaluation 45 000 Taxable TD on plant 10 500 Taxable TD on machinery 4 500
96 000
Solutions to Gripping IFRS : Graded Questions
Statement of cash flows
Kolitz & Sowden-Service, 2009 Chapter 22: Page 26
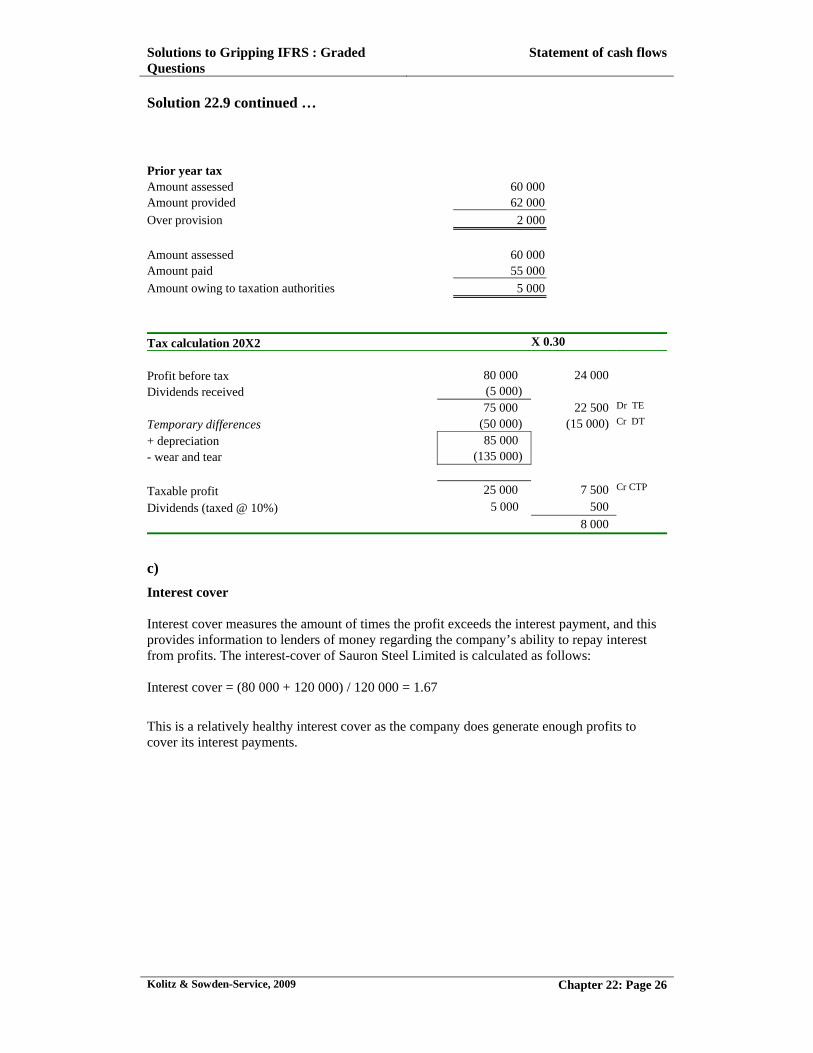
Solution 22.9 continued …
Prior year tax Amount assessed 60 000Amount provided 62 000
Over provision 2 000
Amount assessed 60 000Amount paid 55 000
Amount owing to taxation authorities 5 000
Tax calculation 20X2 X 0.30
Profit before tax 80 000 24 000
Dividends received (5 000)
75 000 22 500 Dr TE
Temporary differences (50 000) (15 000) Cr DT
+ depreciation 85 000
- wear and tear (135 000)
Taxable profit 25 000 7 500 Cr CTP
Dividends (taxed @ 10%) 5 000 500
8 000
c)
Interest cover Interest cover measures the amount of times the profit exceeds the interest payment, and this provides information to lenders of money regarding the company’s ability to repay interest from profits. The interest-cover of Sauron Steel Limited is calculated as follows: Interest cover = (80 000 + 120 000) / 120 000 = 1.67
This is a relatively healthy interest cover as the company does generate enough profits to cover its interest payments.