chapter 21 air pressure and winds - science...
TRANSCRIPT
• 494 •
Air Pressure and Winds
C H A P T E R
21WORDS TO KNOW
convection cell isobar monsoon
convergence jet stream prevailing wind
divergence land breeze radar
Doppler radar low-pressure system sea breeze
high-pressure system
This chapter will help you answer the following questions:1 Why do we have winds?2 How can local winds and regional winds be different?3 What winds occur in the upper atmosphere?4 How do isobaric maps help us understand wind velocity and
direction?
FAST AS THE WIND
Determining a world’s record for wind speed is not a simple mat-ter. On April 12, 1934, an anemometer on the summit of MountWashington in New Hampshire registered a sustained wind speedof 373 km/h or 231 mph. Mount Washington, at 1910 m (6262 ft),is the highest peak in the northeastern United States. This recordhas stood for more than 75 years. Prevailing westerly winds are
4: 2.1c, 2.1d, 2.1e

forced up the mountain. The mountaintop and the overlying lay-ers of the atmosphere squeeze the winds, increasing their speed.The average wind speed at this location is 57 km/h (35 mph)making it the windiest surface location in the United States. Visitthe following Web site to see the webcam view of the currentconditions at the top of Mount Washington: http://www.mountwashington.org/weather/cam/
On the island of Guam in 1997, scientists reported a windspeed of 380 km/h (236 mph). The measurement was made dur-ing a typhoon (hurricane). This report led to an investigation bythe National Climate Extremes Committee. The committee foundthat the anemometer was not properly calibrated. It was inaccu-rate for winds greater than 274 km/hr (170 mph). The committeeconcluded that the combination of high wind and heavy raincaused the Guam instrument to malfunction. They said that thetrue wind speed was probably less than 322 km/h (200 mph).
Was the wind speed recorded on Mount Washington the fastestsurface wind ever to occur? It is not likely. Meteorologists estimatethat winds in the strongest tornadoes reach more than 483 km/h(300 mph). Scientists have tried to measure tornado winds withground-based instruments. However, it is hard to place instrumentsin the narrow path of a tornado. In addition, flying debris and dam-age done by strong tornadoes make this nearly impossible. Teams of“storm chasers” have tried to put instrument packages where a tor-nado would run over them. However, none have succeeded in ob-taining anemometer measurements of the strongest tornado winds.
There is a new tool available for measuring extreme winds. Me-teorologists can now use radar to measure wind speed and directionfrom a distance. Radar works by bouncing long-wave radio signalsoff distant objects. It was developed during the Second World Warprimarily to observe enemy aircraft. The distance is determined byhow long the signals take to return as reflected energy. The nameradar comes from “radio detection and ranging.” Using advancedtechnology, engineers have developed radar that can measure thespeed of objects or winds. It also tells whether they are moving to-ward or away from the radar station. This is called Doppler radar.Doppler radar was used to record a wind gust of 512 km/h (318mph) in a tornado in Oklahoma in 1999. However, this wind speedis not considered as reliable as the 1934 measurement on MountWashington.
CHAPTER 21: AIR PRESSURE AND WINDS ● 495
496 ● UNIT 7: THE DYNAMIC ATMOSPHERE
WHAT CAUSES WINDS?
Surface winds blow in response to differences in air pressure.Winds always move from places of higher pressure to places oflower pressure. When you exhale, you do so by squeezing the airin your lungs, increasing the pressure. Air escapes from yourbody to equalize the pressure inside and outside your lungs. Anair pump works in a similar way. By compressing the air inside thepump, air is forced out of the pump to where the pressure is lower.Visit the following Web site to watch a demonstration of air pres-sure: http://www.youtube.com/watch?v�zl657tCCudw
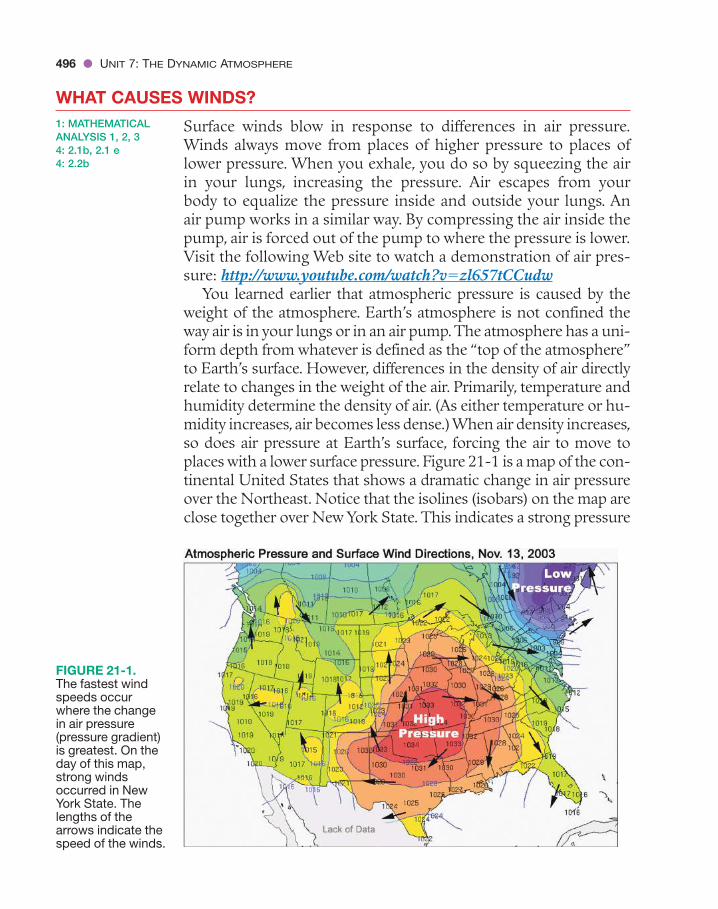
You learned earlier that atmospheric pressure is caused by theweight of the atmosphere. Earth’s atmosphere is not confined theway air is in your lungs or in an air pump.The atmosphere has a uni-form depth from whatever is defined as the “top of the atmosphere”to Earth’s surface. However, differences in the density of air directlyrelate to changes in the weight of the air. Primarily, temperature andhumidity determine the density of air. (As either temperature or hu-midity increases, air becomes less dense.) When air density increases,so does air pressure at Earth’s surface, forcing the air to move toplaces with a lower surface pressure. Figure 21-1 is a map of the con-tinental United States that shows a dramatic change in air pressureover the Northeast. Notice that the isolines (isobars) on the map areclose together over New York State. This indicates a strong pressure
1: MATHEMATICALANALYSIS 1, 2, 34: 2.1b, 2.1 e4: 2.2b
FIGURE 21-1.The fastest windspeeds occurwhere the changein air pressure(pressure gradient)is greatest. On theday of this map,strong windsoccurred in NewYork State. Thelengths of thearrows indicate thespeed of the winds.

CHAPTER 21: AIR PRESSURE AND WINDS ● 497
gradient. Therefore, strong winds occurred in this region wherethere is a large change in pressure over a short distance.
You may recall from Chapter 3 that to calculate the gradient,you need to use the formula from page 1 of the Earth Science Ref-erence Tables. For example, the following sample problem showsyou how to calculate the average pressure gradient.
SAMPLE PROBLEM
Problem 1 Calculate the pressure gradient between a location where the airpressure is 1020 mb and another location 100 km away where theair pressure is 1025 mb.
Solution Gradient change in field valuedistance
1025 mb
�
��11020 mb
100 km5 mb
100 km0.05 mb/km
�
�
SAMPLE PROBLEM
Problem 2 What is the rate of change when over a period of 10 h the airpressure goes from 965 mb to 985 mb?
Solution Rate of change change in field valuetime
985 mb 9
�
�� 665 mb
10 h20 mb10 h
2 mb/h
�
�
You can use a similar procedure to find the rate of change usinganother formula from page 1 of the Earth Science Reference Tables.For example, the next sample problem shows how to find the rateof change of air pressure with time.
498 ● UNIT 7: THE DYNAMIC ATMOSPHERE
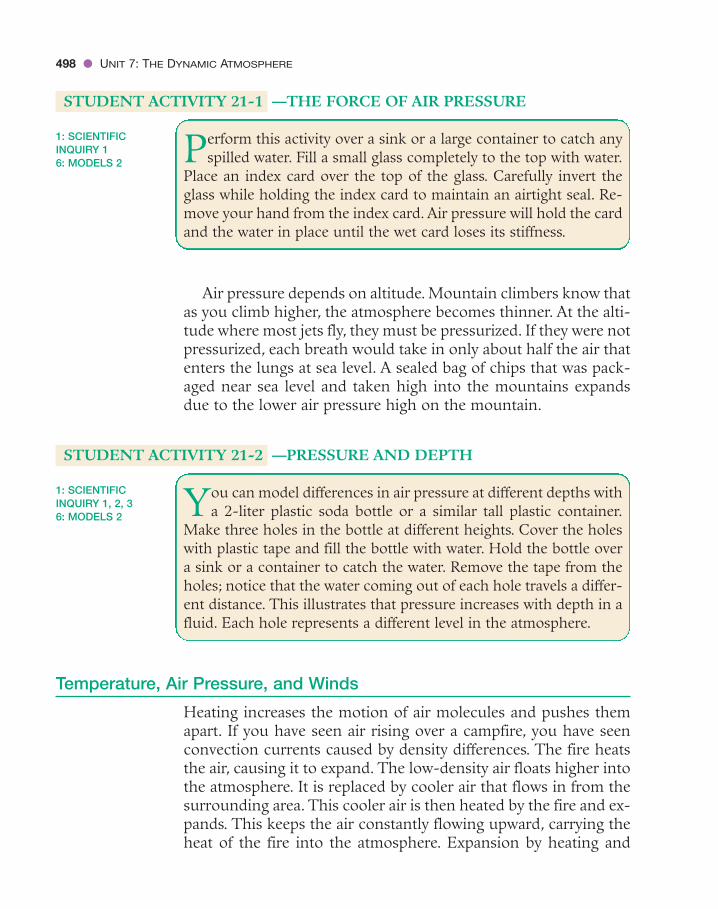
STUDENT ACTIVITY 21-1 —THE FORCE OF AIR PRESSURE
Perform this activity over a sink or a large container to catch anyspilled water. Fill a small glass completely to the top with water.
Place an index card over the top of the glass. Carefully invert theglass while holding the index card to maintain an airtight seal. Re-move your hand from the index card. Air pressure will hold the cardand the water in place until the wet card loses its stiffness.
Air pressure depends on altitude. Mountain climbers know thatas you climb higher, the atmosphere becomes thinner. At the alti-tude where most jets fly, they must be pressurized. If they were notpressurized, each breath would take in only about half the air thatenters the lungs at sea level. A sealed bag of chips that was pack-aged near sea level and taken high into the mountains expandsdue to the lower air pressure high on the mountain.
STUDENT ACTIVITY 21-2 —PRESSURE AND DEPTH
You can model differences in air pressure at different depths witha 2-liter plastic soda bottle or a similar tall plastic container.
Make three holes in the bottle at different heights. Cover the holeswith plastic tape and fill the bottle with water. Hold the bottle overa sink or a container to catch the water. Remove the tape from theholes; notice that the water coming out of each hole travels a differ-ent distance. This illustrates that pressure increases with depth in afluid. Each hole represents a different level in the atmosphere.
Temperature, Air Pressure, and Winds
Heating increases the motion of air molecules and pushes themapart. If you have seen air rising over a campfire, you have seenconvection currents caused by density differences. The fire heatsthe air, causing it to expand. The low-density air floats higher intothe atmosphere. It is replaced by cooler air that flows in from thesurrounding area. This cooler air is then heated by the fire and ex-pands. This keeps the air constantly flowing upward, carrying theheat of the fire into the atmosphere. Expansion by heating and
1: SCIENTIFICINQUIRY 1, 2, 36: MODELS 2
1: SCIENTIFICINQUIRY 16: MODELS 2

CHAPTER 21: AIR PRESSURE AND WINDS ● 499
contraction by cooling cause changes in atmospheric pressure.When air pressure is higher in one place and lower in another,winds blow to equalize the pressure differences.
Humidity, Air Pressure, and Winds
The role of humidity is not as obvious as that of temperature. Sci-entists have determined that under the same conditions of tem-perature and pressure, the same number of molecules of any gasoccupies the same volume. Therefore, if lighter gas molecules aresubstituted for heavier molecules, there is no change in volume,but the density of the gas decreases. The mass of the individualmolecules determines the density of any gas.
You usually think of water as a substance that is more dense thanair. Although it is true that liquid water is far more dense than air,this changes when water becomes water vapor. Dry air is 78 percentnitrogen. If you look at the Periodic Table of Elements, you will seethat each atom of nitrogen has a mass of 14 atomic mass units(amu). Like many other gases, nitrogen, hydrogen, and oxygen ex-ists in molecules made up of two atoms. Therefore, the mass of amolecule of nitrogen (N2) is 28 amu. Oxygen (O2), which makes upmost of the rest of dry air, has an atomic mass of 16 amu and a mol-ecular mass of 32 amu. Oxygen is just a little more dense than nitro-gen. Therefore air is composed mostly of molecules with a mass ofabout 28 amu, as shown in the left of Figure 21-2.
Water molecules:H2O
Mass = 18
Air molecules:(mostly N2)Mass = 28
Total mass of air molecules= 30 × 28 = 840
Air molecules = 24 × 28 = 672
Water molecules = 6 × 18 = 108Total mass = 780
dry air moist air
FIGURE 21-2. When watervapor is added to air, the airbecomes less dense. Watermolecules have less massthan molecules of nitrogen,which make up most of theatmosphere. Therefore,substituting water vapor fordry air makes the air lessdense. (The units of massbelow these diagrams areatomic mass units.)

Water vapor is a compound made of two atoms of hydrogenand one atom of oxygen (H2O). The water molecule has threeatoms: one more than either nitrogen or oxygen. However, thehydrogen atoms are very light. They have an atomic mass of just1 amu. You may recall that the oxygen atom has a mass of 16 amu.Therefore, the mass of the water molecule is 18 amu (1 � 1 � 16).This is much less than the molecular mass of nitrogen (28 amu)and oxygen (32 amu), which together make up 99 percent of dryair. Therefore, when water vapor molecules replace dry air mole-cules, the air becomes less dense. Figure 21-2 models dry air as 30molecules of nitrogen with a total mass of 840 amu. On the rightside of this diagram, six water molecules have taken the place ofthe same number of nitrogen molecules. The total mass decreasesto 780 amu. Therefore, adding water vapor to the atmospheremakes air less dense.
The effects of temperature and humidity are confirmed whenyou use a barometer to measure air pressure in different weatherconditions. As temperature and humidity increase, the baromet-ric pressure decreases. Conversely, a change to cooler and dryerweather results in increasing barometric pressure.
WHY DO LOCAL WINDS OCCUR?
There are two categories of wind currents. Regional winds extendover a large area, such as several states of the United States. Localwinds are those that extend only for a few miles before they die out.
Convection Cells
Whenever air is heated in one place and cooled in another, circu-lation tends to occur. Consider a room with a radiator on one sideof the room and a cold window on the other. Air near the radia-tor absorbs energy. This causes the air to expand and rise. At thefar side of the room, air is cooled as it loses its energy. Heat is lostby contact with the cold window and the wall (conduction) as wellas by radiating heat toward these surfaces. Air near this end of theroom contracts and sinks to the floor, where it flows toward theradiator. As long as the air is heated in one place and cooled in an-other, circulation will continue. This pattern, shown in Figure
4: 2.1b, 2.1e, 2.1f,2.1h4: 2.2a, 2.2b, 2.2c
500 ● UNIT 7: THE DYNAMIC ATMOSPHERE
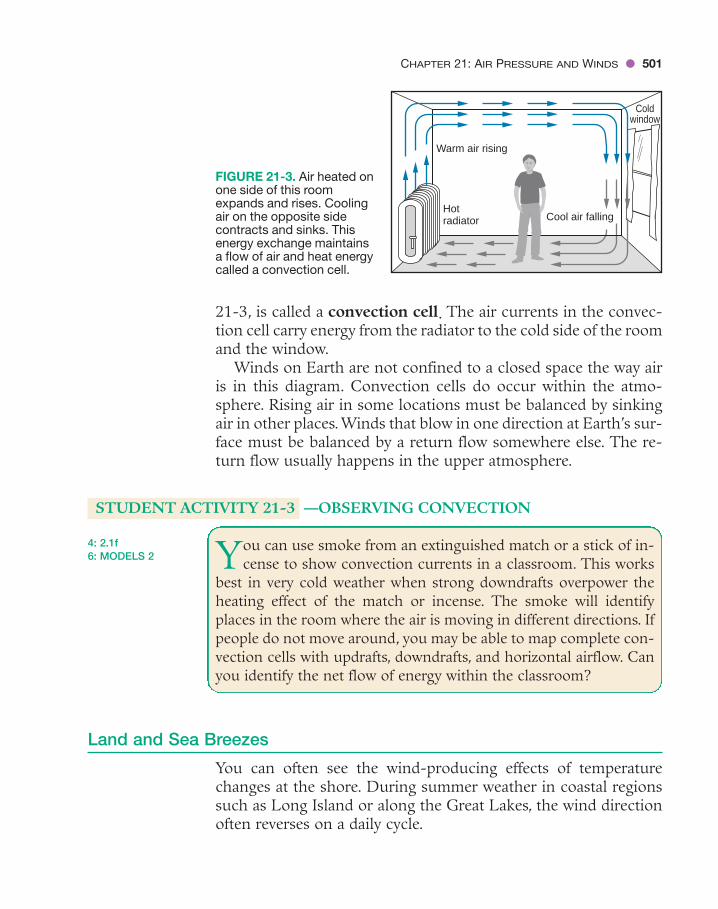
21-3, is called a convection cell. The air currents in the convec-tion cell carry energy from the radiator to the cold side of the roomand the window.
Winds on Earth are not confined to a closed space the way airis in this diagram. Convection cells do occur within the atmo-sphere. Rising air in some locations must be balanced by sinkingair in other places. Winds that blow in one direction at Earth’s sur-face must be balanced by a return flow somewhere else. The re-turn flow usually happens in the upper atmosphere.
STUDENT ACTIVITY 21-3 —OBSERVING CONVECTION
You can use smoke from an extinguished match or a stick of in-cense to show convection currents in a classroom. This works
best in very cold weather when strong downdrafts overpower theheating effect of the match or incense. The smoke will identifyplaces in the room where the air is moving in different directions. Ifpeople do not move around, you may be able to map complete con-vection cells with updrafts, downdrafts, and horizontal airflow. Canyou identify the net flow of energy within the classroom?
Land and Sea Breezes
You can often see the wind-producing effects of temperaturechanges at the shore. During summer weather in coastal regionssuch as Long Island or along the Great Lakes, the wind directionoften reverses on a daily cycle.
4: 2.1f6: MODELS 2
CHAPTER 21: AIR PRESSURE AND WINDS ● 501
Hotradiator Cool air falling
Warm air rising
Coldwindow
FIGURE 21-3. Air heated onone side of this roomexpands and rises. Coolingair on the opposite sidecontracts and sinks. Thisenergy exchange maintainsa flow of air and heat energycalled a convection cell.
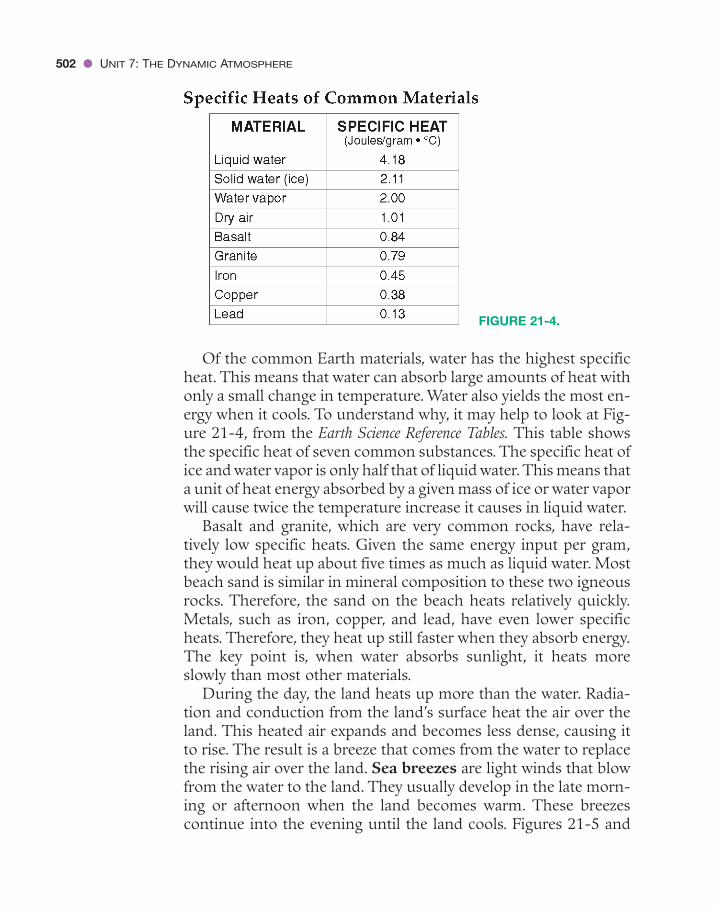
Of the common Earth materials, water has the highest specificheat. This means that water can absorb large amounts of heat withonly a small change in temperature. Water also yields the most en-ergy when it cools. To understand why, it may help to look at Fig-ure 21-4, from the Earth Science Reference Tables. This table showsthe specific heat of seven common substances. The specific heat ofice and water vapor is only half that of liquid water.This means thata unit of heat energy absorbed by a given mass of ice or water vaporwill cause twice the temperature increase it causes in liquid water.
Basalt and granite, which are very common rocks, have rela-tively low specific heats. Given the same energy input per gram,they would heat up about five times as much as liquid water. Mostbeach sand is similar in mineral composition to these two igneousrocks. Therefore, the sand on the beach heats relatively quickly.Metals, such as iron, copper, and lead, have even lower specificheats. Therefore, they heat up still faster when they absorb energy.The key point is, when water absorbs sunlight, it heats moreslowly than most other materials.
During the day, the land heats up more than the water. Radia-tion and conduction from the land’s surface heat the air over theland. This heated air expands and becomes less dense, causing itto rise. The result is a breeze that comes from the water to replacethe rising air over the land. Sea breezes are light winds that blowfrom the water to the land. They usually develop in the late morn-ing or afternoon when the land becomes warm. These breezescontinue into the evening until the land cools. Figures 21-5 and
502 ● UNIT 7: THE DYNAMIC ATMOSPHERE
FIGURE 21-4.

21-6 show sea and land breezes on New York’s Long Island. Visitthe following Web site to watch simple air pressure and wind an-imations: http://serc.carleton.edu/NAGTWorkshops/visualization/collections/atmospheric_pressure.html
Sea breezes provide two benefits. First, a breeze off the oceanmoves the cooler ocean air onto the beach. This brings relief fromsummer heat at the hottest time of day. Second, the breeze re-places humid air that builds around your body, allowing sweat toevaporate and cool you.
CHAPTER 21: AIR PRESSURE AND WINDS ● 503
FIGURE 21-5.During the day, thesurface of the landheats up more thanthe water, and thewarmer air over theland rises. Thispulls in a coolingsea breeze off the ocean.
FIGURE 21-6.At night, the landcools more, so theocean is warmer.The warmer airover the oceanthen rises and pulls the air off the land. This is aland breeze.

The wind reverses direction at night and through the earlymorning, becoming a land breeze. Land not only warms fasterthan the ocean, but it also loses its heat more quickly. The lowerspecific heat for rock materials means that at night the sameamount of energy lost has a greater cooling effect on the land thanon water. When the land cools at night, so does the air over it. Theair over the water is now warmer than the air over the land. In-stead of the air rising over land, air begins to rise over the waterduring the evening. This causes the wind to change direction,blowing from the land to the water. The conditions that lead to aland breeze also are shown in Figure 21-6, on page 503.
Land and sea breezes do not always occur along the shore. Theyrequire large areas of land and water. Therefore, these breezes donot occur at small lakes or ponds or on small islands. Nor do theydevelop when daily temperature changes are small, such as duringcloudy weather. Strong regional weather events such as the passageof fronts can easily overpower land and sea breezes. However,when these breezes do occur, they can bring welcome relief fromsummer heat. People who live near the ocean sometimes talk abouttheir “natural air conditioning” from these breezes.
WHAT CAUSES REGIONAL WINDS?
The fastest winds develop in larger and more powerful atmo-spheric events than land and sea breezes. If you have watched atelevision weather report you have probably seen maps of theUnited States with large areas marked “H” and “L.” These are re-gional high- and low-pressure systems.
Low- and High-Pressure Systems
Low-pressure systems are areas where warm, moist air rises. Inthe last chapter, you learned that when the air is humid, rising airproduces clouds. Cloud formation, which occurs by condensation,releases latent energy and warms the air even more. This warmingaccelerates the rising air. Therefore, once a low-pressure systemdevelops, it tends to strengthen and continue as long as it can drawin moist air. In fact, some low-pressure systems build into majorstorms that release great amounts of energy. Low-pressure centers
4: 2.1b, 2.1g, 2.1h, 2.1i4: 2.2a, 2.2 b, 2.2c
504 ● UNIT 7: THE DYNAMIC ATMOSPHERE

are also called zones of convergence. Convergence means comingtogether.
High-pressure systems are usually places where cool, dry airsinks lower into the atmosphere. Although the air warms as itsinks, it may still be cooler than the surrounding air. The airspreads out at the surface, making room for more descending air.High-pressure regions can also remain strong for many days.High-pressure systems are sometimes called zones of divergence.Divergence means moving apart.
Rising and falling air are part of convection cells. Vertical airmovements generate surface winds that move from regions ofhigh pressure to places where the pressure is lower. At Earth’s sur-face, descending air spreads as it moves out of a high-pressure sys-tem. Conversely, winds come together as they blow into regions oflow pressure. Rising air at the center of the low maintain thesewinds. Figure 21-7 is a diagram of North America that shows re-gional high- and low-pressure centers.
STUDENT ACTIVITY 21-4 —MOVEMENT OF PRESSURE SYSTEMS
Use a daily weather map from a newspaper, televised weather re-port, or the Internet to locate centers of high- and low-pres-
sure on a map of the United States. Over the next three days, plotthe movements of these pressure systems across the country. Isthere a general direction in which they usually move?
6: PATTERNS OFCHANGE 5
CHAPTER 21: AIR PRESSURE AND WINDS ● 505
Convergencealoft Divergence
aloft
Air sinks
Surfacedivergence
Surfaceconvergence
Air rises
L
H
FIGURE 21-7.Regional high- andlow-pressure zonesoften last for daysas they move fromwest to east acrossthe country. Thedifferences in airpressure causewinds to blow fromareas of higherpressure to areasof lower pressure.

The Coriolis Effect
The Coriolis effect produces the curved path that objects, includingwinds and ocean currents, appear to follow as they travel overEarth’s surface. It was named after the French scientist, Gaspard-Gustave Coriolis, who first described it. Look at the three peoplein Figure 21-8. To conduct an experiment, they are using a rotat-ing platform similar to those often found in playgrounds. In partA, the boy on a rotating platform is about to throw a ball towardthe two people opposite him. Part B shows the same people 1 or2 seconds later. From the point of view of the boy on the ground,the ball travels straight toward him as the two people on the plat-form move. However, the people on the moving platform see thepath of the ball curve to the right. If the platform in Figure 21-8rotated in the opposite direction, the observers on the plat-form would see the ball curve left. Visit the following Web site towatch animations of the Coriolis effect: http://www.youtube.com/watch?v�49JwbrXcPjc
506 ● UNIT 7: THE DYNAMIC ATMOSPHERE
FIGURE 21-8. Whether theball appears to curve ortravel in a straight linedepends on whether youare on the rotating platformor standing still. Thestraight path of the ball,shown by the dotted line, iswhat the person on theground sees. But to themoving person throwingthe ball, the ball appears tocurve, as shown by thedashed line.
A
B

STUDENT ACTIVITY 21-5 —THE CORIOLIS EFFECT
You can demonstrate the Coriolis effect. You will need a plasticmilk bottle, a flexible tube, a wooden stick, string, and duct tape.
Fill the bottle with water, place the tube in the bottle, and start thesiphon. Spin the apparatus. As the water spurts out, notice that itseems to curve. It actually goes straight, but the moving spoutmakes the stream of water seem to curve.
The difference between a turn to the right and a turn to the leftcan be confusing. For example, if you stand facing another person,what you call the right side of the room will be the other person’sleft. If each of you steps to the right, you will be going in oppositedirections. Obviously, we need some kind of rule to distinguishwhich way is “to the right.” This is not so different from the waywinds are labeled. Therefore, a wind is named according to the di-rection from which it comes, not for where it is going.
Whether a wind curves to the right or to the left is determinedby its direction of movement, as shown in Figure 21-9. One wayto think of this is to imagine that you are walking in the directionof the arrow. A right curve would be to your right only if you arelooking forward in the direction of motion. Winds and ocean cur-rents in the Northern Hemisphere appear to curve to the right as
1: SCIENTIFICINQUIRY 16: MODELS 2
CHAPTER 21: AIR PRESSURE AND WINDS ● 507
FIGURE 21-9. The straightlines show the four compassdirections. The diagram alsoshows four paths of motioncurving to the right. Whetherthe curve is to the left or rightis defined according tomovement in the direction ofthe arrow. Follow the arrowsto see why each is a curve tothe right.

508 ● UNIT 7: THE DYNAMIC ATMOSPHERE
they move forward. In the Southern Hemisphere, winds and cur-rents curve to the left.
If Earth did not rotate, patterns of convection on our planetwould be relatively simple. Air would descend in high-pressure re-gions and blow directly toward low-pressure centers. However,because Earth spins on its axis, wind patterns are more compli-cated. The winds follow a straight path, but as they blow over longdistances, the planet turns under them. Note that the Coriolis ef-fect is not noticeable over small distances such as those coveredby land and sea breezes.
When you look at much larger regional wind patterns, the ap-parent change in wind direction is very easy to see. The apparentcurvature of winds as they move along Earth’s surface is the resultof the Coriolis effect. Look back at Figure 21-1 on page 496. It isthe map of high- and low-pressure systems over North America.The isolines, called isobars, connect locations with the sameatmospheric pressure. These lines highlight the high- and low-pressure centers. The arrows show wind speed and direction.Longer arrows indicate higher speeds. The winds do blow out ofthe high-pressure systems and into the low-pressure systems. Theapparent curvature caused by the Coriolis effect swings them tothe right of their path in the Northern Hemisphere. In the South-ern Hemisphere, the Coriolis effect shifts the winds to the left oftheir path.
In fact, over long distances, the Coriolis effect is so importantthat winds generally blow almost parallel to the isolines ratherthan simply following the pressure gradient from high pressuredirectly to lower pressure.
The ocean currents map in the Earth Science Reference Tables showthat most of them circle clockwise (to the right of their path) in theNorthern Hemisphere. South of the equator they turn counter-clockwise (to the left of their path). The winds show a similar ap-parent curvature. In the Northern Hemisphere, winds that flow outof a high-pressure system turn clockwise. The winds flowing into alow-pressure system turn counterclockwise. Notice that althoughthe winds leaving a high-pressure system in Figure 21-10 curveright, they bend in the opposite direction as they approach a low-pressure system.What could cause them to curve in the “wrong di-rection” as they blow into a low? The easiest way to explain thischange is to point out that if the winds continued to circle to theright, they would move away from the center of the low-pressure

CHAPTER 21: AIR PRESSURE AND WINDS ● 509
system. The dashed line in Figure 21-10 illustrates this. Therefore,to follow the pressure gradient, regional winds change their curva-ture as they converge into low-pressure systems.
In the Southern Hemisphere the situation is reversed. Windsthat flow out of a high-pressure system turn counterclockwise.The winds flowing into a low-pressure system turn clockwise. Fig-ure 21-11 clearly shows the opposite circulation of regional windsin the two hemispheres. These are two satellite images of maturehurricanes. The cloud patterns in these pictures show winds con-verging into the eye of each storm. However, the winds circulatecounterclockwise in the northern hemisphere, while they circulatein the opposite direction, clockwise, in the southern hemisphere.
High-PressureRegion
Low-PressureRegion
FIGURE 21-11. The arrows drawn on these two satellite images highlightconverging winds in the Northern and Southern hemispheres. The left image isa Northern Hemisphere hurricane with the winds rotating counterclockwise.The right image is a Southern Hemisphere hurricane in which the winds rotateclockwise.
FIGURE 21-10. If Northern Hemisphere winds curve right due to the Corioliseffect, how can they converge into a low? The dotted line shows what wouldhappen if winds only curved right. But, as the solid arrows show, the pressuregradient pulls the wind left into a low.

Prevailing Winds
In New York State, winds blow from the west or southwest moreoften than from any other direction. Remember that winds are la-beled according to the direction you face when you look into thewind. Prevailing winds refer to the most common wind directionand speed at a particular location and time of year. Figure 21-12shows two diagrams of Earth. Diagram A shows how terrestrialwinds might blow if Earth were not spinning. Cold air would sinkat the poles and travel along the surface toward the equator.Strong sunlight heating the air near the equator would cause theair to rise and move back toward the poles. Two large convectioncells, as shown in the vertical profile, would dominate planetarywinds.
However, Earth’s rotation modifies this motion through theCoriolis effect. This is shown in Diagram B. Winds curving to theright in the Northern Hemisphere and to the left in the SouthernHemisphere form six convection cells. Within each cell, windscurving to the right in the Northern Hemisphere and to the left inthe Southern Hemisphere change the North and South winds intoEast and West winds. Regional weather systems (highs and lows)complicate the pattern even more. Winds can come from any di-rection depending on changes in the pressure gradient.
510 ● UNIT 7: THE DYNAMIC ATMOSPHERE
A. Stationary Planet B. Rotating Earth
Verticalprofile
Polar easterlies
Polar front
Polar easterlies
Prevailingwesterlies
Prevailingwesterlies
Northeasttrades
Southeasttrades
Doldrums
Horse latitudes
FIGURE 21-12. If Earth did not spin, wind patterns would be simpler, as yousee in Diagram A. However, due to Earth’s rotation and the Coriolis effect,winds appear to curve as you see in Diagram B. This results in prevailingwinds from the west and the east and several convection cells in eachhemisphere.

Monsoons
Large continents create seasonal changes in the direction of theprevailing winds. These seasonal wind directions are called mon-soons. They are similar to land and sea breezes, but monsoonwinds last for months and move over greater distances. The mon-soons of India are a good example. During the winter, when thesun is always low in the sky, the continent of Asia cools. Coolingof the air creates a long-lasting high-pressure zone over centralAsia. Sinking air spreads southward over India, bringing in dry airfrom central Asia. Rain is very scarce in India during this part ofthe year. In fact, the dry air becomes warmer as it descends fromthe high plateaus; so the relative humidity actually decreases.
The monsoon climate is very different in summer. Central Asiabecomes warmer as the sun moves higher in the sky. By midsum-mer, rising air over the continent draws in moist winds from theIndian Ocean. This brings much needed rain to the Indian sub-continent. The rains allow farmers to grow crops. Some years thesummer monsoon winds are very weak and the rains come late, ornot at all. This causes crop failures and economic hardship for themillions of people who depend on the rain brought by the sum-mer monsoon. Figure 21-13 is a simplified map of the seasonalchanges in wind direction over India called monsoons.
CHAPTER 21: AIR PRESSURE AND WINDS ● 511
High-pressureregion
(cold air)Low-pressure
region(warm air)
HL
Drywinds
Moistwinds
Winter Monsoon Summer Monsoon
FIGURE 21-13. Seasonal changes in temperature and atmospheric pressureover the continent of Asia result in seasonal winds called monsoons. Rainfallin India depends on these seasonal changes.
512 ● UNIT 7: THE DYNAMIC ATMOSPHERE
New York State does not have dramatic seasonal changes in winddirection and precipitation. However, the southwestern desert of theUnited States does have monsoons. In spring and early summer,conditions are dry. At the end of the summer, these conditions arereplaced by moist winds and occasional thunderstorms.At that time,winds bring moisture off the Pacific Ocean and into the deserts.
Jet Streams
Jet streams are wandering currents of air high above Earth’s sur-face. They were discovered during the Second World War. At thattime, pilots of high-altitude aircraft found they were travelingmuch slower or faster than their air speed indicated. Today, pilotswill sometimes change their flight paths to catch fast tail winds, orto avoid fighting head winds.
Jet streams circle the globe, usually in the middle latitudes.Their wind speeds can be greater than 160 km/h (100 mph). Jetstreams seldom follow surface winds. These high-altitude windsusually occur where cold polar air meets warmer air in the mid-latitudes. They circle the globe from west to east, usually in theupper part of the troposphere.
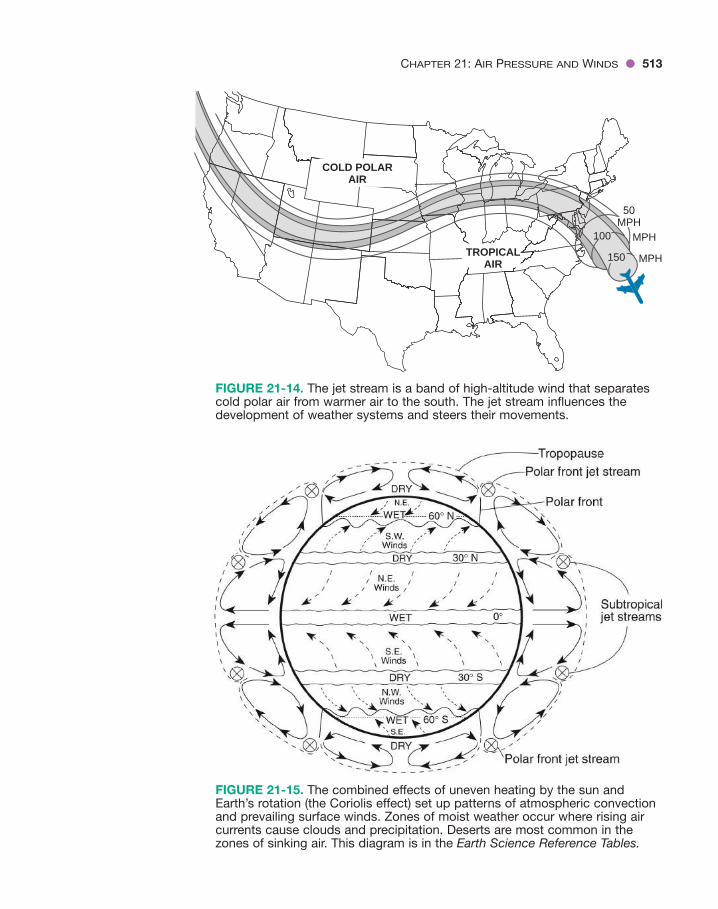
Meteorologists need to know the location and speed of the jetstreams. These winds influence the development and movementsof storm systems. Figure 21-14 shows the typical path of the jetstream crossing the United States from west to east.
The path of the jet stream changes as it meanders around theglobe. In fact, two jet streams sometimes develop in the NorthernHemisphere. They tend to occur at the northern and southernlimits of the zone of prevailing westerly winds. Figure 21-15 istaken from the Earth Science Reference Tables. It is a generalization ofthe pattern of winds on our planet at the time of an equinox. Thisdiagram shows the large convection cells responsible for prevail-ing surface winds at various latitudes. Notice how the jet streams(shown by the symbol �) generally occur in the regions betweenthe circular convection cells.
Notice in Figure 21-15 that rising and sinking air currents cre-ate wet and dry zones at particular latitudes. Where the air is ris-ing, such as along the equator, the cooling of warm, moist aircreates clouds and precipitation. (Remember that air expands as itrises and air pressure is reduced. Expansion often cools air belowthe dew point.) Most of the world’s deserts are located approxi-
CHAPTER 21: AIR PRESSURE AND WINDS ● 513
100
150
50MPH
TROPICALAIR
COLD POLARAIR
MPH
MPH
FIGURE 21-15. The combined effects of uneven heating by the sun andEarth’s rotation (the Coriolis effect) set up patterns of atmospheric convectionand prevailing surface winds. Zones of moist weather occur where rising aircurrents cause clouds and precipitation. Deserts are most common in thezones of sinking air. This diagram is in the Earth Science Reference Tables.
FIGURE 21-14. The jet stream is a band of high-altitude wind that separatescold polar air from warmer air to the south. The jet stream influences thedevelopment of weather systems and steers their movements.

514 ● UNIT 7: THE DYNAMIC ATMOSPHERE
mately 30° north and south of the equator in zones of high pres-sure. This is where sinking air currents warm as they fall throughthe atmosphere. In these areas, the relative humidity at the surfacetends to be low. According to Figure 21-15, the prevailing wind di-rection is from the southwest in New York State.
Isobaric Maps
Meteorologists draw isolines called isobars on maps. The idea issimilar to topographic contour lines that you read about in Chapter3, but isobars connect points that have the same air pressure. Theyuse isobaric maps to identify weather patterns and predict weather.These maps are based on measurements of barometric (air) pres-sure taken throughout a large geographic region, such as the 48continental United States. Figure 21-16 is a simplified isobaric map.
Meteorologists use the following principles to infer winds froman isobaric map.
1. Winds blow out of high-pressure areas and into low-pressure areas.
2. Due to the Coriolis effect, in the Northern Hemisphere,winds circulate clockwise as they diverge from highs. Theycirculate counterclockwise as they converge into the lows.
HH
L
L
1032
1024
1024
1040
1032
1032
1040
10001024 1024
1016
1016
1016
10161008 1008
1008
1008
1000
FIGURE 21-16.Isobars (a type ofisoline) connect places with the sameatmospheric pressureand identify areas ofhigh and low pressure.The numbers on theisobars representbarometric pressure in millibars.

CHAPTER 21: AIR PRESSURE AND WINDS ● 515
3. Winds are the fastest where the pressure gradient is greatest.This is illustrated on the map in Figure 21-1 on page 496.The fastest winds are in New England, and the far West isrelatively calm.
STUDENT ACTIVITY 21-6 —SURFACE WIND PATTERNS
Using a copy of Figure 21-16, draw arrows to represent the sur-face winds at the time this map was drawn. The arrows should
show wind directions throughout the map region. Also indicate rel-ative wind speeds by the length of the arrows. (Do not write in yourbook.)
CHAPTER REVIEW QUESTIONS
Part A
1. What causes the Coriolis effect?
(1) Earth’s tilt on its axis(2) the spin of Earth on its axis(3) the orbital motion of the moon around Earth(4) the orbital motion of Earth around the sun
2. Which diagram below best shows the correct pattern of surface winds around aNorthern Hemisphere high-pressure system?
3. Surface winds blow from places of
(1) higher temperature to lower temperature(2) higher air pressure to lower air pressure(3) higher latitude toward lower latitude(5) higher elevation toward lower elevation
6: MODELS 26: MAGNITUDE ANDSCALE 3

4. Which weather condition most likely determines wind speeds at Earth’s surface?
(1) visibility changes(2) amount of cloud cover(3) dew point differences(4) air-pressure gradient
5. Which map below best represents the surface wind pattern around high- andlow-pressure systems in the Northern Hemisphere?
Base your answers to questions 6 and 7 on the weather map below, which showsisobars associated with a low-pressure center east of Poughkeepsie, New York.
516 ● UNIT 7: THE DYNAMIC ATMOSPHERE

6. Which city is most likely experiencing winds of the highest wind velocity?
(1) New York City(2) Binghamton(3) Poughkeepsie(4) Scranton
7. Surface winds are most likely blowing from
(1) Binghamton toward Danbury(2) Poughkeepsie toward Scranton(3) Danbury toward New York City(4) Port Jervis toward Binghamton
8. Under what conditions would the wind blow from the water toward the shoreof Lake Ontario?
(1) at 2 A.M., when the air over land is 70°F and the air over the lake is 80°F(2) at 6 A.M., when the air over land is 70°F and the air over the lake is 70°F(3) at 2 P.M., when the air over land is 80°F and the air over the lake is 70°F(4) at 10 P.M., when the air over land is 70°F and the air over the lake is 72°F
9. On a windless day, the air temperature inside a house is 18°C, while the outsidetemperature is 10°C. When a window is opened, which diagram best representsthe most likely air circulation pattern?
10. Which weather variable is a direct result of the force of gravity on Earth’satmosphere?
(1) barometric pressure(2) cloud cover(3) relative humidity(4) atmospheric transparency
CHAPTER 21: AIR PRESSURE AND WINDS ● 517

518 ● UNIT 7: THE DYNAMIC ATMOSPHERE
Part B
Base your answers to questions 11 through 13 on the map below, which showsEarth’s planetary wind belts.
11. The curving of planetary winds is the result of
(1) Earth’s gravitation pulling on the moon(2) unequal heating of the atmosphere(3) unequal heating of Earth’s surface(4) Earth’s rotation on its axis
12. Which wind belt has the greatest effect on the climate of New York State?
(1) prevailing northwesterlies(2) prevailing southwesterlies(3) northeast trades(4) southeast trades
13. Which climatic conditions exist near the equator where the trade winds occur?
(1) cool and wet (3) warm and wet(2) cool and dry (4) warm and dry
14. The table below shows air-pressure readings taken at noon in two cities 100 miapart.
Air Pressure Readings
Day City A Air Pressure (mb) City B Air Pressure (mb)
1 1004.0 1004.0
2 1000.1 1002.9
3 1002.2 1011.1
4 1010.4 1012.3
On which day was the wind speed between the two cities the greatest?
(1) 1 (2) 2 (3) 3 (4) 4

CHAPTER 21: AIR PRESSURE AND WINDS ● 519
15. What is the most common wind direction 15° south of Earth’s equator?
(1) northwest (3) southwest(2) northeast (4) southeast
Part C
16. Describe the pattern of regional surface winds around the center of a low-pres-sure system in the Northern Hemisphere.
Base your answers to questions 17 and 18 on the barogram below, which showsthe atmospheric pressure recorded in 1982 in Green Bay, Wisconsin.
17. Calculate the rate of change in air pressure from 10 A.M. to 8 P.M. on April 3.Label your answer with the correct units.
18. What most likely caused the changes in air pressure for the time period shownon this graph?
Time
Air
pre
ssu
re (
mb)
Key
M � Midnight
�
�

19. The diagram below represents a view of part of the rotating earth as observedfrom directly above the North Pole. Use a copy of this map to draw a curvedarrow starting at point B to show the general direction of surface winds in thezone from 30°N to 60°N.
20. Why does atmospheric pressure usually decrease when humidity increases?
520 ● UNIT 7: THE DYNAMIC ATMOSPHERE
• 521 •
Weather Maps
C H A P T E R
22WORDS TO KNOW
air mass front source region
anticyclone maritime air mass station model
arctic air mass mid-latitude cyclone stationary front
cold front occluded front tropical air mass
continental air mass polar air mass warm front
cyclone polar front
This chapter will help you answer the following questions:1 How do we identify air masses?2 In what ways do mid-latitude cyclones and anticyclones
influence our weather?3 What are the different types of weather fronts?4 Why do cyclones form?5 How can many forms of weather data be shown on the same
maps?6 How do weather maps help meteorologists?
WEATHER FORECASTING
“Everybody talks about the weather but no one does anythingabout it.” This statement comes from the author Mark Twain. Itmeans that while weather affects us, we cannot change the weather.
4: 2.1c4: 2.2c

For many centuries, people depended on their limited understand-ing of weather to forecast weather events. “Red sky at night, sailorsdelight. Red sky in the morning, sailors take warning.” These state-ments are based on the observation that a buildup of clouds in themorning is common before a storm. However, observations at onelocation may not give enough information to make forecasts accu-rate for more than a few hours into the future.
Weather forecasting improved near the end of the nineteenthcentury. The telegraph and radio increased communication be-tween areas. People could learn about weather conditions in otherareas. At the same time, the science of meteorology began to ex-plain how regional weather systems develop.
In the second half of the twentieth century, meteorologistsbegan to use computers, which quickly analyzed huge amounts ofdata. Meteorologists then had more data and mathematical mod-els of the atmosphere. They hoped that these advances wouldgreatly extend their forecasting ability. Some expected accurateweather predictions for weeks or even months into the future. Al-though forecasting has certainly become better, the level of accu-racy they hoped for has not been reached. However, computeranalysis has greatly improved short-term weather forecasts. In ad-dition, weather satellites and regional radar allow meteorologiststo see the broad scope of weather systems.
Scientists have learned that nature is not as predictable as theyhad hoped. The atmosphere is a complex, fluid system. Withinthat system, tiny changes grow to major importance through time.The atmosphere and its motions are too complex to permit accu-rate long-range forecasting. Visit the following Web site to see thecurrent weather radar for the United States: http://www.intellicast.com/Local/Default.aspx?redirectUrl�/Local/Weather.aspx&country�United%20States
WHAT ARE AIR MASSES?
When a large body of air stays over a region, it takes on the tem-perature and humidity characteristics of the region. An air massis a body of air that is relatively uniform in temperature and hu-midity. Meteorologists describe air masses by their temperatureand humidity. These variables influence other weather variables.
4: 2.1e, 2.1f, 2.1h
522 ● UNIT 7: THE DYNAMIC ATMOSPHERE

For example, temperature and humidity affect air density. Wherethe air is cold and dry, barometric pressure is likely to be high. Theair-pressure gradient affects winds. Where the gradient is steep,the winds are strong. Humidity affects cloud cover and precipita-tion. Therefore, when meteorologists describe an air mass by itstemperature and humidity, they suggest other weather variablesas well.
Source Regions
If you know the temperature and humidity of an air mass, you caninfer the area over which it originated. This is the source region.For example, central Canada is most likely the source region of acold, dry air mass moving from west to east across New York State.In central Canada, there is relatively little open water and the tem-peratures are cooler. A warm, moist air mass most likely originatedover the South Atlantic Ocean or the Gulf of Mexico. This kind ofair mass is likely to bring lower air pressure with clouds and pre-cipitation. Figure 22-1 shows the source regions for air massesthat move into the United States.
CHAPTER 22: WEATHER MAPS ● 523
FIGURE 22-1. This map shows theprincipal source regions for air massesthat affect New York State. Note that thecharacteristics of an air mass aredetermined by the prevailing weatherconditions in the region over which itoriginates.

524 ● UNIT 7: THE DYNAMIC ATMOSPHERE
DESCRIBING HUMIDITY The terms continental and maritime de-scribe the humidity of an air mass. Continental air masses haverelatively low humidity. They originate over land. Maritime airmasses have relatively high humidity. They originate over theocean or another large body of water. (The term maritime refers tothe oceans or human activities associated with oceans.)
DESCRIBING TEMPERATURE The terms tropical, polar, and arc-tic define the temperature characteristics of an air mass. Tropicalair masses are warm. They originate close to the equator. Polarair masses are cool. They originate near one of Earth’s poles.When an especially cold air mass that originated in the Arcticenters the United States from Canada, meteorologists call this anarctic air mass.
Air Mass Codes
Each type of air mass has a unique two-letter code that is made ofa lowercase letter followed by a capital letter. These codes are listedin the Earth Science Reference Tables. Five air mass types are listedbelow along with their most common North American sourceregions.
mT maritime tropical: A warm, moist air mass that probably camefrom the South Atlantic Ocean or the Gulf of Mexico.
cT continental tropical: A warm, dry air mass that may have origi-nated in the deserts of the American Southwest or the landregions of Mexico.
mP maritime polar: A cold, moist air mass that most likely movedin from the northern parts of the Atlantic or Pacific Ocean.
cP continental polar: A cool and dry air mass that most likelyentered the United States from Canada.
cA continental arctic: An unusually cold and dry air mass fromArctic Canada.
Note that the first letter, indicating humidity, is lowercase,while the second letter, which designates temperature, is capital-ized. These codes are also shown in Figure 22-1 on page 523.

CHAPTER 22: WEATHER MAPS ● 525
STUDENT ACTIVITY 22-1 —IDENTIFYING AIR MASSES
Use weather maps from a newspaper or from the Internet toidentify different air masses entering the United States and
infer their source regions. You may decide to use temperature iso-line (isotherm) maps to help you locate regions with relatively uni-form temperatures.
WHAT ARE MID-LATITUDE CYCLONES AND ANTICYCLONES?
The term cyclone has many meanings, even in meteorology. In gen-eral, a cyclone is a region of relatively low atmospheric pressure.Hurricanes in the Indian Ocean are often called cyclones. It alsois used as a synonym for tornado. Hurricanes and tornadoes areintense low-pressure weather events. In this chapter you will learnabout mid-latitude cyclones. These are areas of low-pressure orstorm systems, such as those that usually move west to east acrossthe continental United States.
When air is heated or when moisture is added, the air becomesless dense. This results in lower barometric pressure and causesthe air to rise. Rising air is part of heat flow by convection. Risingair pulls air from all sides into the low-pressure center.
A low-pressure system is a cyclone. A high-pressure system isthe opposite of a low-pressure system. Therefore a high-pressuresystem is an anticyclone. Anticyclones usually bring clearweather. Within an anticyclone, cool, dry air descends and spreadsover the surface. Anticyclones do not pull in air masses. A high-pressure system is a single, spreading air mass that generally cov-ers the surface with cool, dry, and stable fair weather.
Remember, while winds generally blow from high-pressureareas to low-pressure areas, the Coriolis effect makes them appearto curve along Earth’s moving surface. Consequently, winds seemto curve to the right moving out of a high-pressure zone.Then theyturn left into a cyclone. You will see this wind pattern around allmid-latitude cyclones in the Northern Hemisphere. (In the South-ern Hemisphere, winds curve left when moving out of a high-pressure zone and turn right into a cyclone.)
4: 2.1c, 2.1e, 2.1h4: 2.2b
6: MODELS 26: PATTERNS OFCHANGE 5

Figure 22-2 is a weather map of the United States that showsthe location of three air masses in the winter. The boundaries, orinterfaces, where air masses meet are weather fronts. Fronts sep-arate one air mass from another. Weather changes occur rapidlyalong fronts as one air mass replaces another. You will learn aboutthe symbols on the fronts later. Remember that winds divergefrom a high-pressure center and circulate counterclockwise asthey converge into the center of the low. The triangles and half cir-cles along the front lines indicate the direction in which the frontis moving.
HOW ARE WEATHER FRONTS IDENTIFIED?
Like other interfaces in nature, energy is exchanged along fronts.Weather changes generally occur along fronts. For example, stormyweather is usually associated with the passage of fronts and strongcyclonic systems. Meteorologists keep track of weather fronts as
4: 2.1c, 2.1g, 2.1h
526 ● UNIT 7: THE DYNAMIC ATMOSPHERE
FIGURE 22-2. The three air masses on this weather map are separated byinterfaces called fronts. The symbols on the frontal lines show the direction ofwind movement, spreading outward from the high and converging in acounterclockwise circulation around the cyclone (low). The arctic air massfollowing the polar mass identifies this as a winter weather map.

they observe and forecast weather over broad regions. Meteorolo-gists identify four kinds of weather fronts: cold fronts, warm fronts,stationary fronts, and occluded fronts.
Figure 22-3 from the Earth Science Reference Tables shows thestandard symbols used to label fronts on weather maps. For exam-ple, triangular points on the south side of the front line representa cold front moving south. The “swirl” symbol on the right side ofFigure 22-3 is used to mark the center of a hurricane.
Cold Fronts
Cold fronts are so named because they bring cooler tempera-tures. Figure 22-4 is a three-dimensional view of a cold front. Be-cause cold air cannot absorb as much moisture as warm air, it isalso likely to be less humid. Cold and dry air is more dense than
CHAPTER 22: WEATHER MAPS ● 527
FIGURE 22-3.Weather mapsymbols from theEarth ScienceReference Tables.
Cold front
Warmair
Coldair
FIGURE 22-4. When a coldfront passes, cold, denseair wedges under warmerair, pushing it upward. Therising air often causes cloudformation and precipitationalong the front. Followingthe passage of a cold front,the weather is cooler andusually dryer. On weathermaps, cold fronts arelabeled with trianglespointed to show thedirection in which the frontis moving.
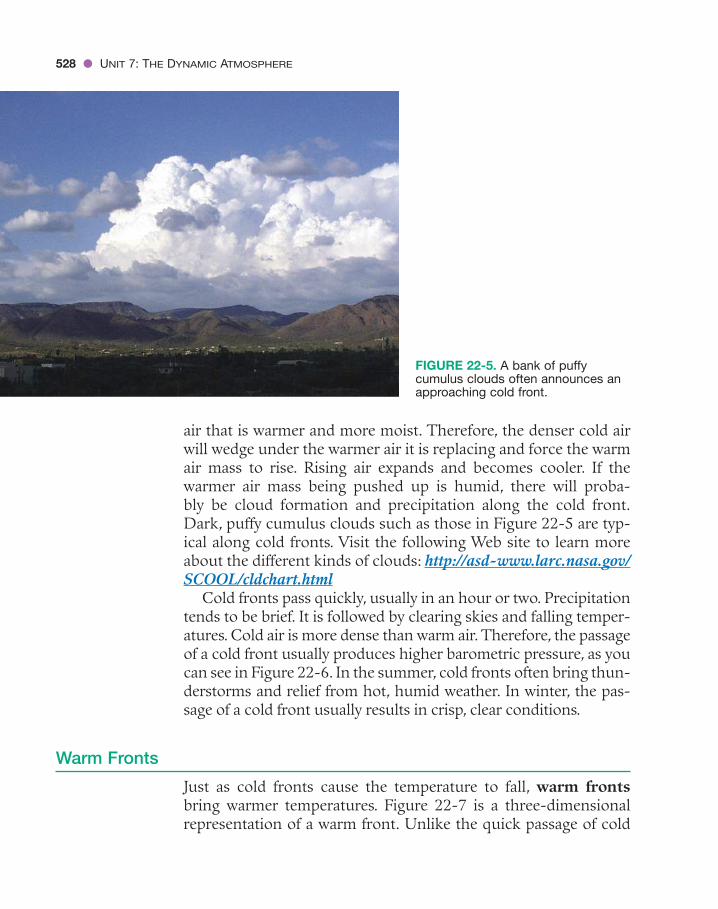
air that is warmer and more moist. Therefore, the denser cold airwill wedge under the warmer air it is replacing and force the warmair mass to rise. Rising air expands and becomes cooler. If thewarmer air mass being pushed up is humid, there will proba-bly be cloud formation and precipitation along the cold front.Dark, puffy cumulus clouds such as those in Figure 22-5 are typ-ical along cold fronts. Visit the following Web site to learn moreabout the different kinds of clouds: http://asd-www.larc.nasa.gov/SCOOL/cldchart.html
Cold fronts pass quickly, usually in an hour or two. Precipitationtends to be brief. It is followed by clearing skies and falling temper-atures. Cold air is more dense than warm air. Therefore, the passageof a cold front usually produces higher barometric pressure, as youcan see in Figure 22-6. In the summer, cold fronts often bring thun-derstorms and relief from hot, humid weather. In winter, the pas-sage of a cold front usually results in crisp, clear conditions.
Warm Fronts
Just as cold fronts cause the temperature to fall, warm frontsbring warmer temperatures. Figure 22-7 is a three-dimensionalrepresentation of a warm front. Unlike the quick passage of cold
528 ● UNIT 7: THE DYNAMIC ATMOSPHERE
FIGURE 22-5. A bank of puffycumulus clouds often announces anapproaching cold front.

fronts, warm fronts may take a day or two to pass through. Warmair is lighter and less dense than cold air, so warm air does nothave as much ability to push aside cold air. As a result, the warmair drags the cold air mass. Therefore, the warm front movesslower than the cold front. A wedge of warm air rides up and overthe air mass it is replacing. You can predict the approach of a warmfront when you see high, thin cirrus clouds that gradually becomethicker and lower. As the warm front approaches, stratus clouds
CHAPTER 22: WEATHER MAPS ● 529
FIGURE 22-7. A wedge ofwarm air forced up overcooler air exerts the gentlepush of a warm front.Meteorologists label warmfronts with half circlesdrawn on the advancingside of the front.
Warm air
Warm front
Coldair
FIGURE 22-6. The passage of a strong cold front can bring a rapid drop inboth temperature and dew point. Air pressure tends to decrease as the low-pressure center approaches and then increase quickly with the arrival of thecold air mass.

• 530 •
cover the sky like a blanket. Figures 22-8 and 22-9 show cloudsthat may appear as a warm front approaches.
Rising air along the warm front often produces thick layeredclouds and gentle but long-lasting precipitation. As the frontpasses, the temperature gradually increases. More humid condi-tions commonly follow the frontal interface, as well. Warm air isless dense than cool air. Therefore, atmospheric pressure generallydecreases with the passage of a warm front. On weather maps, halfcircles along the front line indicate advancing warm air.
Look again at the weather map in Figure 22-2 on page 526. Itshows two cold fronts and a warm front. The cold front that ex-tends southwest from the low-pressure center is the advancingedge of a cold, polar air mass. The second cold front moving south
FIGURE 22-8. High thin cirrusclouds like these sometimessignal an approaching warmfront.
FIGURE 22-9.As you learned in Chapter 5, strata are layers.Thickening stratusclouds like theseoften indicate anapproaching warmfront.

from Canada defines an outbreak of especially cold arctic air.Meanwhile, circulation about the low is drawing in a warm airmass and slowly pushing a warm front to the north over the east-ern seaboard.
Occluded Fronts
Because cold fronts move faster than warm fronts, a cold frontsometimes overtakes a warm front. When this happens, the inter-face between warm and cold air masses is pushed off the groundand up into the atmosphere. The body of warm air is held up bytwo cooler air masses that merge beneath it. This is called an oc-cluded front, as shown in Figure 22-10.
Passage of an occluded front produces cloudy weather. It mayor may not bring precipitation. The warm air-cold air interface isisolated above the surface. Therefore, as an occluded front passes,people at ground level might not notice a change in temperature.On a weather map, alternating triangles and half circles show thedirection in which an occluded front is moving.
Stationary Fronts
The word stationary means not moving. Stationary fronts can re-main in one location, keeping skies cloudy for hours or even days.The eventual direction of movement of the frontal interface is dif-
CHAPTER 22: WEATHER MAPS ● 531
Coldair
Less coldair
Warm air wedgeraised off ground
Occluded front
FIGURE 22-10. When acold front overtakes a warmfront, the cooler air massespush the whole warm masshigh above Earth’s surface.This is an occluded front.

ficult to predict. Therefore, temperature changes along the frontare not as predictable as they are when a cold or a warm frontpasses through. Winds blow in opposite directions on either sideof the front, as shown in Figure 22-11.
On a weather map, triangles and half circles are drawn on oppo-site sides of the front. A stationary front can become a warm frontif it advances toward the side of the half circles. If the stationaryfront advances toward the triangles, it becomes a cold front.
The Polar Front
The polar front is the boundary between two great convectioncells. You can see it on the Planetary Wind and Moisture Beltschart in the Earth Science Reference Table and Figure 21-15 on page513. The polar front is also the most common path of the upperatmosphere polar jet stream. The jet stream begins the formationof mid-latitude cyclones and steers them across Earth’s surface.When the polar front moves south, it advances as a cold front.When moving to the north, it becomes a warm front. In theory,the polar front is a continuous boundary. It circles Earth at thenorthern edge of the zone of prevailing westerly winds. However,the polar front is not very stable and it is often broken apart by cy-clonic circulation.
532 ● UNIT 7: THE DYNAMIC ATMOSPHERE
Warmair
Coldair
Stationary front
FIGURE 22-11. Windsblowing in oppositedirections on opposite sidesof an interface between airmasses often characterize astationary front.
In the summer, the polar front is usually located north of NewYork State. In warm weather, New York is more often affected byweather systems that develop along the subtropical jet streams atlower latitudes. However, in the winter, the global wind belts shiftto the south. This brings the polar front closer to New York. Out-breaks of arctic air push the polar front southward through NewYork, bringing winter storms. In spring, the polar front returns toarctic Canada as summer weather patterns settle in.
HOW DO MID-LATITUDE CYCLONES EVOLVE?
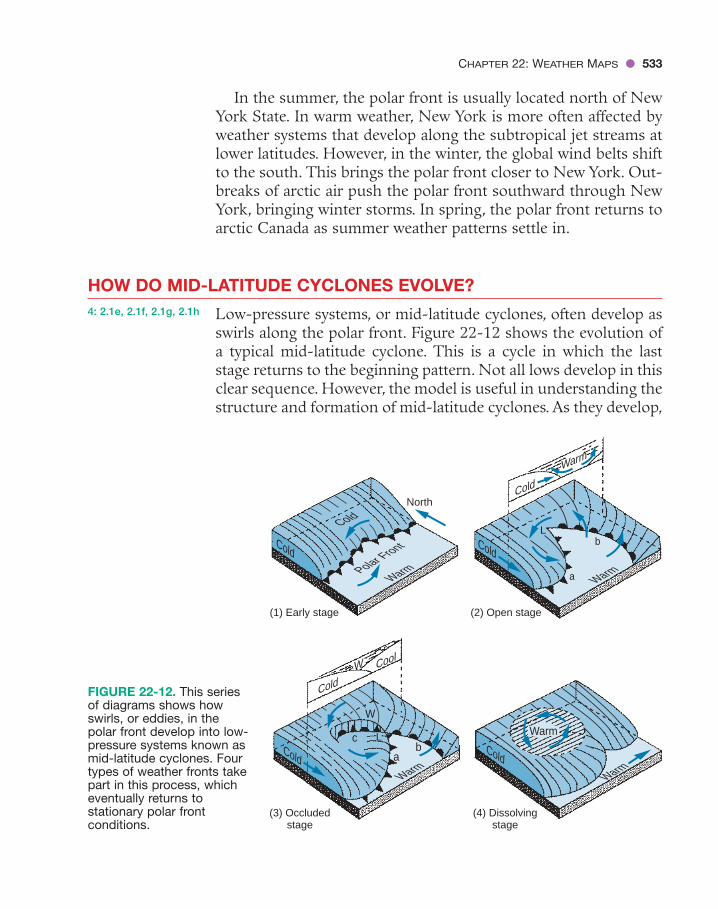
Low-pressure systems, or mid-latitude cyclones, often develop asswirls along the polar front. Figure 22-12 shows the evolution ofa typical mid-latitude cyclone. This is a cycle in which the laststage returns to the beginning pattern. Not all lows develop in thisclear sequence. However, the model is useful in understanding thestructure and formation of mid-latitude cyclones. As they develop,
4: 2.1e, 2.1f, 2.1g, 2.1h
CHAPTER 22: WEATHER MAPS ● 533
Cold
Cold
Cold
Cold
Warm
Warm
Warm
Cold
Polar Front
North
(1) Early stage
(3) Occludedstage
(4) Dissolvingstage
(2) Open stage
Cold
Cold
Warm
W Cool
b
a
W
cb
a
L
L
Warm
Warm
FIGURE 22-12. This seriesof diagrams shows howswirls, or eddies, in thepolar front develop into low-pressure systems known asmid-latitude cyclones. Fourtypes of weather fronts takepart in this process, whicheventually returns tostationary polar frontconditions.

low-pressure systems seldom stay in one place. They generallymove with the prevailing winds. In the United States, most low-pressure systems move across the country toward the east ornortheast. For this reason, people sometimes say that if you wantto know tomorrow’s weather in New York, look at today’s weatherin the Midwest.
The early stage (1) shows the polar front as a stationary front.Winds blowing in opposite directions along the front create fric-tion at the interface. A swirl starts to develop. In the open stage (2),winds moving toward the front change the stationary front to acold front at a and to a warm front at b. The symbols for these twokinds of fronts match the key to front symbols in the Earth ScienceReference Tables. The profile above diagram (2) shows cold air start-ing to push up the warm air mass. The third stage (3) is the oc-cluded stage. The cold front is overtaking the slower-movingwarm front. The profile above shows the warm air now pushedcompletely up above the front. In the dissolving stage (4), thewarm air eventually loses its identity as it mixes with the airaround it. Although this is the final stage of the mid-latitude cy-clone, a stationary front is forming, which returns to first-stageconditions.
These diagrams do not show cloud formation and precipitation.Wherever warm, moist air is pushed upward, expansion and cool-ing cause clouds and precipitation. This occurs primarily alongthe fronts.
STUDENT ACTIVITY 22-2 —STAGES OF CYCLONIC DEVELOPMENT
Find weather maps from newspapers or other media sources to il-lustrate each of the four stages of cyclonic development shown
in Figure 22-12. Label each stage with the correct name.
HOW ARE WEATHER DATA SHOWN ON WEATHER MAPS?
To draw regional weather maps, meteorologists begin by collect-ing weather data. These data come from a wide network of land-based weather stations as well as from observations made on shipsat sea. On the map, meteorologists group the information around
4: 2.1c, 2.1g
4: 2.1g6: MODELS 26: PATTERNS OFCHANGE 5
534 ● UNIT 7: THE DYNAMIC ATMOSPHERE

a circle that indicates where the measurements were made. Theyuse a standard system to display abbreviated weather data. This iscalled the station model. They indicate the time of these simul-taneous measurements somewhere on the weather map. It is im-portant to know how to interpret the information from the stationmodels. Therefore, meteorologists follow certain rules.
Interpreting Weather Data
The first rule is that each weather variable has a unique positionaround a circle that indicates the location of the weather station.For example, barometric pressure in millibars is always indicatedas a three-digit number above and to the right of the circle. Thedew-point temperature in degrees Fahrenheit is always found atthe lower left. Figure 22-13 is the weather station model printedin the Earth Science Reference Tables. It is common for weather sta-tions to leave out some information, often because it is not im-portant. However, the information shown will always occupy thestandard position with respect to the station circle.
CHAPTER 22: WEATHER MAPS ● 535
FIGURE 22-13.Meteorologists usea system ofplacement andcoding to show avariety of weatherobservations ateach location on aweather map.

536 ● UNIT 7: THE DYNAMIC ATMOSPHERE
AIR TEMPERATURE Also known as dry-bulb temperature, airtemperature on a station model is always recorded in degreesFahrenheit. You can convert this temperature to Celsius using thetemperature conversion scale on the same page of the Earth Sci-ence Reference Tables as the station model. (For example, the 28°Fshown here is approximately �2°C.)
PRESENT WEATHER This indicates conditions such as precipi-tation or limited visibility. Symbols used to indicate the presentweather are shown in the box below the station model. The UnitedStates Weather Service uses many more symbols than you will findin the Earth Science Reference Tables. The station model in Figure22-13 shows that it was snowing at the time of the observations.
VISIBILITY The visibility is the greatest distance, measured inmiles, at which objects can be identified. Precipitation, fog, or hazereduce visibility. In Figure 22-13, the half-mile limit of visibility isprobably caused by snowfall.
DEW POINT You may recall that the dew point is the tempera-ture at which the air would be saturated. Although dew point is atemperature, it used here as an indicator of the absolute humid-ity. In this station model, the dew point of 27°F is very close to theair temperature of 28°F. This indicates a high relative humidity,which is not surprising because it is snowing.
WIND DIRECTION A line connected to the circle indicates winddirection. Just as north is at the top of most maps, these symbolsfollow the standard compass directions. Think of the circle as thehead of an arrow. In this case, the wind is blowing out of thesouthwest. (Wind, you will recall, is always named according tothe direction from which it comes.) A line extending directly abovethe circle would indicate a north wind.
WIND SPEED The small lines at the end of the wind directionindicator are called feathers. Wind speeds are rounded to thenearest 5 knots. (As printed on the chart, 1 knot is 1.15 mph.) Ahalf feather indented a short distance from the end of the winddirection line indicates a 5-knot wind. A 10-knot wind is shown

CHAPTER 22: WEATHER MAPS ● 537
by a single feather at the end of the wind direction line. Twofeather lines of equal length would indicate a 20-knot wind. Thisexample shows a 15-knot wind. A circle surrounding the weatherstation dot indicates a calm area on the weather map. In this way,a calm area is not mistaken for a station in which the data ismissing.
CLOUD COVER The amount of the circle that is dark indicatesthe portion of the sky covered by clouds. The example shows thatthe sky is mostly cloudy (75% covered). A circle that is all whitein the center represents a clear sky.
AIR PRESSURE Air pressure is reported by a three-digit codenumber. Normal barometric pressure at Earth’s surface is gen-erally about 1000 millibars (mb). The first digit or the first twodigits (9 or 10) of the air pressure reading are not shown. Further-more, barometric readings are recorded to the nearest tenth of amillibar. Follow the rules below to interpret air pressure codes.
Rule 1: If the three-digit code is less than 500, add a “10” at thebeginning and a decimal point before the last number. For exam-ple, if the barometric pressure were listed as 162, this would trans-late to 1016.2 mb.
Rule 2: If the three-digit code is more than 500 add a “9” beforethe number and a decimal before the last digit. For example 884would become 988.4 mb. Do whichever procedure brings youcloser to 1000 mb. If you do not get a value close to 1000 mb youhave probably decoded the number incorrectly. The barometricpressure indicated in Figure 22-13, on page 535, is 1019.6 mb.
PRECIPITATION The amount of rain or snow in the past 6 h issometimes shown. In Figure 22-13, the weather station has re-ceived an amount of snow equivalent to one-quarter of an inch(0.25) of rainfall. (Precipitation on a station model is always shownas its liquid water equivalent.)
BAROMETRIC TREND Rising air pressure usually brings clear-ing weather. Stormy weather is more likely if the atmosphericpressure is falling. The symbol “�” indicates rising air pressureand the symbol “–” indicates falling air pressure over the past 3 h.

538 ● UNIT 7: THE DYNAMIC ATMOSPHERE
The number is in millibars and tenths of millibars. (You need toinsert a decimal between the two numbers.) Next to the two-digitnumber is a line indicating the pattern of change. The data shownin Figure 22-13 indicates a steady rise of 1.9 mb in the last 3 h.
Note: There is a guide to the placement on this information, aswell as how to interpret weather station data, in the Earth ScienceReference Tables.
SAMPLE PROBLEMS
Problem 1 What weather conditions does the station model shown in Figure22-14 indicate?
FIGURE 22-14.
Solution This station model indicates a temperature of 68°F and a dew point of 65°F. Hail is falling. The barometric pressure is996.4 mb. Winds are from the east at 5 knots. There has been aninch of rain in the past 6 h. The sky is half (50%) covered withclouds.
Problem 2 Draw a station model to represent the following conditions:Temperature and dew point are 62°F, and there is fog. Visibility isone-tenth of a mile. Winds are from the west at 10 knots. The airpressure is 1002.0 mb and it has gone down steadily by 0.9 mb inthe past 3 h. Cloud cover is 25 percent.
Solution Figure 22-15 shows these conditions. The fog symbol andvisibility fraction can be shown above or below the wind directionline. The feather indicating wind speed can slant up or down.Otherwise the numbers and symbols must be in the positionsshown in the figure.
FIGURE 22-15.
62
62
020–09\1
10
68
65 1.0
964

CHAPTER 22: WEATHER MAPS ● 539
STUDENT ACTIVITY 22-3 —CURRENT STATION MODELS
Create several station models to describe your local weather condi-tions as recorded at a particular time of day over a period of sev-
eral days. (Your teacher will tell you how long.) You can gather weatherdata from online sources or from your own weather instruments.
HOW ARE WEATHER MAPS DRAWN AND USED?
You have already seen several weather maps used to illustrate windpatterns and air masses. In this section, you will learn how to drawa weather map. In addition, you will learn how weather maps areused to predict the weather. Weather includes many variables(temperature, air pressure, humidity, wind, sky conditions, andprecipitation). Meteorologists find it useful to show many of thesefactors over a wide geographic area. A map that combines severalweather variables is called a synoptic map because it shows a sum-mary, or synopsis, of weather conditions.
Gathering Data
Remote sensing has become a standard observation techniqueavailable to meteorologists. Remote sensing is the use of instru-ments to gather information at a distance from the instrument.
4: 2.1c, 2.1g6: PATTERNS OFCHANGE 5
4: 2.1g
Problem 3 Draw a station model to indicate a temperature of 20°C, a dewpoint of 11°C, and clear skies.
Solution Temperatures on the station model are always shown in degreesFahrenheit. The temperatures in Sample Problem 3 must beconverted from Celsius to Fahrenheit before they are placed intheir proper positions next to the station circle, as shown inFigure 22-16.
FIGURE 22-16.
68
52

540 ● UNIT 7: THE DYNAMIC ATMOSPHERE
Radar images and photographs from satellites are good examples.You can access current satellite photographs, radar images, andother regional data on the Internet, through a local office of theNational Weather Service, or the National Oceanic and Atmos-pheric Administration (NOAA) of the United States Government.Other organizations such as The Weather Channel, Weather Under-ground, and similar Web sites provide current online weather mapsand images.
STUDENT ACTIVITY 22-4 —DRAWING WEATHER FRONTS
From the Internet, download and print a current satellite weatherimage of a part of the United States. On that image, label the
centers of high- and low-pressure systems. Draw appropriateweather fronts using weather maps or the pattern of developmentyou see. Label air masses by their two-letter codes. Use your draw-ing to predict tomorrow’s weather at your location. One source ofsatellite images is the National Oceanic and Atmospheric Administration:http://www.weather.gov/sat_tab.php?image5ir
Using Weather Data
Professional meteorologists often have years of experience and ac-cess to more information than can be shown on a single weathermap. For example, observations of the jet stream help them pre-dict how weather systems will move. They can also use comput-ers to access how weather changed in the past when similarconditions were in effect. Some of the most powerful computersever built have been used to work with complex equations thatrepresent the atmosphere. Meteorologists sometimes constructmathematical models of the dynamics (changing nature) of the at-mosphere to find how far into the future accurate predictions canbe made. Visit the following Web site to learn how to understandweather maps: http://ww2010.atmos.uiuc.edu/(Gh)/guides/maps/home.rxml
4: 2.1c, 2.1g6: PATTERNS OFCHANGE 5

CHAPTER 22: WEATHER MAPS ● 541
The next day, circle any predictions that were incorrect and recordyour own predictions as well as the media predictions for the fol-lowing day. Continue this procedure for at least a week.
How often do you differ from the media predictions?
What is the percentage of correct predictions for you and for thenews source?
Drawing Weather Maps
Figures 22-17 A through D, on page 542, illustrate how weatherdata is transformed into a weather map. Diagram A shows selectedweather station data. Diagram B shows isobars of air pressure. Di-agram C shows isotherms of temperature. Diagram D is a weathersystem map. Note that isolines are drawn as if the numberswere located at the center of the circles. The pattern of a cyclone
STUDENT ACTIVITY 22-5 —RELIABILITY OF WEATHER FORECASTS
Make a table to record the expected changes in weather condi-tions over a period of a week. See the sample shown below.
You may add more weather factors if you wish. Each day, make yourown (“My”) predictions of how you expect the weather to changethe following day. Also record how these changes are predicted in aparticular news media source.
Name __________________________________________
Week of _________________________________________
2: INFORMATIONSYSTEMS 16: PATTERNS OFCHANGE 5
Monday Tuesday Wednesday Etc. . . .
Changes In My Media My Media My Media
Temperature
Cloud cover
Precipitation
Winds

542 ● UNIT 7: THE DYNAMIC ATMOSPHERE
(A) Station Data (B ) Isobar Map
(C ) Isotherm Map (D) Weather Map
46
49
52 085
12047
60080
65
68003
72
040
131
6556 080
989
48090
∞
09150
120
041
46
49
52 085
1008
1008
1012
1012
1004
1004
1000
12047
60 080
65
68003
72
131
56
48090
∞
09150
46
49
52 085
12047
6068
003
72
131
6556
989
48090
∞
09150
120
041
041
65 989
040
080
120
70
6560
55
50
080
65 040
080
L
mT
cP
FIGURE 22-17. Drawing synoptic weather maps is a step-by-step process.(A) Weather data is collected from weather observers over a geographicregion. The data can be used to draw a weather map. Next (B), the isolines ofbarometric pressure (isobars) are drawn based on the air-pressure datadisplayed at each station. (C) The temperature field is shown with isotherms.(D) The position of the low and the two weather fronts are based on winddirection and other data from the previous maps. Precipitation usually occursalong weather fronts.

(low-pressure system) is apparent from the data and from the cir-culation of winds around the North Carolina station. The changesin temperature and air pressure along with the winds and precip-itation guide the placement of the cold and warm fronts.
Using Weather Maps to Make Predictions
Weather maps are an important tool used by meteorologists inforecasting weather. Figure 22-12 on page 533 shows how low-pressure systems generally develop. They mature and move acrossthe United States from west to east, or toward the northeast. Youcan use current weather maps to make predictions of your localweather for the next day or two. Figure 22-18 is a weather map ofthe United States. Notice how this map can be used to make thefollowing forecasts for these cities:
• New York City Rain will probably end as the warm frontadvancing northward passes through the city. Warmer weatherand partial clearing will occur as a warm, moist air mass slidesover New York. The density of warm, moist air is low; therefore,the barometric pressure will remain low.
CHAPTER 22: WEATHER MAPS ● 543
40
60
70
70
60
5040
3030
80
80
50
New York
City
°F
FIGURE 22-18. Meteorologists use a synoptic weather map to presentinformation about weather conditions over a large region. The map may beused to make local weather forecasts for locations throughout the area.
544 ● UNIT 7: THE DYNAMIC ATMOSPHERE
• Knoxville The cold front approaching from the west will bringrain, followed by cooler and clear weather. The temperature andhumidity will then drop, and barometric pressure will rise as acool, dry air mass moves in with the passage of the cold front.
• Little Rock Cool, dry weather is likely to continue. It will probablybe a few days before the anticyclone (high-pressure system) thatis building into the area no longer dominates local weather.
• Detroit The spell of rainy weather is likely to continue foranother day or so until the low-pressure, storm system movesaway to the east or northeast. Visit the following Web site to seeanimated weather maps that predict national weather for thenext four days: http://www.wunderground.com/modelmaps/maps.asp
CHAPTER REVIEW QUESTIONS
Part A
1. Which type of air mass most likely formed over the deserts of the AmericanSouthwest?
(1) cT (3) mT(2) cP (4) mP
2. A weather station model is shown below.
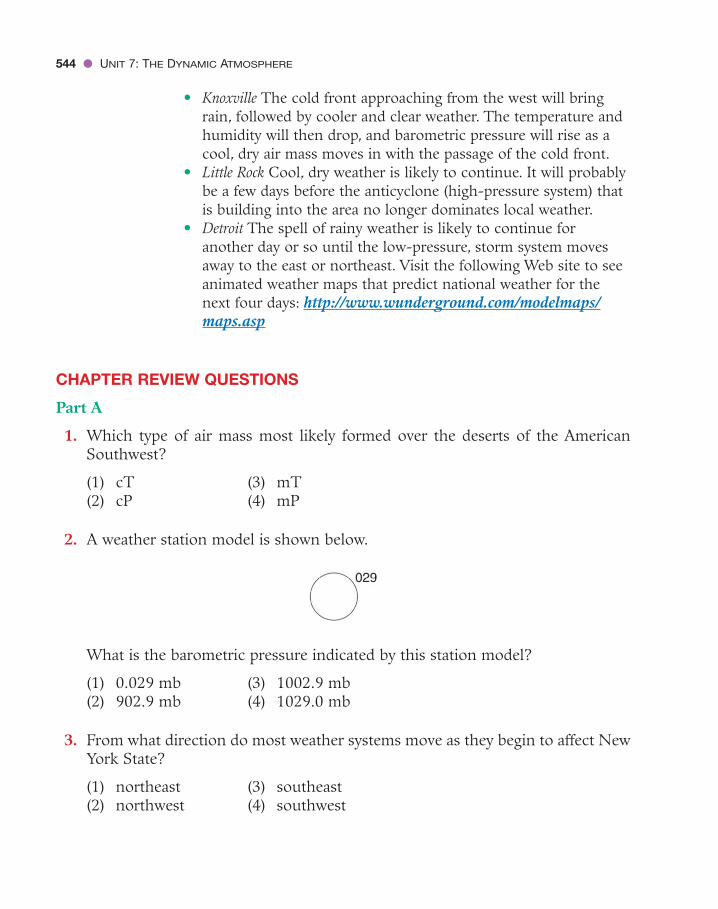
What is the barometric pressure indicated by this station model?
(1) 0.029 mb (3) 1002.9 mb(2) 902.9 mb (4) 1029.0 mb
3. From what direction do most weather systems move as they begin to affect NewYork State?
(1) northeast (3) southeast(2) northwest (4) southwest

CHAPTER 22: WEATHER MAPS ● 545
4. The weather map below shows a strong mid-latitude cyclone moving acrosseastern North America.
What are the most likely weather changes in Boston, Massachusetts over thenext few hours?(1) increasing temperature and increasing air pressure(2) increasing temperature and decreasing air pressure(3) decreasing temperature and increasing air pressure(4) decreasing temperature and decreasing air pressure
5. Which description below best describes high- and low-pressure systems?
(1) A high-pressure system is a cyclone and a low-pressure system is an anti-cyclone.
(2) A low-pressure system is a cyclone and a high-pressure system is an anti-cyclone.
(3) A cyclone includes regions of both low and high pressure.(4) An anticyclone includes regions of both low and high pressure.

6. Why do cold fronts usually travel faster than warm fronts?
(1) cold air is more dense than warm air(2) warm air is more dense than cold air(3) cold fronts bring higher temperatures(4) warm fronts bring lower temperatures
Part B
Base your answers to questions 7 through 9 on the graph below, which showschanges in air temperature and dew point at Dallas, Texas. Symbols below thegraph indicate weather conditions during the time of this graph.
7. Which choice below best describes the weather event that was most likely oc-curring in Dallas at the time indicated?
(1) At 6 P.M., a warm front was passing through.(2) At 11 P.M., a warm front was passing through.(3) At 6 P.M., a cold front was passing through.(4) At 11 P.M., a cold front was passing through.
8. What were the weather conditions in the late morning hours of the first day?
(1) thunderstorms (3) haze(2) fog (4) heavy rain
Time of Day
Tem
pera
ture
(°F
)
Pre
sent
wea
ther
sym
bol
80
70
60
50
40
30
6A.M.
7A.M.
8 9 10 11 12NOON
1 2 3 4 5 6P.M.
7 8 9 10 11 12MID-
NIGHT
1 2 3 4 5
Air temperature
Dew point
546 ● UNIT 7: THE DYNAMIC ATMOSPHERE

9. When was the relative humidity the highest at Dallas?
(1) 10 A.M. on the first day(2) 12 noon on the first day(3) 10 P.M. on the first day(4) 4 A.M. on the second day
10. The map below shows precipitation patterns on May 27, 2008. The darkest areasare experiencing the most precipitation.
What weather event is mostlikely shown by this map?
(1) a warm front movingto the southeast
(2) a warm front movingto the northeast
(3) a cold front moving tothe southeast
(4) a cold front moving tothe northeast
Part C
Base your answers to questions 11 and 12 on diagram below, which shows weatherconditions over New York State on a specific day in July.
CHAPTER 22: WEATHER MAPS ● 547

11. Make a sketch of the diagram below and on it show the proper abbreviations forthe air masses at 1 and 2.
12. For which city is the following weather forecast most appropriate? “In the nexthour heavy rain is expected with possible lightning and thunder. Temperatureswill become much cooler.”
13. Draw a box about 2 cm on each side to represent a regional weather map. To theright of the box, draw an arrow indicating that north is toward the top of thebox. Draw a warm front moving to the northeast and indicate the positions ofcontinental polar and maritime tropical fronts in their proper positions.
14. Draw a weather station model to properly represent the weather conditionsshown in the diagram of a coastal lighthouse below. Include the present weather,temperature, dew point, atmospheric pressure, and wind speed and direction.The temperature is 36°F, the relative humidity is 100%, and the air pressure is995.1 mb. The sky above the lighthouse is overcast.
Base your answers to questions 15 through 17 on the weather station symbolsbelow, which indicate weather conditions at the following cities in New York State:Niagara Falls, Syracuse, Utica, and New York City.
548 ● UNIT 7: THE DYNAMIC ATMOSPHERE

15. What was the air pressure at Niagara Falls? Be sure to give the correct units ofmeasure.
16. Explain why the symbols indicate that Utica has the greatest chance of pre-cipitation.
17. Make a copy of the weather station model for New York City. Add the followinginformation in the proper locations and format: winds from the south at 15knots and hazy conditions with three-quarters of a mile visibility.
Base your answers to questions 18 through 20 on the weather map below. Isolineson the weather map show air pressures in millibars.
18. Over what geographic feature is the mT air mass likely to have originated?
19. Write the names of these cities in the sequence from lowest relative humidity tothe highest relative humidity: Albuquerque, Chicago, and New York City.
20. What is the present Celsius temperature in New York City?
CHAPTER 22: WEATHER MAPS ● 549
• 550 •
Weather Hazardsand the ChangingAtmosphere
C H A P T E R
23WORDS TO KNOW
acid precipitation hail rain shower thunder
blizzard hurricane sleet thunderstorm
drought lightning smog tornado
freezing rain outgassing snow shower weather hazard
global warming rain
This chapter will help you answer the following questions:1 How can weather events place lives and property in danger?2 What can we do to stay safe during severe weather events?3 Why are Earth’s atmosphere and climate changing?
THE COST OF NATURAL DISASTERS
Scientists measure natural disasters in several ways. In terms ofmoney, Hurricane Katrina in 2005 was the most expensive weatherevent to strike the United States so far this century. Economists es-timate the damage at 81 billion dollars. However, hurricanes thatdevastated Miami, Florida, in 1926 and Galveston, Texas, in 1900are estimated to have cost even more in today’s dollars.
Death is the most feared outcome of any natural disaster. In theUnited States, the greatest loss of life caused by a natural disaster
4: 2.1c, 2.1d, 2.1h

occurred in the Galveston hurricane of 1900. At that time, Galve-ston was the wealthiest city in Texas and its major shipping port.Galveston’s geographic setting and the lack of advanced warningwere the most important factors in this disaster. The city was builton a low-lying barrier island at the entrance to Galveston Bay. Thehighest point in the city was only 3 m (10 ft) above sea level. Peo-ple did not know that a storm was approaching and that theyshould evacuate the island. Figure 23-1 is a photograph taken inGalveston just after the 1900 hurricane.
Galveston’s location will always make it vulnerable to hurri-canes. Shortly after the 1900 hurricane, a 5-m (17-ft) seawall wasbuilt to protect the city from hurricanes. Now, the data fromweather radar and satellite images let forecasters know when amajor hurricane is approaching. In 2008, Hurricane Ike slammedashore as a category 2 storm. Planned evacuations limited deathsto about 35 people, primarily people who ignored the warnings.
WHAT WEATHER EVENTS POSE HAZARDS?
You know that water vapor in the atmosphere stores large amountsof solar energy. Some weather events concentrate that energy and
4: 2.1c, 2.1d, 2.1h
CHAPTER 23: WEATHER HAZARDS AND THE CHANGING ATMOSPHERE ● 551
FIGURE 23-1.Damage caused bythe 1900 Galvestonhurricane.

release it, generating strong winds, excessive precipitation, andother hazards. These events are called weather hazards. Under-standing storm systems and predicting their movements can savelives and property.
Thunderstorms
Many of you have been caught in a rain shower, a short period ofrain (liquid precipitation). In addition, you have probably seen thebuildup of clouds leading to a thunderstorm. A thunderstormproduces rain, lightning, thunder, strong winds, and sometimes,hail. Although thunderstorms can occur at any time of year, theyare especially common during humid summer weather. Rapid up-drafts caused by an approaching cold front may trigger the forma-tion of massive storm clouds. Thunderstorms also are commonin humid, tropical air masses. Some thunderstorm clouds extendto the top of the troposphere. Figure 23-2 shows the verticaldevelopment and flared top characteristic of clouds that producethunderstorms.
Scientists do not yet fully understand why positive and negativeelectrical charges separate in thunderstorm clouds. However, theseparation of charges leads to sudden electrical discharges we see aslightning.These electrical discharges heat the air to temperatureshigher than the surface of the sun. We see the electromagnetic en-ergy they give off as a flash of light.The sudden expansion of the hotair causes the sound of thunder.
Lightning occurs within clouds, between clouds, and betweenclouds and the ground. Lightning strikes cause about 100 deaths
552 ● UNIT 7: THE DYNAMIC ATMOSPHERE
FIGURE 23-2. The birthof a thunderstorm isevident when we see amassive thunderheadthat builds to the top ofthe troposphere wherestratospheric windsshear off the top of thecloud. This image wastaken from a commercialaircraft over the centralUnited States.

each year in the United States. Most deaths caused by lightningare isolated events so they are seldom reported in the news out-side the local area. Lightning often is the leading cause of weather-related human deaths in the United States. Visit the following Website to see what happened to a man who was struck by lightning:http://www.youtube.com/watch?v�1Ed3aV0NcLo&feature�user
STUDENT ACTIVITY 23-1 —LIGHTNING DISTANCE
(Note: Thunderstorms can be dangerous. Perform this activity onlyif you are in a safe place, indoors would be best, and are under thesupervision of a responsible adult.)
Light travels so fast that you see lightning just about the momentit occurs. However, the sound of thunder travels much more
slowly. Here is a way to estimate the delay in seconds between thetime you see a flash of lightning and hear the sound of the thunder.When you see the flash of lightning, begin counting slowly: onethousand one, one thousand two, one thousand three, etc., until youhear the clap of thunder. The distance to the lightning strike is 1 kmfor each 3-s delay or 1 mi for a 5-s delay (about 1000 ft per secondof separation).
Flooding, strong winds, and damage from hail are other costlyeffects of violent thunderstorms. The pellets of ice that fall duringthunderstorms are called hail. Hail begins as small drops of frozenrain high in a thunderstorm cloud. As the ice is blown aroundwithin the cloud, it is repeatedly coated by liquid water that freezesand forms a new layer of ice. Eventually, the hail falls to the ground.Hailstones the size of softballs (12 cm or 4.75 in.) have been re-corded in the midwestern United States. Although rare, such largehailstones can break windows and dent cars. Figure 23-3, on page554, shows the parts of the United States that have the most fre-quent thunderstorms.
Hail should not be confused with sleet. Sleet forms when dropsof rain fall through a layer of cold air near Earth’s surface andfreeze completely. Unlike hail, the ice particles in sleet are alwaysthe size of a raindrop or smaller (less than 5 mm), and sleet pellets
1: MATHEMATICALANALYSIS 1, 2, 31: SCIENTIFICINQUIRY 1
CHAPTER 23: WEATHER HAZARDS AND THE CHANGING ATMOSPHERE ● 553

are transparent. Sleet shows no evidence of multiple cycles of coat-ing by water followed by uplift into cold air aloft where each coat-ing freezes. Therefore, the formation of sleet does not require theviolent updrafts that produce hail. Freezing rain forms when liq-uid rain freezes on contact with Earth’s surface.
Blizzards
A snow shower is a short period of snow. A blizzard is a wintersnowstorm that produces heavy snow and winds of 56 km/h(35 mph) or greater. Blowing snow, limited visibility, and cold tem-peratures are typical of these storms. People can be stranded byblizzard conditions. Deep snow on country roads or city streets canshut down businesses and services. The wind and snow can breakelectric and telephone lines. Fire trucks and ambulances may not beable to reach places where they are needed. Some residents, espe-cially the elderly, may be in danger because they run out of food orfuel before roads are cleared of snow and debris. People caught out-doors in the storm or those who perform vital emergency servicesmay suffer from frostbite and loss of body heat (hypothermia).
Major lake-effect winter storms were discussed in Chapter 20.Away from major lakes, cold continental air masses usually pro-
554 ● UNIT 7: THE DYNAMIC ATMOSPHERE
FIGURE 23-3.Thunderstorms aremost common inthe southeasternstates where warm,humid conditionsoccur and coolcontinental airmasses clash withtropical air masses
20
3040
40
303030
20
20
20
60
60
70
70
80
8070 705060 60
50
20
10
10
5
5
30
40 4050
50
5050
60
50
50
60
Lessthan 50
50–80
Morethan 80
Key
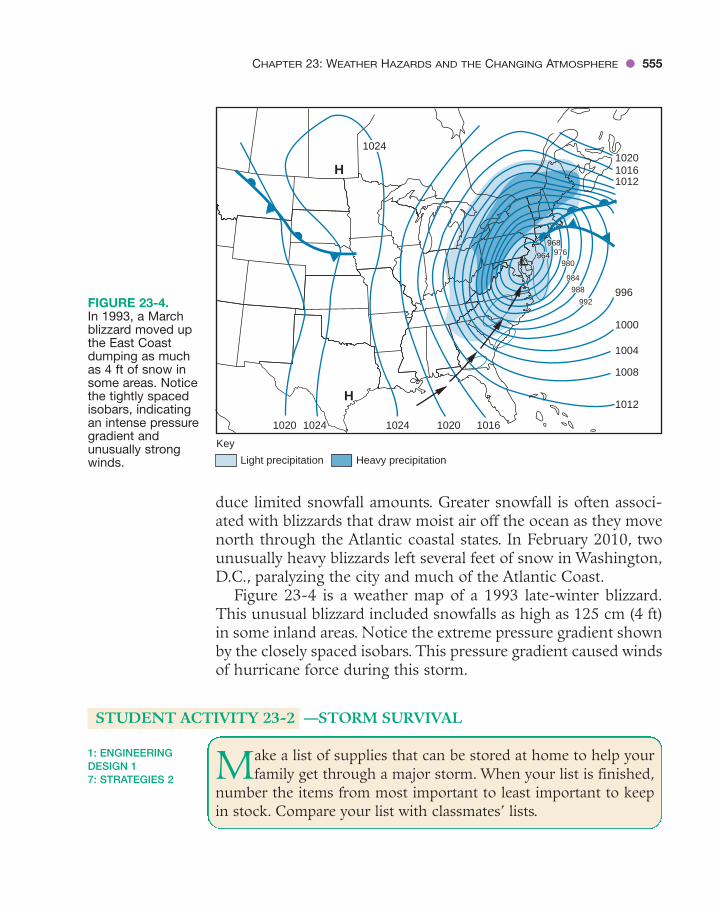
duce limited snowfall amounts. Greater snowfall is often associ-ated with blizzards that draw moist air off the ocean as they movenorth through the Atlantic coastal states. In February 2010, twounusually heavy blizzards left several feet of snow in Washington,D.C., paralyzing the city and much of the Atlantic Coast.
Figure 23-4 is a weather map of a 1993 late-winter blizzard.This unusual blizzard included snowfalls as high as 125 cm (4 ft)in some inland areas. Notice the extreme pressure gradient shownby the closely spaced isobars. This pressure gradient caused windsof hurricane force during this storm.
STUDENT ACTIVITY 23-2 —STORM SURVIVAL
Make a list of supplies that can be stored at home to help yourfamily get through a major storm. When your list is finished,
number the items from most important to least important to keepin stock. Compare your list with classmates’ lists.
1: ENGINEERINGDESIGN 17: STRATEGIES 2
CHAPTER 23: WEATHER HAZARDS AND THE CHANGING ATMOSPHERE ● 555
L
H102010161012
996
1000
1004
1008
1012
101610201020 10241024
H
1024
988
992
984
980976
968
964
Key
Light precipitation Heavy precipitation
FIGURE 23-4.In 1993, a Marchblizzard moved upthe East Coastdumping as muchas 4 ft of snow insome areas. Noticethe tightly spacedisobars, indicatingan intense pressuregradient andunusually strongwinds.

556 ● UNIT 7: THE DYNAMIC ATMOSPHERE
Hurricanes
Hurricanes are the most destructive storms on Earth. Most hur-ricanes develop in the late summer and early autumn when thesurface of the tropical ocean’s water is warmest. Solar energy andthe warmth of the ocean support evaporation. This carries watervapor and energy into the atmosphere. Hurricanes begin as trop-ical depressions (mild low-pressure regions) that become tropicalstorms when their winds exceed 63 km/h (39 mph). Vertical aircurrents and energy released by cloud formation (condensation)strengthen the storm. When sustained winds in a tropical stormexceed 120 km/h (74 mph), the storm is classified as a hurricane.
Atlantic hurricanes often begin as small disturbances over ornear Africa. They drift to the west with the northeast trade winds.Some cross into the Gulf of Mexico where they may again gatherstrength. Others turn north before they reach North America andlose strength over the cooler water of the North Atlantic Ocean.However, hurricanes also come ashore along the East Coast ormove parallel to the coast, causing destruction for hundredsof miles.
Hurricanes also begin over the Caribbean Sea or the Gulf ofMexico. When they move over North America, they weaken be-cause they are deprived of water vapor from the warm ocean sur-face. Friction with land features is also an important reason thathurricanes usually weaken after they come ashore. Wind speedquickly decreases as the weakened hurricanes break up into a dis-organized group of rainstorms. These storms may cause flooding ininland areas. After turning northward, the remains of the storm arepicked up by the eastward flowing jet stream or the zone of prevail-ing southwest winds. Figure 23-5 shows the most common pathstaken by these tropical storms. Visit the following Web site to learnabout record breaking hurricanes by selecting the question youwant answered: http://www.aoml.noaa.gov/hrd/tcfaq/tcfaqE.html
Hurricanes are very large. Some are more than 600 km (400 mi)in diameter. As in other Northern Hemisphere cyclones, winds cir-culate counterclockwise as they converge toward the center. Fromthe outer bands of clouds to the center of the storm, wind speedgenerally increases, as does the intensity of precipitation. At thecenter of the strongest hurricanes, there is a small round area of rel-ative calm known as the eye of the storm. In this region, the windsare light and the skies may be mostly clear. However, the calm of the

CHAPTER 23: WEATHER HAZARDS AND THE CHANGING ATMOSPHERE ● 557
eye is surrounded by the most violent part of the hurricane calledthe “eye wall,” where the fastest winds and most intense rainfalloccur. Some people think the storm is suddenly over when the eyeof the storm passes over them. The approaching eye wall quicklybrings them back to the reality of the second half of the storm. Visitthe following Web site to create your own virtual hurricane andwatch what happens: http://www.nationalgeographic.com/forcesofnature/interactive/index.html?section�h
Meteorologists measure the strength of hurricanes using theSaffir-Simpson scale of hurricane intensity. This scale is shown inTable 23-1. Category 1 hurricanes are the weakest. They are likelyto do little damage to homes and other well-constructed buildings
60°
60°
20°
20°
0°
60°
60°
20°
20°
0°
120° 150° 180° 150° 120° 90° 90°60°60° 30°30° 0°
120° 150° 180° 150° 120° 90° 90°60°60° 30°30° 0°
EQUATOR
TABLE 23-1. Saffir-Simpson Scale of Hurricane Intensity
Sustained Winds Storm Surge
Category km/h mi/h m ft Potential Damage
1 119–154 74–95 1–2 4–5 Minimal
2 155–178 96–110 2–3 6–8 Moderate
3 179–210 111–130 3–4 9–12 Extensive
4 211–250 131–155 4–6 13–18 Extreme
5 �250 �155 �6 �18 Catastrophic
FIGURE 23-5.Hurricanes in theAtlantic Oceanusually driftwestward toward NorthAmerica. Most turnnorth until theyenter the zone ofprevailing westwinds and finallydrift to the east asthey die out overland or coolerocean water.

that are not directly along the coast. A category 5 hurricane is thestrongest. It will cause widespread damage and pose danger tonearly anyone caught in the strongest part of the storm.
Hurricanes present the greatest danger to people in low-lyingcoastal cities, including parts of New York City and Long Island.The storm surge is the greatest cause of damage and fatalities. Astorm surge is the result of the combination of very low atmo-spheric pressure and strong onshore winds. These conditions canraise the level of the ocean so high that waves smash homes andother structures along the oceanfront. People who have not evac-uated the area may find themselves with no escape route. Theymay be stranded for hours by violent seawater in a collapsingbuilding. If the storm comes ashore at high tide, the storm surgemay be even higher and more dangerous. Visit the followingWeb site to see pictures of the Galveston/Bolivar Peninsula beforeand after Hurricane Ike: http://coastal.er.usgs.gov/hurricanes/ike/photo-comparisons/bolivar.html
Figure 23-6 shows how the cost of hurricane damage anddeaths due to hurricanes has changed over the past century. Thedeath toll has dropped for two reasons. When evacuation routeshave been established, people can move safely to higher ground.
558 ● UNIT 7: THE DYNAMIC ATMOSPHERE
10
12
30
40
20
10
0
8
6
4
2
0
Live
s lo
st in
hur
rican
es in
thou
sand
s
Pro
pert
y lo
ss in
199
0 do
llars
1900 1920 1940 1960 1980 2000 2020
Deaths Propertyloss
FIGURE 23-6. Over the past century, the number of deaths and injuries fromhurricanes has decreased due to advanced storm warnings and emergencyplanning. However, property losses have increased due to the development ofbeachfront areas.
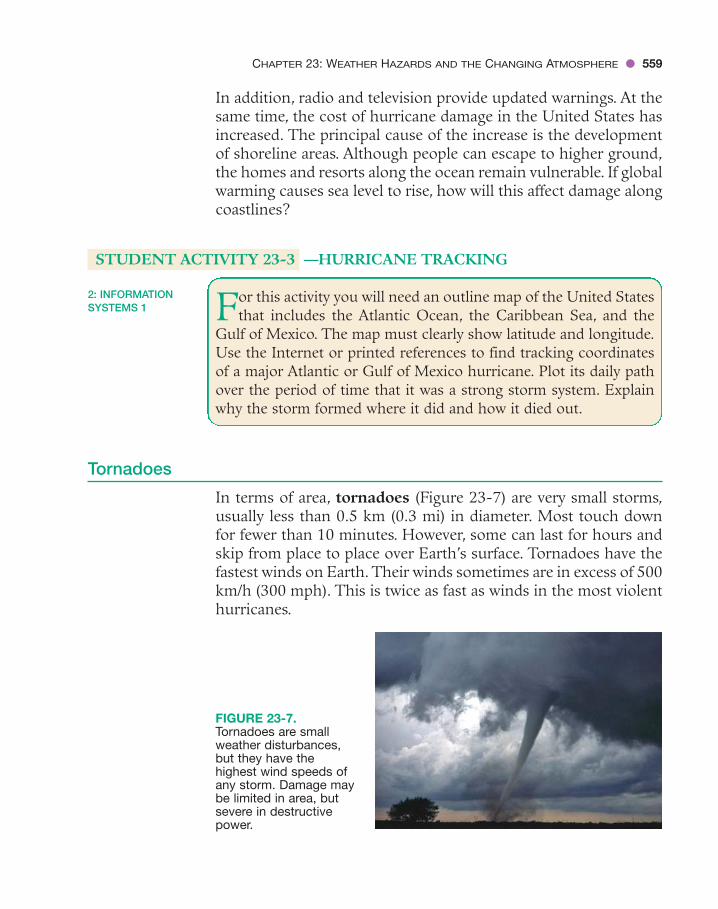
In addition, radio and television provide updated warnings. At thesame time, the cost of hurricane damage in the United States hasincreased. The principal cause of the increase is the developmentof shoreline areas. Although people can escape to higher ground,the homes and resorts along the ocean remain vulnerable. If globalwarming causes sea level to rise, how will this affect damage alongcoastlines?
STUDENT ACTIVITY 23-3 —HURRICANE TRACKING
For this activity you will need an outline map of the United Statesthat includes the Atlantic Ocean, the Caribbean Sea, and the
Gulf of Mexico. The map must clearly show latitude and longitude.Use the Internet or printed references to find tracking coordinatesof a major Atlantic or Gulf of Mexico hurricane. Plot its daily pathover the period of time that it was a strong storm system. Explainwhy the storm formed where it did and how it died out.
Tornadoes
In terms of area, tornadoes (Figure 23-7) are very small storms,usually less than 0.5 km (0.3 mi) in diameter. Most touch downfor fewer than 10 minutes. However, some can last for hours andskip from place to place over Earth’s surface. Tornadoes have thefastest winds on Earth. Their winds sometimes are in excess of 500km/h (300 mph). This is twice as fast as winds in the most violenthurricanes.
2: INFORMATIONSYSTEMS 1
CHAPTER 23: WEATHER HAZARDS AND THE CHANGING ATMOSPHERE ● 559
FIGURE 23-7.Tornadoes are smallweather disturbances,but they have thehighest wind speeds ofany storm. Damage maybe limited in area, butsevere in destructivepower.

Tornadoes can occur anywhere in the United States and at anytime of year. Nevertheless, they are most common in the Midwestand southern states from March through May. At this time, strongcold fronts form in the region where polar and tropical air massesmeet. Most tornadoes are born as swirling winds within a thun-derstorm. These winds intensify and extend upward into the cloudas well as down to the ground. Most tornadoes, like the larger cy-clonic storms, rotate counterclockwise in the Northern Hemi-sphere. However, because tornadoes are very small, the Coriolisinfluence is slight, so about 1 percent of tornadoes in the UnitedStates rotate “in the wrong direction.”
The Enhanced Fujita scale (EF-scale) classifies tornadoes bytheir wind speed and damage. The scale goes from an EF-0, whichcauses light damage, to EF-5, which causes total destruction alongits path. Table 23-2 is the Enhanced Fujita scale of tornado inten-sity. Meteorologists speculate that global climate change may ex-tend the American tornado season, exposing people to increasedrisk of tornadoes.
Tornadoes can occur in swarms such as the outbreak of April3–4, 1974. On those dates there were 127 tornadoes, some of themEF-5.These tornadoes killed 315 people and injured more than6000. The path of destruction ranged from Mississippi to westernNew York State. New York usually gets one or two confirmed tor-nadoes each year. Blizzards, hurricanes, and tornadoes are all sea-sonal storms. Figure 23-8 illustrates when these weather eventstend to occur throughout the calendar year.
560 ● UNIT 7: THE DYNAMIC ATMOSPHERE
TABLE 23-2. Enhanced Fujita Scale of Tornado Intensity
Wind Speed
Rank km/h mph Damage
EF-0 105–137 65–85 Light
EF-1 138–177 85–110 Moderate
EF-2 178–217 111–135 Considerable
EF-3 218–266 136–165 Severe
EF-4 267–322 167–200 Devastating
EF-5 �322 �200 Incredible

Research indicates that tornadoes may form within strong hur-ricanes. These tornadoes cause some of the worst damage done bymajor hurricanes. Tornadoes are difficult to notice in the fury ofthe hurricane. However, investigators have found evidence oftightly swirling winds in the debris left by some major hurricanes.In 2005, Hurricane Katrina produced tornadoes in Georgia andMississippi.
Floods
Of weather-related events in the United States, floods have takenthe greatest toll in lives and property. Flash floods are suddenevents. On a summer Saturday in 1976, a strong late afternoonthunderstorm hovered over the Rocky Mountains of Colorado.Thestorm dropped an estimated 25 to 30 cm (10 to 12 in.) of rain. Overa period of 3h, the discharge of the Big Thompson River increasedby a factor of 200. The water swept into a narrow canyon. Thiscanyon was popular for recreational and camping activities. Alongthe river, 400 houses were destroyed and 145 lives were lost. Manyof the victims had taken refuge from the rain and rising floodwatersin their cars. The flood swept the cars into the river, carrying awaythe cars and their passengers. Others, who abandoned their carsand scrambled up the rocks at the side of the canyon, survived.
CHAPTER 23: WEATHER HAZARDS AND THE CHANGING ATMOSPHERE ● 561
FIGURE 23-8. Differentkinds of weather hazardsin the United Statesgenerally occur atdifferent times of theyear. Tornadoes are mostcommon in late springand early summer. Mosthurricanes occur in latesummer and earlyautumn. Blizzards areusually winter events.

Flash floods are a hazard throughout the United States. They area special hazard in the desert southwest, where local roads oftencross dry streambeds without bridges. Summer monsoon thunder-storms are common in this region. These storms may wash awaysmall bridges. However, the floodwaters block these crossings onlyfor a few hours at a time. The majority of deaths due to floods inthis country are people who are swept away in their cars when theytry to drive along roads that cross flooded streams. Figure 23-9shows two images of the same location in Arizona where a localroad crosses a streambed. When floods occur, as in the right image,motorists must wait for the water to fall before they drive acrossthe stream.
Other floods are long-term events associated with periods ofabove average precipitation or spring snowmelt. The deadliestflood in American history occurred in 1889, when a poorly main-tained dam burst upstream from Johnstown, Pennsylvania. Thecity was destroyed in minutes and more than 2000 people lost theirlives. Destructive floods along the Susquehanna and Delawarerivers in upstate New York have occurred when the remains ofhurricanes brought unusually heavy rain into these watersheds.
The Mississippi River and its tributaries have flooded through-out recorded history. Heavy regional rains and rapid snowmeltlead to spring floods, especially when the ground in the watershed
562 ● UNIT 7: THE DYNAMIC ATMOSPHERE
FIGURE 23-9. This stream crossing in Arizona is dry about 99 percent of thetime. But when it floods, motorists must wait for several hours until the waterlevel is low enough to cross safely and get to their homes.

is saturated. In 1993, floodwater covered an area the size of thestate of Indiana and set new high-water marks at St. Louis.
Levees are banks along a river. They can be of natural or humanorigin. Natural levees are broad areas that may be just a few feetabove a river. Artificial levees as much as 6 m (20 ft) high havebeen built along parts of the Mississippi River and its tributaries.The levees confine the river and prevent flooding of valuablefarmland and homes when the river runs high. However, artificiallevees confine deposition to the river bottom, which can also makethe river run higher when it floods. This increases the danger ifthe levees break or overflow at flood stage. The levees have allowedpeople to build homes in low areas near the river. Poor mainte-nance or overtopping, which leads to erosion of the levees havecaused extensive property losses. Visit the following Web site tosee the flooding of New Orleans in Hurricane Katrina in 2005:http://www.nola.com/katrina/graphics/flashflood.swf
Droughts
Many of the same areas that experience sudden flooding also suf-fer from drought. A drought is a long period of dry weather. Rain-fall is especially unpredictable in the Great Plains region of theUnited States. The climate has cycles of wet and dry years. En-couraged by several years of good precipitation, farmers dependon these conditions. However, the droughts return, and withoutirrigation, farming becomes impossible. Droughts do not lead tosudden loss of life as do storm events. However, their long-termeconomic effects and loss of life due to famine can be even greater.
The Northeast can be severely affected by a drought that wouldbe the normal conditions in an arid environment. Any area of theUnited States suffers when precipitation is below normal for manymonths. This may cause wells to run dry and cities to run out ofwater. It may also have harmful effects on farming and businesses.
HOW CAN WE PROTECT OURSELVES FROM WEATHER HAZARDS?
Major storms cannot be predicted more than a few days in advance.However, people can make long-range plans to deal with stormswhen they do occur. Advanced planning can prevent property
4: 2.1h7: STRATEGIES 2
CHAPTER 23: WEATHER HAZARDS AND THE CHANGING ATMOSPHERE ● 563

losses. Educational programs about weather hazards help peoplelearn what to do before the storm and how to survive if they arecaught in potentially hazardous situations. Rapid evacuation fromcoastal areas may be the best survival strategy.
Know Your Area’s Weather History
It is good to know the kinds of destructive weather events thathave happened in your area in the past. These are the most likelyweather hazards that will occur in the future. For example, hurri-canes occasionally affect New York State. Hurricanes cause dam-age related to storm surges, wave action, and winds in coastal areassuch as Long Island. The greater threat from hurricanes in upstateNew York is flooding of low-lying areas along streams and rivers.Blizzards and thunderstorms cause power and telephone outagesand make travel hazardous. Visit the following Web site to look atthe hurricane history of various Eastern Seaboard and Gulf states:http://www.csc.noaa.gov/hez_tool/history.html
Local Building Codes and Zoning
One of the government’s most important functions is to protectpeople from harm. For example, building codes require that build-ings be strong enough to withstand most local weather events andprotect the people inside. Most communities have zoning laws.These laws prevent the construction of homes in areas at risk fromweather hazards such as floods. Building on steep and unstableland may require special permits and inspections. This is to ensurethat the property is not subject to landslides and other forms ofmass wasting.
Emergency Planning
You can learn to protect yourself in case of weather-related emer-gencies. When a thunderstorm occurs, you should avoid exposedareas such as hilltops and open fields. You should stay away fromtall trees that may be hit or knocked down by a lightning strike.Inside buildings, avoid anything that could provide a path for elec-tricity such as electrical wires and water pipes. Unplug computersand other sensitive electrical devices. Automobiles, as long as they
564 ● UNIT 7: THE DYNAMIC ATMOSPHERE

are not located in a flood zone, are usually a safe place to stay ina thunderstorm. The metal shell of the car conducts electricityaround the passengers and into the ground. Commercial airplanesare often hit by lightning. This can frighten the passengers, but itrarely causes a serious problem.
Cities should have plans in effect to notify citizens and evacuatepeople from hazardous areas during weather emergencies. Plan-ning helps to coordinate police and emergency services. Roads andbridges in shore areas can be changed to one-way routes that leadpeople to safety and prevent others from entering a danger zone.Evacuation can save lives. However, it can also lead to massive traf-fic jams when roads become clogged and cars stall. These prob-lems become worse when service stations are not open along theevacuation route. Visit the following Web site to learn about hurri-cane hazards in the New York City metropolitan area: http://www.nytimes.com/2008/08/31/nyregion/nyregionspecial2/31Rhurricane.html?_r�2&oref�slogin&oref�slogin
STUDENT ACTIVITY 23-4 —COMPREHENSIVE EMERGENCY PLANNING
Your teacher will divide the class into five groups. Each group willselect a different weather hazard: thunderstorm, blizzard, flood,
tornado, or hurricane. The group will prepare a community actionplan to deal with its weather hazard. Each group will present its planto the class. Plans should include a section on the greatest dangers,how to prepare for the event, and what people should do (and notdo) if caught in a severe weather event.
Early Warning Systems
The National Weather Service can generally predict the arrival ofhurricanes, blizzards, and floods several days in advance. Dopplerradar enables the National Weather Service to identify swirlingwinds in storm systems many miles away. Real-time satellite cov-erage and Doppler radar are able to find and track more localizedstorms that would have escaped notice in the past. If a storm is ap-proaching, radio or TV broadcasts can keep you informed. Someareas use sirens to warn people of approaching tornadoes.
6: OPTIMIZATION 67: CONNECTIONS 1
CHAPTER 23: WEATHER HAZARDS AND THE CHANGING ATMOSPHERE ● 565

The National Weather Service issues three levels of alerts. Anadvisory indicates conditions that could produce a storm are ex-pected in the near future. A storm watch means that conditionsalready exist for storm development. A storm warning indicatesthat a storm has actually been observed in the area, or that a stormis likely to appear at any moment.
In November 2002, an early tornado warning in Van Wert,Ohio, saved many lives. After being warned, people in a movie the-ater, including a large school group, moved from the auditoriuminto bathrooms and interior hallways. A tornado passed through28 minutes after the warning. The bathrooms and hallways werethe only parts of the building left standing. Miraculously, no onein the theater was injured.
Government agencies have programs to educate the publicabout the dangers of thunderstorms and flash floods. Lives havebeen saved when people have followed the advice they heard inbroadcasts and read in pamphlets. These publications help peopleavoid the most common fatal mistakes made during storm events.
STUDENT ACTIVITY 23-5 —COMMUNITY PLANNING MAP
Use a map of your community to identify places where naturalhazards are most likely to cause loss of lives and property.
Make recommendations about building codes and how residents inthose areas should prepare for natural hazards.
HOW IS EARTH’S ATMOSPHERE CHANGING?
Earth’s atmosphere is nearly as old at the planet itself.When magmacomes near the surface, pressure is reduced and bubbles of hot gasescape into the atmosphere. This is outgassing. Gases from erupt-ing volcanoes are about 80 percent water vapor, 10 percent carbondioxide, and 10 percent other gases including nitrogen.
The world’s oceans also may have come from water vapor ventedduring volcanic eruptions. The water vapor condensed and fell asprecipitation. Carbon dioxide and other gases remained as Earth’satmosphere. Objects in space that are much smaller than Earth,such as our moon, do not have enough gravity to prevent gases
4: 1.2e, 1.2f, 1.2g, 1.2h4: 2.2d
7: STRATEGIES 2
566 ● UNIT 7: THE DYNAMIC ATMOSPHERE

from escaping into space. However, Earth has been able to holdonto its atmosphere and oceans.
A second theory proposes that the oceans came primarily fromouter space. Comets are sometimes called “dirty snowballs.” It islikely that there were more comets when the solar system was veryyoung. Many comets hit Earth and left their dust and water onEarth’s surface. Determining whether the oceans are primarily theresult of outgassing from magma or collisions with space objectsis an area of active scientific research.
Atmosphere and Life
If carbon dioxide is the most plentiful gas in magma after watervapor, why is the atmosphere mostly nitrogen and oxygen? Onlya very small fraction of 1 percent of the present atmosphere is car-bon dioxide. Both Mars and Venus have atmospheres that aremostly carbon dioxide.
Unlike our neighboring planets, conditions on Earth are favor-able for the development of abundant life on the surface. Earth isat just the right distance from the sun so that it has moderate tem-peratures. The history of life and the evolution of the atmospherego hand-in-hand. Earth’s earliest life-forms were primitive bacte-ria that thrived in an atmosphere with no oxygen. Chemical evi-dence of these earliest life-forms has been found in rocks 3.5billion years old; that is only 1 billion years after Earth formed.
Ocean water protected early life-forms from destructive solarradiation. Early plantlike life-forms in the oceans began to use theenergy of sunlight to make food through photosynthesis. Duringphotosynthesis, oxygen is produced as a waste product.
In fact, as oxygen built up in the atmosphere, the original life-forms could no longer live at the surface. Their descendants nowlive in environments where there is little free oxygen. As the atmo-sphere changed, organisms evolved that thrived in an oxygen-richenvironment. Oxygen also maintains the ozone layer in the upperatmosphere. The ozone layer protects land dwellers from short-wave ultraviolet radiation. Today’s atmosphere is in a dynamic bal-ance maintained by plants that produce oxygen and animals thatuse it. Figure 23-10, on page 568, represents the changing compo-sition of Earth’s atmosphere throughout geologic history. Thecomposition of Earth’s atmosphere is still changing.
CHAPTER 23: WEATHER HAZARDS AND THE CHANGING ATMOSPHERE ● 567

568 ● UNIT 7: THE DYNAMIC ATMOSPHERE
People Affect the Atmosphere: Global Warming
The carbon dioxide content of Earth’s atmosphere is small. How-ever, of all Earth’s greenhouse gases, carbon dioxide worries sci-entists most. Carbon dioxide alone is responsible for more thanhalf of Earth’s greenhouse effect. Furthermore, measurements ofthe concentration of carbon dioxide in Earth’s atmosphere showthat it is increasing at a rate of 1 percent every 2 years, as you cansee in Figure 23-11.
The primary cause for the increase in carbon dioxide is theburning of carbon-based fossil fuels, such as gasoline, oil, andcoal. At the same time, Earth’s forests are being destroyed to sup-ply wood and land for agriculture. As a result, the amount of car-bon dioxide that can be absorbed by forests is reduced. At thecurrent rate of change, the carbon dioxide content of the atmos-phere could double by the end of the next century.
The addition of greenhouse gases to the atmosphere could re-sult in an increase of several degrees Celsius in Earth’s averagetemperature. Although this may not sound like a dramatic change,this is equal to the average global temperature change that hastaken place since the end of the last ice age. This rise in Earth’saverage temperature is called global warming. Furthermore, asmall amount of warming may cause the oceans to release carbondioxide and accelerate global climate change.
How would global warming affect humans? Atmospheric cir-culation is a very complex system. The specific effects for any par-
Present50010002000Millions of Years Before the Present
3000350040004500
100%
80%
60%
40%
20%
0%15002500
CO2
N2
O2
H2
Other Gases
FIGURE 23-10. The geologic record and atmospheric samples from polar icecores give us clues to the changing composition of Earth’s atmosphere. Theappearance of oxygen about 3 billion years ago has been especially importantto the emergence of life on land.

CHAPTER 23: WEATHER HAZARDS AND THE CHANGING ATMOSPHERE ● 569
ticular location are difficult to predict. Some locations that arenow too cold for agriculture might eventually become importantfood producers. However, other regions that are now productivecould become too hot or too dry for efficient crop growth at somepoint. Scientists have recorded rapid melting of glaciers and polarice. This could raise sea level enough to cause flooding and in-creased storm damage in coastal locations, including many of theworld’s largest cities.
The United Nations has held international conferences to dis-cuss global warming. Most industrialized nations have agreed tostabilize or even reduce their production of greenhouse gases.Some people in the United States have been unwilling to placelimitations on economic growth. However, the majority of Amer-icans have now accepted that the risk of global warming is toodangerous to ignore. Will the nations of the world unite in time toavoid a major disaster? Visit the following Web site to find the an-swers to frequently asked questions about global warming pro-vided by the Intergovernmental Panel on Climate Change: http://ipcc-wg1.ucar.edu/wg1/FAQ/wg1_faqIndex.html
FIGURE 23-11. Over thepast half century, scientistshave measured a long-term increase in thecarbon dioxide content ofEarth’s atmosphere. Theprimary cause is theburning of fossil fuels. Thesmaller fluctuations showcyclic, seasonal changes inplant growth that affectshort-term carbon dioxidelevels in the atmosphere.
Mauna Loa Monthly Mean Carbon DioxideNOAA ESRL GMD Carbon Cycle
YEAR
1958-1974 Scripps Institution of Oceanography1974-2006 National Oceanic and AtmosphericAdministration
CO
2 (p
pm)
310
320
330
340
350
360
370
380
390
1955 1965 1975 1985 2015

570 ● UNIT 7: THE DYNAMIC ATMOSPHERE
STUDENT ACTIVITY 23-6 —CARBON CAPTURE
Some proposals to ease global warming involve planting trees orother plants to absorb carbon dioxide and help the atmosphere
pass terrestrial radiation into space. Place very dry but fertile soilinto a planter. Carefully measure the mass of the soil and planter.Find the mass of seeds or cuttings of a fast growing houseplant suchas coleus. Plant the seeds or cuttings and water the plant accordingto its needs. When the plant has grown large, allow the plant andsoil to dry out like the dry soil you started with. Then find the massof the dry soil and the dry plant. Where did the extra weight comefrom? What is carbon capture?
Air Pollution
The fuels that add carbon dioxide to the atmosphere also add ox-ides of nitrogen and sulfur. These compounds act as condensationnuclei to form clouds. They also make the cloud droplets acidic.Nitric acid and sulfuric acid are strong acids. Although some ofthe acidity in the atmosphere comes from volcanoes venting thesame substances, the human-generated part of the problem ismuch more troubling. Figure 23-12 shows smog caused by airpollution over the city of Los Angeles, California. Smog is a mix-ture of fog and smoke.
Acid clouds form acid precipitation when the moisture falls asrain or snow. Some kinds of bedrock, such as limestone and mar-ble that contain calcite, can react chemically with these acids toneutralize them. However, most rocks do not.
1: SCIENTIFICINQUIRY 1, 2, 3
FIGURE 23-12. The clouds obscuringdowntown Los Angeles and the SanGabriel Mountains are smog causedmostly by emissions from burningfossil fuels. Fossil fuels are our mostimportant energy sources intransportation and other energyproducing uses.
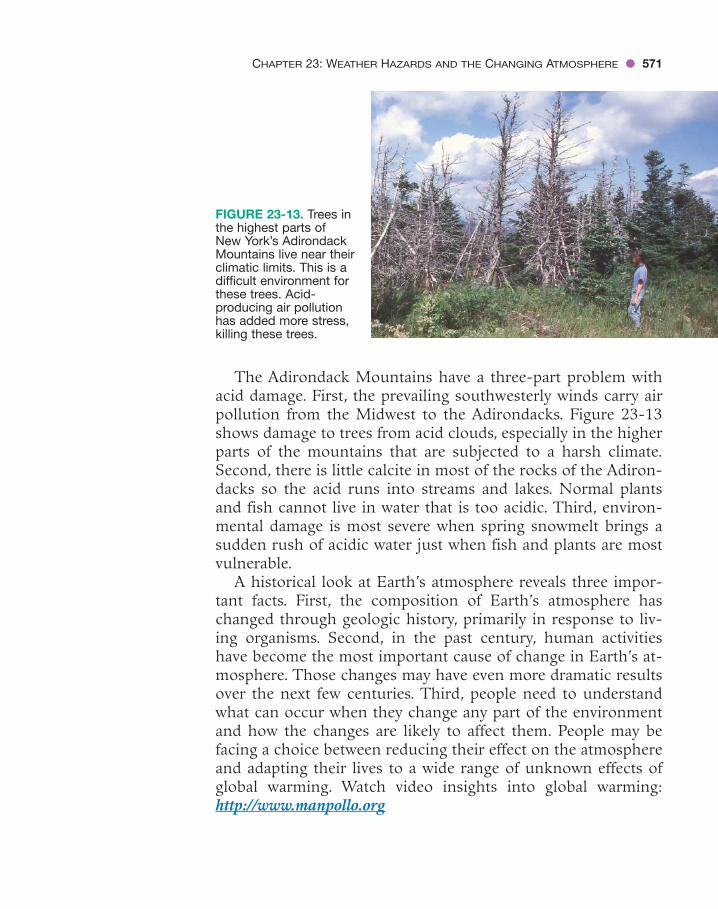
CHAPTER 23: WEATHER HAZARDS AND THE CHANGING ATMOSPHERE ● 571
The Adirondack Mountains have a three-part problem withacid damage. First, the prevailing southwesterly winds carry airpollution from the Midwest to the Adirondacks. Figure 23-13shows damage to trees from acid clouds, especially in the higherparts of the mountains that are subjected to a harsh climate.Second, there is little calcite in most of the rocks of the Adiron-dacks so the acid runs into streams and lakes. Normal plantsand fish cannot live in water that is too acidic. Third, environ-mental damage is most severe when spring snowmelt brings asudden rush of acidic water just when fish and plants are mostvulnerable.
A historical look at Earth’s atmosphere reveals three impor-tant facts. First, the composition of Earth’s atmosphere haschanged through geologic history, primarily in response to liv-ing organisms. Second, in the past century, human activitieshave become the most important cause of change in Earth’s at-mosphere. Those changes may have even more dramatic resultsover the next few centuries. Third, people need to understandwhat can occur when they change any part of the environmentand how the changes are likely to affect them. People may befacing a choice between reducing their effect on the atmosphereand adapting their lives to a wide range of unknown effects ofglobal warming. Watch video insights into global warming:http://www.manpollo.org
FIGURE 23-13. Trees inthe highest parts ofNew York’s AdirondackMountains live near theirclimatic limits. This is adifficult environment forthese trees. Acid-producing air pollutionhas added more stress,killing these trees.

572 ● UNIT 7: THE DYNAMIC ATMOSPHERE
CHAPTER REVIEW QUESTIONS
Part A
1. In the United States, most tornadoes are classified as intense
(1) low-pressure funnel clouds that draw in air(2) low-pressure funnel clouds that spin out air(3) high-pressure funnel clouds draw in air(4) high-pressure funnel clouds that spin out air
2. Which graph below best shows the relationship between the concentration ofcarbon dioxide in Earth’s atmosphere and the amount of infrared (heat) radia-tion absorbed by the atmosphere?
3. Earth’s atmosphere was first formed during the Early Archean Era. Which gaswas generally absent in the atmosphere at that time?
(1) water vapor (3) nitrogen(2) carbon dioxide (4) oxygen
4. What kind of front sometimes spawns tornadoes between an advancing cold anddry air mass and a warm, moist air mass?
(1) cold (3) stationary(2) warm (4) occluded
5. What component of Earth’s atmosphere is most likely to cause climate changeover the next few decades?
(1) water vapor (3) nitrogen(2) carbon dioxide (4) oxygen
Concentration ofCarbon Dioxide
(1)
Am
ount
of
Infr
ared
Abs
orbe
dby
Atm
osph
ere
Concentration ofCarbon Dioxide
(2)
Am
ount
of
Infr
ared
Abs
orbe
dby
Atm
osph
ere
Concentration ofCarbon Dioxide
(3)
Am
ount
of
Infr
ared
Abs
orbe
dby
Atm
osph
ere
Concentration ofCarbon Dioxide
(4)
Am
ount
of
Infr
ared
Abs
orbe
dby
Atm
osph
ere

CHAPTER 23: WEATHER HAZARDS AND THE CHANGING ATMOSPHERE ● 573
Part B
Base your answers to questions 6 through 8, on page 574, on the graph and tablebelow.
Characteristic Hurricane Damage by Category on the Saffir-Simpson Scale
Category 1—No real damage to sturdy buildings. Damage to poorly con-structed older homes or those with corrugated metal. Some tree damage.
Category 2—Some damage to building roofs, doors, and windows. Consider-able damage to poorly constructed homes. Some secondary power linesdowned. Some shallow-rooted trees blown down.
Category 3—Some structural damage to well built small residences and utilitybuildings. Non-reinforced cinderblock walls blown down. Large trees blowndown.
Category 4—Failure of many roof structures, window frames, and doors. Manywell-built wooden and metal structures severely damaged or destroyed. Mostshrubs defoliated. Many large trees blown down.
Category 5—Extensive or total destruction to wood-framed residences. Exten-sive glass failure due to impact of flying debris and explosive pressure forcesduring extreme gusts. Shrubs and trees lose up to 100 percent of their leaves.
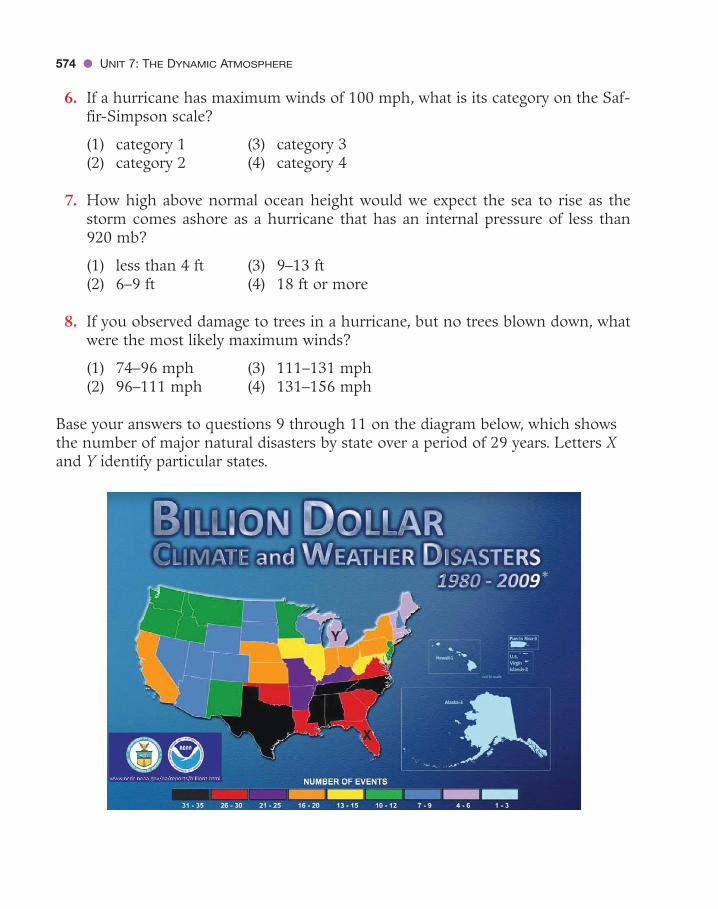
574 ● UNIT 7: THE DYNAMIC ATMOSPHERE
6. If a hurricane has maximum winds of 100 mph, what is its category on the Saf-fir-Simpson scale?
(1) category 1 (3) category 3(2) category 2 (4) category 4
7. How high above normal ocean height would we expect the sea to rise as thestorm comes ashore as a hurricane that has an internal pressure of less than920 mb?
(1) less than 4 ft (3) 9–13 ft(2) 6–9 ft (4) 18 ft or more
8. If you observed damage to trees in a hurricane, but no trees blown down, whatwere the most likely maximum winds?
(1) 74–96 mph (3) 111–131 mph(2) 96–111 mph (4) 131–156 mph
Base your answers to questions 9 through 11 on the diagram below, which showsthe number of major natural disasters by state over a period of 29 years. Letters Xand Y identify particular states.

CHAPTER 23: WEATHER HAZARDS AND THE CHANGING ATMOSPHERE ● 575
9. What is the most likely cause of major destruction in the largest cities in the statelabeled X?
(1) hurricanes(2) blizzards(3) ice storms(4) earthquakes
10. Why does state Y have relatively few major storm events?
(1) State Y has a warm, dry climate.(2) State Y is located along a boundary of Earth’s tectonic plates.(3) State Y is far from a tropical ocean area.(4) State Y is the smallest of the 48 states shown on this map.
11. Look at the states that have the highest number of events. Which event accountsfor most of that number?
(1) blizzards(2) hurricanes(3) thunderstorms(4) earthquakes
Part C
Base your answers to questions 12 through 14 on the information below.
Ozone in Earth’s Atmosphere
Ozone is a form of oxygen. The oxygen we breathe is a molecule composed oftwo atoms of oxygen (O2). Ozone molecules have three atoms of oxygen (O3).A layer of ozone between 10 and 30 mi above Earth’s surface absorbs some ofthe harmful ultraviolet radiation from the sun. The amount of ultraviolet lightreaching Earth’s surface is directly related to the angle of the incoming solarradiation. The greater the sun’s angle of insolation, the greater the amount ofultraviolet light that reaches Earth’s surface. If the ozone layer were completelydestroyed, the ultraviolet light reaching Earth’s surface would most likelyincrease human health problems, such as skin cancer and eye damage.
12. In what temperature zone of Earth’s atmosphere does most of the ozone layerexist?

576 ● UNIT 7: THE DYNAMIC ATMOSPHERE
13. Explain how the ozone layer benefits humans.
14. Assuming clear atmospheric conditions, on what day of the year do people out-doors in New York State receive the most ultraviolet radiation?
15. State one action that people should take to protect themselves from lightning.
Base your answers to questions 16 and 17 on the data below, which shows theaverage number of days with thunderstorms over land areas at various latitudes.
Data Table
Average Number of Days a Thunderstorm
Latitude Occurs Over Land
60°N 5
45°N 14
30°N 19
15°N 30
0° (equator) 56
15°S 44
30°S 21
45°S 8
60°S 0
16. Make a graph of the above data by labeling the bottom axis of a grid with lati-tude numbers from the table starting at 60°N and ending at 60°S. Label the ver-tical axis “Thunderstorm Days Per Year” from 0 to 60. Plot, with an X, theaverage number of days per year a thunderstorm occurs over a land area for eachlatitude shown on the data table. Finally, connect the X’s with a line.
17. State the relationship between latitude and the average number of thunder-storms that occur on Earth over land areas.

CHAPTER 23: WEATHER HAZARDS AND THE CHANGING ATMOSPHERE ● 577
Base your answers to questions 18 through 20 on the map below, which shows theamount of snowfall in a December snowstorm in central New York andsurrounding states. The units are inches of depth.
18. On a copy of the map above, draw the 30.0-in.-snowfall isoline. Assume that thedecimal point at each location represents the place where the depth was measured.
19. Most residents were aware several days in advance that the snowstorm was com-ing. State one action local residents could have taken to prepare for the snowemergency.
20. If the storm followed the usual path for mid-latitude cyclones in this area, to-ward what direction did the snowstorm move as it left New York State?
• 578 •
Patterns of Climate
C H A P T E R
24WORDS TO KNOW
arid climate deforestation temperate climate
climate maritime climate urbanization
continental climate
This chapter will help you answer the following questions:1 What do we mean by climate?2 What natural and human geographic factors influence the
climate?3 How does the geography of New York State affect its climate?4 How can we use graphs to compare the climates of different
locations?5 Why is Earth getting warmer?6 How can humans speed or slow climate change?
ARE CLIMATES CHANGING?
A century ago, 150 glaciers covered the mountains of GlacierNational Park in Montana. Today, only 27 glaciers remain. Mean-while, the remaining glaciers are melting back so quickly that sci-entists estimate all could be gone in 20 years. The shrinkage in
4: 2.2d
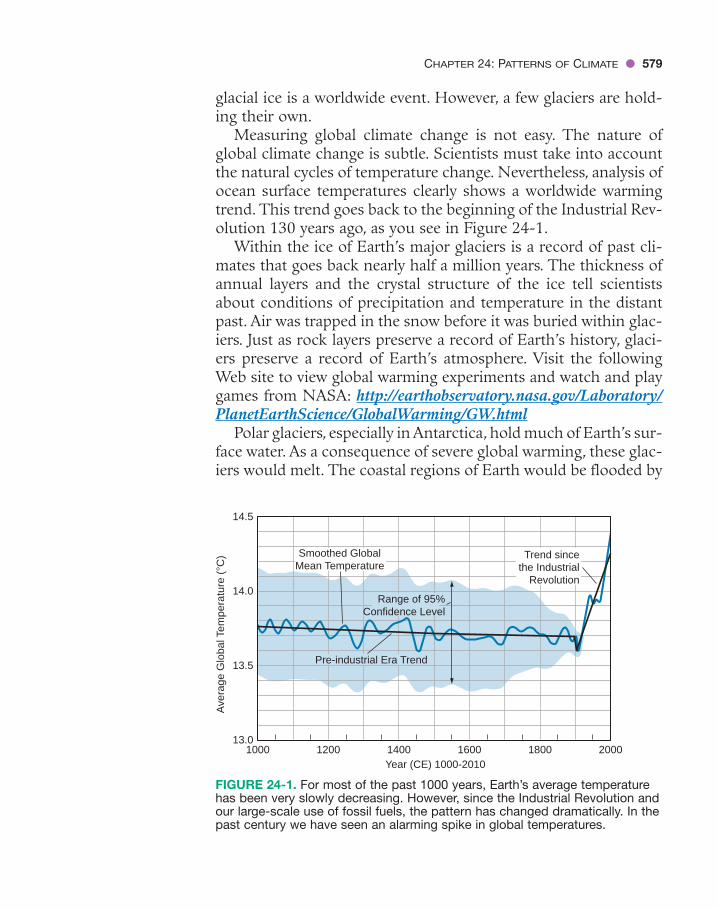
glacial ice is a worldwide event. However, a few glaciers are hold-ing their own.
Measuring global climate change is not easy. The nature ofglobal climate change is subtle. Scientists must take into accountthe natural cycles of temperature change. Nevertheless, analysis ofocean surface temperatures clearly shows a worldwide warmingtrend. This trend goes back to the beginning of the Industrial Rev-olution 130 years ago, as you see in Figure 24-1.
Within the ice of Earth’s major glaciers is a record of past cli-mates that goes back nearly half a million years. The thickness ofannual layers and the crystal structure of the ice tell scientistsabout conditions of precipitation and temperature in the distantpast. Air was trapped in the snow before it was buried within glac-iers. Just as rock layers preserve a record of Earth’s history, glaci-ers preserve a record of Earth’s atmosphere. Visit the followingWeb site to view global warming experiments and watch and playgames from NASA: http://earthobservatory.nasa.gov/Laboratory/PlanetEarthScience/GlobalWarming/GW.html
Polar glaciers, especially in Antarctica, hold much of Earth’s sur-face water. As a consequence of severe global warming, these glac-iers would melt. The coastal regions of Earth would be flooded by
CHAPTER 24: PATTERNS OF CLIMATE ● 579
Year (CE) 1000-2010
Ave
rage
Glo
bal T
empe
ratu
re (°C
)
13.5
14.5
14.0
13.01000 1200 1400 1600 1800 2000
Trend sincethe Industrial
Revolution
Pre-industrial Era Trend
Range of 95%Confidence Level
Smoothed GlobalMean Temperature
FIGURE 24-1. For most of the past 1000 years, Earth’s average temperaturehas been very slowly decreasing. However, since the Industrial Revolution andour large-scale use of fossil fuels, the pattern has changed dramatically. In thepast century we have seen an alarming spike in global temperatures.

580 ● UNIT 7: THE DYNAMIC ATMOSPHERE
rising sea levels. Antarctica holds enough ice to cause sea levelto rise about 800 m (240 ft) worldwide. This would flood most ofthe world’s largest cities, including Tokyo, Japan; Jakarta, Indone-sia; and New York City. Visit the following Web site to work withinteractive flood maps. These maps ask you to input a level of seasurface rise just from 1 to 14 m (3 to 50 ft) to see coastal flooding.http://flood.firetree.net
STUDENT ACTIVITY 24-1 —EFFECTS OF RISING SEA LEVELS
Estimate the total number of people who would need to movedue to rising sea levels if the glaciers of Antarctica were to melt.
How much do the estimates of different students differ and why arethey different?
WHAT IS CLIMATE?
Weather describes the atmospheric conditions at a particular placeand time, perhaps over a period of hours or days. Climate is theaverage weather based on measurements made over many years.Temperature and precipitation are the main elements of climate.However, humidity, winds, and the frequency of storms are alsoimportant. The normal seasonal changes in these factors are a partof climate as well. Scientists base their understanding of the cli-mate of an area primarily on historical records. The more obser-vations and the longer they have been kept, the more accuratelyscientists can describe the climate.
Scientists classify climates according to temperature. Tropicalclimates are usually warm. Temperate climates include largeseasonal changes. Polar climates are usually cold. Scientists com-bine humidity and precipitation when describing a humid climateor arid (dry) climate. Visit the following Web site to see extremerecords temperatures and ranges in the USA: http://ggweather.com/climate/extremes_us.htm
The plants found in an area are an indication of the climate.Rain forests, deserts, grasslands, and tundra are terms that describeboth vegetation and climate. As you can see in the two images in
4: 2.1h, 2.1i
1: MATHEMATICALANALYSIS 16: MAGNITUDE ANDSCALE 3

CHAPTER 24: PATTERNS OF CLIMATE ● 581
Figure 24-2, the leafy green trees indicate that this is a temperateclimate. The cactus tells you that you are looking at a desert. Placeswhere the natural vegetation changes are probably affected bychanges in climate. Figure 24-3, on page 582, is a map of NorthAmerican climates characterized by temperature, precipitation,and seasonal changes.
FIGURE 24-2. The kinds of vegetation in these images indicate two verydifferent climates. How is the vegetation in each of these locations adapted tothe local climatic conditions?

HOW DOES LATITUDE AFFECT CLIMATE?
Climate zones circle Earth at specific latitudes. Latitude deter-mines the angle of insolation. The angle of insolation affects thetemperature, which influences the climate. Latitude also has a rolein precipitation.
Temperature
Variation in the intensity of insolation (sunlight) is the majorcause of temperature differences over Earth’s surface. In the trop-ics, where the noon sun is always high in the sky, solar energy ismost intense. At the poles, where the sun is never high in the sky,solar energy is least intense.
TROPICS The tropics are sometimes called the latitudes of sea-sonless climate. Although the noon sun is a little higher in the sky
4: 2.2c
582 ● UNIT 7: THE DYNAMIC ATMOSPHERE
FIGURE 24-3. This map of NorthAmerica shows climate regions. Forthe most part, these climate regionsare labeled by temperature,precipitation, and seasonal changes.Within each region, the vegetationtends to be similar.
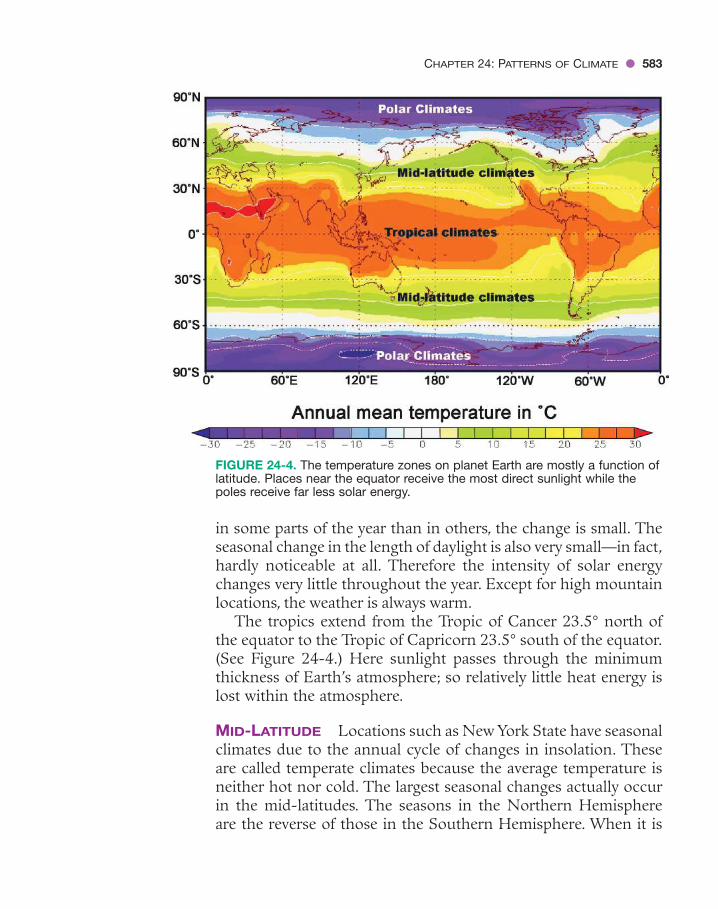
in some parts of the year than in others, the change is small. Theseasonal change in the length of daylight is also very small—in fact,hardly noticeable at all. Therefore the intensity of solar energychanges very little throughout the year. Except for high mountainlocations, the weather is always warm.
The tropics extend from the Tropic of Cancer 23.5° north ofthe equator to the Tropic of Capricorn 23.5° south of the equator.(See Figure 24-4.) Here sunlight passes through the minimumthickness of Earth’s atmosphere; so relatively little heat energy islost within the atmosphere.
MID-LATITUDE Locations such as New York State have seasonalclimates due to the annual cycle of changes in insolation. Theseare called temperate climates because the average temperature isneither hot nor cold. The largest seasonal changes actually occurin the mid-latitudes. The seasons in the Northern Hemisphereare the reverse of those in the Southern Hemisphere. When it is
CHAPTER 24: PATTERNS OF CLIMATE ● 583
FIGURE 24-4. The temperature zones on planet Earth are mostly a function oflatitude. Places near the equator receive the most direct sunlight while thepoles receive far less solar energy.

summer in the Northern Hemisphere, it is winter in the SouthernHemisphere.
STUDENT ACTIVITY 24-2 —GRAPHING AVERAGE MONTHLYTEMPERATURE
Construct a single graph to show the average monthly tempera-ture at three North American cities for a period of 1 year. Se-
lect cities at or near sea level. One location should be in CentralAmerica, a second in the main part of the United States, and the thirdin Canada or Alaska. What does your graph show about latitude andclimate?
POLAR REGIONS The polar regions are generally cooler thanother regions throughout the year. Nevertheless, they do experi-ence large seasonal changes. In the winter, the days are very shortand the sun, if it is visible, is always low in the sky. Insolation isextremely weak and temperatures may stay below freezing formonths at a time. Even the summer sun is not very high in thesky, but the number of hours of daylight in the summer is verylong. Because there is a large difference in the strength of insola-tion between winter and summer, most high-latitude locations aremuch warmer in the summer than they are in the winter. The in-terior of Alaska has bitter cold winters. However, even in centralAlaska, summer temperatures can reach 30°C (about 90°F) at theheight of summer. Visit the following Web site to see NOAA On-line Weather and Climate Data: http://www.weather.gov/climate/
Precipitation
Rainfall is generally plentiful in the tropics. Most of Earth’s desertregions occur roughly 30° north and south of Earth’s equator. An-other zone of abundant precipitation can be found another 20 de-grees or so from the equator. But why do these parallel zones ofdeserts and plentiful precipitation circle Earth?
These patterns are a result of Earth’s rotation acting on terres-trial winds. You learned earlier that instead of one big convection
1: MATHEMATICALANALYSIS 1, 2, 3
584 ● UNIT 7: THE DYNAMIC ATMOSPHERE

cell in each hemisphere, the Coriolis effect forms three convectioncells in each hemisphere.
The rotation of Earth and the position of the continentsbreak convection in the Northern Hemisphere into three cells.The three convection cells are shown on the Planetary Windand Moisture Belts diagram in the Earth Science Reference Tables.Figure 24-5 is a representation of part of that diagram. The leftside of the diagram is a profile of Earth showing convection cellsin the Northern Hemisphere. The diagram on the right showsEarth’s surface as flat, the way it looks as you stand on it. Alongthe equator and at about 60° north latitude, air rises, forminglow-pressure regions that circle Earth. The rising air causescloud formation and generous precipitation at these latitudes.However, at latitude 30°N and at the North Pole (90°N) are re-gions of high pressure where sinking air warms and gets drier asit is compressed by atmospheric pressure. These latitudes havelow relative humidity and relatively little precipitation. The 90°segment shown in Figure 24-5 is one of four similar profiles thatcircle Earth.
These high- and low-pressure belts are not still. Seasonalchanges cause them to shift toward the equator in the winter andtoward the poles in the summer. Furthermore, the wanderingjet streams move these regions of high and low pressure andinterrupt them with the passage of storm systems. Other geo-graphic features you will soon read about also influence patternsof precipitation.
CHAPTER 24: PATTERNS OF CLIMATE ● 585
No
rth
Po
le
60°N
30°N
Eq
uat
or
H HL L
NorthPole
60°N
30°N
Equator
PolarEast
Mid-LatitudeWestWindsWinds
TropicalEast
Winds
FIGURE 24-5. Places where rising air dominates experience more cloudformation and precipitation. Zones of descending air create high-pressurezones at the surface that have little precipitation.

WHAT OTHER GEOGRAPHIC FACTORS AFFECT CLIMATE?
In addition to latitude other factors, such as elevation, nearness oflarge bodies of water, winds, and ocean currents, affect climate.
Elevation
The average temperature of a location is related to its elevation.Thehigher the elevation, the lower the average temperature will be. Asrising air expands, it becomes cooler. Perhaps you have noticed thathigh mountains are often snow covered, even in the summer.Mount Chimborazo, shown in Figure 24-6, and Mount Kiliman-jaro in Africa are near the equator. However, these mountains havepermanent snow cover near their summits. Nearby locations atlower elevation have a tropical climate where it never snows. Ris-ing dry air cools at a rate of about 1°C/100 m (4°F/1000 ft). Dry airwarms at the same rate as it descends.
Mountain Barriers
Mountain ranges affect patterns of precipitation and temperature.Moist winds off the Pacific Ocean blow across California and riseup the western side of the Sierra Nevada Mountains. As the airrises into the mountains, it expands and cools below its dew point.This leads to cloud formation and precipitation. On the westernside of the Sierra Nevada Mountains, the climate is cool withabundant precipitation. Seattle and the coast of northern Califor-nia have a temperate, moist climate.
The air descends on the eastern side of the mountains. The airis compressed by increasing barometric pressure and becomes
4: 2.2c, 2.2d
586 ● UNIT 7: THE DYNAMIC ATMOSPHERE
FIGURE 24-6. Mount Chimborazoin South America is nearly on theequator. Yet, it is always coveredwith snow and ice. This occursbecause air cools when it expandsas it rises up the mountain.

warmer.As the descending air warms without picking up moisture,its relative humidity decreases. Inland cities such as Spokane, LasVegas, and Phoenix are located in the desert climate zone. Climateon the downwind, or leeward, side of mountains is sometimescalled a “rain shadow” climate. Figure 24-7 illustrates the differ-ence between climates on the opposite sides of a mountain range.
As moist air rises into the mountains, condensation (cloud for-mation) releases energy. This slows the rate of cooling. Whenclouds form, the air cools at a lower rate of about 0.6 C°/100 m(2°F/1000 ft). The descending air cannot pick up moisture. There-fore, the air heats at the greater, dry air rate of 1°C/100 m. Figure24-8 illustrates this difference.
CHAPTER 24: PATTERNS OF CLIMATE ● 587
FIGURE 24-8. (1) As airrises, it expands and coolsquickly. (2) When cloudsform in the rising air,condensation releases theenergy stored in watervapor, slowing the rate ofcooling. (3) When the airsinks to a lower elevationand becomes warmer, thereis no change in state to slowthe rapid warming rate.
Moist air rising causescooling, cloud formation,
and precipitation
3
1
2
30° 40° 50° 60° 70° 80°
FIGURE 24-7. Cloud formation and precipitation usually occur on thewindward side of a mountain range where moist air rises and cools. On thedownwind side, descending air is warmed by compression, so the relativehumidity quickly drops, generating an arid climate.

Large Bodies of Water
The Atlantic Ocean and Long Island Sound moderate the climateof New York’s Long Island. Therefore, on Long Island, winters areusually warmer and summers cooler than in other parts of thestate. This is especially true for places along the coast when thewinds are off the ocean.
The inland regions of New York State experience the highestand lowest temperatures. The lowest temperature ever recorded inNew York State was �47°C (�57°F) at Old Forge in the Adiron-dack Mountains. The record high temperature in New York Statewas measured in the capitol district: 42°C (108°F) at Troy. Bothplaces are far from the moderating influence of the Atlantic Oceanand the Great Lakes.
STUDENT ACTIVITY 24-3 —MODELING TEMPERATURE CHANGE
You can model the temperature changes over land and waterusing two containers. Fill one about a third full of sand and the
other a third full of water. Place thermometers in both containersjust above the sand or water surface. Be sure both thermometersstay completely dry! Position a lamp so it shines equally on bothcontainers. For best results shield the thermometer bulbs from di-rect light. Compare the temperature changes in both containers.
Why do the oceans have such a great effect on climate? As youlearned in Chapter 21, specific heat is a measure of the ability of asubstance to warm as it absorbs energy or cool as it gives off en-ergy. In general, metals and rock have low specific heats. They heatup and cool down rapidly. However, water has a very high specificheat. It heats and cools slowly.
Winds off the oceans or the Great Lakes, such as Lakes Erie andOntario, control the temperature of nearby land areas. Even thewinds off the Finger Lakes have some moderating affect. All theseareas are cooler in summer and warmer in winter than places far-ther from the water.
There are three other reasons that land areas experience greaterchanges in temperature than the oceans. First, because water is
6: MODELING 2
588 ● UNIT 7: THE DYNAMIC ATMOSPHERE

relatively transparent, sunlight penetrates deeper into water thanit does on land. Rock and soil are opaque, so insolation energy isconcentrated at the surface. Second, water is a fluid, so convectioncurrents can distribute energy to the interior. Solids have no abil-ity to mix. Finally, evaporation from the oceans uses some of thesolar energy that would otherwise heat the oceans. Although thereis some evaporation of water from soil, it is far less than evapora-tion from the oceans. Figure 24-9 summarizes these factors.
Scientists classify most terrestrial climates as maritime or con-tinental. Continental climate is typical of inland areas. It is char-acterized by large seasonal changes in temperature. Inland areasgenerally do not experience the moderating influence of largebodies of water. Areas with a continental climate can be arid ormoist, depending on the source region of the air masses that moveinto the area.
Maritime climate is sometimes known as the marine climate.It occurs over the oceans and along coasts, where water moder-ates the extremes in temperature. Areas that have a maritime cli-mate experience moderate to high humidity.
Prevailing Winds
New York State has greater extremes of climate than many othercoastal states. California, for example, is known for its mild cli-mate. While inland areas of California experience greater ranges oftemperature than the coastal locations, these extremes are not asgreat as those in New York State. The reason for this difference isthe wind direction. Both states are in the global belt of prevail-ing west and southwest winds. However, in California those winds
CHAPTER 24: PATTERNS OF CLIMATE ● 589
WaterMore
evaporation
High specificheat of water
Land
Mixing of warmand cold waters
Transmissionto depth
Lessevaporation
No transmissionNo mixingLow specific heat
FIGURE 24-9. The ability of the oceans to absorbmore heat energy than landabsorbs is influenced bythree factors: the relativelyhigh specific heat of water, the depth of lightpenetration, and convectivecirculation of the water.

come off the Pacific Ocean. In most of New York State, the windscome from inland areas where temperatures are highly change-able. As a result, the nearby Atlantic Ocean has relatively little ef-fect on the climate of most of New York State.
Monsoon climates include an annual cycle of weather patternscaused by shifting wind directions. In winter and spring, the windcomes from high-pressure centers over the continents. Springweather is warm and dry with large changes in daily temperature.When summer low pressure builds over the continents, the windshifts direction. It brings moist air from the ocean. Summer mon-soon weather is more humid, with cooler days and warmer nights.The summer monsoons also bring clouds and precipitation, whichreduce the temperature as well as the daily range of temperature.
Ocean Currents
Many tourists are surprised to see palm trees growing in the someparts of England and Ireland. Palm trees are not native to thesecountries. However, these imported plants can survive the mildweather conditions found in some parts of the British Isles. TheGulf Stream and the North Atlantic Current transport warmocean water from the South Atlantic Ocean to the area surround-ing Great Britain. These islands experience more moderate tem-peratures than does New York State. Most of the British Isles havedamp and mild winters in which hard frosts are not common.This is true in spite of the fact that Great Britain is roughly 10°farther north than New York State. Along the East Coast of NorthAmerica at the same latitude as Great Britain is the Labradorprovince of Canada, where the winters are even colder than inNew York State.
Other locations are cooled by nearby cold ocean currents. TheCalifornia Current keeps the coastal city of San Francisco in“sweater weather” throughout the summer. However, just a fewmiles inland people often experience desert heat. Even in the sum-mer, local residents who visit the ocean may just wade in the surf.The water is too cold to swim in without a wetsuit.As shown in Fig-ure 24-10, New York City’s climate is warmed by the Gulf Stream.The Surface Ocean Currents map on page 58 and in the Earth Sci-ence Reference Tables provides a useful way to tell where warm andcold ocean currents affect the climate of coastal locations.
590 ● UNIT 7: THE DYNAMIC ATMOSPHERE
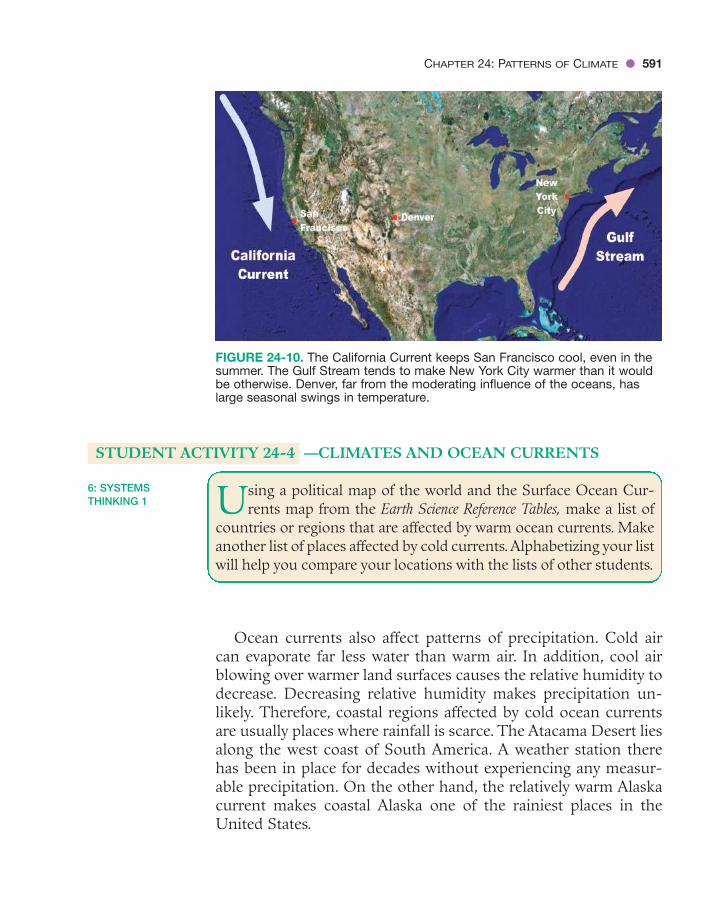
STUDENT ACTIVITY 24-4 —CLIMATES AND OCEAN CURRENTS
Using a political map of the world and the Surface Ocean Cur-rents map from the Earth Science Reference Tables, make a list of
countries or regions that are affected by warm ocean currents. Makeanother list of places affected by cold currents.Alphabetizing your listwill help you compare your locations with the lists of other students.
Ocean currents also affect patterns of precipitation. Cold aircan evaporate far less water than warm air. In addition, cool airblowing over warmer land surfaces causes the relative humidity todecrease. Decreasing relative humidity makes precipitation un-likely. Therefore, coastal regions affected by cold ocean currentsare usually places where rainfall is scarce. The Atacama Desert liesalong the west coast of South America. A weather station therehas been in place for decades without experiencing any measur-able precipitation. On the other hand, the relatively warm Alaskacurrent makes coastal Alaska one of the rainiest places in theUnited States.
6: SYSTEMSTHINKING 1
CHAPTER 24: PATTERNS OF CLIMATE ● 591
FIGURE 24-10. The California Current keeps San Francisco cool, even in thesummer. The Gulf Stream tends to make New York City warmer than it wouldbe otherwise. Denver, far from the moderating influence of the oceans, haslarge seasonal swings in temperature.

592 ● UNIT 7: THE DYNAMIC ATMOSPHERE
Vegetation
The local climate and soil determine natural vegetation. There-fore, vegetation is a good indicator of the climate. For example, thetemperate rain forests along the Pacific coast of the United Statesand Canada grow only in a cool, moist climate. However, vegeta-tion also contributes to climate. Thick vegetation, such as the treesand plants in a forest, moderate temperature by holding in cool airduring the day. At night, the vegetation prevents the rapid escapeof warm air. Vegetation slows surface winds. In addition, plantscontribute moisture to the air. During precipitation, the plantsslow runoff. This gives water at the surface time to soak into theground. Groundwater is then absorbed by the roots of plants andrises into the leaves, where over an extended period, water is slowlylost by transpiration. Transpiration and photosynthesis absorbsolar energy, which would otherwise heat the land and air duringdaylight hours. So forest conditions are generally more moderateand consistently more humid than open land in the same area.
Human activities such as cutting wood, plowing fields, mining,or construction remove native plants. We replace plants with openground, paved surfaces, or buildings. Deforestation is cuttingforests to clear land. Urbanization is the development of areaswith large populations. These activities have replaced natural veg-etation with farmlands and cities at an ever-increasing rate. Bareground and paved surfaces do not allow evaporation of groundwa-ter. These surfaces heat up quickly during the day and cool quicklyat night.As a result of urbanization, the local climate becomes drierand warmer with an increased daily range of temperatures.
Urban Heat Islands
Heating and air conditioning release heat to the outdoor environ-ment. In addition, cars, trucks, buses, and other forms of trans-portation burn fuel and release heat. Businesses and industries,which are concentrated around cities, produce heat. In a city, thehigh concentration of human activities produces an urban heat is-land. In general, urban areas, such as New York City, warm morequickly and stay warmer than rural locations.
The effects of urban heat islands are easy to see. Have you evernoticed how much longer winter snow lasts in the country than it
CHAPTER 24: PATTERNS OF CLIMATE ● 593
does in nearby urban areas? Even undisturbed parks in cities willbe clear of snow before similar rural land is snow-free. On summernights, city dwellers often need air conditioning all night, while inneighboring rural areas, residents can cool off by opening theirwindows to the cool evening air.
WHAT GEOGRAPHIC FEATURES OF NEW YORK STATE AFFECT THE LOCAL CLIMATE?
Throughout New York State differences in climate are relativelysmall. Many climatologists would classify the whole state as hav-ing a humid, continental, temperate climate with large seasonalvariations in temperature. However, local geographic features docause some significant differences in climate at various locationsin the state.
As noted earlier, the Atlantic Ocean and Long Island Soundmake the climate on Long Island more moderate than inland areasof New York State. Winter precipitation that falls as snow upstateis more likely to be rain on Long Island. Breezes off the ocean keepthe humidity higher than in other parts of the state. Long Islandis also more vulnerable to hurricanes and coastal storms.
Winter snow lasts longer in higher parts of the AdirondackMountains and the Catskills for two reasons. First, the moun-tains, due to their elevation, are a little cooler than other areas ofNew York State. Second, mountains also influence patterns ofprecipitation. On the windward side, air rising into these moun-tain areas expands and cools. This causes increased precipitationthroughout the year. Mountains also influence the climate ontheir downwind side. The land around Lake Champlain and thecentral Hudson Valley are in the rain shadow of mountains andmay have as little as half the annual precipitation of the nearbymountains.
You read earlier that areas of New York State at the eastern endof Lakes Erie and Ontario are subject to “lake-effect” storms. Thisis especially true in late autumn and early winter, when the lakewater is warmer than surrounding land areas. The lakes also mod-erate temperatures in nearby land areas. The first hard frost ofautumn occurs later in these areas. The extended growing seasonmakes land near the lakes valuable for agriculture.
4: 2.2c, 2.2d

594 ● UNIT 7: THE DYNAMIC ATMOSPHERE
HOW IS CLIMATE SHOWN ON GRAPHS?
Climate graphs are a way to illustrate different kinds of climates.On the following graphs, the dark line shows the average monthlytemperature. The monthly bar graphs indicate the average monthlyprecipitation.
Figure 24-11 is a climate graph for Syracuse, New York. Noticethe large seasonal changes in temperature and plentiful precipita-tion throughout the year. Remember that these are average condi-tions over many years. Therefore, unusual events such as droughtsdo not appear on these graphs.
Figure 24-12 is a climate graph for a desert location in thesouthwestern United States. It shows major seasonal changes in
4: 2.1g
100
90
80
70
60
50
40
30
20
10
–10
–20
0
24
22
20
18
16
14
12
10
8
6
2
0
4
NORTHERN HEMISPHEREDESERT
MonthJ J JF M A A S O N DM
Ave
rage
Mon
thly
Tem
pera
ture
(∞
F)
Ave
rage
Mon
thly
Pre
cipi
tatio
n (in
ches
)
Temperature
Precipitation
100
90
80
70
60
50
40
30
20
10
–10
–20
0
24
22
20
18
16
14
12
10
8
6
2
0
4
NORTHERN HEMISPHERETEMPERATE, HUMID
MonthJ J JF M A A S O N DM
Ave
rage
Mon
thly
Tem
pera
ture
(�F
)
Ave
rage
Mon
thly
Pre
cipi
tatio
n (in
ches
)
Temperature
Precipitation
FIGURE 24-12. Desert climate graph forPhoenix, Arizona.
FIGURE 24-11. Temperate humid climategraph for Syracuse, New York.
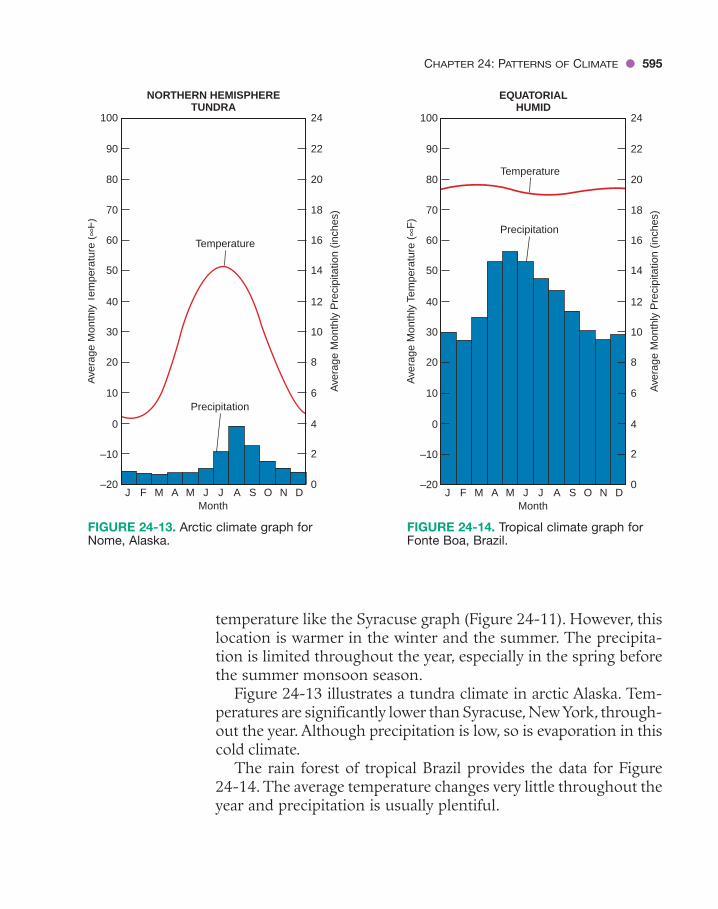
CHAPTER 24: PATTERNS OF CLIMATE ● 595
temperature like the Syracuse graph (Figure 24-11). However, thislocation is warmer in the winter and the summer. The precipita-tion is limited throughout the year, especially in the spring beforethe summer monsoon season.
Figure 24-13 illustrates a tundra climate in arctic Alaska. Tem-peratures are significantly lower than Syracuse, New York, through-out the year. Although precipitation is low, so is evaporation in thiscold climate.
The rain forest of tropical Brazil provides the data for Figure24-14. The average temperature changes very little throughout theyear and precipitation is usually plentiful.
100
90
80
70
60
50
40
30
20
10
–10
–20
0
24
22
20
18
16
14
12
10
8
6
2
0
4
EQUATORIALHUMID
MonthJ J JF M A A S O N DM
Ave
rage
Mon
thly
Tem
pera
ture
(∞
F)
Ave
rage
Mon
thly
Pre
cipi
tatio
n (in
ches
)
Temperature
Precipitation
100
90
80
70
60
50
40
30
20
10
–10
–20
0
24
22
20
18
16
14
12
10
8
6
2
0
4
NORTHERN HEMISPHERETUNDRA
MonthJ J JF M A A S O N DM
Ave
rage
Mon
thly
Tem
pera
ture
(∞
F)
Ave
rage
Mon
thly
Pre
cipi
tatio
n (in
ches
)
Temperature
Precipitation
FIGURE 24-13. Arctic climate graph forNome, Alaska.
FIGURE 24-14. Tropical climate graph forFonte Boa, Brazil.

596 ● UNIT 7: THE DYNAMIC ATMOSPHERE
Figure 24-15 is the climate graph for Sydney, Australia. Noticethat the highest and lowest temperatures are off by 6 months fromthose of the Northern Hemisphere locations. In the SouthernHemisphere, winter begins in June and summer begins in Decem-ber. Sydney is a coastal city so the annual temperature range is notas great as it is at the previous temperate locations.
The last climate graph is a monsoon location in India. (See Fig-ure 24-16.) Precipitation is very seasonal. Also notice how thetemperatures fall off relatively early when the summer monsoonsarrive in July. Compare factors that affect climate by observing cli-mate graphs: http://people.cas.sc.edu/carbone/modules/mods4car/ccontrol/index.html
100
90
80
70
60
50
40
30
20
10
–10
–20
0
24
22
20
18
16
14
12
10
8
6
2
0
4
NORTHERN HEMISPHEREMONSOON
MonthJ J JF M A A S O N DM
Ave
rage
Mon
thly
Tem
pera
ture
(�F
)
Ave
rage
Mon
thly
Pre
cipi
tatio
n (in
ches
)
Temperature
Precipitation
100
90
80
70
60
50
40
30
20
10
–10
–20
0
24
22
20
18
16
14
12
10
8
6
2
0
4
SOUTHERN HEMISPHERETEMPERATE
MonthJ J JF M A A S O N DM
Ave
rage
Mon
thly
Tem
pera
ture
(�F
)
Ave
rage
Mon
thly
Pre
cipi
tatio
n (in
ches
)
Temperature
Precipitation
FIGURE 24-15. Southern Hemisphereclimate graph for Sydney, Australia.
FIGURE 24-16. Monsoonal climate graph forNew Delhi, India.

CHAPTER 24: PATTERNS OF CLIMATE ● 597
CHAPTER REVIEW QUESTIONS
Part A
Base your answers to questions 1 and 2 on the following diagram, which representsprevailing winds blowing over a high mountain range.
1. Why do clouds often form only on the windward side of the mountains?
(1) Air rises and cools on the windward side.(2) Air rises and becomes warmer on the windward side.(3) Air sinks and cools on the windward side.(4) Air sinks and becomes warmer on the windward side.
2. Points A and B are at the same latitude and the same elevation above sea level.How does the climate at A probably differ from the climate at B?
(1) Location A has less precipitation.(2) Location A has summer when location B has winter.(3) Location A has a greater annual temperature range.(4) Location A is usually cooler in the summer.
3. Why are temperatures in the tropic low-latitudes always higher than tempera-tures at the South Pole?
(1) The South Pole receives more intense sunlight.(2) The South Pole receives less solar radiation.(3) The South Pole has more cloud cover.(4) The South Pole has more vegetation.
Wind
Ocean
Mountain
Leewardside
Windwardside
BA
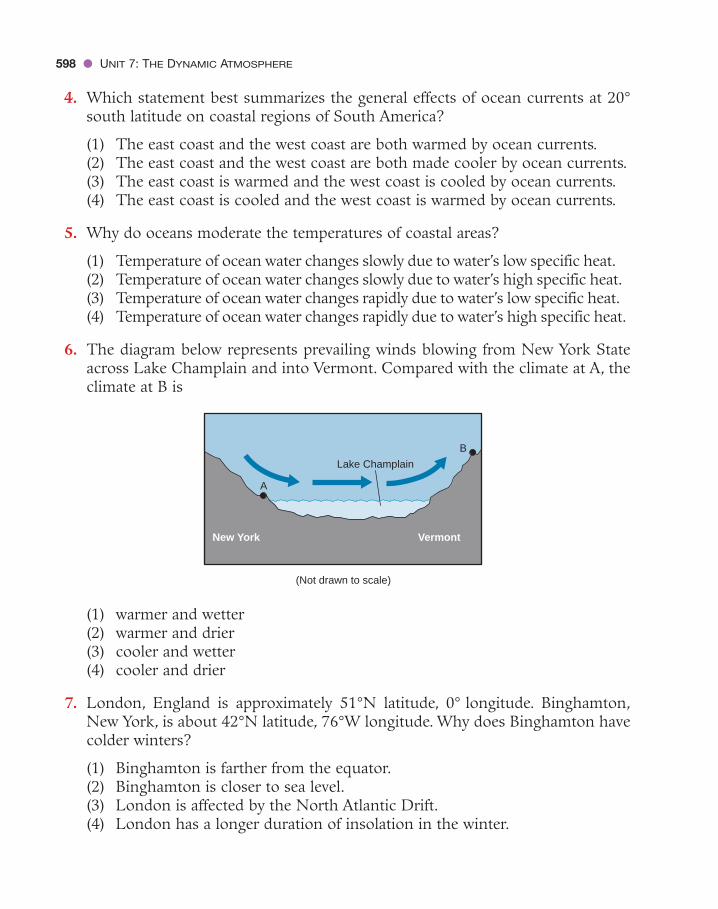
4. Which statement best summarizes the general effects of ocean currents at 20°south latitude on coastal regions of South America?
(1) The east coast and the west coast are both warmed by ocean currents.(2) The east coast and the west coast are both made cooler by ocean currents.(3) The east coast is warmed and the west coast is cooled by ocean currents.(4) The east coast is cooled and the west coast is warmed by ocean currents.
5. Why do oceans moderate the temperatures of coastal areas?
(1) Temperature of ocean water changes slowly due to water’s low specific heat.(2) Temperature of ocean water changes slowly due to water’s high specific heat.(3) Temperature of ocean water changes rapidly due to water’s low specific heat.(4) Temperature of ocean water changes rapidly due to water’s high specific heat.
6. The diagram below represents prevailing winds blowing from New York Stateacross Lake Champlain and into Vermont. Compared with the climate at A, theclimate at B is
(1) warmer and wetter(2) warmer and drier(3) cooler and wetter(4) cooler and drier
7. London, England is approximately 51°N latitude, 0° longitude. Binghamton,New York, is about 42°N latitude, 76°W longitude. Why does Binghamton havecolder winters?
(1) Binghamton is farther from the equator.(2) Binghamton is closer to sea level.(3) London is affected by the North Atlantic Drift.(4) London has a longer duration of insolation in the winter.
Lake Champlain
VermontNew York
A
B
(Not drawn to scale)
598 ● UNIT 7: THE DYNAMIC ATMOSPHERE

Part B
Base your answers to questions 8 through 10 on the map below, which representsan imaginary continent.
8. Locations A and B are at the same elevation below a mountain range. Comparedwith the climate at A, the climate at B is most likely
(1) warmer and more humid(2) warmer and less humid(3) cooler and more humid(4) cooler and less humid
9. How can we best describe the wind pattern at point D?
(1) converging winds and rising air(2) converging winds and falling air(3) diverging winds and rising air(4) diverging winds and falling air
60° N
30° N
0° N
A
D
B
C
OceanN
Planetary windbelts
Mountain range
Key
Ocean
Ocean
CHAPTER 24: PATTERNS OF CLIMATE ● 599

600 ● UNIT 7: THE DYNAMIC ATMOSPHERE
10. Location C most likely experiences
(1) low air pressure and little precipitation(2) low air pressure and abundant precipitation(3) high air pressure and little precipitation(4) high air pressure and abundant precipitation
Part C
Base your answers to questions 11 through 13 on the map and data tables below,which show geographic and climate information for two towns in Australia.
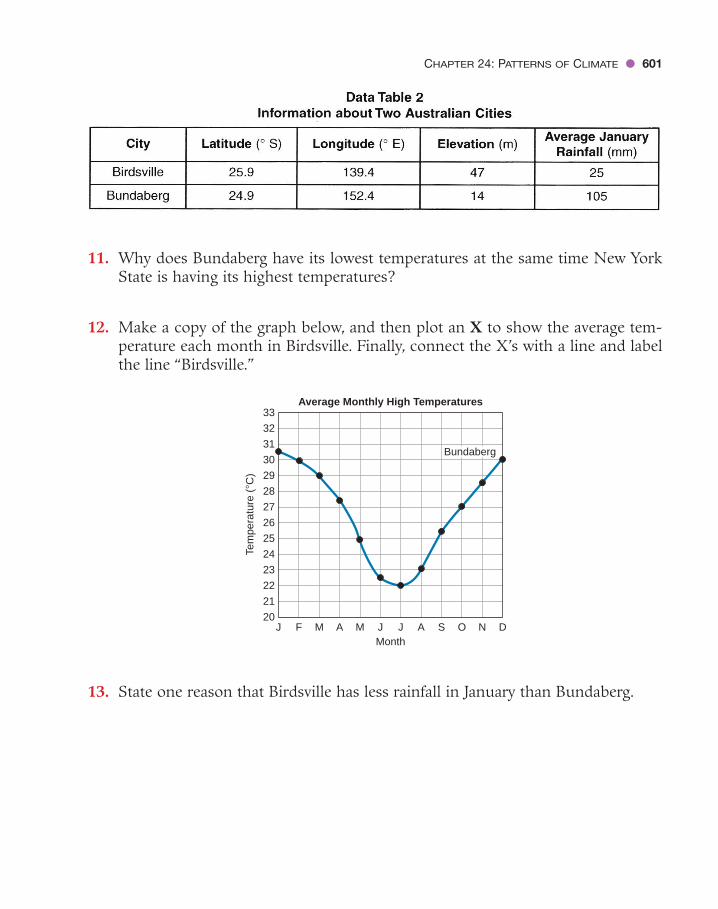
CHAPTER 24: PATTERNS OF CLIMATE ● 601
11. Why does Bundaberg have its lowest temperatures at the same time New YorkState is having its highest temperatures?
12. Make a copy of the graph below, and then plot an X to show the average tem-perature each month in Birdsville. Finally, connect the X’s with a line and labelthe line “Birdsville.”
13. State one reason that Birdsville has less rainfall in January than Bundaberg.
21
22
23
24
25
26
27
28
29
30
31
32
F M M J JA A S O N
33
J D20
Bundaberg
Month
Average Monthly High Temperatures
Tem
pera
ture
(°C
)

602 ● UNIT 7: THE DYNAMIC ATMOSPHERE
Base your answers to questions 14 through 17 on the graph below, which showsthe annual cycle of temperature changes at two cities, X and Y. Both X and Y are atthe same latitude.
14. What is the range of average monthly temperatures at city Y?
15. What geographic factor explains why city X most likely has a greater tempera-ture change over the course of a year.
16. What evidence indicates that both city X and city Y are in the Northern Hemi-sphere?
17. How would the climate of Britain and Western Europe change if Atlantic Oceancurrents stopped moving?

CHAPTER 24: PATTERNS OF CLIMATE ● 603
Base your answers to questions 18 through 20 on the topographic profile and bargraph below, which represent rainfall and prevailing winds blowing over themountains of California.
18. Explain why Death Valley has less rainfall than the top of the Sierra NevadaMountains.
19. What is the total precipitation combined for the four points in the CoastalMountain Ranges?
20. Why are temperatures colder in the Sierra Nevada Mountains than in theCoastal Mountain Ranges?
West East
Coastal MountainRanges
San JoaquinValley
(Profile not to scale)
DeathValley
Sea Level
Sierra NevadaMountain Range
0
20
40
PacificOcean
60
0
20
40
60
Year
lyP
reci
pita
tion
(in)

Why do we explore space? Since ancient times, wise and cu-rious people have looked to the night skies for entertain-
ment and inspiration. What they saw was mysterious, changing,and yet remarkably predictable. They wondered what they werelooking at. Was this a magical palette of nature or some unknownworld? They were curious.
In modern times, we are still curious. However, our investiga-tions of the heavens have become far more sophisticated. Tele-scopes have extended our observations. Humans have visited themoon. We have sent robot explorers to Mars. Meanwhile, spin-offs of the space program such as enhanced global communica-tions, GPS systems, and medical research have clearly changed allour lives. There are also artistic discoveries such as the view of theEagle Nebula seen here. The beauty and the mysteries of space areclear in this Hubble Space Telescope image of the Eagle Nebula.
Will space colonization increase our possibilities for survival?Can we find resources of economic importance in space? Will wefind evidence of new life-forms or even another civilization? Theanswers may come very soon, or they may take centuries to an-swer. However, these could be among the most important discov-eries in human history. The sense of curiosity is the constant thatdrives inquiry through science.
• 604 •
UNIT 8
Earth andBeyond

• 605 •
Earth, Sun, and Seasons
C H A P T E R
25WORDS TO KNOW
altitude heliocentric Tropic of Cancer
Antarctic Circle revolution Tropic of Capricorn
Arctic Circle rotation vertical ray
celestial object solar noon winter solstice
equinox solar time zenith
geocentric summer solstice
This chapter will help you answer the following questions:1 What is astronomy?2 How can we locate positions in the sky?3 How does the daily path of the sun change with the
seasons?4 How does the path of the sun change with our location on
Earth?5 Do the sun and stars actually move in daily and annual
cycles?6 What are the patterns of the apparent motions of celestial
objects?

606 ● UNIT 8: EARTH AND BEYOND
WHAT IS ASTRONOMY?
The study of objects beyond Earth and its atmosphere is astron-omy. Most of our knowledge of the heavens comes through thelight (electromagnetic radiation) these objects give off or reflect. Insome ways astronomy is one of the oldest sciences. Historianshave found records of observations of the heavens that go backthousands of years. This branch of science also involves some ofthe most advanced technology. It has consistently yielded new in-sights into where we came from as well as the fundamental natureof matter and energy.
In this chapter, it will be important to distinguish between whatis apparent and what is real. For example, we observe the dailypath of the sun through the sky. We know that this cycle is causedby Earth’s rotation on its axis. However, we conduct our lives as ifthe sun actually moves around Earth. We talk about the sun ris-ing and setting as if these were real motions of the sun. We callthe motion of the sun through the sky an apparent motion becausethis movement of the sun looks real. Later in this chapter, you willlearn how scientists proved that Earth moves. However, for thesake of describing celestial events, it is convenient to stay with theEarth-centered point of view. Visit the following Web site to ac-cess a free, web-based planetarium simulator: http://www.skyviewcafe.com
STUDENT ACTIVITY 25-1 —ASTROLOGY ON TRIAL
Some people confuse astronomy with astrology. Astrology is atraditional art of using celestial observations to explain person-
ality traits based on when you were born. It also uses similar infor-mation to make predictions of the future. Astrologers divide the yearinto 12 zodiacal periods with their associated birth signs. Is astrol-ogy science? Does it work? The following is a way to test the accu-racy of astrology.
Students should work in pairs. Your teacher will read a brief de-scription of the personality traits of people born during each of the12 zodiacal time periods. Choose the one that best describes yourpartner. Then compare the dates related to each description withyour partner’s birthday. If astrology is reliable, a large portion of the
1: SCIENTIFICINQUIRY 12: INFORMATIONSYSTEMS 1, 2, 3
4: 1.1a
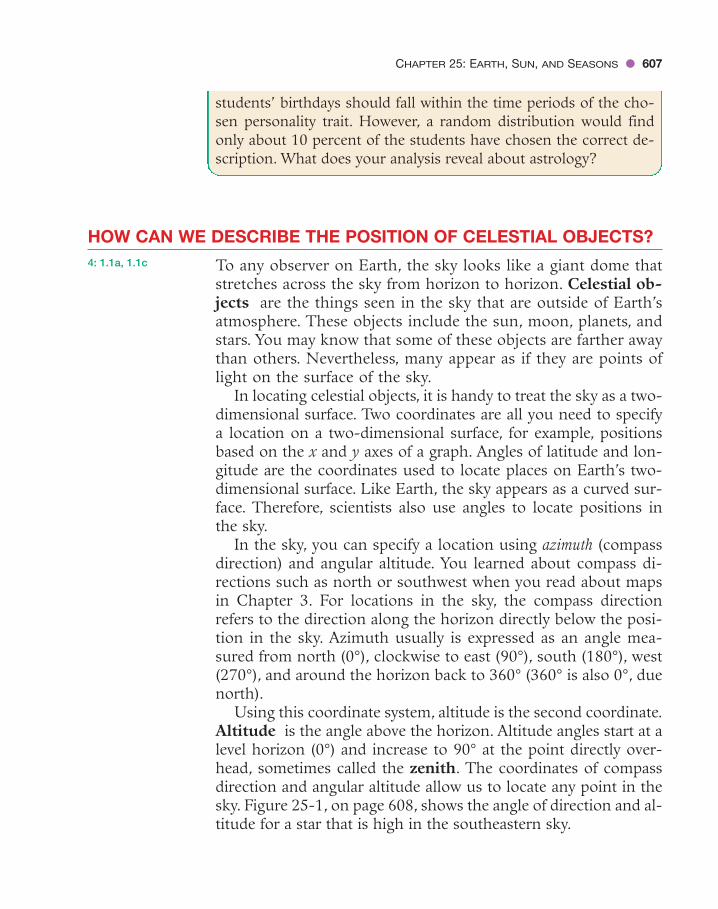
CHAPTER 25: EARTH, SUN, AND SEASONS ● 607
students’ birthdays should fall within the time periods of the cho-sen personality trait. However, a random distribution would findonly about 10 percent of the students have chosen the correct de-scription. What does your analysis reveal about astrology?
HOW CAN WE DESCRIBE THE POSITION OF CELESTIAL OBJECTS?
To any observer on Earth, the sky looks like a giant dome thatstretches across the sky from horizon to horizon. Celestial ob-jects are the things seen in the sky that are outside of Earth’satmosphere. These objects include the sun, moon, planets, andstars. You may know that some of these objects are farther awaythan others. Nevertheless, many appear as if they are points oflight on the surface of the sky.
In locating celestial objects, it is handy to treat the sky as a two-dimensional surface. Two coordinates are all you need to specifya location on a two-dimensional surface, for example, positionsbased on the x and y axes of a graph. Angles of latitude and lon-gitude are the coordinates used to locate places on Earth’s two-dimensional surface. Like Earth, the sky appears as a curved sur-face. Therefore, scientists also use angles to locate positions inthe sky.
In the sky, you can specify a location using azimuth (compassdirection) and angular altitude. You learned about compass di-rections such as north or southwest when you read about mapsin Chapter 3. For locations in the sky, the compass directionrefers to the direction along the horizon directly below the posi-tion in the sky. Azimuth usually is expressed as an angle mea-sured from north (0°), clockwise to east (90°), south (180°), west(270°), and around the horizon back to 360° (360° is also 0°, duenorth).
Using this coordinate system, altitude is the second coordinate.Altitude is the angle above the horizon. Altitude angles start at alevel horizon (0°) and increase to 90° at the point directly over-head, sometimes called the zenith. The coordinates of compassdirection and angular altitude allow us to locate any point in thesky. Figure 25-1, on page 608, shows the angle of direction and al-titude for a star that is high in the southeastern sky.
4: 1.1a, 1.1c

OUR INTERNAL CLOCK
Like most other animals on Earth, humans have an internal clockthat works on a 24-h cycle. This cycle is called the circadianrhythm. Scientists have conducted experiments in which peoplewere voluntarily isolated in special rooms. The people received nonatural light and no clues to tell day from night. After a while, thesubjects established their own periods of sleep and activity. Theyusually settled into a cycle that was about 24 h in length. Thiscycle is a natural part of our biochemical identity.
Travelers who journey east or west across a few time zones maynotice the functioning of their internal clock. They experience jetlag. This may include difficulty sleeping when the people aroundthem are going to bed. Their ability to concentrate can be harmedat the time they would have been sleeping at home. However, aftera few days or a week, most people adjust to the new time routine,and the effects of jet lag go away.
How Is Clock Time Established?
The daily cycle of night and day is so much a part of our livesthat our system of clock time is based on the length of the day.
4: 1.1d
608 ● UNIT 8: EARTH AND BEYOND
★
West
EastSoutheast
Zenith:90°
NorthSouth
Horizon
Angle of direction:135°
Angle of altitude:60°
FIGURE 25-1. Any point in the sky can be located by two angles. The azimuthangle of direction is the clockwise angle from due north to a place on thehorizon directly below the point in the sky. The angle of altitude is the anglefrom the horizon up to that point.

The daily and yearly cycles of the sun have an enormous effecton us.
Most nations use the International System of Units (metricsystem). In this system, most measures are related to larger andsmaller units by a factor of 10. However, the worldwide system oftime is still a 24-h day with 60 minutes in an hour and 60 sec-onds in a minute. Calendar time is based on the cycle of seasonsand Earth’s revolution around the sun. A year is approximately365 days.
Two regions on Earth do not have a 24-h cycle of night andday. The North and South Poles are on a yearly cycle of daylightand darkness. At both poles sunrise occurs about the first dayof spring in that hemisphere. The sun remains continuouslyvisible in the sky for 6 months, until the first day of autumn inthat hemisphere. The dark of night begins a few weeks after thattime, and continues for nearly the next 6 months. Humans areunable to adapt their activities to a 12-month cycle of day andnight.
At these two locations there is no natural way to assign clocktime. There is no settlement at the North Pole. However, theUnited States does maintain a permanent research station at theSouth Pole. Clocks at the South Pole are set to the time in NewZealand, the closest inhabited area, and the place from whichmost people fly to the South Pole research station.
WHAT IS THE SUN’S APPARENT PATH ACROSS THE SKY?
For most observers on Earth, the sun rises in the eastern part ofthe sky. The sun reaches its greatest angular altitude at solarnoon. It then moves down to dip below the western horizon. Thisapparent motion of the sun is the basis for the earliest clocks:sundials.
Local solar noon occurs when the sun reaches its highestpoint in the sky. For mid-latitude locations in the Northern Hemi-sphere, such as New York State, at solar noon the sun reaches itshighest point when it is due south. The noon sun is never directlyoverhead (at zenith) in New York State. In fact, the sun is never atthe zenith except for observers located between the Tropic ofCapricorn (23.5°S) and the Tropic of Cancer (23.5°N).
4: 1.1d
14
CHAPTER 25: EARTH, SUN, AND SEASONS ● 609

610 ● UNIT 8: EARTH AND BEYOND
STUDENT ACTIVITY 25-2 —THE LENGTH OF A SHADOW
Select a place where buildings or trees do not block the sun foran extended period. During the course of 1 day, take measure-
ments of the changes in length of the shadow of a vertical object 1m tall (1 meter � 39.37 inches). Use these measurements to draw agraph of the change in length of the shadow from sunrise to sun-set. Measurements must be made on a level surface. Think aboutthe best times to take measurements and which values of shadowlength you can determine by logical thinking. Your teacher will col-lect your data table and your graph.
According to your graph, what was the clock time of solar noon?As an extended activity, make the changing direction of the shadowpart of your data and your graph.
STUDENT ACTIVITY 25-3 —CONSTRUCTING A SUNDIAL
Internet sources (see below) as well as books have plans for mak-ing a simple paper or cardboard sundial. All individuals or groups
of students can make the same style, or each can select a differentdesign to construct.
You must position your sundial carefully in an open area on a levelsurface with a north–south alignment. (Be sure to determine truenorth, not magnetic north.) You can check your sundial by com-paring its reading with a clock or watch. Solar time and clock time willdiffer depending on your longitude even if you account for daylightsaving time. Visit one of the following Web sites to learn how to makeyour own sundial: http://www.mysundial.ca/sdu/sdu_cd_sundial.html or http://www.scribd.com/doc/47530/Building-a-sundial
HOW DOES THE SUN’S PATH CHANGE WITH THE SEASONS?
The previous section did not specify the exact direction of sunriseand sunset, nor did you learn how high the noon sun reaches inNew York State. These observations depend on the time of year.
4: 1.1d, 1.1f, 1.1g,1.1h
1: ENGINEERINGDESIGN 1
1: SCIENTIFICINQUIRY 1, 2, 3
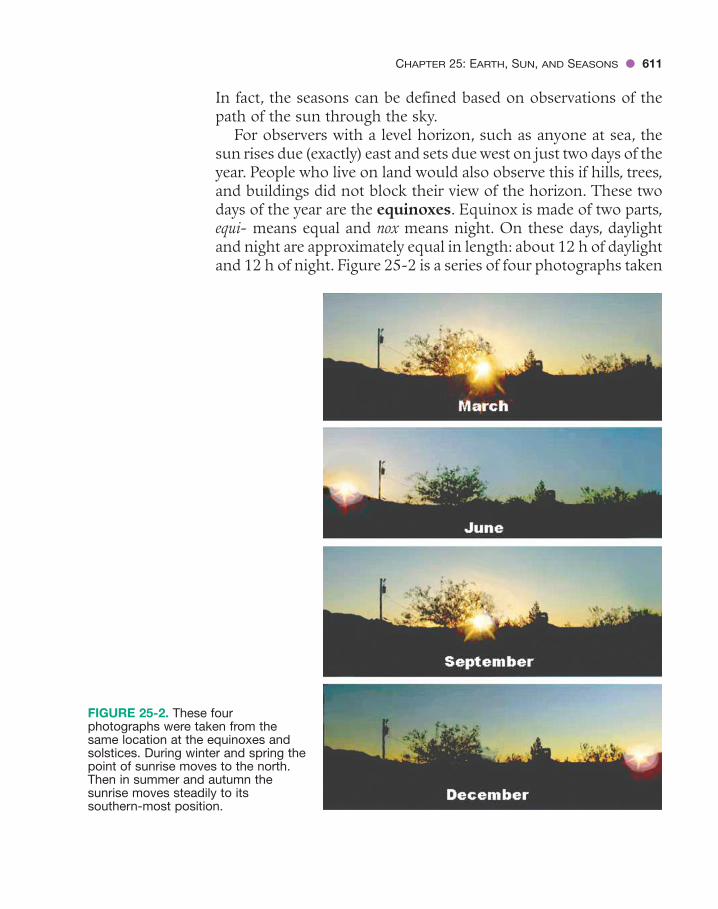
CHAPTER 25: EARTH, SUN, AND SEASONS ● 611
In fact, the seasons can be defined based on observations of thepath of the sun through the sky.
For observers with a level horizon, such as anyone at sea, thesun rises due (exactly) east and sets due west on just two days of theyear. People who live on land would also observe this if hills, trees,and buildings did not block their view of the horizon. These twodays of the year are the equinoxes. Equinox is made of two parts,equi- means equal and nox means night. On these days, daylightand night are approximately equal in length: about 12 h of daylightand 12 h of night. Figure 25-2 is a series of four photographs taken
FIGURE 25-2. These fourphotographs were taken from thesame location at the equinoxes andsolstices. During winter and spring thepoint of sunrise moves to the north.Then in summer and autumn thesunrise moves steadily to itssouthern-most position.

612 ● UNIT 8: EARTH AND BEYOND
from the same position. Note how the direction of sunrise changesin an annual cycle.
It is useful to remember that the complete apparent path of thesun is a circle. Part of this circle is above the horizon and part isbelow the horizon. The total angular distance around a circle is360°. Furthermore, the apparent motion of the sun along that cir-cle is constant. The rate at which the sun appears to move is de-termined by dividing 360° by 24 h, which equals 15°/h. No matterwhen or where you observe the sun, it always appears to move ata rate of 15°/h. However, the length of daylight changes. This isbecause the portion of the circle that is above or below the hori-zon changes on a yearly cycle.
Spring
Consider the changing path of the sun for an observer facingsouth at 42° north latitude in New York State. March 21 is ourspring equinox, as shown in Figure 25-3. (This is also called the ver-nal equinox.) The sun rises due east at 6 A.M. It moves to the ob-server’s right as it climbs to a noon altitude angle of 48°. (That isjust a little more than half way from the horizon to the zenith,straight overhead.) In the afternoon, the sun continues to theright, setting due west at 6 P.M. Of the sun’s circular path of 360°,half is in the sky and half below the horizon, so there are 12 h ofdaylight.
South
Sunrise
Sunset
Noon sun at theequinoxes(Mar. & Sept.)
East
West
North
Vertical
Zenith Observer's north-southline on celestial sphere
Horizon
48° inNew YorkState
FIGURE 25-3. This figure shows the sun’s path at 42° north latitude on theequinoxes. You are looking down on the dome of the sky, unlike the view ofthe observer under the sky, seen in Figure 25-2.

CHAPTER 25: EARTH, SUN, AND SEASONS ● 613
Summer
The longest period of daylight in New York State occurs 3 monthsafter the spring equinox. It usually occurs on June 21. It is calledour summer solstice. On this date, the sun rises in the northeastat about 4:30 A.M. standard time (5:30 A.M. daylight saving time)and sets at about 7:30 P.M. standard time (8:30 P.M. daylight sav-ing time). (Figure 25-4.)
New York has about 15 hours of daylight at the summer sol-stice because the sun rises well into the northeast and sets in thenorthwest. Therefore, more than 60 percent of the sun’s circularpath is above the horizon. This is also when the noon sun is high-est in the sky in New York State about 71.5° above the horizon(but still 18.5° below the zenith). Insolation is strongest at thistime of the year. The season of summer begins on the summersolstice.
Autumn
The autumnal equinox occurs about September 22. On that day sun-rise occurs at 6 A.M. due east, and sunset at 6 P.M. due west. Thesun follows the same path it took 6 months earlier at the springequinox. Figure 25-5, on page 614, is appropriate for both equi-noxes. Because there are not exactly 365 days in a year, periodic
South
Sunrise
Sunset
Noon sun atsummer solstice(June)
East
West
North
Vertical
Zenith Observer's north-southline on celestial sphere
Horizon
EquinoxPath
23 °12
FIGURE 25-4. In New York State on the summer solstice, the sun rises in thenortheast at about 4:30 A.M. (standard time) and sets in the northwest about7:30 P.M., providing 15 h of daylight. The sun reaches its highest point at noonwhen it is nearly 72° above the southern horizon. The sun’s path in March isshown by a dotted line.

adjustments must be made in our calendars. Therefore, the dates ofthe beginning of the seasons vary slightly from year to year.
Winter
The first day of winter in the Northern Hemisphere occurs eachyear between December 21 and December 23, which is called thewinter solstice. On that day, the sun rises in the southeast, asshown in Figure 25-5. Its path through the sky is relatively shortand the sun sets in the southwest. Less than 40 percent of the sun’scircular path is above the horizon. Sunrise does not occur untilabout 7:30 A.M., and the sun sets at about 4:30 P.M. The length ofdaylight at 42° north latitude on the winter solstice is about 9 h.
The maximum altitude of the sun, at solar noon, is only about24.5° above the southern horizon.The sun is never very high in thesky, even at noon.This is why solar energy is weakest at this time ofyear. This pattern of change is similar for all mid-latitude locationson Earth, although the angular altitude of the noon sun doeschange with latitude. Visit the following Web site to learn aboutone of many Native American constructions to follow the seasonsby the changing path of the sun: http://solar-center.stanford.edu/AO/bighorn.html
For mid-latitude locations such as New York State, the seasonalchanges can be summarized as follows:
614 ● UNIT 8: EARTH AND BEYOND
South
Sunrise
Noon sunat wintersolstice(Dec.)
East
West
North
Vertical
Zenith Observer's north-southline on celestial sphere
Horizon
Equinoxes
Summersolstice
23 °12
Sunset
FIGURE 25-5. In New York State on the winter solstice, the sun rises in thesoutheast at about 7:30 A.M., and sets in the southwest about 4:30 P.M.,giving just 9 h of daylight. The sun reaches its highest point at noon when it is24.5° above the southern horizon. Dotted lines show the sun’s path at theequinoxes and the summer solstice.
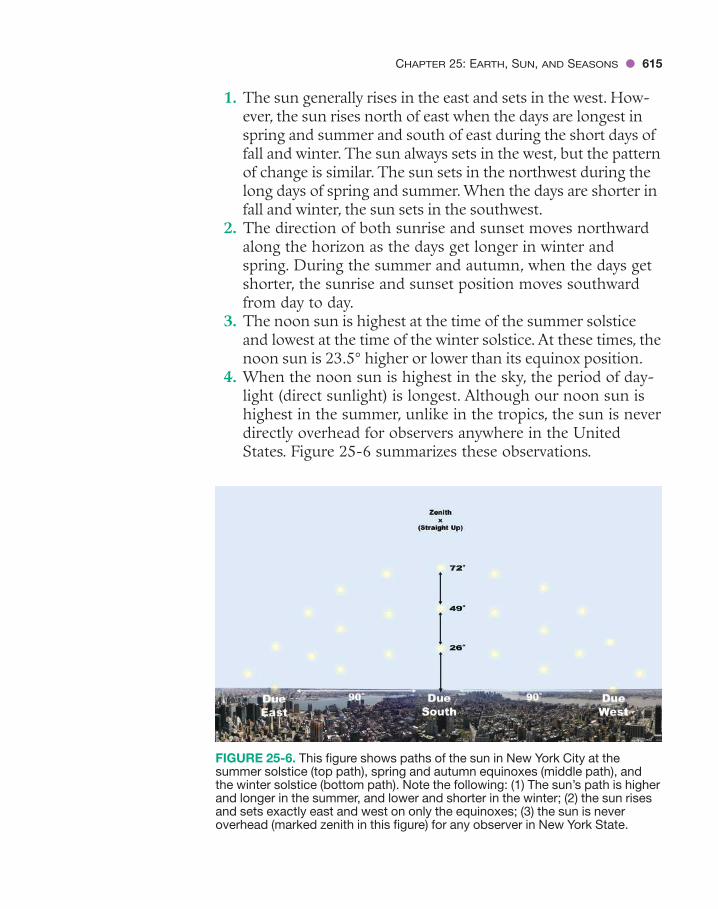
1. The sun generally rises in the east and sets in the west. How-ever, the sun rises north of east when the days are longest inspring and summer and south of east during the short days offall and winter. The sun always sets in the west, but the patternof change is similar. The sun sets in the northwest during thelong days of spring and summer. When the days are shorter infall and winter, the sun sets in the southwest.
2. The direction of both sunrise and sunset moves northwardalong the horizon as the days get longer in winter andspring. During the summer and autumn, when the days getshorter, the sunrise and sunset position moves southwardfrom day to day.
3. The noon sun is highest at the time of the summer solsticeand lowest at the time of the winter solstice. At these times, thenoon sun is 23.5° higher or lower than its equinox position.
4. When the noon sun is highest in the sky, the period of day-light (direct sunlight) is longest. Although our noon sun ishighest in the summer, unlike in the tropics, the sun is neverdirectly overhead for observers anywhere in the UnitedStates. Figure 25-6 summarizes these observations.
CHAPTER 25: EARTH, SUN, AND SEASONS ● 615
FIGURE 25-6. This figure shows paths of the sun in New York City at thesummer solstice (top path), spring and autumn equinoxes (middle path), andthe winter solstice (bottom path). Note the following: (1) The sun’s path is higherand longer in the summer, and lower and shorter in the winter; (2) the sun risesand sets exactly east and west on only the equinoxes; (3) the sun is neveroverhead (marked zenith in this figure) for any observer in New York State.

616 ● UNIT 8: EARTH AND BEYOND
STUDENT ACTIVITY 25-4 —TRACING THE DAILY PATH OF THE SUN
For this activity, you will need a transparent hemisphere about30 cm (12 in.) in diameter. You can get these hemispheres from
educational materials suppliers. However, you may also be able tofind a cheaper alternative such as a cake dome or a plastic container.Use a water-soluble marker to make a dot on the center of thedome. Get a square of cardboard about 45 cm (18 in.) on a side.Make a mark in the center of a piece of cardboard. Mount the domeon the cardboard base so that the dot on the cardboard is directlyunder the dot on the plastic dome. Place the mounted dome on aflat surface such as a sidewalk that has a broad view of the sky. Youwill need to mark this placement carefully so you can bring thedome back and place it in exactly the same position. As you repeatthis procedure, you will make a line of dots that show a sun path onyour hemisphere that looks similar to one of the paths shown inFigure 25-6, on page 615.
STUDENT ACTIVITY 25-5 —OBSERVING THE SUN
CAUTION: It is dangerous to look directly at the sun, especially fora long time because of the potential for damage to your eyes. Thisdanger is much greater if a person is looking through a telescope,which can concentrate the sun’s energy. It is best to never look di-rectly at the sun through any optical device. However, there are tworelatively safe ways to observe the sun.
One relatively safe method is to use a small reflecting telescopeto project an image of the sun. Direct the sunlight onto a sheet
of paper mounted inside a cardboard box. Focus the image on thepaper with the eyepiece. The box shields the paper screen from di-rect sunlight. To repeat: Never look directly at the sun through anyoptical device.
A second method to project an image of the sun makes use of aspecial kind of mirror called a front-sided mirror. Most mirrors havethe silver reflective coating behind the glass to protect the coatingfrom scratches. A front-sided mirror has the coating on the front ofthe glass. Front-sided mirrors can be purchased from scientific sup-ply companies. This activity works best with a tiny piece of mirrorroughly 0.5 cm (0.25 in.) square. (The shape is not important.)
1: SCIENTIFICINQUIRY 1, 2, 3
1: SCIENTIFICINQUIRY 1, 2, 3
CHAPTER 25: EARTH, SUN, AND SEASONS ● 617
Mount the small piece of front-sided mirror on a tripod so it re-flects a beam of sunlight through a window. Project the reflectiononto a light-colored interior wall of a darkened room. Although itcan be difficult to aim this reflection, the image projected inside canbe used for two purposes. This procedure creates a dim image of thesun, revealing details on the solar surface. It can also be used to ob-serve and even measure the sun’s apparent motion through the sky.
DOES THE SUN’S PATH DEPEND ON THE OBSERVER’S LOCATION?
At any particular time, half of Earth is lighted and half is in shadow.Whether it is day or night depends on where you are located. Thisis a consequence of living on a spherical planet.
Changes with Longitude
If you telephone a friend in California, you need to remember thatthe sun rises in New York 3 h before it rises in California. This iswhy it is better to telephone friends on the West Coast late in theevening, rather than early in the morning. For example, if it isnoon in New York State, it is only 9 A.M. in California. This is dueto Earth’s rotation at 15°/h. Local time generally changes by 1 hfor each 15° change of longitude east or west. This is why Earthis divided into time zones that generally are 1 h apart for each 15°change in longitude.
Changes with Latitude
Although the local solar time does not change with latitude, thepath of the sun through the sky does change. You have alreadyread that observers at the North or South Pole experience 6months of daylight followed by nearly 6 months of night. (Ofcourse dawn and dusk extend light for a while before sunrise andafter sunset.) In fact, every location on Earth has a total of 50 per-cent of the year when the sun is in the sky and 50 percent whenit is below the horizon. However, as a result of Earth’s curvature,the cycle of day and night is most changeable at the poles andmost constant near the equator.
People at the equator experience approximately 12 h of daylightevery day. Changes from season to season are hardly noticeable.
4: 1.1d, 1.1f, 1.1h

618 ● UNIT 8: EARTH AND BEYOND
The position of sunrise along the horizon changes, as it does inthe mid-latitudes such as New York. However, the noon sun is al-ways high in the sky. When it is spring and summer in the North-ern Hemisphere, the sun rises to the north of east at the equator.The noon sun is a little north of the zenith (the point straightoverhead). From late September through most of March the sunrises in the southeast and reaches its highest point a little south ofthe zenith. At the equinoxes the sun rises due east, sets due west,and the noon sun is directly overhead at the equator.
Moving out of the tropics, you would notice that the noonsun is never directly overhead. You would also notice distinctseasons and changes in the length of daylight. South of the equa-tor, the seasons are the opposite of those in New York. Whenit is summer here and the days are long, it is winter south of theequator and daylight is short. When it is spring in New York,days are getting longer and the noon sun moves higher in thesky each day. At the same time, it is autumn south of the equa-tor where the opposite changes are happening: the days are get-ting shorter and the sun moves lower in the sky each day. Visitthe following Web site to calculate times of sunrise and sunset forany date and world location: http://www.arachnoid.com/lutusp/sunrise
WHAT IS REALLY MOVING—SUN OR EARTH?
This was an easy question for our ancestors to answer. They couldnot feel the ground moving. Their observations fit the idea thatthe sun circles Earth in a daily path that changes through the year.Self-evident (apparent) as this is, you have learned that this inter-pretation is not correct. Sometimes it is hard to know what ismoving and what is not. You may have learned that Earth rotatesat more than 1000 km/h at the latitude of New York State. (Thatis about 700 mph.) How can we be sure that we, standing onplanet Earth, are spinning at this speed?
The Geocentric Model
For many centuries, people thought of the sky as a great dome overa flat Earth. For most people, the idea of a stationary Earth was log-ical and consistent with all their experiences.This is called the geo-centric model. (The prefix geo- refers to Earth, as in geology, the
1: SCIENTIFICINQUIRY 14: 1.1d, 1.1e, 1.1f,1.1g, 1.1h

CHAPTER 25: EARTH, SUN, AND SEASONS ● 619
study of the solid Earth.) Geocentric means Earth-centered. Thegeocentric model assumed Earth was stationary and the real mo-tion of celestial objects caused the motions seen in the sky. For ex-ample, consider the photographs and diagrams of the sky that youhave seen so far in this chapter. Every one of them seems to indi-cate that Earth is not moving. What would someone find if hecould travel to the edge of a flat Earth?
As early as 2000 years ago, some scholars made observationsthat caused them to question this traditional view of Earth. Theseobservations led some scholars to consider the idea that Earth isnot a flat surface, but a huge sphere.
Heliocentric Model
Copernicus published his ideas about the sun-centered model inPoland in 1543. It was controversial. In the early 1600s, Italianmathematician and inventor Galileo published his own observa-tions supporting the sun-centered model. Important clues camefrom observations of the motions of planets in the night sky. Ger-man astronomer Johannes Kepler developed the mathematicaltools needed to predict the positions of the planets among thestars. However, his theories made sense only if he assumed thatthe planets, including Earth, orbit the sun. This is the central ideaof the heliocentric model of the universe. (The prefix helio- refersto the sun.) The heliocentric model places the sun at the center ofplanetary motion. Figure 25-7 compares the geocentric and helio-centric models.
Mercuryor Venus Mercury
or VenusSun
OtherPlanets
StationaryEarth
Geocentric Heliocentric
OtherPlanets
SunRotating
Earth
FIGURE 25-7. Arrows in thegeocentric model show thedirection of motion in orbits.The complicated paths ofthe planets among the starsrequired astronomers toadd circles to the orbits, asshown by the dashedfigures. Astronomers grewto prefer the heliocentric(sun-centered) modelbecause it is simpler andeasier to explain without theextra circles.

According to the heliocentric model, it is mainly the motionsof Earth that cause the apparent motions of celestial objects. Themotion of the planets in their orbits around the sun is known asrevolution. The heliocentric model also includes the rotation, orspin, of Earth on its axis.
An easy way to remember the difference between rotation andrevolution is to remember that a top is a spinning toy. Rotationhas two Ts, the first letter of top. The American Revolution startedin 1776, which is a year. A revolution is the yearly cycle of Earth’smotion in its orbit around the sun.
Experimental proof of Earth’s motion was not discovered until1851. By then, most astronomers already supported the heliocen-tric model. Motions of the planets in the geocentric model had be-come too complicated to explain by the laws of physics.
Proof of Earth’s Rotation
Jean Foucault invented a pendulum that is free to rotate as itswings back and forth. Figure 25-8 is a drawing of a Foucault pen-dulum. If a Foucault pendulum were located at the North orSouth Pole, it would seem to rotate in a complete circle every 24 h(15°/h) as Earth spins underneath it. At the equator, a Foucault
620 ● UNIT 8: EARTH AND BEYOND
FIGURE 25-8. Theapparent rotation of aFoucault pendulum isexperimental proof thatEarth rotates. As thependulum swings back andforth, it also slowly rotates.One complete rotationtakes 24 h at the poles.However, the time perrotation increases if thependulum is moved towardthe equator.

pendulum does not seem to rotate at all because of its orientationwith Earth’s axis. It is important to remember that the Foucaultpendulum swings in the same plane as the Earth rotates beneathit. A Foucault pendulum in New York State takes about 36 h tocomplete one apparent rotation. Visit the following Web site tolearn about the history and operation of a Foucault pendulum:http://www.calacademy.org/products/pendulum
The Coriolis effect is the second proof of Earth’s rotation. Dueto the Coriolis effect, winds in the Northern Hemisphere appearto curve to their right as they move out of a high-pressure system.Ocean currents in this hemisphere also curve to their right. Theapparent curve to the right is actually a result of the winds andocean currents trying to follow a straight path on a moving planet.Remember that this apparent curve is to the left in the SouthernHemisphere.
Earth’s Motions as Viewed from Space
If you could view Earth from a stationary position in space beyondEarth’s orbit, you might see the planet at one of the positions shownin Figure 25-9. This diagram shows Earth’s two most important
CHAPTER 25: EARTH, SUN, AND SEASONS ● 621
Equator
Equator
NorthPoleArctic CircleNew York
Antarctic Circle
Orbital MotionTo Polaris
NIGHT
JUNE 21:SUMMER SOLSTICE
DECEMBER 22:WINTER SOLSTICE
SEPTEMBER 22:AUTUMNAL EQUINOX
MARCH 21:VERNAL EQUINOX
DAY
SUN
South Pole
Vertical Ray at the Equator
231/2° North
231/2° North
Vertical ray at the
Tropic of Cancer
Vertical ray at the
Tropic of Capricorn
(minimum distance) 91 million miles
(maximum distance) 95 million miles
NOT DRAWN TO A UNIFORM SCALE
Revolution
231/2°Rotation
FIGURE 25-9. The seasons are the result of the tilt of Earth’s axis at 23.5° andits annual revolution around the sun. Notice that Earth is slightly closer to thesun when it is winter in the Northern Hemisphere. So our seasons are not aresult of the changing distance from the sun. The seasons labeled on thisdiagram apply only to the Northern Hemisphere.

motions: rotation and revolution. Note that this diagram is notdrawn to a uniform scale. From outside Earth’s orbit, the sun wouldappear as a tiny circle of light. Except near its closest position, Earthwould be so small you couldn’t see it at all. In addition, at any giventime Earth is at only one position in its orbit. Earth revolves aroundthe sun in an annual cycle.With 365 days in a year and 360° in a cir-cle, the planet revolves a little less than 1° in its orbit each day.
Earth’s Motions and the Seasons
The seasons are caused by a combination of two Earth motions.In addition to its revolution, Earth rotates on an axis that is tiltedapproximately 23.5° from a direction perpendicular to the planeof its orbit. The direction Earth’s axis points is constant through-out the year. At this time in history, Polaris appears very close tothe location in space directly above the North Pole. However, forhalf of the year, our spring and summer, the Northern Hemi-sphere is tilted toward the sun. For the other half of the year, ourautumn and winter, the Northern Hemisphere is tilted away fromthe sun.
The latitude at which the vertical ray of sunlight strikes Earthdetermines the beginning of each season. The vertical ray is sun-light that strikes Earth’s surface at an angle of 90°. It is sometimescalled the direct ray of sunlight. This ray strikes Earth at a posi-tion where the sun is directly overhead, that is at the zenith. Thisvertical ray of sunlight always hits Earth within the tropics. How-ever, its position changes in an annual cycle.
SPRING The spring, or vernal, equinox occurs near the end ofMarch. It is shown by the top Earth position in Figure 25-9. Atthat time, the vertical ray is at the equator, and spring begins in theNorthern Hemisphere (autumn in the Southern Hemisphere).Earth’s axis is pointed neither toward nor away from the sun, andmost of the planet receives 12 h of daylight. The exceptions arethe North and South Poles, where the sun circles along the hori-zon, resulting in twilight for 24 h.
SUMMER Over the next 3 months, Earth moves toward the Junesolstice, the beginning of summer in the Northern Hemisphere.At this time, the North Pole is tilted toward the sun. The vertical
622 ● UNIT 8: EARTH AND BEYOND
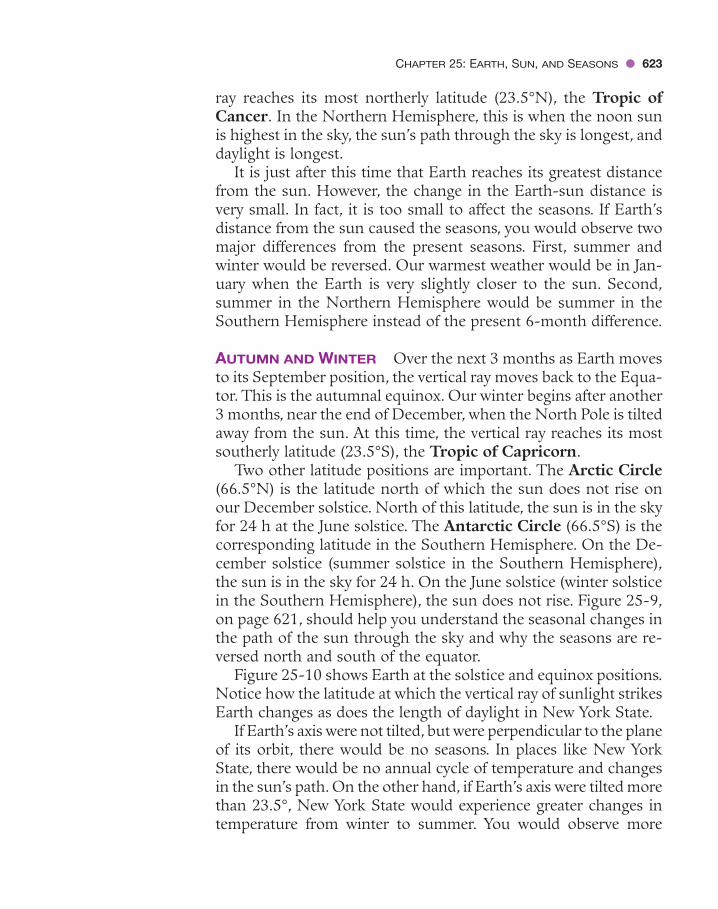
ray reaches its most northerly latitude (23.5°N), the Tropic ofCancer. In the Northern Hemisphere, this is when the noon sunis highest in the sky, the sun’s path through the sky is longest, anddaylight is longest.
It is just after this time that Earth reaches its greatest distancefrom the sun. However, the change in the Earth-sun distance isvery small. In fact, it is too small to affect the seasons. If Earth’sdistance from the sun caused the seasons, you would observe twomajor differences from the present seasons. First, summer andwinter would be reversed. Our warmest weather would be in Jan-uary when the Earth is very slightly closer to the sun. Second,summer in the Northern Hemisphere would be summer in theSouthern Hemisphere instead of the present 6-month difference.
AUTUMN AND WINTER Over the next 3 months as Earth movesto its September position, the vertical ray moves back to the Equa-tor. This is the autumnal equinox. Our winter begins after another3 months, near the end of December, when the North Pole is tiltedaway from the sun. At this time, the vertical ray reaches its mostsoutherly latitude (23.5°S), the Tropic of Capricorn.
Two other latitude positions are important. The Arctic Circle(66.5°N) is the latitude north of which the sun does not rise onour December solstice. North of this latitude, the sun is in the skyfor 24 h at the June solstice. The Antarctic Circle (66.5°S) is thecorresponding latitude in the Southern Hemisphere. On the De-cember solstice (summer solstice in the Southern Hemisphere),the sun is in the sky for 24 h. On the June solstice (winter solsticein the Southern Hemisphere), the sun does not rise. Figure 25-9,on page 621, should help you understand the seasonal changes inthe path of the sun through the sky and why the seasons are re-versed north and south of the equator.
Figure 25-10 shows Earth at the solstice and equinox positions.Notice how the latitude at which the vertical ray of sunlight strikesEarth changes as does the length of daylight in New York State.
If Earth’s axis were not tilted, but were perpendicular to the planeof its orbit, there would be no seasons. In places like New YorkState, there would be no annual cycle of temperature and changesin the sun’s path. On the other hand, if Earth’s axis were tilted morethan 23.5°, New York State would experience greater changes intemperature from winter to summer. You would observe more
CHAPTER 25: EARTH, SUN, AND SEASONS ● 623

624 ● UNIT 8: EARTH AND BEYOND
Summer Solstice
June 21Vertical ray
Arctic
N.P.
15 hr.
15 hr.
9 hr.
9 hr.
S.P.
CancerEquator
Capricorn
Antarctic
Winter Solstice
Dec. 21Vertical ray
Arctic
N.P.
S.P.
CancerEquator
Capricorn
Antarctic
Arctic Circle
Cancer
Equator
Capricorn
S.P.
N.P.
Spring and Fall Equinoxes
March 21or Sept. 23
Vertical ray
New York latitude,9 hr. darkness15 hr. daylight
New York latitude,9 hr. daylight
15 hr. darkness
New York latitude,12 hr. daylight12 hr. darkness
12 h
r.12 hr.
FIGURE 25-10. Noticehow the position of thevertical ray and the dailyhours of sunlight at thelatitude of New York Statechange with the seasons.

extremes in the path of the sun in its annual cycle. The sun’s pathwould be longer and higher in summer, but lower and shorter inwinter. Visit the following Web site to watch animations and readexplanations of the analemma (“equation of time”): http://www.analemma.com/Pages/framesPage.html
STUDENT ACTIVITY 25-6 —MODELING EARTH MOTIONS
Place a single bright light, representing the sun, at the center of adarkened classroom. With a globe, illustrate Earth’s motions of
rotation on its axis tilted 23.5° and revolution around the sun. No-tice how the height of the sun in New York State and the length ofdaylight change as Earth orbits the sun. In what ways is this modelunlike the real Earth and sun?
HOW DO EARTH’S MOTIONS AFFECT THE APPEARANCE OF OTHER CELESTIAL OBJECTS?
The night sky was familiar to our ancestors. They had no electriclights, television, or computers, so they watched the sky. Althoughthe stars are randomly distributed throughout the sky, ancientpeople imagined patterns in the stars.
Constellations
Certain patterns of stars are called constellations. Orion the hunteris a constellation prominent in New York’s winter sky. Near Orionis a group of stars that represent his dog and Lepus the rabbit.Other patterns represent objects such as Lyra the harp.
Constellations were often associated with traditions and legendsthat were a part of the cultural heritage. The constellation calledCassiopeia was named for an Ethiopian queen who proclaimedthat she was more beautiful than other women. Two bright stars,Castor and Pollux, dominate the constellation Gemini. In mythol-ogy, Castor and Pollux were twins.
Different cultures imagined different things about the samegroup of stars. For example, the group of stars we call The Big Dip-per is known as The Plow in Britain. To the ancient Greeks, this
4: 1.1a, 1.1g
6: MODELS 2
CHAPTER 25: EARTH, SUN, AND SEASONS ● 625

626 ● UNIT 8: EARTH AND BEYOND
was a part of the Great Bear, which we call by its Latin name, UrsaMajor. Figure 25-11 shows this constellation with a drawing of abear superimposed on the star pattern. For many constellations, ittakes a good deal of imagination to see the objects they representin the pattern of stars.
STUDENT ACTIVITY 25-7 —THE BIG DIPPER AND POLARIS
On a clear night, find the group of stars called the Big Dipper.Follow the pointer stars to Polaris. Sketch the Big Dipper
and Polaris showing their orientation with respect to the NorthernHorizon. You may wish to repeat this activity several hours later orin a few months at the same hour to see if their orientation changes.What name did slaves give this group of stars, which they followed,as they escaped from slavery before and during the American CivilWar? Visit the following Web site to learn to recognize a few of themost well-known constellations visible in North America: http://www.quietbay.net/Science/astronomy/nightsky
4: 1.1g
FIGURE 25-11. The group of stars called The Big Dipper is a part of theconstellation Ursa Major (The Great Bear). For observers in New York State,this group of stars is always visible in the northern sky as it rotates once a dayaround Polaris.
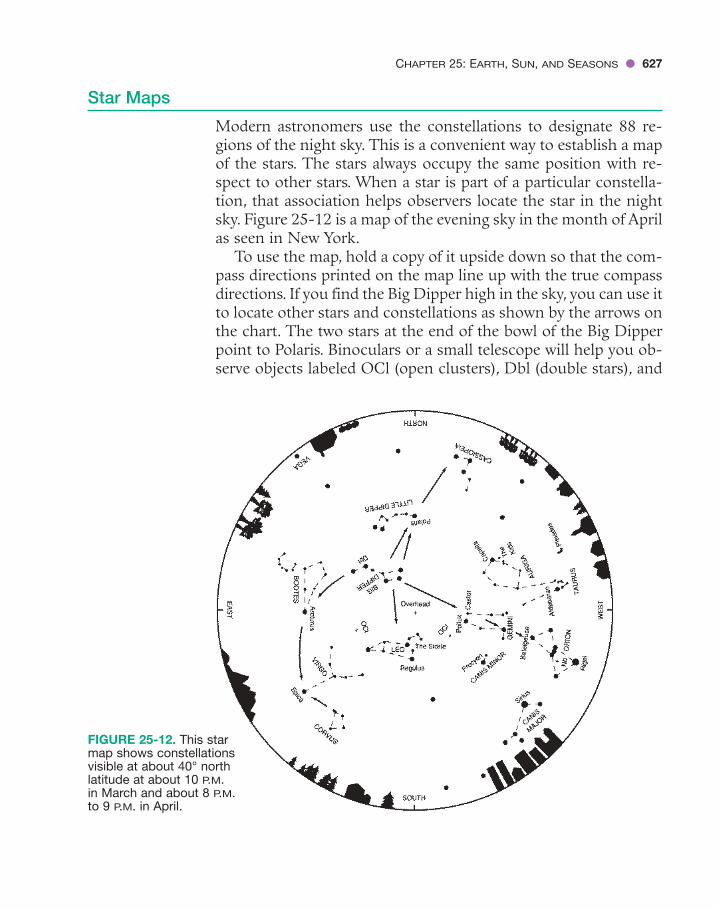
CHAPTER 25: EARTH, SUN, AND SEASONS ● 627
Star Maps
Modern astronomers use the constellations to designate 88 re-gions of the night sky. This is a convenient way to establish a mapof the stars. The stars always occupy the same position with re-spect to other stars. When a star is part of a particular constella-tion, that association helps observers locate the star in the nightsky. Figure 25-12 is a map of the evening sky in the month of Aprilas seen in New York.
To use the map, hold a copy of it upside down so that the com-pass directions printed on the map line up with the true compassdirections. If you find the Big Dipper high in the sky, you can use itto locate other stars and constellations as shown by the arrows onthe chart. The two stars at the end of the bowl of the Big Dipperpoint to Polaris. Binoculars or a small telescope will help you ob-serve objects labeled OCl (open clusters), Dbl (double stars), and
FIGURE 25-12. This starmap shows constellationsvisible at about 40° northlatitude at about 10 P.M.in March and about 8 P.M.to 9 P.M. in April.
628 ● UNIT 8: EARTH AND BEYOND
Nb (nebulae). The planets wander among the stars, so they are notshown on this chart. Current information from a newspaper or theInternet can help you locate the visible planets. Visit the followingWeb site to print a copy of the star map for the current month:http://www.kidsastronomy.com/astroskymap/constellations.htm
STUDENT ACTIVITY 25-8 —LOCATING MAJOR CONSTELLATIONS
Use a copy of Figure 25-12 or a similar star map to locate con-stellations in the night sky. Try to observe on a clear night from
a location that is far from artificial lights. The sky should not be ob-structed by nearby buildings or trees. Make a list of the constella-tions you are able to find. Number them according to how easy theywere for you to locate in the night sky. Visit the Astronomical Soci-ety of the Pacific’s Web site, scroll down to the Activity Corner:Three-Dimensional Orion: http://www.astrosociety.org/education/publications/tnl/21/constellations2.html
HOW DO EARTH’S MOTIONS SEEM TO AFFECT THE STARS?
We do not usually see stars shift their positions relative to eachother. Because of that, they are sometimes called the fixed field ofstars. However, the cycles of daily rotation and yearly revolution ofEarth influence our observations of stars. Visit the following Website to find 2300 nicely organized astronomy links to help yourWeb explorations: http://www.linktospace.com/
Daily Apparent Motions
Earth’s rotation makes stars appear to move through the sky justas the sun appears to move. In New York State, most stars, like thesun, rise in the east, travel to the right across the southern sky, andset in the west. Like the sun, their path depends on where theyrise. Stars that rise in the northeast travel high in the sky and setin the northwest. Those that rise in the southeast move lower inthe sky to set in the southwest. Figure 25-13 shows the apparentmotion of stars in the night sky.
4: 1.1a, 1.1d
1: SCIENTIFICINQUIRY 1

CHAPTER 25: EARTH, SUN, AND SEASONS ● 629
You will observe a different kind of motion in the northernpart of the sky, where the sun is never found. In earlier chapters,you read about Polaris, the North Star. Polaris is not one of thevery brightest stars, but it appears to be located almost directlyabove Earth’s North Pole near a point in the sky called the celes-tial north pole. Consequently, Polaris is the only star that does notseem to move. Actually, Polaris is not exactly above the NorthPole; therefore, it does make a very small counterclockwise circlein 24 h.
Other stars that are not as close to the celestial pole make largercircles, all at a rate of 15°/h, Earth’s rate of rotation. Due to Earth’srotation, the stars appear to rotate counterclockwise around Po-laris. This motion includes stars that rise in the east and set in thewest. In fact, all star paths can be thought of as circles around thenorth and south celestial poles. The planets and comets also showthis apparent motion, although they slowly shift their positionsamong the stars from night to night.
Figure 25-14 illustrates the trails of stars that would be ob-served in each of the four compass directions by an observer inNew York State. These diagrams show the stars rising in the east,moving through the southern sky, and setting in the west. Onlystars in the northern sky do not seem to rise and set; they appearto circle counterclockwise around Polaris. Visit the following Website to see animations of the apparent motions of the night sky:http://astro.unl.edu/naap/motion2/animations/ce_hc.swf
★
★
★
★
Polaris
Star in thenorthern sky
Celestialnorth pole
Zenith
Observer
Celestialhorizon
Starsset
Starsrise
Stars that movefrom east to west
Stars in thesouthern
sky
S
WN
EFIGURE 25-13.Due to Earth’srotation, the starsappear to rotatecounterclockwisearound Polaris.
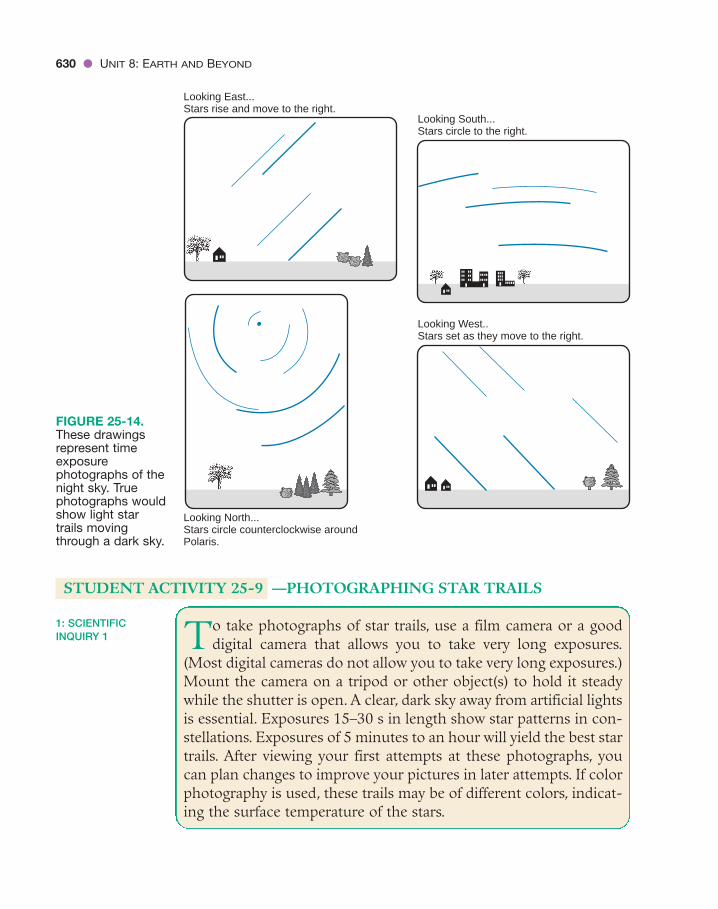
STUDENT ACTIVITY 25-9 —PHOTOGRAPHING STAR TRAILS
To take photographs of star trails, use a film camera or a gooddigital camera that allows you to take very long exposures.
(Most digital cameras do not allow you to take very long exposures.)Mount the camera on a tripod or other object(s) to hold it steadywhile the shutter is open. A clear, dark sky away from artificial lightsis essential. Exposures 15–30 s in length show star patterns in con-stellations. Exposures of 5 minutes to an hour will yield the best startrails. After viewing your first attempts at these photographs, youcan plan changes to improve your pictures in later attempts. If colorphotography is used, these trails may be of different colors, indicat-ing the surface temperature of the stars.
1: SCIENTIFICINQUIRY 1
630 ● UNIT 8: EARTH AND BEYOND
Looking East...Stars rise and move to the right.
Looking North...Stars circle counterclockwise aroundPolaris.
Looking South...Stars circle to the right.
Looking West..Stars set as they move to the right.
FIGURE 25-14.These drawingsrepresent timeexposurephotographs of thenight sky. Truephotographs wouldshow light startrails movingthrough a dark sky.

Yearly Apparent Motions
In addition to the apparent daily cycle of motion of stars throughthe sky, the stars in the evening sky also change in a yearly cycle.In the summer, Scorpio, the scorpion, with its red star, Antares, isprominent in the southern sky. At this time, the stars of Scorpioare located on the opposite side of Earth from the sun. This is whythey are visible in the night sky at that time of year.
By winter, 6 months later, Earth has revolved halfway aroundits orbit. Orion, the hunter, is now visible in the southern skyin the evening. Scorpio is still in the same place, but it is now lo-cated in the direction of the sun. Ancient people suggested thatScorpio and Orion were enemies. Therefore, they were never seenin the sky together. During the day, the sky is too bright for moststars to be visible. Figure 25-15 shows Earth’s orbit and someof the brighter constellations visible in the evening at differ-ent times of the year. Because Earth moves about 1° in its orbiteach day, changes in the evening sky are not noticeable fromnight to night. However, over a period of months this change iseasy to see.
Not all the constellations are seasonal. Stars and constellationsin the northern sky, such as Polaris in Ursa Minor (the Little Bear),Ursa Major (including the Big Dipper), and Cassiopeia, are visiblethroughout the year. However, the polar constellations that arebelow Polaris at one time of year are high in the sky, above Polaris,6 months later.
CHAPTER 25: EARTH, SUN, AND SEASONS ● 631
VegaDeneb
FALL
SPRING
SUMMERWINTERRigel
Betelgeuse
ORION(the Hunter)
CYGNUS(the Swan)
LYRA(the Lyre)
AQUILA(the Eagle)
Antares
SCORPIUS(the Scorpion)
LEO(the Lion)
SUMMER TRIANGLE
Altair
The SunEarth at Midnight
in January
Earth at Midnightin July
Regulus
FIGURE 25-15. As Earth revolves around the sun, the night (dark) side ofEarth faces different directions in space. Only constellations opposite the sunare visible because the light of the sun hides stars during the day.

STUDENT ACTIVITY 25-10 —CELESTIAL OBSERVATIONS
In this chapter, you have learned about a number of changes thatyou can observe and/or measure quite easily. For example, you can
measure the rate at which the sun moves through the sky or the ap-parent motions of stars.
The topics in this chapter relate to a number of long-range pro-jects that are not difficult to perform. You might use a digital camerato photograph the horizon, recording changes in the position of sun-set or sunrise over a period of weeks.The changing angular altitude ofthe noon sun can also be documented. Changes in the moon and thestars can also be observed and drawn or photographed.
CHAPTER REVIEW QUESTIONS
Part A
1. Earth’s spin on its axis causes the
(1) cycle of seasons(2) direction in which a wind vane points(3) movement of the Pacific tectonic plate(4) motion of a Foucault pendulum
2. The diagram below was drawn by a student who lives in a relatively flat part ofNew York State. The diagram shows the positions of sunrise at approximatelythe 20th of three consecutive months of the year. The horizontal line representsa horizon.
What months are best represented by positions A, B, and C in their properorder?
(1) February, March, April(2) May, June, July(3) June, July, August(4) August, September, October
1: SCIENTIFICINQUIRY 1, 2, 3
632 ● UNIT 8: EARTH AND BEYOND

3. Approximately how many degrees does Earth move each day in its orbit of thesun?
(1) 1°(2) 13°(3) 15°(4) 23.5°
4. The diagram below shows a demonstration of a pendulum mounted on a swivel-ing piano stool.
What does the piano stool represent?
(1) the Coriolis effect(2) the revolving Earth(3) the rotating Earth(4) the orbit of the moon
5. If the tilt of Earth’s axis were to become less than the present 23.5°, whichchange would we probably experience in New York State?
(1) Spring and fall would become cooler.(2) Spring and fall would become warmer.(3) Winter would become colder.(4) Summer would become cooler.
CHAPTER 25: EARTH, SUN, AND SEASONS ● 633

Part B
Base your answers to questions 6 and 7 on the diagrams below, which are drawingsmade by a student looking at a window at three different times during a day.
6. What causes the sunlit area on the floor to move across the room?
(1) Earth orbiting the sun at 1°/day(2) Earth spinning on its axis at 15°/h(3) the 23.5° tilt of Earth’s axis(4) the 360° angle all around Earth’s equator
7. In what direction are both the observer and the window facing?
(1) north (2) south (3) east (4) west
Base your answers to questions 8 through 10 on the following diagram, whichrepresents the sky and the changing positions of the sun. Letters A through Drepresent positions in the sky.
Solar noon
Solar noon
Solarnoon
S N
E
W
D C
B
A
Observer
Sun'sapparent
path
June 21
September 21
December 21
Mid-morning Noon Afternoon
634 ● UNIT 8: EARTH AND BEYOND

8. In which direction does sunrise occur on June 21?
(1) north of due west(2) north of due east(3) south of due west(4) south of due east
9. How many hours are there between sunrise and solar noon on September 21?
(1) 6 (3) 12(2) 8 (4) 24
10. Which letter best shows the position of Polaris in the night sky?
(1) A (3) C(2) B (4) D
Base your answers to questions 11 through 13 on the map below, which shows theextent of daylight (white) and night (shaded) on Earth at a particular day and time.The dashed lines show the Arctic Circle and the Antarctic Circle. Point A is aparticular location.
11. Approximately how many hours of daylight occur at position A on this day?
(1) 6 (2) 9 (3) 12 (4) 15
CHAPTER 25: EARTH, SUN, AND SEASONS ● 635

636 ● UNIT 8: EARTH AND BEYOND
12. Which diagram below best shows how Earth is aligned with incoming sunlighton this day?
13. On this day of the year, the duration of daylight from the equator to the ArcticCircle
(1) decreases, only (3) decreases, then increases(2) increases, only (4) increases, then decreases
14. The constellation Virgo is visible high in the evening sky only in the spring. ButPegasus is visible high only in the autumn evening sky. Why does this occur?
(1) Earth rotates on its axis.(2) Earth revolves around the sun.(3) Earth’s axis is tilted 23.5°.(4) Earth’s distance from the sun changes.
Part C
15. The diagram below is based on observations made at Ithaca, New York. Whatdoes this diagram show?
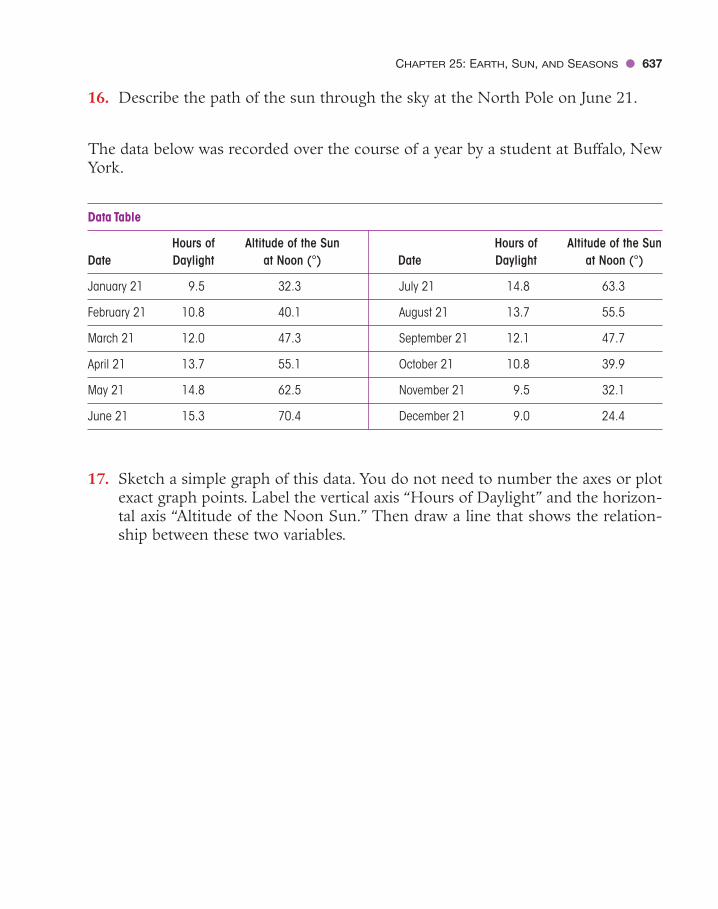
CHAPTER 25: EARTH, SUN, AND SEASONS ● 637
16. Describe the path of the sun through the sky at the North Pole on June 21.
The data below was recorded over the course of a year by a student at Buffalo, NewYork.
17. Sketch a simple graph of this data. You do not need to number the axes or plotexact graph points. Label the vertical axis “Hours of Daylight” and the horizon-tal axis “Altitude of the Noon Sun.” Then draw a line that shows the relation-ship between these two variables.
Data Table
Hours of Altitude of the Sun Hours of Altitude of the Sun Date Daylight at Noon (°) Date Daylight at Noon (°)
January 21 9.5 32.3 July 21 14.8 63.3
February 21 10.8 40.1 August 21 13.7 55.5
March 21 12.0 47.3 September 21 12.1 47.7
April 21 13.7 55.1 October 21 10.8 39.9
May 21 14.8 62.5 November 21 9.5 32.1
June 21 15.3 70.4 December 21 9.0 24.4

Base your answers to questions 18 and 19 on the diagram below, which shows theapparent path of the sun on March 21 at Buffalo, New York. Copy this diagram soyou can record your answers to the next two questions without writing in yourbook.
18. Draw a line that represents the path of the sun at the same location on May 21.Begin the line at sunrise and end it at sunset, showing the correct altitude of thenoon sun.
19. Draw an asterisk (*) to show the position of the North Star on your copy of thediagram above. (Reminder: Do not write in your book.)
20. Throughout the year, the direction in which the setting sun reaches a level hori-zon changes. What can you say about how high the noon sun is in the sky as thecompass direction of sunset moves southward?
Zenith
80° 80°60° 60°
40° 40°
20° 20°
S N
W
E
Sun atnoon
Horizon
March 21
Observerin Buffalo
638 ● UNIT 8: EARTH AND BEYOND

• 639 •
Earth, Its Moon,and Orbits
C H A P T E R
26WORDS TO KNOW
eccentricity focus lunar eclipse phase solar eclipse
eclipse gravity major axis satellite weight
ellipse inertia
This chapter will help you answer the following questions:1 What have we learned about the moon from Earth-based
observations and the Apollo space program?2 What is the shape of orbits?3 How can we explain the changing phases of the moon?4 What causes lunar and solar eclipses?
APOLLO PROGRAM
American politicians and scientists were embarrassed by the earlytriumphs of Russia in space exploration. This led to the Apolloprogram. In July of 1969, American astronaut Neil Armstrong be-came the first human to set foot on the moon. That mission alsoreturned the first samples of moon rock to Earth. In the next sixApollo missions, a total of 384 kg (845 pounds) of moon rockswere brought back to Earth for scientific study. Figure 26-1 is aphotograph from the Apollo 16 moon landing. Since the lastApollo mission in 1972, no other humans have visited the moon.
1: SCIENTIFICINQUIRY 1, 2, 3

From the Apollo program, scientists learned that the surface ofmoon contains minerals similar to those found in parts of Earth’smantle and deepcrust. Plagioclase feldspar, pyroxene, and olivineare the most common minerals in the lunar samples. Visit the fol-lowing Web site to see images and animations by JPL of and aboutthe exploration of space: http://www.jpl.nasa.gov/multimedia
WHAT IS THE HISTORY OF EARTH’S MOON?
A satellite is an object in space that revolves around another ob-ject under the influence of gravity. A moon is a natural satellite ofa planet. The moon is Earth’s only natural satellite. (Earth, like theother planets, is a satellite of the sun.) Earth is the only planet inour solar system with just one moon. Of the eight planets in oursolar system, only Mercury and Venus do not have moons. Evendwarf planets, all of which are smaller than Earth’s moon, now areknown to have their own moons.
A curious feature of our moon is that its period of rotation andrevolution are the same, about 27 days. As a result, the same sideof the moon always faces Earth. This is why features of the farside of the moon were unknown until the Russians sent a satellitearound the moon to take photographs early in the “space race.”
13
4: 1.1a, 1.1b
640 ●
FIGURE 26-1. Astronaut John W. Young stands on the powdery lunar soilat the Apollo 16 landing site. The Lunar Roving Vehicle is parked besidethe Lunar Module “Orion.” Stone Mountain dominates the background inthis lunar scene.

The Origin of Earth’s Moon
There have been several theories about the origin of the moon.Some astronomers have suggested that the moon and Earth formedas a double planet orbiting the sun. Others have proposed that themoon was an object in space that came close enough to Earth to becaptured by Earth’s gravity.
Most astronomers now agree that a collision between Earth anda smaller object probably created the moon shortly after Earth’sformation. That impact destroyed the smaller body and created adebris field in space. The debris came together under the influenceof gravity, forming our moon.
Lunar Surface
The surface of the moon has two landscape types, the lunar high-lands and the maria (from the Latin word for “seas”). The rocks ofthe lunar highlands are mostly anorthosite, a rock type found inNew York’s Adirondack Mountains. However, it is not common inmost places on Earth. The lunar maria are relatively flat and darkerin color than the highlands. They are composed of basalt, a rela-tively common dark-colored, fine-grained, igneous rock also foundon Earth.
Because the moon has no atmosphere or surface water, it hasnone of the common sedimentary rocks found on Earth. Chemi-cal weathering does not occur on the moon. However, the surfaceis covered by material from meteorites and moon rocks broken bymeteorite impacts. Breccia, a rock formed from the breakage andwelding of rock fragments, is found in the lunar highlands. Radio-metric dating has shown the oldest moon rocks are about thesame age as Earth, 4.6 billion years. Visit the following Web site toenjoy moon images with full 3-D terrain taken by the Clementinesatellite: http://worldwind.arc.nasa.gov/moon.html
The cratered surface of the moon contrasts sharply with Earth’ssurface. The highlands of the moon have been solid for more than 4billion years.Without a doubt, many large objects have hit the moonand Earth. The highlands of the moon are so covered with impactcraters that the surface seems to be made of crater upon crater.
The moon is small enough and its gravity weak enough that themoon cannot hold an atmosphere. As a result, there is no shell of
CHAPTER 26: EARTH, ITS MOON, AND ORBITS ● 641

gases surrounding the moon. Furthermore, unlike Earth, the sur-face of the moon is not composed of active tectonic plates that cre-ate and recycle surface material. Therefore, features on the moonlast much longer than they do on Earth.The only active process onthe moon is impact by meteoroids and other objects from space.Early in the history of the solar system, there were many more ofthese objects and impacts were much more common.
The dark lava flows that became the maria show that the moononce had a molten interior. Most of the moon’s volcanic eruptionsoccurred between 3.8 and 3.1 billion years ago. The maria showless cratering than the highlands. This is true because most of theimpacts that created the largest craters occurred before the surfaceof the maria had formed. By 3 billion years ago, the surface of themoon probably looked pretty much as it does today. Whether themoon still has molten rock in its interior is a question that scien-tists have not yet answered.
HOW CAN WE DESCRIBE ORBITS?
Astronomers noticed the wandering motion of the planets throughthe sky. This led to the idea that planets and the moon move in or-bits independent of the fixed stars. These orbits were originallythought to be circles. However, careful observations of the planetsshowed that their motions under the influence of gravity could beexplained best if their orbits were not circles, but ellipses.
An ellipse is a closed curve formed around two fixed points suchthat the total distance between any point on the curve and the fixedpoints is constant. The fixed points are the foci of the ellipse. (Thesingular of foci is focus.) If you use pins and a loop of string to drawan ellipse, as in Figure 26-2, the position of each pin is a focus of theellipse. The string keeps the total distance to the two foci constant.Visit the following Web site to learn how to draw an ellipse:http://www.youtube.com/watch?v�CaokHrXP8HM&feature�related
In all orbits, the object the satellite revolves around, known as theprimary, is located at one focus. For example, Earth is at one focusof the moon’s orbit. The sun is also located at one focus of Earth’sorbit. The other focus is a point in space. You should also note thatEarth is not at the center of the moon’s orbit and the sun is not at
1: MATHEMATICALANALYSIS 1, 2, 34: 1.1b
642 ● UNIT 8: EARTH AND BEYOND

the center of Earth’s orbit. If the two foci of an orbit are far apart, theorbit is noticeably out-of-round. In that case, we say the orbit has ahigh eccentricity. The orbits of the moon and Earth have the twofoci so close that the orbits are very close to perfect circles.
STUDENT ACTIVITY 26-1 —ORBIT OF THE MOON
Get the following materials: one soft board approximately 30 cm(12 in.) square (fiberboard, ceiling tile, or soft pine work well),
two straight pins, adhesive tape, one piece of light string about30–40 cm (12–20 in.) long, one sharp pencil, one clean sheet ofstandard size paper (8 in. by 11 in.), one metric ruler.
Find the center of the sheet of paper by drawing two lines thatconnect opposite corners of the paper.
1. Tie the string into a loop that is 10 cm long when fully stretched(� 0.5 cm).
2. Tape or pin the paper near the corners of the soft board.3. Stick one pin through the center of the sheet of paper and into the
soft board. Place the loop of string around it. Then stretch theloop to its greatest distance with the tip of the pencil. Keeping theloop taut and the pencil perpendicular to the paper, make a circlearound the pin. Label it “circle” along its circumference.
4. Place the two pins 4.5 cm from the center of the paper along thepaper’s long axis. Stretch the string around both pins and thenpull tightly on the string to draw an ellipse.
5. Make another ellipse by placing the two pins 1 cm apart (0.5 cmeach side of the center). Draw this ellipse and label it “Orbit ofthe Moon.”
Is the “Orbit of the Moon” noticeably elongated?
12
4: 1.1b6: MODELS 2
● 643
FIGURE 26-2. Youcan draw an ellipseby using thematerials shown inthis image. Use thepencil to hold thestring tight, andthen move thepencil to make theellipse.
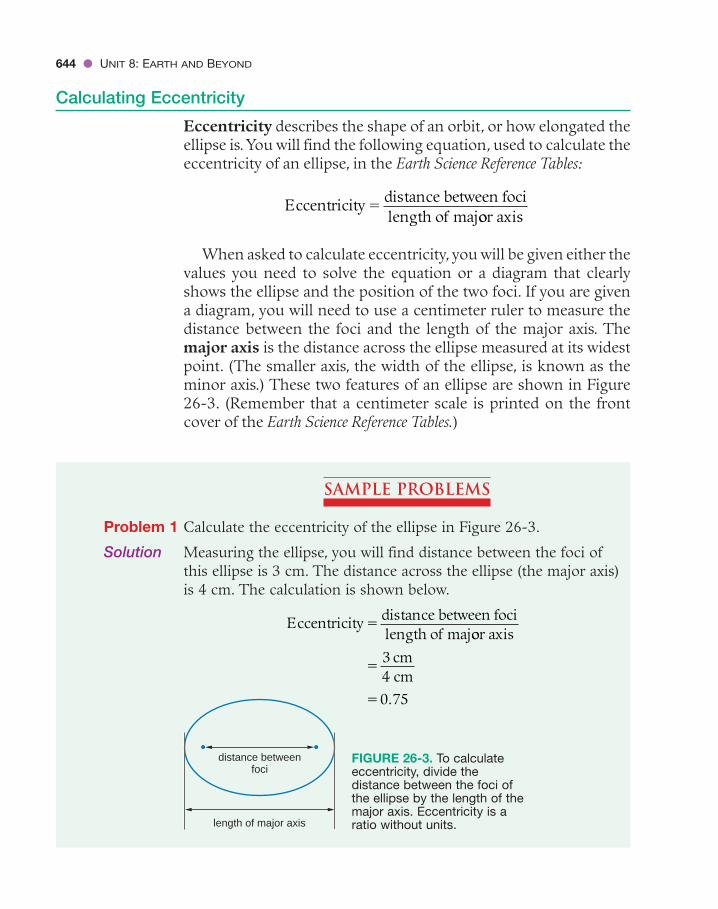
644 ● UNIT 8: EARTH AND BEYOND
Calculating Eccentricity
Eccentricity describes the shape of an orbit, or how elongated theellipse is. You will find the following equation, used to calculate theeccentricity of an ellipse, in the Earth Science Reference Tables:
When asked to calculate eccentricity, you will be given either thevalues you need to solve the equation or a diagram that clearlyshows the ellipse and the position of the two foci. If you are givena diagram, you will need to use a centimeter ruler to measure thedistance between the foci and the length of the major axis. Themajor axis is the distance across the ellipse measured at its widestpoint. (The smaller axis, the width of the ellipse, is known as theminor axis.) These two features of an ellipse are shown in Figure26-3. (Remember that a centimeter scale is printed on the frontcover of the Earth Science Reference Tables.)
Eccentricity distance between focilength of maj
�oor axis
SAMPLE PROBLEMS
Problem 1 Calculate the eccentricity of the ellipse in Figure 26-3.
Solution Measuring the ellipse, you will find distance between the foci ofthis ellipse is 3 cm. The distance across the ellipse (the major axis)is 4 cm. The calculation is shown below.
Eccentricity distance between focilength of maj
�oor axis
cm4 cm0.75
�
�
3
distance betweenfoci
length of major axis
FIGURE 26-3. To calculateeccentricity, divide thedistance between the foci ofthe ellipse by the length of themajor axis. Eccentricity is aratio without units.

CHAPTER 26: EARTH, ITS MOON, AND ORBITS ● 645
Notice that there are no units of eccentricity because in thecalculation the units cancel each other out. Eccentricity istherefore a ratio between two measured values.
Problem 2 The greatest distance across Earth’s orbit is 299,200,000 km. Thedistance from the sun to the location in space that is the otherfocus of Earth’s orbit is 5,086,400 km. Calculate the eccentricityof Earth’s orbit.
Solution
Notice that the result is a very small number. Earth’s orbit isnearly a perfect circle. That is why the changing distance betweenEarth and the sun is not a significant factor in seasonal changes in temperature on Earth.
Problem 3 The greatest distance across Mars’ orbit is 455,800,000 km. Theeccentricity of its orbit is 0.093. What is the approximate distancebetween the sun and the second focus of Mars’ orbit?
Solution The first step is to rearrange the formula to isolate the distancebetween the foci. Multiplying both sides of the equation by lengthof major axis does this.
The next step is to substitute the values and solve for the distancebetween the foci:
This value is expressed to a much greater accuracy than the length of the major axis of the ellipse. So it should be rounded off to 42 million km. (Also note that the problem asked for the“approximate distance.”)
Length of major axis eccentricity distance betw� � eeen foci
455,800,000 km 0.093 distance between× � ffoci42,389,400 km distance between foci�
Eccentricity distance between focilength of maj
�oor axis
Eccentricity distance between focilength of maj
�oor axis
km299,200,000 km
�
�
5 086 400
0 017
, ,
.

Ellipses show a range of shapes. If the foci are at the ends of theellipse, the ellipse will be a line segment with an eccentricity of 1.If the two foci are located near the ends of the ellipse, the ellipselooks flattened. A circle is the special case of ellipse in which thefoci are at a single point. The eccentricity of a circle is 0. Whenconsidering the eccentricity of an ellipse, it may help to rememberthat just as the number “1” can be written as a line, an ellipse withan eccentricity of one is a straight line. Furthermore, just as thenumber “0” can be written as a circle, an ellipse with an eccentric-ity of zero is a circle.
The orbits of Earth and the moon look like circles. Only bycarefully measuring the length and width of the orbits, or by lo-cating the two foci, can scientists observe that the orbits of themoon and Earth are not quite circles.
WHAT DETERMINES A SATELLITE’S ORBIT?
The path that Earth takes around the sun is determined by twofactors: inertia and gravity. Inertia is the tendency of an object atrest to remain at rest or an object in motion to move at a constantspeed in a straight line unless acted on by an unbalanced force. Ifyou roll a heavy ball across a flat, hard floor, the ball continues ina straight line until some force causes it to change its speed or itsdirection. That force could be friction with the floor causing theball to slow. It could be a force applied by an object or a wall as theball collides with it. Or, it could be someone pushing the ball to
4: 1.1a, 1.1b6: EQUILIBRIUM ANDSTABILITY 4
646 ● UNIT 8: EARTH AND BEYOND
Practice Problem 1Calculate the eccentricity of an ellipse in which the distancebetween the foci is 20 cm and the length of the major axis is60 cm.
Practice Problem 2The greatest distance across the moon’s orbit is 772,000 km; theeccentricity of its orbit is 0.055. How far apart are the foci of themoon’s orbit?
W

one side, causing the ball to change direction. Similarly, an objectmoving through space will move in a straight line unless someforce causes it change its speed or its direction.
Gravity
The moon, planets, and other satellites follow curved paths. Thistells you that a force must be acting on them. That force is grav-ity. Gravity is the force of attraction between all objects. If theobjects are relatively small, such as your body and familiar objectsaround you, the force between them is so small you cannot feelit. Although your body’s mass is small, the mass of Earth is verylarge. Your weight is the force of attraction between your bodyand Earth.
When the mass of one or both objects increases, the gravitationalforce between them also increases. Therefore, you would weighmore on a more massive planet. Correspondingly, you would weighless on Mars or the moon than you do on Earth because thesesmaller bodies have less mass than Earth.
Gravity also depends on the distance between the centers ofthe two objects. People who climb to the top of high mountainsexperience a very small but measurable decrease in their weight.This is because they are moving away from Earth’s center. Infact, the higher a person goes above sea level, the less the personweighs.
The strength of gravity between two objects (such as your bodyand Earth) does not decrease with just the distance between theircenters. The change actually follows the inverse square law. Sup-pose you were to rise from Earth’s surface a distance from the cen-ter of Earth equal to twice Earth’s 6000-km radius. Your weightwould not decrease by half, it would actually be only one-quarterof your weight on Earth’s surface (22 � 4). At three times Earth’sradius from the center of the planet, your weight would be justone-ninth of your weight at Earth’s surface (32 � 9).
The motion of Earth or any celestial object in its elliptical orbitcan be thought of as a combination of two kinds of motion. Thefirst is straight-line motion under the influence of inertia. The sec-ond is falling motion toward the primary of the satellite under theinfluence of gravity. The result is a curved path, as shown in Fig-ure 26-4, on page 648.
CHAPTER 26: EARTH, ITS MOON, AND ORBITS ● 647

Orbital Energy
The orbital energy that Earth has is a combination of kinetic andpotential energy. Potential energy is a result of the distance be-tween Earth and the sun. Kinetic energy is the speed of Earth in itsorbit. The combined energy remains constant unless it is reducedby friction. However, there is no friction in space. The balance be-tween the two components of orbital energy, speed and orbital dis-tance, does change. As a satellite moves farther from its primary, itsorbital speed decreases. As it moves closer, its speed increases.
Moving in an ellipse, Earth changes its distance from the sun bya small amount. Therefore, Earth’s speed in its orbit changes. Infact, for all planets orbiting the sun, orbital speed is a function ofthe distance between the satellite and the primary. Earth moves alittle faster when it is closer to the sun and slower when it is fartherfrom the sun. Earth is closest to the sun in early January, whichis when its orbital speed is greatest (although the change is rela-tively small). The moon also changes speed in its orbit as it movesslightly closer and farther from Earth. Visit the following Web siteto see how the apparent size of the moon changes from apogee toperigee: http://antwrp.gsfc.nasa.gov/apod/ap071025.html
WHY DOES THE MOON SHOW PHASES?
You have probably noticed that the moon seems to change itsshape in a monthly cycle. The apparent shape of the moon, whichis determined by the pattern of light and shadow, is called thephase of the moon. Figure 26-5 shows the range of moon phases.
4: 1.1a6: PATTERNS OFCHANGE 5
648 ● UNIT 8: EARTH AND BEYOND
Sun
Earth Straight-line motion (Inertia)
Orbital Motion(Inertia + Gravity)
FallingMotion
(Gravity)FIGURE 26-4. The curvedmotion of the moon in itsorbit is the result ofstraight-line motion causedby inertia, and its fallingpath toward Earth causedby gravity. Earth and thesun are not drawn to scale.

For example, when the whole side of the moon facing Earth islighted, we see the full moon. The gibbous phase occurs whenmost of the moon appears lighted. When half of the moon appearslighted, it is the quarter-moon phase. The crescent phase is a nar-row, curved sliver of light. When the whole part of the moon’s sur-face seen from Earth is in shadow, it is known as the new moon.The phase that you see depends on the relative position of themoon with respect to Earth and the sun.
Why is there a monthly cycle of moon phases? This cycle occursbecause it takes roughly a month for the moon to orbit Earth.However, the daily rotation of Earth makes the monthly orbiting ofthe moon more difficult to follow. What you actually observe isthe moon rising and setting nearly an hour later each day. Each dayfor half its cycle the moon moves about 13°away from the sun’sposition in the sky. For the other half of the cycle, the moon movestoward the sun’s position in the sky. For this reason, each day ornight you see progressively more or less of the moon’s lighted
CHAPTER 26: EARTH, ITS MOON, AND ORBITS ● 649
FIGURE 26-5.These 24 imagesshow the monthlychanges of lightand shadowcaused by themoon’s revolutionaround Earth arecalled the phasesof the moon. Thenew moon phase(bottom right) isdark and it isalways seen nearthe sun. So the newmoon may not befamiliar to you.

surface (the side of the moon facing the sun). The cycle of themoon’s phases takes about 29 days. To fit exactly 12 months intoa year, the average calendar month was made a little longer than thefull cycle of moon phases.
In a large, darkened room, a friend can help you demonstratethese motions. Due to the dangers posed by a bare light bulb, thisshould be done under adult supervision. Use a bare light bulb ata distance from you of at least 2–4 m (7–13 ft) to represent the sun.Your head represents Earth; your eyes represent the position ofthe observer. A ball can represent the moon. The ball should bemuch closer to you than the light bulb (the sun). In the simplestrepresentation, stand in one place (although you can turn yourhead) and observe the lighted part of the ball as your friend movesthe ball around (orbits) you. You may want to name each phase asyou see it. The phases are labeled in Figure 26-6.
Earth, Moon, and Sun
Figure 26-6 includes two ways of looking at the moon in a singlediagram. The central part of this diagram shows the moon orbitingEarth as viewed from a point in space above the North Pole. Noticethe arrows showing the orbital motion of the moon as it revolvesaround Earth.The straight arrows on the left represent rays of lightfrom the sun, which is well outside the diagram to the left.
12
650 ● UNIT 8: EARTH AND BEYOND
FIGURE 26-6. The centerof this diagram shows themoon’s orbit around Earthas viewed from a positionhigh above the North Pole.The eight outer circlesshow how a personstanding on Earth’s surfacewould see each phase. Thisdrawing is not to scale.

The eight outer circles show how the moon appears at each po-sition as viewed from Earth. Notice that the first quarter phase atthe bottom of the diagram is lit on the left as viewed from abovethe orbit (inner circle), but lit on the right as viewed from Earth atnight. To understand why the bottom diagram is reversed, turnyour book around and look across Earth to the first-quarter phase.Then the figure of the moon in its orbit will be lit on the right. Re-member that the portion of the moon that is lighted, as well as theside that is lit, depend on the position of the observer. Visit the fol-lowing Web site to watch a simple YouTube animation that showsthe moon revolving around Earth and, at the top right, what themoon looks like from Earth: http://www.youtube.com/watch?v�o1Ubjmnm06g
Earth and Moon
The moon takes about 27 days to complete one orbit aroundEarth. However, the cycle of moon phases takes about 29 days.The reason it takes longer than one revolution of the moon toobserve a full cycle of phases is shown in Figure 26-7. ConsiderEarth and the moon to start at position A. They will be at posi-tion B 27 days later. The moon has moved through one complete
13
12
13
CHAPTER 26: EARTH, ITS MOON, AND ORBITS ● 651
Earth's orbit around the sun
A
B
27 1/3 days
to the sun
to the sun
FIGURE 26-7. Consider Earth and the moon at position A, and 27 days laterat position B. The moon has made one complete revolution of 360° from A toB, but the apparent position of the sun among the stars has changed.Therefore, the moon must travel another 2 days to get back to the new moonphase. (This is a view from above the North Pole.)
13

revolution of 360°. However, to get back to the new moon phase,it must move a little further in its orbit. The reason the cycle ofphases takes longer than one revolution of the moon is that Earthis moving in its orbit around the sun.
WHAT IS AN ECLIPSE?
The moon and Earth are not transparent. They cast shadows.Sometimes, the moon’s shadow falls on Earth. This may affect theway we see the sun. At other times, Earth’s shadow falls on themoon. This may affect the way we see the moon.
Solar Eclipses
As the moon orbits Earth, it sometimes comes between the sunand Earth, casting a shadow on Earth. When one celestial objectblocks the light of another, an eclipse occurs. If the shadow is caston Earth’s surface, sunlight is blocked. To a person on Earth, themoon is observed to move in front of the sun and then move away,as in Figure 26-8. This is called an eclipse of the sun, or solareclipse. If part of the sun is visible throughout the eclipse, it iscalled a partial eclipse.
A total solar eclipse occurs when the sun is completely blockedfrom view by the moon and the moon’s full shadow passes overEarth. This is shown in Figure 26-9. In a total solar eclipse, the skybecomes much darker than usual and some stars may be visiblebriefly. A solar eclipse happens only in the new moon phase whenthe dark half of the moon faces Earth. (CAUTION: Never lookdirectly at the sun.) Visit the following Web site to watch a flash
4: 1.1a, 1.1f6: PATTERNS OFCHANGE 5
652 ● UNIT 8: EARTH AND BEYOND
FIGURE 26-8. This series of images represents a total solar eclipse. The timefrom the beginning of the event to totality and then back to full sunlight can lastnearly 2 h. Only the thin atmosphere of the sun is visible in the central image. Thenext total solar eclipse visible in the continental United States will be in 2017.

movie of the March 2006 solar eclipse shadow crossing Earth’ssurface: http://www.stormcenter.com/media/060331/
Lunar Eclipse
There are also eclipses of the moon, lunar eclipses. Figure 26-9shows the relative position of the moon, Earth, and sun for bothsolar and lunar eclipses. An eclipse of the moon occurs when themoon orbits to a position exactly opposite the sun. Viewed fromEarth, the moon moves into Earth’s curved shadow. The moonbecomes relatively dark and takes on a coppery-red color from asmall amount of light that is refracted through Earth’s atmo-sphere. The eclipse may continue for an hour or more until themoon moves out of Earth’s shadow. A lunar eclipse can occur onlyat the full moon phase because the moon must be on the side ofEarth opposite the sun. Visit the following Web site or a similarYouTube film clip to watch the video of a lunar eclipse: http://www.youtube.com/watch?v�IVkkCVh5t0E
Predicting Eclipses
By making precise observations of the moon and sun over hun-dreds of years, astronomers are able to predict eclipses with great
CHAPTER 26: EARTH, ITS MOON, AND ORBITS ● 653
SUNEARTH
Moon's Orbit
Moon positionfor a lunar eclipse
Moon positionfor a solar eclipse
Full Shadow
Partial Shadow
FIGURE 26-9. A solar eclipse occurs when the moon casts a shadow onEarth’s surface. A lunar eclipse happens when the moon passes throughEarth’s shadow. If this drawing were to scale, the sun would be very, verysmall, while Earth and moon would not be visible at all.

accuracy. Lunar and solar eclipses occur about once or twice ayear. Lunar eclipses are easier to see because they are visible toeveryone on the night side of Earth. In addition, they may lastmore than an hour.
Solar eclipses, however, are usually visible only along a narrowpath across Earth’s surface. During a total eclipse of the sun, to-tality usually lasts only a few minutes. If the moon orbits Eartheach month, why do you not see eclipses of the sun and moonevery month? The reason is that the moon’s orbit is tilted atan angle of about 5° from the plane of Earth’s orbit around thesun. This is shown in Figure 26-10. Eclipses occur only when themoon is in the part of its path where the two orbits meet. Visit thefollowing Web site to watch an animation of the inclination of themoon’s orbit: http://www.csulb.edu/�htahsiri/animate/Moon%20tilt%20orbit.html
STUDENT ACTIVITY 26-2 —THE NEXT LUNAR ECLIPSES
Use the Internet to find when the next partial and total lunareclipses will occur. The time is often given in terms of Green-
wich Mean Time. Convert the time of the next lunar eclipse intoyour local time. Where will the next solar eclipse be visible? Whenwill the next solar eclipse be visible in your area?
Apparent Size of the Sun and Moon
It is a coincidence that as viewed from Earth the moon and sunare each about ° in angular diameter. That is, two lines drawnfrom your eye to each side of the sun or moon are about ° of
12
12
6: PATTERNS OFCHANGE 5
654 ● UNIT 8: EARTH AND BEYOND
Plane ofMoon's orbit
Plane of Earth's orbit
FIGURE 26-10. The moon’sorbit is inclined about 5°from the plane of Earth’sorbit. Therefore, the newmoon and the full moon are usually above or belowthe plane of the sun. This explains why eclipsesare rare.
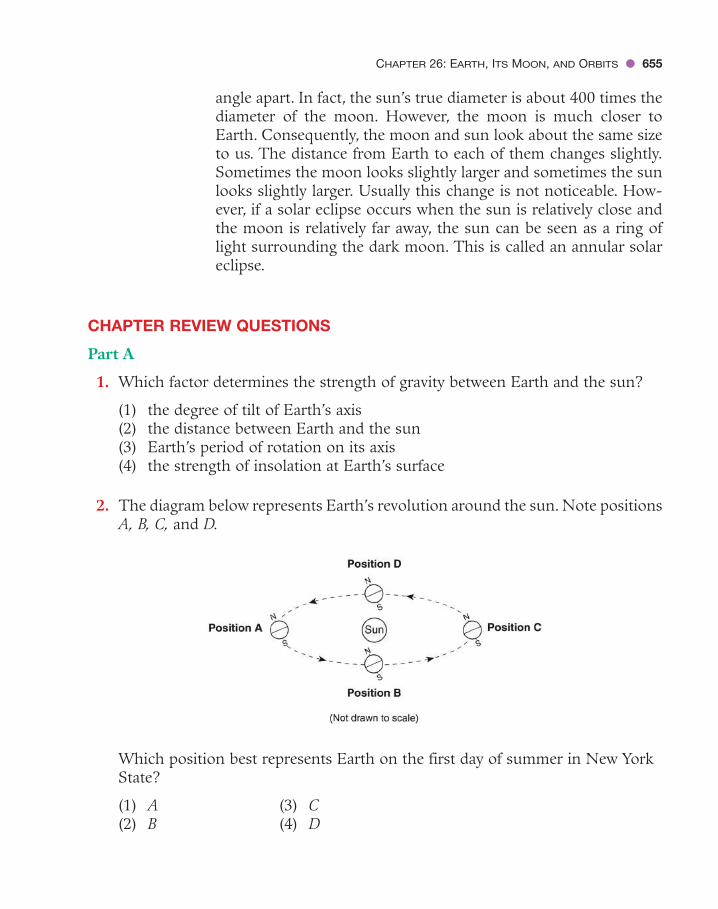
angle apart. In fact, the sun’s true diameter is about 400 times thediameter of the moon. However, the moon is much closer toEarth. Consequently, the moon and sun look about the same sizeto us. The distance from Earth to each of them changes slightly.Sometimes the moon looks slightly larger and sometimes the sunlooks slightly larger. Usually this change is not noticeable. How-ever, if a solar eclipse occurs when the sun is relatively close andthe moon is relatively far away, the sun can be seen as a ring oflight surrounding the dark moon. This is called an annular solareclipse.
CHAPTER REVIEW QUESTIONS
Part A
1. Which factor determines the strength of gravity between Earth and the sun?
(1) the degree of tilt of Earth’s axis(2) the distance between Earth and the sun(3) Earth’s period of rotation on its axis(4) the strength of insolation at Earth’s surface
2. The diagram below represents Earth’s revolution around the sun. Note positionsA, B, C, and D.
Which position best represents Earth on the first day of summer in New YorkState?
(1) A (3) C(2) B (4) D
CHAPTER 26: EARTH, ITS MOON, AND ORBITS ● 655
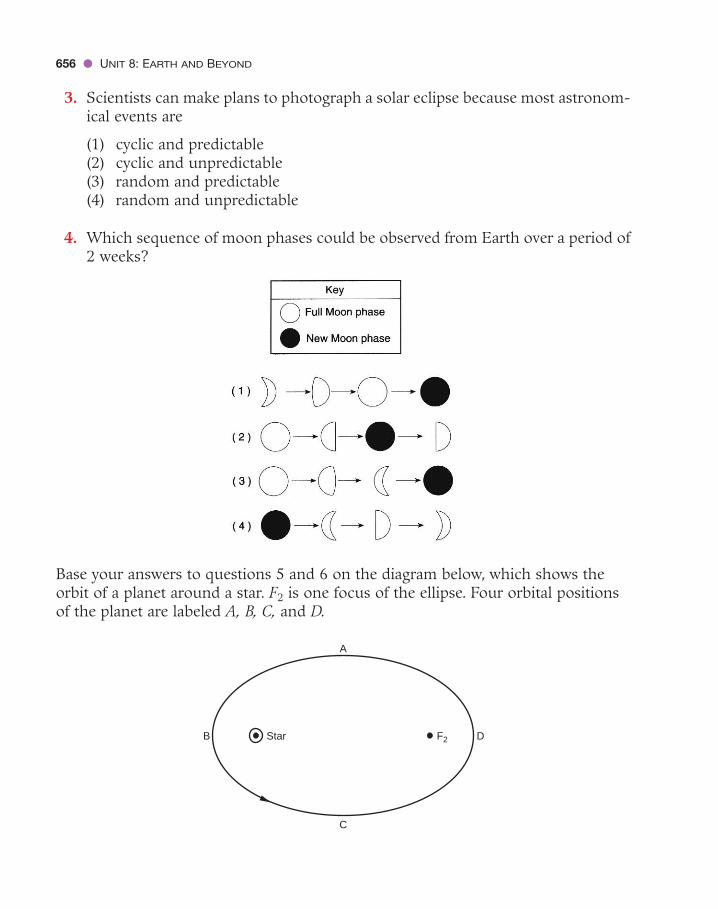
3. Scientists can make plans to photograph a solar eclipse because most astronom-ical events are
(1) cyclic and predictable(2) cyclic and unpredictable(3) random and predictable(4) random and unpredictable
4. Which sequence of moon phases could be observed from Earth over a period of2 weeks?
Base your answers to questions 5 and 6 on the diagram below, which shows theorbit of a planet around a star. F2 is one focus of the ellipse. Four orbital positionsof the planet are labeled A, B, C, and D.
Star F2
A
C
DB
656 ● UNIT 8: EARTH AND BEYOND

5. What is the approximate eccentricity of this ellipse?
(1) 0.22 (3) 0.68(2) 0.47 (4) 1.47
6. In the diagram above, at which position of the planet is the gravitational attrac-tion between the planet and the sun the greatest?
(1) A (3) C(2) B (4) D
Base your answers to questions 7 and 8 on the diagram below, which showsEarth’s orbit around the sun and the moon’s orbit around Earth. Four Earthpositions are labeled A, B, C, and D.
7. An eclipse of the moon is most likely to occur at position
(1) A (3) C(2) B (4) D
8. As observed from Earth, what phase of the moon occurs at position D on the di-agram above?
(1) new moon (dark) (3) full moon(2) first quarter (4) last quarter
9. Astronauts have observed the igneous rock basalt that covers large areas of themoon. What does this tell us about the history of the moon?
(1) Earth and the moon are the same age.(2) Weathering and erosion are active on the moon.(3) Parts of the moon were once hot and molten.(4) Gravity on the surface of the moon is greater than on Earth’s surface.
CHAPTER 26: EARTH, ITS MOON, AND ORBITS ● 657

Part B
Base your answers to questions 10 through 12 on the diagram below. The arrowson the diagram indicate the motions of Earth, the sun, and the moon. The keylabels each motion, A, B, C, and D.
Key
Arrow Motion
A Earth’s rotation on its axis
B Earth’s revolution around the sun
C The moon’s rotation on its axis
D The moon’s revolution around Earth
10. What is the time required for one complete circle of motion A?
(1) 1 day (3) 1 month(2) 1 week (4) 1 year
11. Which two motions complete a full cycle in the same amount of time?
(1) A and B(2) B and C(3) C and D(4) D and A
658 ● UNIT 8: EARTH AND BEYOND

12. Which motion is responsible for the cycle of moon phases?
(1) A(2) B(3) C(4) D
Part C
Base your answers to questions 13 through 16 on the diagram below, which showsEarth and the moon in its orbit from a position above the North Pole. Each of theeight positions labels the phase of the moon at that position. Light and shadow areindicated on Earth, but not on the moon.
13. Draw a circle approximately 2 cm in diameter. Use shading to show how themoon looks in the “last-quarter” position as viewed from New York State. Note:The shading should be used to show the unlit portion of the moon.
14. Explain what causes the moon phases as viewed from Earth.
15. Which moon phase occurs approximately one week after the new moon?
16. Explain why the same side of the moon always faces Earth.
CHAPTER 26: EARTH, ITS MOON, AND ORBITS ● 659
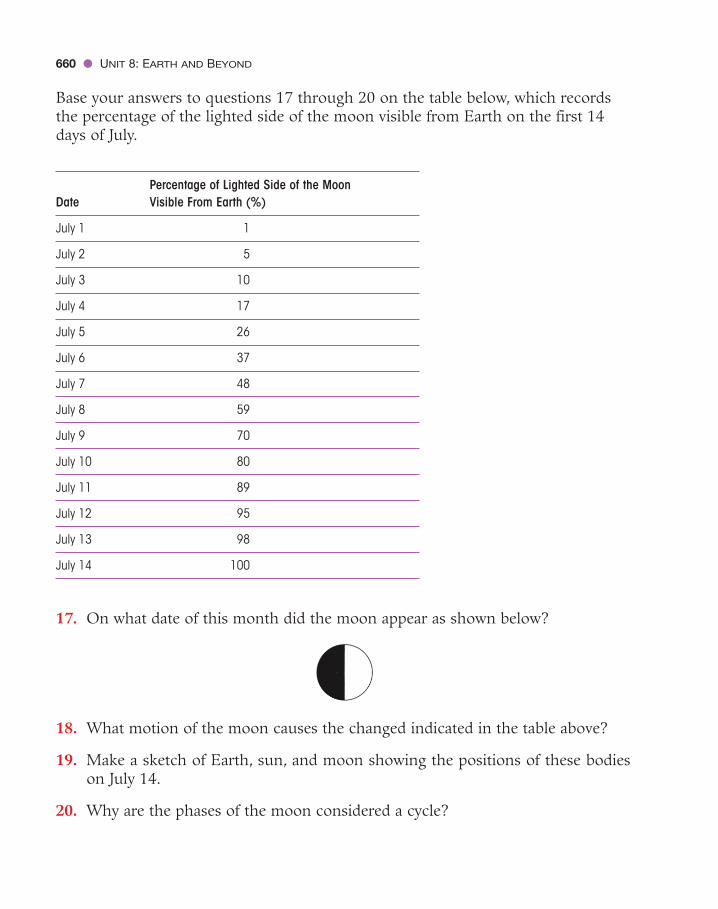
Base your answers to questions 17 through 20 on the table below, which recordsthe percentage of the lighted side of the moon visible from Earth on the first 14days of July.
Percentage of Lighted Side of the Moon Date Visible From Earth (%)
July 1 1
July 2 5
July 3 10
July 4 17
July 5 26
July 6 37
July 7 48
July 8 59
July 9 70
July 10 80
July 11 89
July 12 95
July 13 98
July 14 100
17. On what date of this month did the moon appear as shown below?
18. What motion of the moon causes the changed indicated in the table above?
19. Make a sketch of Earth, sun, and moon showing the positions of these bodieson July 14.
20. Why are the phases of the moon considered a cycle?
660 ● UNIT 8: EARTH AND BEYOND
• 661 •
The Solar System
C H A P T E R
27WORDS TO KNOW
asteroid meteor meteoroid
comet meteorite terrestrial planet
Jovian planet
This chapter will help you answer the following questions:1 Why is Earth so important to us?2 How did the solar system form?3 What do the planets have in common and how is each unique?4 What other objects orbit the sun?
COLONIZING SPACE
The idea of sending people to live away from Earth is a familiarsubject in science fiction. Astronauts have spent extended time inorbit around Earth and have spent several days on the moon. Wemay wish to take advantage of resources, such as precious metals,found on the moon or on other planets.
Living Away from Earth
People living in nonterrestrial, or non-Earthlike, environmentsneed an enormous amount of materials for life support. In a space
6: OPTIMIZATION 67: CONNECTIONS 17: STRATEGIES 2

environment near a star, there would be a steady supply of elec-tromagnetic energy. However, things we take for granted, such asoxygen and liquid water, are not available in space. In addition,they are rare on other planets in our solar system. The cost oftransporting these necessities would be huge. Recycling these ma-terials seems more practical.
Beyond the Solar System
In the past few years, astronomers have discovered hundreds ofplanets in orbit around other stars. If other planets like Earth exist,it seems logical that life and civilizations might have developed onsome of them. However, attempts to detect radio signals fromother civilizations in space have failed. Therefore, there is no di-rect evidence that humans could exist anywhere outside Earthwithout complex artificial support systems.
These discoveries have helped us appreciate how unique andhow fragile our environment on Earth is. In spite of fears that aglobal disaster could make Earth uninhabitable, we have nowhereelse to go. Clearly, the best alternative is to preserve our current ter-restrial environment in a way that allows all living things to prosper.
WHAT IS THE ORIGIN OF THE SOLAR SYSTEM?
Evidence from space tells us that originally the universe probablywas nearly all hydrogen and helium. The early universe most likelyhad a large number of very massive stars that used up their hydro-gen fuel relatively quickly. These stars became unstable and ex-ploded, creating clouds of debris full of heavy elements. In oursolar system, there is a large quantity of heavy elements, such ascarbon, iron, silicon, and oxygen. This indicates that our solar sys-tem formed from the remains of a stellar explosion known as a su-pernova. Visit the following Web site to see the relative sizes ofEarth, the other planets, the sun, and our galaxy: http://newsizeofourworld.ytmnd.com
Nebular Contraction
The cloud of debris left over from the supernova explosion mayhave come together under the influence of its own gravity. This
4: 1.2a, 1.2b, 1.2c
662 ● UNIT 8: EARTH AND BEYOND

theory is sometimes called the nebular contraction theory. It sug-gests that the solar system began as a cloud of dust and gas inspace. This cloud is commonly called a nebula. More than 99 per-cent of the mass condensed to form the sun, which is at the cen-ter of our solar system. Debris that remained formed the planets,dwarf planets, moons, and other objects orbiting the sun.
Just as an ice-skater spins faster when she brings in her arms,the collapse of this material produced the revolution of the plan-ets in their orbits. It also caused the rotational motion of the sunand planets. All the planets revolve in the same direction that thesun rotates. Most of their moons also revolve in this direction. Thespacing of the planets is remarkably ordered. Most planets areabout twice as far from the sun as is their neighbor closer to thesun. In addition, the planets lie in nearly the same plane, orbitingthe sun in a thin disk. This degree of order suggests that a singleevent formed the solar system.
Scientists have studied radioactive elements within materialthat has fallen to Earth and rocks recovered from the older partsof the moon. They estimate that these bodies are about 4.6 billionyears old. Rocks from Earth are not as helpful because they havebeen recycled through the rock cycle and plate tectonics. There-fore, the oldest known terrestrial rocks are less than 4.6 billionyears old. The patterns of change in stars indicate that the sun isabout 5 billion years old. It therefore seems likely that the sun andthe solar system formed in a single event that took place a littleless than 5 billion years ago. This is only about one-third of theestimated age of the universe.
WHAT PROPERTIES DO THE PLANETS SHARE?
The definition of a planet has evolved. Early observers of the nightskies thought of the planets as special stars that wander among theother stars. Later, astronomers using telescopes were able to seedifferences between planets and stars. They began to think ofplanets as large objects that orbit the sun, reflecting the sun’s light.
Like all satellites, the planets orbit the sun in ellipses with theprimary, the sun, located at one focus. Their orbits have low eccen-tricities.The change in gravitational force between a planet and thesun causes the orbital velocity of the planet to change in a yearly
4: 1.1a, 1.1b,4: 1.2c
CHAPTER 27: THE SOLAR SYSTEM ● 663

cycle.All the planets move a little faster when they are closest to thesun because that is when the gravitational attraction of the sun isgreatest. Visit the following Web site to use the Solar SystemViewer, which shows motions of the planets with stop action andspeed controls: http://janus.astro.umd.edu/javadir/orbits/ssv.html
Each planet in the solar system moves along its orbit at its ownspeed.As distance from the sun increases, the pull of the sun’s grav-ity decreases. Therefore, orbital velocity is indirectly related to aplanet’s distance from the sun.That is, the farther the planet is fromthe sun, the slower it travels in its orbit.The innermost planet, Mer-cury, moves nearly 10 times as fast along its orbit as the outermostplanet, Neptune. Mercury, because it is closer to the sun, also has ashorter orbit than any other planet. Therefore, Mercury revolvesaround the sun in only 88 Earth-days. Earth takes 1 year. Neptunetakes nearly 165 Earth-years to revolve around the sun. The differ-ence in orbital period is so large because of the combined effects ofthe longer orbits and the slower speeds of the outer planets.
All planets rotate on their axis. However, unlike the orbital prop-erties of the planets, their rotation does not follow a regular pat-tern. Neither their size nor their distance from the sun is relateddirectly to their period of rotation. The largest planet, Jupiter, takesonly about 10 Earth-hours to rotate 360°. Therefore, the length ofa day on Jupiter is 10 Earth-hours. Venus has the longest period ofrotation, about 8 Earth-months. Furthermore, two of the planets(Venus and Uranus) do not rotate in the same direction as theother planets. Perhaps the rotation of these planets was affected bycollisions with other objects after the solar system formed nearly 5billion years ago.
The number of moons orbiting the planets shows a generalpattern with distance from the sun. The two innermost planets,Mercury and Venus, have no moons. Earth has one moon. Thenthe number of moons generally increases as we move to the outerplanets. However, the number of moons changes as more are dis-covered. It is difficult to distinguish between moons and other ob-jects that orbit the outer planets. The question of how small anobject can be and still be called a moon has no clear answer. Forexample, the rings of Saturn and less visible rings of other gas gi-ants are made of millions of objects that orbit the planet in thesame plane, but these objects are considered too small to be calledmoons. At this time, there is no known limit to the number of
664 ● UNIT 8: EARTH AND BEYOND
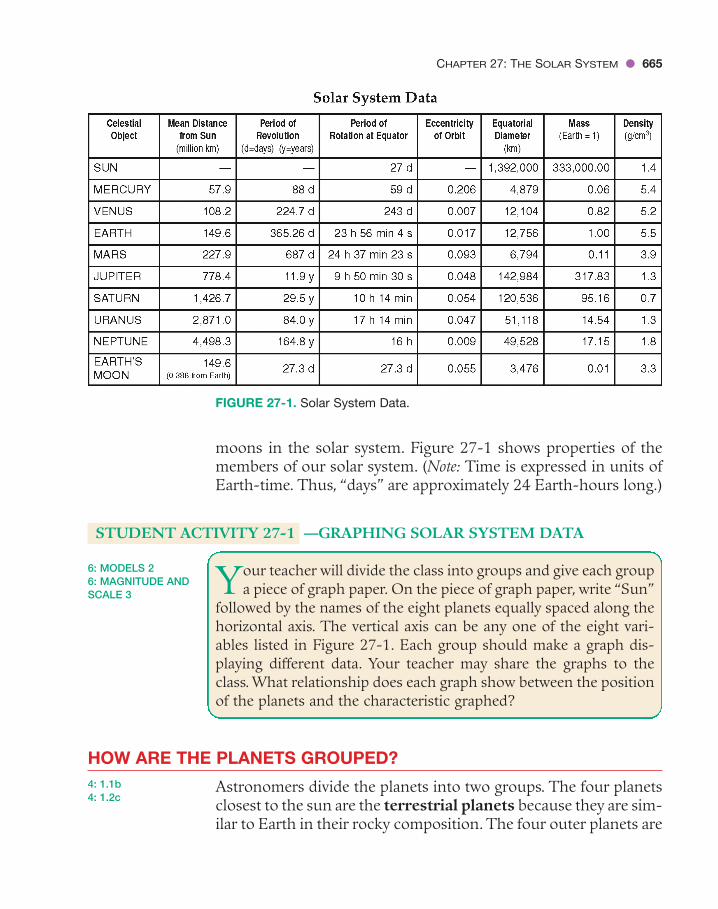
moons in the solar system. Figure 27-1 shows properties of themembers of our solar system. (Note: Time is expressed in units ofEarth-time. Thus, “days” are approximately 24 Earth-hours long.)
STUDENT ACTIVITY 27-1 —GRAPHING SOLAR SYSTEM DATA
Your teacher will divide the class into groups and give each groupa piece of graph paper. On the piece of graph paper, write “Sun”
followed by the names of the eight planets equally spaced along thehorizontal axis. The vertical axis can be any one of the eight vari-ables listed in Figure 27-1. Each group should make a graph dis-playing different data. Your teacher may share the graphs to theclass. What relationship does each graph show between the positionof the planets and the characteristic graphed?
HOW ARE THE PLANETS GROUPED?
Astronomers divide the planets into two groups. The four planetsclosest to the sun are the terrestrial planets because they are sim-ilar to Earth in their rocky composition. The four outer planets are
4: 1.1b4: 1.2c
6: MODELS 26: MAGNITUDE ANDSCALE 3
CHAPTER 27: THE SOLAR SYSTEM ● 665
FIGURE 27-1. Solar System Data.
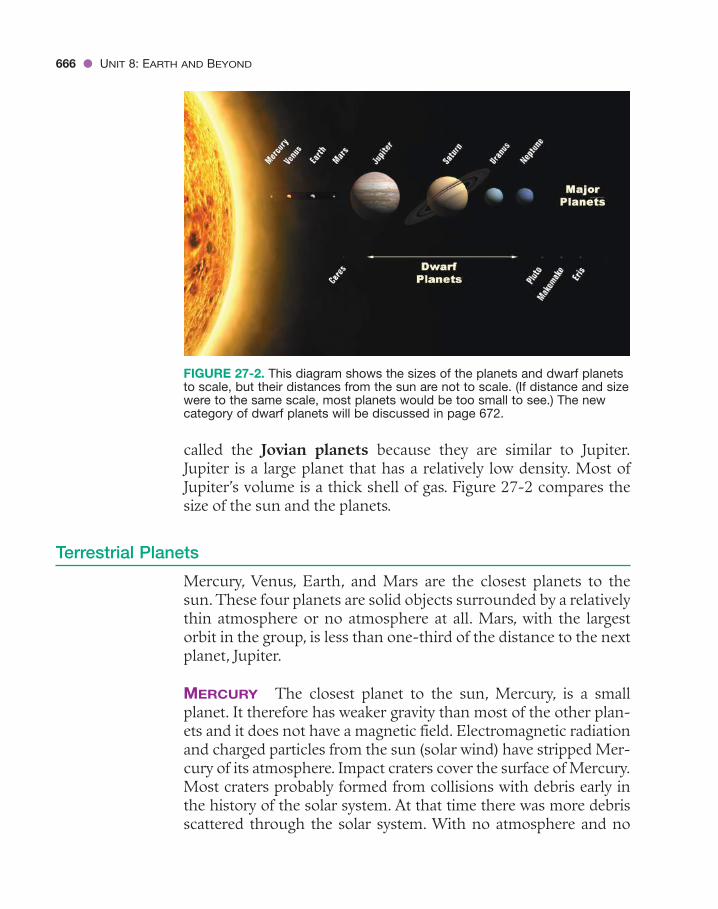
called the Jovian planets because they are similar to Jupiter.Jupiter is a large planet that has a relatively low density. Most ofJupiter’s volume is a thick shell of gas. Figure 27-2 compares thesize of the sun and the planets.
Terrestrial Planets
Mercury, Venus, Earth, and Mars are the closest planets to thesun. These four planets are solid objects surrounded by a relativelythin atmosphere or no atmosphere at all. Mars, with the largestorbit in the group, is less than one-third of the distance to the nextplanet, Jupiter.
MERCURY The closest planet to the sun, Mercury, is a smallplanet. It therefore has weaker gravity than most of the other plan-ets and it does not have a magnetic field. Electromagnetic radiationand charged particles from the sun (solar wind) have stripped Mer-cury of its atmosphere. Impact craters cover the surface of Mercury.Most craters probably formed from collisions with debris early inthe history of the solar system. At that time there was more debrisscattered through the solar system. With no atmosphere and no
666 ● UNIT 8: EARTH AND BEYOND
FIGURE 27-2. This diagram shows the sizes of the planets and dwarf planetsto scale, but their distances from the sun are not to scale. (If distance and sizewere to the same scale, most planets would be too small to see.) The newcategory of dwarf planets will be discussed in page 672.

weather, these features are still evident after billions of years. Theslow rotation of Mercury and the lack of an atmosphere cause anextreme range in temperature on the surface. Temperatures rangefrom 400°C during the day to �200°C at night. Because it is rela-tively close to the sun, Mercury is visible from Earth only nearsunset or sunrise. Visit the following Web site to see the currentposition of the planets in our solar system by selecting your timeand your location: http://www.fourmilab.ch/cgi-bin/Solar
VENUS Like Mercury, Venus is closer to the sun than is Earth;therefore, Venus is visible from Earth only near sunset or sunrise.Venus is sometimes called Earth’s twin because its diameter andmass are similar to Earth’s. Venus therefore has about the samegravity as Earth. For many years, astronomers wondered if Venusmight have surface conditions similar to those on Earth. Thickclouds prevented direct observations of the solid surface. Radarimages and mapping by artificial satellites revealed that Venus hasvolcanic features like Earth.
The surface conditions on Venus are very different from Earth’s.Atmospheric pressure at the surface is 90 times the sea-level pres-sure on Earth. The thick atmosphere of Venus is mostly carbondioxide, which traps solar energy (the greenhouse effect). There-fore, the surface temperature of Venus (about 500°C) is actuallyhotter than the daytime temperature on Mercury. In addition,the clouds of Venus are composed of droplets of highly corrosivesulfuric acid.This would be deadly to the kind of creatures that liveon Earth.
Venus takes longer to rotate than any other planet. In fact,Venus takes longer to rotate on its axis than it takes to revolvearound the sun. (See Figure 27-1 on page 665.) So much for our“twin planet.”
PHASES OF MERCURY AND VENUS As viewed from Earth, theportion of the lighted surface of Mercury and Venus changes in apredictable cycle. Like the moon, these two planets show a fullrange of phases. Galileo was the first astronomer to document thephases of Venus as he observed them with his telescopes.
When Mercury and Venus pass between Earth and the sun,they, like the new moon, appear dark as viewed from Earth. This isillustrated in Figure 27-3, on page 668.Then, the lighted portion of
CHAPTER 27: THE SOLAR SYSTEM ● 667

each planet increases until it is fully lighted as the planets pass be-hind the sun. This change in phase is accompanied by a change inapparent size. Mercury and Venus appear largest at their closestapproach to Earth in the crescent phase.As they move farther fromEarth and the lighted portion increases, these planets appearsmaller in angular diameter. The orbits of the other planets areoutside Earth’s orbit. The night side of Earth faces the lighted sideof these planets. Therefore, they never show the dark, or new,phase. They always appear mostly lighted as observed from Earth.
EARTH Oceans cover about 70 percent of Earth’s surface. Theyaverage about 4 km (2.5 mi) in depth. In fact, Earth is the onlyplanet scientists know to have large amounts of water in all threestates: ice, liquid water, and water vapor. Surface temperatures aremoderate from a record low of �89°C (�128°F) in Antarctica to58°C (136°F) in Africa’s Sahara Desert.
Earth’s unique surface conditions have supported the evolutionof many forms of life. In addition, living things changed the planet.
668 ● UNIT 8: EARTH AND BEYOND
FIGURE 27-3. The thick clouds that cover Venus make it appear featureless invisible light. Depending upon the positions of the sun, Earth, and Venus, theapparent size and lighted part of Venus (the phase) change.

Earth’s original atmosphere probably was mostly carbon dioxidelike that of Venus. The carbon dioxide content of the atmosphereis now less than 1 percent (0.03 percent). Most of the original car-bon of the atmosphere has dissolved in the ocean or become partof plants, animals, or rocks. Weathering and erosion along withplate tectonics constantly change Earth’s surface.
MARS Ancient astronomers named Mars after the Roman godof war because of its red color. Of the eight planets in our solarsystem, the conditions on Mars come closest to the favorable con-ditions for life found on Earth. Like Venus, the atmosphere ofMars is mostly carbon dioxide. However, the atmosphere of Marsis much thinner than that of Venus or Earth. Mars can warm upto a comfortable 20°C (68°F) near the Martian equator. However,at night, about 12 h later, it cools to �60°C (�76°F) because thethin atmosphere does not absorb and radiate heat. Due to the tiltof the rotational axis of Mars, it has seasons like Earth. However,the polar regions become so cold that solid carbon dioxide (dryice) forms on the surface. Landing modules sent to Mars havetransmitted photographs and other data from its red surface.
Some Martian surface features look as if they were formed bylarge rivers. However, there is no liquid water on the surface ofMars today. This has led some astronomers to theorize that mostof the atmosphere of Mars has been lost and that the climate onMars was warmer in the past. If the water is still there, it is prob-ably in the form of ice under the planet’s surface. All forms of lifeon Earth need water. So scientists theorize that primitive life formsmay exist below the Martian surface.
STUDENT ACTIVITY 27-2 —DESIGN A LANDING MODULE
NASA has hired your group to design an instrument module thatwill send back information about Mars after it reaches the
planet. Your module may include only easily obtainable instrumentsthat you can understand and operate. Make a drawing of the moduleand write an explanation of what each instrument is as well as whatinformation it will gather. Radio communication will be your onlylink. NASA is not sending people or animals to Mars on this mission.
1: ENGINEERINGDESIGN 1
CHAPTER 27: THE SOLAR SYSTEM ● 669

The Outer Planets
The outer planets are Jupiter, Saturn, Uranus, and Neptune. TheseJovian planets are larger and less dense than the terrestrial plan-ets. They are composed mostly of hydrogen and helium ratherthan the heavier elements (iron, silicon, and oxygen) of the ter-restrial planets. The Jovian planets have small, rocky cores sur-rounded by a liquid mantle and a thick gaseous shell. However,they are still the most massive planets because of their huge size.Each Jovian planet also has a system of rings around it. Theserings are made of small particles that orbit independently in theplane of the planet’s equator.
JUPITER The first of the outer planets, Jupiter is the largestplanet in the solar system. Jupiter alone makes up two-thirds ofthe total mass of the eight planets. Jupiter is more than 99 percenthydrogen and helium. This is more like the composition of a starthan the composition of the terrestrial planets. The pressure at thecenter of Jupiter is about 10 times the pressure within Earth.However, it is still not enough pressure to support nuclear fusion,which powers the sun and other stars.
Jupiter’s rapid rotation causes a noticeable bulge at its equator.One of Jupiter’s other noticeable features is the Great Red Spot.Some astronomers think that this may be a permanent, ragingstorm. Others think it is an area of calm within the turbulent at-mosphere. With binoculars or a small telescope, you can see fourof Jupiter’s many moons from Earth. They sometimes look like aline of stars that runs through the equator of Jupiter. These foursatellites are known as the Galilean moons, named after their dis-coverer, Galileo.
SATURN The rings of Saturn make it one of the most unusualobjects in the night sky. Saturn’s rings are made of ice particles anddust. They might have become a moon if this debris were not soclose to Saturn and broken by Saturn’s gravitational field. Theserings are sometimes visible through binoculars from Earth, as inFigure 27-4. Rings of the other Jovian planets are less dense andtherefore more difficult to see. Second in size only to Jupiter, Sat-urn is also composed primarily of hydrogen and helium. It is theleast dense planet with an average density less than that of water.
670 ● UNIT 8: EARTH AND BEYOND
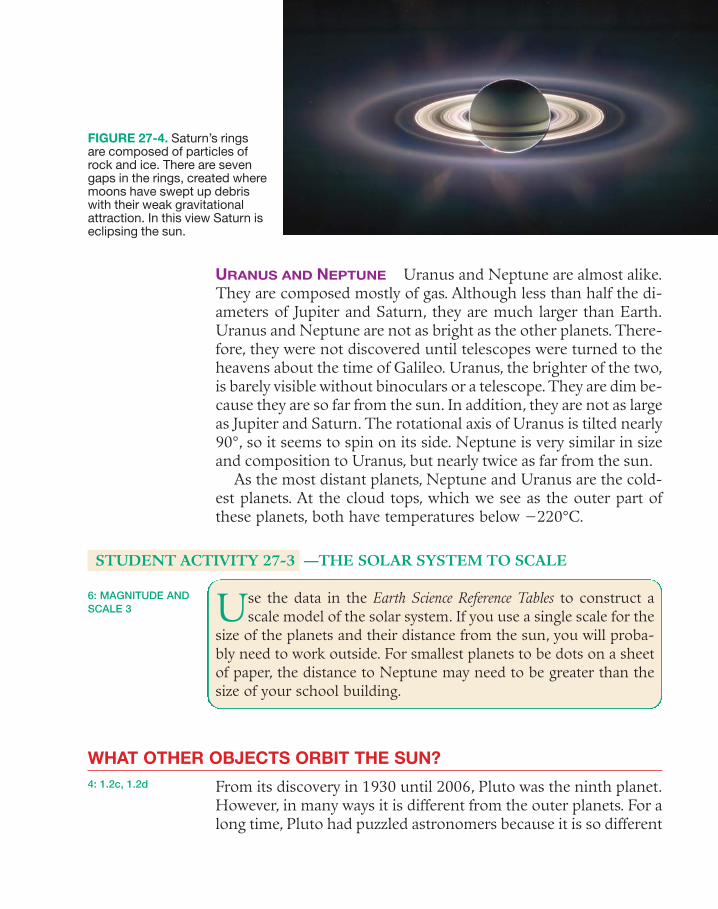
URANUS AND NEPTUNE Uranus and Neptune are almost alike.They are composed mostly of gas. Although less than half the di-ameters of Jupiter and Saturn, they are much larger than Earth.Uranus and Neptune are not as bright as the other planets. There-fore, they were not discovered until telescopes were turned to theheavens about the time of Galileo. Uranus, the brighter of the two,is barely visible without binoculars or a telescope.They are dim be-cause they are so far from the sun. In addition, they are not as largeas Jupiter and Saturn. The rotational axis of Uranus is tilted nearly90°, so it seems to spin on its side. Neptune is very similar in sizeand composition to Uranus, but nearly twice as far from the sun.
As the most distant planets, Neptune and Uranus are the cold-est planets. At the cloud tops, which we see as the outer part ofthese planets, both have temperatures below �220°C.
STUDENT ACTIVITY 27-3 —THE SOLAR SYSTEM TO SCALE
Use the data in the Earth Science Reference Tables to construct ascale model of the solar system. If you use a single scale for the
size of the planets and their distance from the sun, you will proba-bly need to work outside. For smallest planets to be dots on a sheetof paper, the distance to Neptune may need to be greater than thesize of your school building.
WHAT OTHER OBJECTS ORBIT THE SUN?
From its discovery in 1930 until 2006, Pluto was the ninth planet.However, in many ways it is different from the outer planets. For along time, Pluto had puzzled astronomers because it is so different
4: 1.2c, 1.2d
6: MAGNITUDE ANDSCALE 3
CHAPTER 27: THE SOLAR SYSTEM ● 671
FIGURE 27-4. Saturn’s ringsare composed of particles ofrock and ice. There are sevengaps in the rings, created wheremoons have swept up debriswith their weak gravitationalattraction. In this view Saturn iseclipsing the sun.

672 ● UNIT 8: EARTH AND BEYOND
from the four outer planets. Unlike these gas giants, Pluto is smalland relatively dense. Pluto has a more eccentric orbit than any ofthe planets. In fact, Pluto is sometimes closer to the sun than isNeptune.
Recently, astronomers have discovered many objects in theouter solar system that are similar to Pluto. In 2003, they discov-ered Eris, which is 27 percent more massive than Pluto and far-ther from the sun.
Dwarf Planets
In 2006, the IAU (International Astronomical Union) defined theterm planet for the first time. This definition left out Pluto. TheIAU created a new group of solar system objects: the dwarf plan-ets. The IAU classified Ceres, Eris, and Pluto as dwarf planets.Ceres is in the asteroid belt between Mars and Jupiter. Its radiusis about 10 percent of Earth’s. Pluto and Eris have larger orbitsthan any of the planets. The radius of each is about 20 percentof Earth’s. Makemake was added in 2008. All four are nearly asdense as rocks found near Earth’s surface. Ceres, Pluto, Make-make, and Eris are shown in proper order in Figure 27-2 on page666. With better telescopes and technology, astronomers are dis-covering more dwarf planets.
Asteroids
The asteroid belt is a ring of debris that separates the terrestrialand Jovian planets. Asteroids are irregularly shaped rocky ob-jects that are smaller than planets. They orbit the sun in the samedirection as the planets. Perhaps the asteroids are debris left overfrom the formation of the solar system. Earth’s gravity has pulledsome asteroids to its surface. Evidence from these asteroids indi-cates that they may be the remains of a planet that broke intomany fragments when it was struck by another object. The spac-ing between Mars and Jupiter is larger than the pattern observedamong other planets. This supports the idea of a missing planet.Visit the following Web site to take the Asteroid Challenge:Target Earth, a virtual lab where you will learn about the near-Earth asteroid, Apophis: http://spaceclass.org/apophis/. Visit the

CHAPTER 27: THE SOLAR SYSTEM ● 673
following Web site to answer the question: Did an asteroid causea tsunami in New York 2300 years ago (with animation)? http://dsc.discovery.com/news/2008/11/20/asteroid-tsunami-print.html
Comets
Occasionally, we can see comets in the night sky. They appearas a small spot of light with a long tail that points away from thesun. (See Figure 27-5.) Comets have highly eccentric orbits. Thismeans that they spend the great majority of their time in the farouter reaches of the solar system. Many comets orbit the sun be-yond the orbit of Neptune. Some comets seen in the inner solarsystem were probably pulled into highly elliptical orbits aroundthe sun by the gravity of a passing star or other object in space.When comets enter the inner part of the solar system near Earthand the sun, they move quickly under the influence of the sun’sstrong gravitational field. The brightest comets are usually visi-ble for several weeks. Then, they return to the outer portion oftheir orbits.
Comets are sometimes called dirty snowballs because they aremade of ice and rock fragments. When comets come close to thesun, some of the ice and dust escapes. These particles form thecomets’ distinctive tails. Only about 30 comets per century arebright enough to be seen without a telescope. The best known isHalley’s (HAL-ease) comet. It returns to the inner solar systemabout every 75 years, and it usually is visible without a telescope.Halley’s Comet was visible in 1986, and will return in 2061.
FIGURE 27-5. Comets are icy objectswith highly eccentric orbits. Cometsform visible tails as they pass throughthe inner parts of the solar system.Most comets are very dim. They donot streak quickly through the sky likemeteorites. They can remain visible inthe same part of the sky for weeks.

674 ● UNIT 8: EARTH AND BEYOND
Meteors
On a clear night, it is sometimes possible to see streaks of lightthat move across a portion of the sky, usually in a fraction of a sec-ond. These are solid bits of rock from outer space that enter theupper atmosphere at great speed. Friction with the atmospherecreates a streak of light known as a meteor. Table 27-1 lists thetimes of the year when meteors are especially numerous. Visit thefollowing Web site to watch a large meteor as it streaks across the
Table 27-1 Meteor Showers
Duration Number per Date of Above 25% Approximate Hour at
Name/Source Maximum of Maximum Limits Maximum
Quadrantids Jan. 4 1 day Jan. 1–6 120
Aquarids July 27–28 7 days July 15–Aug. 15 35
Perseids Aug. 12 5 days July 25–Aug. 18 90
Orionids Oct. 21 2 days Oct. 16–26 30
Geminids Dec. 14 3 days Dec. 7–15 120
FIGURE 27-6. Aerial and ground-level views of Meteor Crater, Arizona. Knownas the world’s most spectacular impact structure, Meteor Crater is 1 km (0.7mi) wide and 170 m (570 ft) deep. The white arrow shows where the ground-level photograph on the right was taken. For scale, note the spectatorslooking down into the crater from the platform at the lower right.
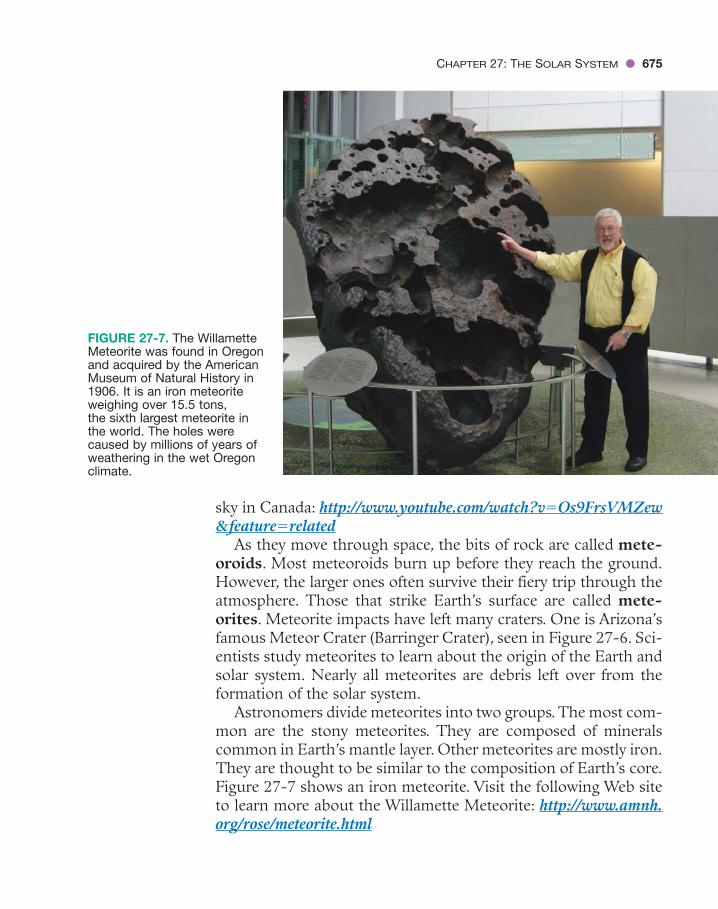
sky in Canada: http://www.youtube.com/watch?v�Os9FrsVMZew&feature�related
As they move through space, the bits of rock are called mete-oroids. Most meteoroids burn up before they reach the ground.However, the larger ones often survive their fiery trip through theatmosphere. Those that strike Earth’s surface are called mete-orites. Meteorite impacts have left many craters. One is Arizona’sfamous Meteor Crater (Barringer Crater), seen in Figure 27-6. Sci-entists study meteorites to learn about the origin of the Earth andsolar system. Nearly all meteorites are debris left over from theformation of the solar system.
Astronomers divide meteorites into two groups. The most com-mon are the stony meteorites. They are composed of mineralscommon in Earth’s mantle layer. Other meteorites are mostly iron.They are thought to be similar to the composition of Earth’s core.Figure 27-7 shows an iron meteorite. Visit the following Web siteto learn more about the Willamette Meteorite: http://www.amnh.org/rose/meteorite.html
CHAPTER 27: THE SOLAR SYSTEM ● 675
FIGURE 27-7. The WillametteMeteorite was found in Oregonand acquired by the AmericanMuseum of Natural History in1906. It is an iron meteoriteweighing over 15.5 tons, the sixth largest meteorite inthe world. The holes werecaused by millions of years ofweathering in the wet Oregonclimate.

676 ● UNIT 8: EARTH AND BEYOND
CHAPTER REVIEW QUESTIONS
Part A
1. Which planet is approximately 10 times farther from the Sun than is Earth?
(1) Mars (3) Saturn(2) Jupiter (4) Uranus
2. Which object has the greatest density?
(1) Earth (3) Jupiter(2) the moon (4) the sun
3. What is the approximate inferred age of our solar system?
(1) 1.3 billion years (3) 14 billion years(2) 4.6 billion years (4) 149 billion years
4. Which bar graph below correctly shows the orbital eccentricity of the eight plan-ets of our solar system?
5. Which object is closest to Earth?
(1) the sun (3) Venus(2) the moon (4) Mars

CHAPTER 27: THE SOLAR SYSTEM ● 677
6. Large craters found on Earth support the hypothesis that impact events havecaused
(1) a decrease in the number of earthquakes and an increase in sea level(2) an increase in solar radiation and a decrease in Earth radiation(3) the red shift of light from the most distant stars in the universe(4) mass extinctions of life-forms and global climate changes
Part B
Base your answers to questions 7 and 8 on the diagram below, which shows the inferred sequence of changes by which our solar system formed from spacedebris.
7. How did the young sun form between stages B and C?
(1) Gravity caused the center of the cloud to contract.(2) Gravity caused heavy dust particles to split apart.(3) Outgassing occurred sending jets of material outward.(4) Outgassing from Earth provided material to make the sun.

678 ● UNIT 8: EARTH AND BEYOND
8. After the young sun formed, the disk of gas and dust
(1) became a large sphere(2) split into two massive objects(3) became larger in diameter(4) formed into the planets
Base your answers to questions 9 through 11 on the passage below and yourknowledge of Earth science.
A Newly Discovered Planet
Scientist studying a sun-like star named Ogle-Tr-3 discovered a planet that is,on average, 3.5 million km from the surface of the star. The planet was discov-ered as a result of observing a cyclic decrease in the brightness of Ogle-Tr-3every 28.5 h. The changing brightness is a result of the planet blocking someof the starlight when it passes between the star and Earth. This observationenabled astronomers not only to find the planet, but also to determine its massand density. The mass has been calculated to be approximately 159 times themass of Earth. The new planet is only 20 percent as dense as Jupiter. Scientiststhink that the low density is a result of the planet being very close to the starOgle-Tr-3.
9. Compared to the periods of revolution of Mercury and Venus, the newly discov-ered planet’s period of revolution is
(1) shorter than both Mercury’s and Venus’s(2) longer than both Mercury’s and Venus’s(3) shorter than Mercury’s but longer than Venus’s(4) longer than Mercury’s, but shorter than Venus’s
10. The density of this newly discovered planet is approximately
(1) 0.1 g/cm3 (3) 1.3 g/cm3
(2) 0.3 g/cm3 (4) 2.0 g/cm3
11. Which similar light-decreasing event in our solar system is the result of themoon being between Earth and the sun?
(1) summer solstice(2) winter solstice(3) solar eclipse(4) lunar eclipse

CHAPTER 27: THE SOLAR SYSTEM ● 679
Part C
Base your answers to questions 12 through 15 on the diagram below, which showsthe orbits of the four inner planets of our solar system. The dot on each orbitshows where the planet is closest Sun.
12. Make a copy or sketch of the diagram above and write a W on the orbit of Marswhere the gravitation attraction between the sun and Mars is weakest.
13. Circle the name of the largest of the four inner planets.
14. How long does it take Mercury to spin once on its axis?
15. What is the precise shape of these planetary orbits and the shape of all orbits ofsatellites around their primaries?
Base your answers to questions 16 through 18, on page 680, on the diagram below,which shows the inferred interiors of the four terrestrial planets.
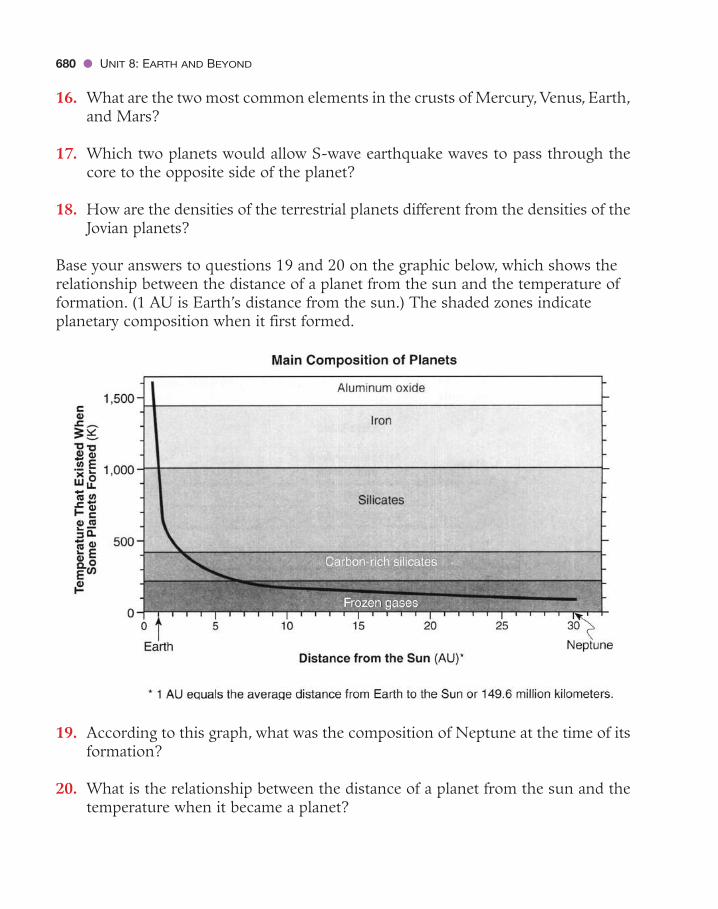
16. What are the two most common elements in the crusts of Mercury, Venus, Earth,and Mars?
17. Which two planets would allow S-wave earthquake waves to pass through thecore to the opposite side of the planet?
18. How are the densities of the terrestrial planets different from the densities of theJovian planets?
Base your answers to questions 19 and 20 on the graphic below, which shows therelationship between the distance of a planet from the sun and the temperature offormation. (1 AU is Earth’s distance from the sun.) The shaded zones indicateplanetary composition when it first formed.
19. According to this graph, what was the composition of Neptune at the time of itsformation?
20. What is the relationship between the distance of a planet from the sun and thetemperature when it became a planet?
680 ● UNIT 8: EARTH AND BEYOND

• 681 •
Stars and the Universe
C H A P T E R
28WORDS TO KNOW
big bang galaxy nuclear fusion
cosmic background radiation light-year redshift
Doppler effect luminosity star
frequency Milky Way galaxy
This chapter will help you answer the following questions:1 How do astronomers investigate stars?2 Are stars different from other celestial objects?3 How do stars generate energy?4 What kinds of stars are there?5 How do stars change?6 What are the structure, history, and future of the universe?
HOW DO ASTRONOMERS INVESTIGATE STARS?
Stars are extremely hot and have no solid surface. Scientists cannotsend instruments to land on stars. Any devices would melt andprobably vaporize long before reaching the visible surface of a star.Furthermore, other than the sun, stars are too far away to reach byspacecraft. With our present technology, it would take tens or evenhundreds of thousands of years for a spacecraft to reach even the
1: ENGINEERINGDESIGN 17: CONNECTIONS 1

682 ● UNIT 8: EARTH AND BEYOND
next nearest star. Therefore, most of the information astronomershave about stars comes from light and other electromagnetic en-ergy they radiate into space.
The Electromagnetic Spectrum
To most of us, visible light is the most important kind of electro-magnetic radiation. Light allows us to see. Visible light can be bro-ken up into its component colors by a prism. This is shown inFigure 28-1.
Our eyes are sensitive to only a narrow band of wavelengths thatwe know as visible light. However, there are other electromagneticradiations, which make up the electromagnetic spectrum. Lookback at Figure 19-12 on page 452 from the Earth Science ReferenceTables. It shows the full range of electromagnetic radiation, alsoknown as the electromagnetic spectrum.
STUDENT ACTIVITY 28-1 —MAKING A SPECTRUM
You can separate sunlight into its spectrum of colors with a glassprism. This works best in a darkened room where windows face
the sun. Close the shades so that a narrow slit of direct sunlight en-ters the room. Place the prism near the narrow opening that admitssunlight. The prism will bend the light beam and separate it into itscolors. You may need to rotate the glass prism to project a visiblespectrum. The spectrum can be projected onto a sheet of whitepaper. The stronger the light and the closer the paper is held to theprism, the brighter the spectrum will be. To increase the size of thespectrum, move the paper screen away from the prism. What twochanges in the spectrum do you observe as the paper is moved awayfrom the prism?
Elements can absorb and emit light. Each element has its owncharacteristic absorption lines, or absorption spectrum. Stars arecomposed primarily of hydrogen and helium. White light thatpasses through these gases shows dark lines in the orange, yellow,green, and blue areas of the spectrum that characterize hydrogen
1 SCIENTIFICINQUIRY: 1, 2, 3

CHAPTER 28: STARS AND THE UNIVERSE ● 683
and helium. These spectral lines correspond to the energy thatelectrons absorb when they move to higher energy levels withinthe atoms. The atoms give off the same colors when the electronsfall to lower or inner energy levels. Each element has a unique setof energy levels. Therefore, these “spectral fingerprints” allow as-tronomers to identify the composition of distant stars. Visit thefollowing Web site to decode cosmic spectra: http://www.pbs.org/wgbh/nova/origins/spectra.html
Optical Telescopes
Astronomers use optical telescopes to study the stars. (See Figure1-5 on page 10.) These telescopes concentrate the light of stars.Optical telescopes allow them to see objects that are too dim to beseen with unaided eyes. Some people think that the most impor-tant feature of a telescope is how much it magnifies. However, thestars are so distant that even the most powerful telescopes shownearly all stars as points of light. When an image is magnified toomuch, it becomes dim, unclear, or fuzzy.
Other factors are more important than magnification in tele-scope construction and use. First is the size, or diameter, of thefront lens (or light-gathering mirror).This determines the dimmestobject that can be observed. The larger the diameter of the frontlens, the dimmer the objects you can see. The farther astronomerslook into space, the dimmer the objects become.
FIGURE 28-1. A beamof white light enters thisglass prism from the top.Some of the light isreflected. However, thelight that passes throughthe glass is split into arainbow of colors. Thisshows that white light isactually a mixture ofcolors.

684 ● UNIT 8: EARTH AND BEYOND
The second factor is the quality of optics of the telescope. If thelenses or mirrors are not made with great precision, magnified im-ages will not be sharp. Earth’s atmosphere is also a limiting factor.This is why major observatories are built on high mountains,where the atmosphere is thin and has less effect on the light. Fig-ure 28-2l shows several buildings containing large telescopes ona mountaintop in Arizona. The Hubble Space Telescope (Figure28-2r) orbits Earth above the distorting effects of Earth’s atmos-phere. This telescope was a major step forward in observational as-tronomy. Visit the following Web site to see the universe throughthe Hubble Space Telescope: http://news.xinhuanet.com/english/2006-12/18/content_5501941.htm
STUDENT ACTIVITY 28-2 —MAKING A TELESCOPE
You can build a simple telescope using two convex lenses. A tubeto hold the lenses at the proper distance and alignment is help-
ful but not necessary. By using lenses with more or less curvature,you can change magnification. Moving the lens that is closest toyour eye adjusts the focus.
1: ENGINEERINGDESIGN 1
FIGURE 28-2. (l.) The largest optical telescopes are placed in observatories.The observatories are built on remote mountains to lift them above as much of atmospheric pollution as possible. (r.) The Hubble Space Telescope orbitsEarth far above the distorting effects of Earth’s atmosphere. The Hubbletelescope has taken spectacular images of distant stars and galaxies,including the Eagle Nebula pictured on page 604.

Radio Telescopes
Radio telescopes gather long-wavelength radio energy rather thanlight. Radio telescopes, like those in Figure 28-3, are not affectedby our atmosphere or by clouds of dust and gas in space that blocklight. They also can detect objects that do not produce light. Radiotelescopes do not form sharp images. This makes it difficult to tellthe exact position of a radio source. However, using radio tele-scopes astronomers make observations that would not be possi-ble with optical telescopes.
Other Telescopes
Other kinds of telescopes use electromagnetic wavelengths shorterthan visible light, such as x-rays and gamma rays. These telescopesmust be located in orbit above Earth’s atmosphere, which filtersout these forms of radiation.
Technology has changed the ways astronomers use telescopes.The first telescopes were used for direct observations. If astrono-mers wanted a permanent record of what they saw, they had to drawit by hand. Film cameras allowed astronomers to take picturesthrough their telescopes. Today, the more advanced telescopes useelectronic sensors like those in digital cameras along with comput-ers to create better quality images than ever before possible.
FIGURE 28-3.This group of radiotelescopes inwestern NewMexico uses 27giant receivingsurfaces to amplifyweak radio signalsfrom nearly anydirection in space.
• 685 •

Spectroscope
The spectroscope is one of the most important tools that astrono-mers use. A spectroscope separates light into its component col-ors (wavelengths). A spectroscope works something like a prism.When starlight passes through a spectroscope, dark lines appearin certain parts of the spectrum. These dark lines are producedwhen certain wavelengths of light are absorbed by gaseous ele-ments within the outer parts of the star.
THE SEARCH FOR EXTRATERRESTRIAL LIFE
In 1996, scientists announced that a meteorite recovered from theice of Antarctica might contain evidence of life outside Earth. Sci-entists studied the meteorite with a microscope. They saw whatmight be fossilized bacteria. They also identified organic com-pounds thought to be the result of biological processes near thisfossil.
Most scientists agree that the meteorite came from Mars. How-ever, no evidence of life on Mars has been found by remote obser-vations or by spacecraft. If life exists there, it is probably primitive,microscopic organisms. These organisms most likely live underthe planet’s surface. Some scientists suggest that the fossil-likeshape and the compounds thought to be of biological origin couldbe the result of inorganic processes. Scientists are still discussingwhether the features in this meteorite are our first direct evidenceof life outside Earth.
ET, Phone Earth
Another attempt to discover extraterrestrial life is project SETI(Search for Extraterrestrial Intelligence). SETI seeks to find radiotransmissions coming from outside our solar system. Consideringthe billions of stars in the universe, it seems possible that planetswith conditions similar to those on Earth could be orbiting somestars. It also seems possible that on some of these planets theremay be technological civilizations like our own.
The huge distances in space may keep people from travelingamong the stars. However, radio waves can travel long distances at
1: SCIENTIFICINQUIRY 1, 2, 3
686 ● UNIT 8: EARTH AND BEYOND
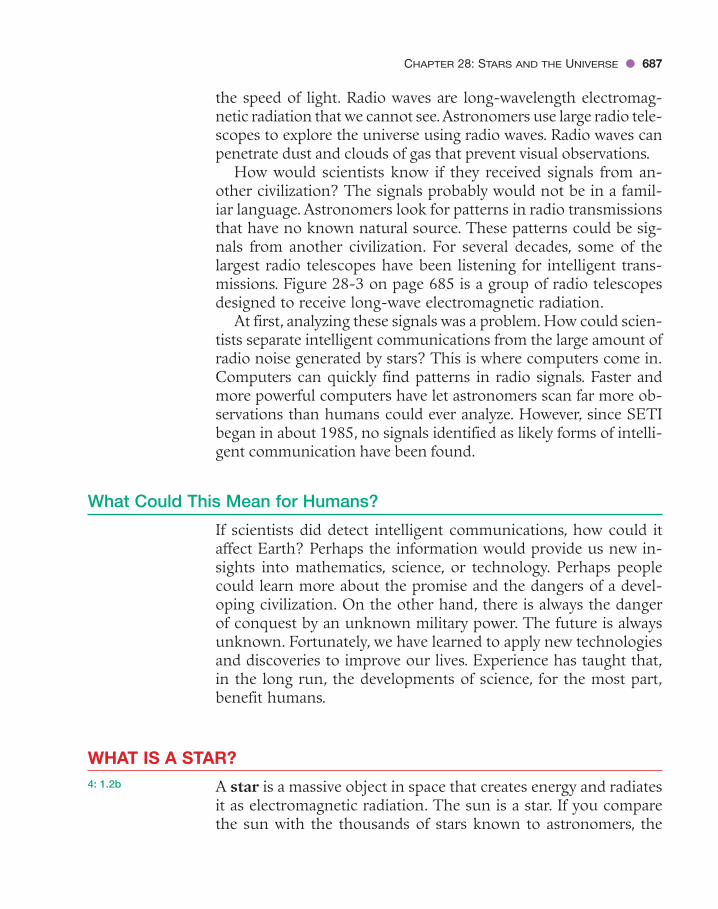
the speed of light. Radio waves are long-wavelength electromag-netic radiation that we cannot see.Astronomers use large radio tele-scopes to explore the universe using radio waves. Radio waves canpenetrate dust and clouds of gas that prevent visual observations.
How would scientists know if they received signals from an-other civilization? The signals probably would not be in a famil-iar language. Astronomers look for patterns in radio transmissionsthat have no known natural source. These patterns could be sig-nals from another civilization. For several decades, some of thelargest radio telescopes have been listening for intelligent trans-missions. Figure 28-3 on page 685 is a group of radio telescopesdesigned to receive long-wave electromagnetic radiation.
At first, analyzing these signals was a problem. How could scien-tists separate intelligent communications from the large amount ofradio noise generated by stars? This is where computers come in.Computers can quickly find patterns in radio signals. Faster andmore powerful computers have let astronomers scan far more ob-servations than humans could ever analyze. However, since SETIbegan in about 1985, no signals identified as likely forms of intelli-gent communication have been found.
What Could This Mean for Humans?
If scientists did detect intelligent communications, how could itaffect Earth? Perhaps the information would provide us new in-sights into mathematics, science, or technology. Perhaps peoplecould learn more about the promise and the dangers of a devel-oping civilization. On the other hand, there is always the dangerof conquest by an unknown military power. The future is alwaysunknown. Fortunately, we have learned to apply new technologiesand discoveries to improve our lives. Experience has taught that,in the long run, the developments of science, for the most part,benefit humans.
WHAT IS A STAR?
A star is a massive object in space that creates energy and radiatesit as electromagnetic radiation. The sun is a star. If you comparethe sun with the thousands of stars known to astronomers, the
4: 1.2b
CHAPTER 28: STARS AND THE UNIVERSE ● 687

sun appears to be a typical star. Actually, most of the stars we ob-serve in the night sky are larger and brighter than the sun. At thesame distances as the visible stars, there are far more stars smallerthan the sun that are too dim to see from Earth. Observations ofthe sun give astronomers insights into most other stars and theirobservations of other stars help them understand the sun. Neverlook directly at the sun.
STUDENT ACTIVITY 28-3 —LIGHT INTENSITY AND DISTANCE
You can use a light meter to measure the change in light inten-sity with distance. Place a lightbulb in a dark room. Measure the
intensity of the light at different distances from the lightbulb. Makea data table of the light intensity at various distances from the light-bulb. Graph your data. What other factor shows a similar change ofintensity with distance?
Starlight
For centuries, astronomers have wondered how the sun could pro-duce the large amounts of energy it radiates into space. They knewthat the brightest light sources on Earth produced light by chemi-cal changes such as burning. Fuels such as wood and coal rapidlycombine with oxygen in the atmosphere to produce heat and light.If the sun burned coal or wood to produce energy, it would run outof fuel very quickly. As scientists became aware of the age the solarsystem, it became clear that a very different process was takingplace in the sun.
Advances in science in the early twentieth century showed thatmatter could be changed into energy. You may have heard of Al-bert Einstein’s famous equation E � mc2, in which E is energy, mis mass, and c is the speed of light. The speed of light is a very largenumber. Therefore, the square of that number is enormous. Thepoint of this formula is that great amounts of energy are createdby the conversion of a small amount of mass. In the nearly 5 bil-lion years since the solar system originated, scientists estimate thatthe sun has only lost about one-third of 1 percent of its total mass.
1: SCIENTIFICINQUIRY 1, 2, 3
688 ● UNIT 8: EARTH AND BEYOND

Nuclear Fusion in Stars
Most of the mass of the sun or a similar star is hydrogen, the light-est element. When four hydrogen nuclei join to make a heliumnucleus, they lose about 1 percent of their mass. The processby which light elements join to make heavier elements is callednuclear fusion. (See Figure 28-4.) While 1 percent may seem likea small loss of mass, it is enough to create a great amount of en-ergy. However, nuclear fusion can occur only under extreme con-ditions of heat and pressure. Although the gas giant Jupiter is thelargest planet in our solar system, it is not quite large enough tosupport fusion and become a star.
Energy Escapes from Stars
Energy created deep in the sun moves to the sun’s visible surfaceby radiation and convection. From the solar surface, the energyescapes as electromagnetic radiation. The surface temperature ofthe star determines the kind of electromagnetic energy it radiates
CHAPTER 28: STARS AND THE UNIVERSE ● 689
Proton
Neutron
PositronEnergy
Nutrino
Gamma Ray
1 Helium Atom
4 Hydrogen Atoms
γ
γ γ
ν
ν ν
FIGURE 28-4. Nuclear fusion within the sun converts four protons (hydrogennuclei) into one atom of helium. This process occurs in several steps. Thesun’s mass is decreasing by about 4 million tons/s. This loss of mass isexpected to continue for another 5 billion years with plenty of mass left over.

690 ● UNIT 8: EARTH AND BEYOND
into space. The sun is a yellow star because its roughly 6000°Csurface radiates most intensely as yellow light in the visible part ofthe spectrum.
Based on observations of other stars, astronomers predict thatthe sun will continue to radiate energy as it now does for about an-other 5 billion years.
HOW ARE STARS CLASSIFIED?
In the early twentieth century, astronomers in Denmark and theUnited States discovered a way to classify stars. They based theirclassification on the amount of electromagnetic energy the starsgenerate and their temperature. The total energy output of a staris its luminosity, or absolute brightness. Apparent brightness, orstellar magnitude, is how bright the star looks as seen from Earth.The closer a star is, the brighter it appears to us. The brightnessof a star depends on its absolute magnitude, or luminosity, and itsdistance from the observer.
You may have noticed that when you turn off an incandescentlightbulb the color of the hot wire briefly changes to red before itgoes dark. Red is the coolest color of light visible to our eyes. If amaterial is heated beyond red-hot, it becomes white and thenblue. Continued heating would push the radiation into the ultra-violet part of the spectrum and beyond.
Hertzsprung-Russell Diagram
Astronomers use the Hertzsprung-Russell, or H-R, diagram toclassify stars. This graph was named in honor of the two men whodeveloped it. Figure 28-5 is from the Earth Science Reference Tables.Unlike other graphs, this graph is usually plotted with the temper-atures decreasing to the right along the bottom axis. (Usually, val-ues increase to the right as well as upward on the vertical axis.)Visit the following Web site to compare different magnitude lev-els with lightbulbs: http://www.ioncmaste.ca/homepage/resources/web_resources/CSA_Astro9/files/multimedia/unit2/magnitudes/magnitudes.html
1: SCIENTIFICINQUIRY: 14: 1.2b

CHAPTER 28: STARS AND THE UNIVERSE ● 691
Main Sequence Stars
When plotted on this graph, most stars fall into distinct groups.The greatest number of stars fall into an elongated group thatruns across the luminosity and temperature diagram from theupper left to the lower right. This region of the graph is the mainsequence. The position of a star along the main sequence is pri-marily a function of the mass of the star.
RED DWARF STARS The smallest stars, such as Barnard’s Star,are red dwarf stars, which are barely large enough to support nu-clear fusion. They are red because they are relatively cool. Thesestars are so dim that even the red dwarfs closest to us are difficultto see without a telescope. In fact, about 80 percent of the nightstars closest to Earth are too dim to be visible to the unaided eye.
FIGURE 28-5.When stars areplotted on a graph according to their energyoutput (luminosity)and surfacetemperature (whichdetermines thestar’s color), moststars fall into thegroups labeledhere.

This leads astronomers to infer that red dwarf stars are more nu-merous than all other groups of stars.
Small stars last longer than larger stars. The lower temperatureand pressure in these stars allow them to conserve hydrogen fueland continue nuclear fusion much longer than larger stars. Thecombination of small size and slow production of energy makesthem very dim.
BLUE SUPERGIANT STARS At the other end of the main se-quence are the blue supergiants. These massive stars last a smallfraction of the lives of the smaller stars. The extreme conditions oftemperature and pressure at the center of these stars cause rapiddecrease in their large quantities of hydrogen. Some of them are amillion times brighter than the sun. They are also much hotterthan the sun, giving them a blue color. These largest stars are notnearly as common as the smaller stars, in part because they burnout quickly. The most massive stars last less than one-thousandthof the life of the sun. Rigel, a bright star in the winter constella-tion Orion, is 10,000 times as luminous as the sun. The blue colorof Rigel is apparent if you compare it with Betelgeuse, anotherbright star in Orion. Betelgeuse is a red giant star on the oppositeside of the same constellation.
White dwarfs, red giants, and the supergiants are the most com-mon star groups outside the main sequence. Most other stars fallinto one of theses three groups on the temperature-luminositygraph.
HOW DO STARS EVOLVE?
Different sizes of stars have different life cycles. However, the evo-lution of stars can be illustrated by considering a star about thesize of the sun.
Birth of a Star
Star formation begins when a cloud of gas (mostly hydrogen)and dust begins to come together (condense) under the influenceof gravity. There are two sources for the material in the cloud.Some of it is hydrogen and helium left over from the formation
4: 1.2b
692 ● UNIT 8: EARTH AND BEYOND

of the universe about 14 billion years ago. The rest is the debrisfrom the explosions of massive stars that formed earlier in thehistory of the universe. This initial phase takes about 50 millionyears. (The process is faster for larger stars and slower for smallerstars.)
As the material comes together, heat is generated by the col-lapse of the matter and by friction. This heat causes the tempera-ture to rise until it is hot enough and the pressure is high enoughto support nuclear fusion. When fusion starts, the star becomesvisible. The star produces and radiates large amounts of energy.With binoculars or a small telescope, you can see several youngstars below the belt of Orion shining through a giant cloud of gasthat surrounds them. Visit the following Web site to watch the lifecycle of a star: http://aspire.cosmic-ray.org/labs/star_life/support/HR_animated_real.html
Middle Age
The star becomes less luminous after it fully condenses. An aver-age star spends most of its life on the main sequence region of theluminosity and temperature graph. Gravitational pressure bal-anced by heat from nuclear fusion keeps the star from shrinkingfurther. Middle age is the longest and most stable phase of stellarevolution.
Death of an Average Star
After about 10 billion years, a star the size of the sun runs low onhydrogen. Fusion slows. The core of helium collapses, whichcauses the outer part of the star to expand quickly. The star be-comes a red giant. Fusion of helium and other heavier elementsreplaces hydrogen fusion. The outer shell of gases expands andcools in the red giant stage. Eventually, all that is left is a dense,hot core, which is a white dwarf star.
Death of a Massive Star
Stars with more than about 10 times the mass of the sun end theirperiod in the main sequence more violently. These stars create avariety of heavier elements before they collapse. The collapse
CHAPTER 28: STARS AND THE UNIVERSE ● 693

694 ● UNIT 8: EARTH AND BEYOND
process of larger stars generates so much energy that these starsend their life in an explosion called a supernova. They briefly gen-erate more energy than the billions of stars that make up thewhole galaxy. Most of the mass of the star is blown into space. Thecore of the star may form an extremely dense object called a neu-tron star. Some stars are so massive that they form an object withgravity so strong that not even light can escape: a black hole. Blackholes cannot radiate energy, but they can be detected because en-ergy is given off by matter that falls into the black hole. They canalso be located by their gravitational effects on other objects. As-tronomers have recently detected a black hole at the center of theMilky Way and many other galaxies.
WHAT IS THE STRUCTURE OF THE UNIVERSE?
Early astronomers noticed fuzzy objects in the night sky. Theycalled these objects nebulae (singular, nebula). The word nebulacomes from the Latin word for cloud. Unlike the stars, these ob-jects looked like dim fuzzy patches of light.
Nebulae and Galaxies
Telescopes revealed that some nebulae are regions of gas and dustwhere stars are forming. In addition, some nebulae were fartheraway than any known stars. Astronomers eventually realized thatsome nebulae are huge groups of stars held together by gravity.These objects are called galaxies. The whole Andromeda galaxy isvisible as a small, faint patch of light high in the autumn sky. Pow-erful telescopes revealed that the Andromeda galaxy, like billionsof other galaxies, is a gigantic group of billions of stars. Galaxiesare separated by vast distances that contain relatively few stars.Figure 28-6 is a typical spiral galaxy. Visit the following Web siteto learn what a billion (or a trillion) pennies would look like:http://www.kokogiak.com/megapenny/default.asp
Astronomers have discovered that collisions of galaxies are rel-atively common. However, the matter within the galaxies is sospread out that the two galaxies generally pass right through eachother without individual stars colliding.
4: 1.2a

The Milky Way
Astronomers realized that all the stars visible in the night sky area part of the group of stars called the Milky Way galaxy. The sunand solar system are part of the Milky Way galaxy. This name camefrom the faint, white band of light (Figure 28-7 on page 696) thatcan be seen stretching across the sky on very dark, moonlessnights. (You cannot see the Milky Way in cities. In these areas lightpollution prevents the night sky from being dark enough to let itbe seen.) This broad band is actually made of thousands of stars.
Radio telescopes helped astronomers map the Milky Way gal-axy. Astronomers estimate that it is composed of roughly 100 bil-lion stars. Clouds of dust and gas obscure most of them. Theseclouds are also a part of our galaxy. The center of the galaxy islocated in the direction of the summer constellation Sagittarius.The shape of the Milky Way galaxy, like NGC 4414 and the An-dromeda galaxy, is a flattened spiral. The sun and solar system arelocated about two-thirds of the way from the center to the outeredge, as shown in Figure 28-6. As stars orbit the center of thegalaxy, inertia keeps gravity from drawing them together.
Orbiting the center of the galaxy is another one of Earth’s cyclicmotion in space. Our planet rotates on its axis in a 24-h cycle. It
FIGURE 28-6. Galaxy NGC 4414 is a typical spiral galaxy composed ofbillions of stars. The Milky Way galaxy and its relatively nearby twin, theAndromeda galaxy, are similar spiral galaxies. The location of Earth and thesolar system in the Milky Way galaxy is in one of the spiral arms far from thegalactic center. The white arrow in this image shows such a position.
• 695 •

696 ●
also revolves around the sun each year. The solar system revolvesaround the center of the Milky Way galaxy in about 220 millionyears. Although this is a long time, the Milky Way galaxy is so largethat this motion is actually about 10 times faster than Earth’s rev-olution in its orbit around the sun.
Clusters and Superclusters
Galaxies are not the largest structures in the universe. The MilkyWay and Andromeda galaxies are part of a cluster of about 30galaxies. This cluster is called the Local Group. Astronomers arenow mapping superclusters of galaxies and even larger structuresof matter.Why the matter of the universe is so unevenly distributedis one of the most important questions that astronomers are tryingto answer. Visit the following Web site to model galaxy collisionson your computer: http://burro.cwru.edu/JavaLab/GalCrashWeb/main.html
WHAT IS THE HISTORY OF THE UNIVERSE?
When you look at very distant objects in the universe, you arelooking back in time. This is because light has a limited speed. Youlearned in an earlier chapter that you could estimate the distanceto a lightning strike by counting the seconds between seeing the
4: 1.2a
FIGURE 28-7. On dark, moonlessnights, ancient people saw aband of faint light crossing thesky. They called it the Milky Waybecause it reminded them ofspilled milk. They did not realizethat they were actually seeingmillions of distant stars, many ofthem much brighter than the sun.

CHAPTER 28: STARS AND THE UNIVERSE ● 697
flash and hearing the thunder. Due to light’s speed, you see theflash at essentially the same time it occurred. Light travels so fastthat it could circle Earth about 7 times in 1 s. Visit the followingWeb site to watch the PowerPoint Presentation—Can We Rewindthe Clock to Catch a Glimpse Near the Beginning of Time? http://www.bnl.gov/physics/colloquium/PHENIX_Final.ppt
Using Light as a Yardstick
Distances in space are so great that light cannot reach Earth in-stantly. Light and other electromagnetic energy take about 3 s totravel from the moon to Earth. It takes about 8 minutes for this en-ergy to travel from the sun to Earth. Light takes more than 4 yearsto arrive from the nearest star, Proxima Centauri. The most distantobject visible to the unaided eye is the Andromeda Galaxy. Lightfrom the Andromeda galaxy takes about 2 million years to reach us.
Astronomers use light to measure the universe. A light-year isthe distance that any form of electromagnetic energy can travel in1 year. That distance is about 10 trillion km (6 trillion mi). Al-though the light-year may sound like a measure of time, it is a mea-sure of distance.
When astronomers look at distant objects in space, they seethem as they were when the light started its journey toward Earth.The deeper astronomers look into space, the farther back in timethey see. At present, astronomers estimate that the most distantobjects they can see are about 13 billion light-years away. As-tronomers can see what the universe looked like about a billionyears after its origin. They estimate the origin occurred about 14billion years ago.
Redshift
Astronomer Edwin Hubble examined the spectra of distant galax-ies in the early 1900s. He compared the dark absorption lines, orabsorption spectra, of light from these faraway galaxies to theabsorption spectra of nearby stars. Nearby stars had absorptionspectra similar to those produced in the laboratory. However, thedark lines in the spectra of distant galaxies were shifted toward thered end of the spectrum. Hubble reasoned that the motion of dis-tant galaxies away from Earth causes the redshift of spectral lines.Figure 28-8, on page 698, illustrates the redshift of spectral lines.

698 ● UNIT 8: EARTH AND BEYOND
If the galaxies were moving toward Earth, the spectral lineswould shift toward the blue end of the spectrum. The shift towardthe red end of the spectrum indicates that the galaxies are movingaway from Earth. Visit the following Web site to see the absorp-tion lines of elements in the Periodic Table: http://jersey.uoregon.edu/vlab/elements/Elements.html
You can experience a similar change with sound. If you standnext to an automobile racetrack, the high-pitched sound of the ap-proaching car changes to a lower pitch as the car speeds past you.Pitch is related to frequency, which is a measure of how manywaves pass a given point in a given period of time. This apparentchange in frequency and wavelength of energy that occurs whenthe source of a wave is moving relative to an observer is called theDoppler effect. It was named for Christian Johann Doppler, thescientist who explained it in 1842. The change in the frequencyand wavelength of sound waves is similar to the changes thatHubble observed with light. The motion of a star away from us ata significant fraction of the speed of light extends the electromag-netic waves. The extended (stretched) waves make the star lookredder than if it were not receding. Figure 28-9 shows how the mo-tion of a source toward or away from an observer affects the wave-length. The greater the redshift, the faster the object is movingaway. Astronomers have found that the most distant galaxiesare moving away the fastest. Visit the following Web site to watchanimated simulations of the Doppler effect on sound: http://www.colorado.edu/physics/2000/applets_New.html
Two other factors supported Hubble’s hypothesis of an ex-panding universe. The redshift of light of distant galaxies is ob-served in all directions. In addition, the dimmer galaxies, which are
FIGURE 28-8. When welook at the signatureelements of stars, the darklines that mark hydrogenand other elements areclearly visible. The moredistant stars and galaxiesshow the dark linesshifted toward the red endof the spectrum.

CHAPTER 28: STARS AND THE UNIVERSE ● 699
thought to be dim because they are farther from Earth, showedgreater redshift. He also reasoned that this kind of motion is acharacteristic of an explosion. You might think that the motion ofdistant galaxies away from Earth in all directions means that weare at the center of the expansion. However, from every positionwithin the expanding matter of an explosion, matter is movingaway in all directions.
STUDENT ACTIVITY 28-4 —A MODEL OF THE BIG BANG
Inflate a round balloon to the size of a tennis ball. Draw severalsmall dots on the balloon’s surface. Notice that as the balloon is
inflated more, the dots always move apart. If observers were locatedanywhere on the surface of the balloon or even inside the balloon,as the balloon is inflated, they would see the dots moving away inall directions. No matter what location is chosen, it would appearthat the observer is at the center of the expansion. Therefore, thereis no way that astronomers can find the center of the universe.
In the 1960s, Arno Penzias and Robert Wilson were working onlong-distance radio communications for the Bell Telephone Com-pany. They built a special outdoor receiver to detect weak radio
6: MODELS 2
FIGURE 28-9. The Doppler effect is a difference in wave frequency dependingupon whether the source is moving toward or away from the observer. Thisoccurs with both sound and light waves. Distant galaxies appear more red tous because the light waves are spread out by the motion of these galaxiesaway from us.
700 ● UNIT 8: EARTH AND BEYOND
signals. However, the device picked up annoying radio signals thatthey could not eliminate.They investigated the source of these radiosignals and found that the energy they were picking up was billionsof years old. They were listening to the origin of the universe. Theseradio signals, the cosmic background radiation, are weak electro-magnetic radiation left over from the formation of the universe.
The Big Bang
The outward motions of distant galaxies and the cosmic back-ground radiation are evidence that the universe began as an eventnow called the big bang. The name was first proposed as a joketo make fun of the theory, but the name stuck. This theory pro-poses that at its origin, the universe was a concentration of mat-ter so dense that the laws of nature as we know them today didnot apply. This matter expanded explosively, forming the universe.Even the most extreme conditions that exist within the largeststars do not compare with the beginning of the universe.
Experiments and the theories of physics confirm that the speedof light is the greatest velocity possible for matter or energy. Thespeed of light is about 300 million m/s. Like the temperature ofabsolute zero (0 K), the speed of light is one of the absolute lim-its known to science. Astronomers reason that the universe is ex-panding at this rate.
Using the speed of light, astronomers work back to the time ofthe big bang. They estimate that the universe began with the bigbang 14 billion years ago. Expanding outward in all directions, theuniverse today could be as much as 28 billion light-years across.This is so gigantic that it is nearly impossible for humans to com-prehend how large this is. Earth, the solar system, and even thehuge Milky Way Galaxy are incredibly small compared with thesize of the universe. Visit the following Web site and take A Cos-mic Journey: A History of Scientific Cosmology and click on TheExpanding Universe: http://www.aip.org/history/cosmology/
WHAT IS THE FUTURE OF THE UNIVERSE?
From our point of view, Earth, as a planet, is very stable. Earth’sorbit around the sun is unchanging. Scientists expect the sun tocontinue its energy production on the main sequence for billionsof years. Collisions with large objects from space, such as those
4: 1.2a6: PATTERNS OFCHANGE 5

CHAPTER 28: STARS AND THE UNIVERSE ● 701
thought to mark the ends of past geologic eras, are possible.Fortunately, these events are becoming less likely as the solar sys-tem ages. However, the very-long-term future of the universe isnot clear.
The Future of the Universe
Scientists once thought the universe had three possible futures.Some scientists proposed that the expansion of the universe mightbe slowing due to gravity. However, it is possible that there is notenough gravity to stop the expansion. In this case, the universewould continue to expand without limit. Other scientists pro-posed that there may be enough gravity to just stop the expansion,leading to a steady state. If the universe has enough gravity to re-verse its expanding phase, it could fall back together in a very dis-tant event that some astronomers call the “big crunch.”
A good way to understand this is to consider a baseball thrownstraight up. Gravity brings the ball back to the ground. However, ifyou could propel the ball fast enough, it would continue upwardinto space and never return to Earth. Figure 28-10 illustrates thebig bang followed by the big crunch. Visit the following Web site to
FIGURE 28-10. Scientists know that the universe has expanded over the past 14billion years. The expansion began with the “big bang.” Will expansion stop andgravity pull the universe back into a black hole? Recent evidence seems to favor amodel with continued growth and even accelerating expansion.
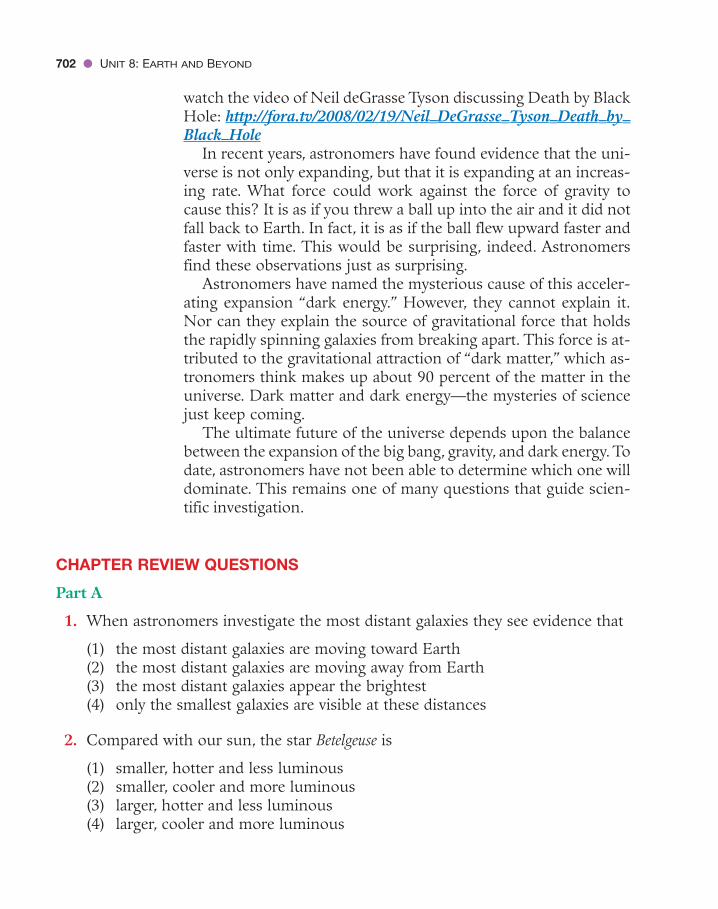
watch the video of Neil deGrasse Tyson discussing Death by BlackHole: http://fora.tv/2008/02/19/Neil_DeGrasse_Tyson_Death_by_Black_Hole
In recent years, astronomers have found evidence that the uni-verse is not only expanding, but that it is expanding at an increas-ing rate. What force could work against the force of gravity tocause this? It is as if you threw a ball up into the air and it did notfall back to Earth. In fact, it is as if the ball flew upward faster andfaster with time. This would be surprising, indeed. Astronomersfind these observations just as surprising.
Astronomers have named the mysterious cause of this acceler-ating expansion “dark energy.” However, they cannot explain it.Nor can they explain the source of gravitational force that holdsthe rapidly spinning galaxies from breaking apart. This force is at-tributed to the gravitational attraction of “dark matter,” which as-tronomers think makes up about 90 percent of the matter in theuniverse. Dark matter and dark energy—the mysteries of sciencejust keep coming.
The ultimate future of the universe depends upon the balancebetween the expansion of the big bang, gravity, and dark energy. Todate, astronomers have not been able to determine which one willdominate. This remains one of many questions that guide scien-tific investigation.
CHAPTER REVIEW QUESTIONS
Part A
1. When astronomers investigate the most distant galaxies they see evidence that
(1) the most distant galaxies are moving toward Earth(2) the most distant galaxies are moving away from Earth(3) the most distant galaxies appear the brightest(4) only the smallest galaxies are visible at these distances
2. Compared with our sun, the star Betelgeuse is
(1) smaller, hotter and less luminous(2) smaller, cooler and more luminous(3) larger, hotter and less luminous(4) larger, cooler and more luminous
702 ● UNIT 8: EARTH AND BEYOND
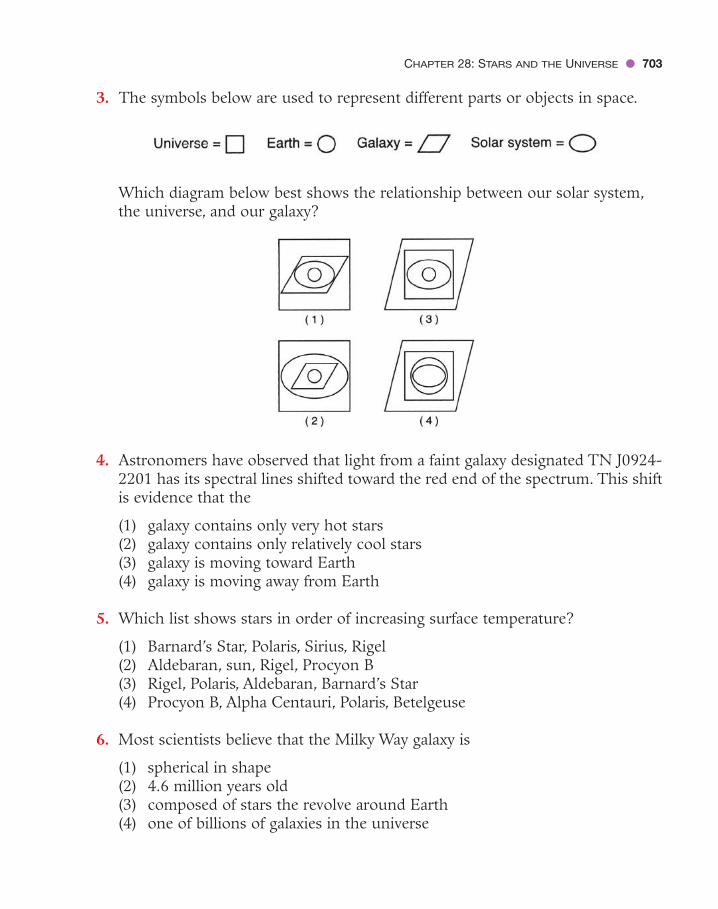
3. The symbols below are used to represent different parts or objects in space.
Which diagram below best shows the relationship between our solar system,the universe, and our galaxy?
4. Astronomers have observed that light from a faint galaxy designated TN J0924-2201 has its spectral lines shifted toward the red end of the spectrum. This shiftis evidence that the
(1) galaxy contains only very hot stars(2) galaxy contains only relatively cool stars(3) galaxy is moving toward Earth(4) galaxy is moving away from Earth
5. Which list shows stars in order of increasing surface temperature?
(1) Barnard’s Star, Polaris, Sirius, Rigel(2) Aldebaran, sun, Rigel, Procyon B(3) Rigel, Polaris, Aldebaran, Barnard’s Star(4) Procyon B, Alpha Centauri, Polaris, Betelgeuse
6. Most scientists believe that the Milky Way galaxy is
(1) spherical in shape(2) 4.6 million years old(3) composed of stars the revolve around Earth(4) one of billions of galaxies in the universe
CHAPTER 28: STARS AND THE UNIVERSE ● 703

7. Which star gives off the least light?
(1) Deneb(2) Proxima Centauri(3) the sun(4) Sirius
8. Approximately how much brighter than the star Aldebaran is the star Betel-geuse?
(1) Betelgeuse is approximately twice as bright as Aldebaran.(2) Betelgeuse is approximately 10 times as bright as Aldebaran.(3) Betelgeuse is approximately 100 times as bright as Aldebaran.(4) Betelgeuse is approximately 10,000 times as bright as Aldebaran.
Part B
Base your answers to questions 9 through 12 on the table below, which containsinferred information about the evolution of the universe.
Data Table
Average Temperature Time From the Beginning Stage Description of the Universe of the Universe (°C) of the Universe
1 The size of an atom ? 0 s
2 The size of a grapefruit ? 10�43 s
3 “Hot soup” of electrons 1027 10�32 s
4 Cooling allows protons and neutrons to form 1013 10�6s
5 Still too hot to allow atoms to form 108 3 minutes
6 Electrons combine with protons and neutrons, 10,000 300,000 yearsforming hydrogen and helium atoms; light emission begins
7 Hydrogen and helium form giant clouds (nebulae) �200 1 billion yearsthat will become galaxies; first stars form
8 Galaxy clusters form and first stars die; heavy �270 13.7 billion yearselements are thrown into space, forming new stars and planets.
704 ● UNIT 8: EARTH AND BEYOND
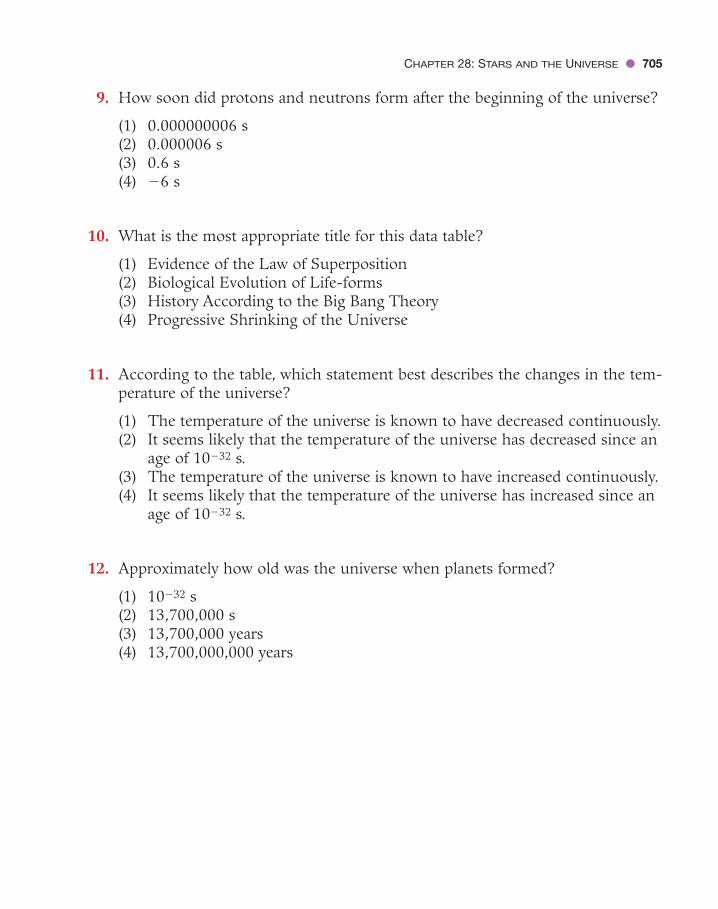
9. How soon did protons and neutrons form after the beginning of the universe?
(1) 0.000000006 s(2) 0.000006 s(3) 0.6 s(4) �6 s
10. What is the most appropriate title for this data table?
(1) Evidence of the Law of Superposition(2) Biological Evolution of Life-forms(3) History According to the Big Bang Theory(4) Progressive Shrinking of the Universe
11. According to the table, which statement best describes the changes in the tem-perature of the universe?
(1) The temperature of the universe is known to have decreased continuously.(2) It seems likely that the temperature of the universe has decreased since an
age of 10�32 s.(3) The temperature of the universe is known to have increased continuously.(4) It seems likely that the temperature of the universe has increased since an
age of 10�32 s.
12. Approximately how old was the universe when planets formed?
(1) 10�32 s(2) 13,700,000 s(3) 13,700,000 years(4) 13,700,000,000 years
CHAPTER 28: STARS AND THE UNIVERSE ● 705
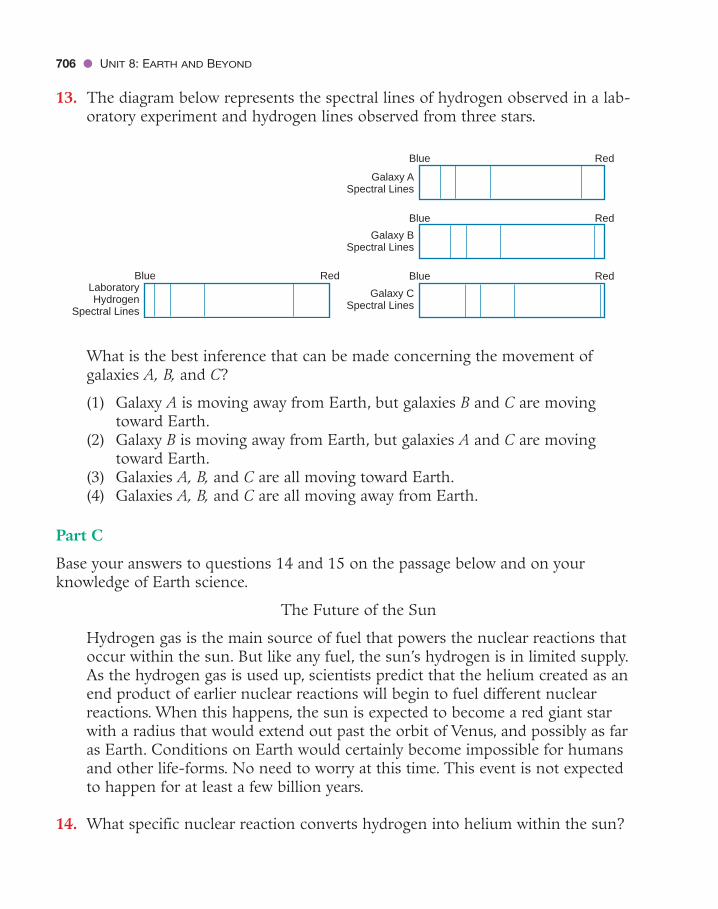
13. The diagram below represents the spectral lines of hydrogen observed in a lab-oratory experiment and hydrogen lines observed from three stars.
What is the best inference that can be made concerning the movement ofgalaxies A, B, and C?
(1) Galaxy A is moving away from Earth, but galaxies B and C are movingtoward Earth.
(2) Galaxy B is moving away from Earth, but galaxies A and C are movingtoward Earth.
(3) Galaxies A, B, and C are all moving toward Earth.(4) Galaxies A, B, and C are all moving away from Earth.
Part C
Base your answers to questions 14 and 15 on the passage below and on yourknowledge of Earth science.
The Future of the Sun
Hydrogen gas is the main source of fuel that powers the nuclear reactions thatoccur within the sun. But like any fuel, the sun’s hydrogen is in limited supply.As the hydrogen gas is used up, scientists predict that the helium created as anend product of earlier nuclear reactions will begin to fuel different nuclearreactions. When this happens, the sun is expected to become a red giant starwith a radius that would extend out past the orbit of Venus, and possibly as faras Earth. Conditions on Earth would certainly become impossible for humansand other life-forms. No need to worry at this time. This event is not expectedto happen for at least a few billion years.
14. What specific nuclear reaction converts hydrogen into helium within the sun?
Galaxy ASpectral Lines
Galaxy BSpectral Lines
Galaxy CSpectral Lines
Blue
Blue
Blue
Red
Red
Red
LaboratoryHydrogen
Spectral Lines
Blue Red
706 ● UNIT 8: EARTH AND BEYOND

15. According to this paragraph, what is the range of estimates for the solar radiuswhen it becomes a red giant? (Use kilometers as your units of measure.)
16. Explain how a red star such as Aldebaran can give off more light than the sun,which is much hotter than Aldebaran.
Base your answer to question 17 on the incomplete table below.
Star Classification
Star Color Classification
Sun Yellow Main sequence
Procyon B
17. What is the color of the star Procyon B, and to what group of stars does it belong?
18. What do x-rays, infrared radiation, and radio waves have in common?
19. What force could slow the expansion of the universe?
20. What is the surface temperature of the North Star?
CHAPTER 28: STARS AND THE UNIVERSE ● 707

Appendices
APPENDIX A: LABORATORY SAFETY
Laboratory work is an important part of science. However, many materials, equipment,and procedures that scientists use are potentially hazardous. Working in the science labrequires more attention to safety than do most other activities in the school setting.Work and conduct yourself with care in the laboratory. You should be familiar withthe rules below, and be alert to any hazards.
1. Follow all safety precautions as directed by the teacher and stated inprinted directions. If you do not understand the directions, ask yourteacher to clearly explain them to you.
2. Notify the teacher at once if there is an accident or dangerous situa-tion such as an electrical problem; an injury; or a spill of water, chem-icals, or other substances. The teacher will supervise the cleanup ofspilled chemicals, broken glass, or broken equipment.
3. Never perform a laboratory procedure unless the teacher approves it.
4. Touch equipment and materials only as directed. If you do not under-stand how to perform a procedure, ask for help.
5. Wear laboratory safety goggles whenever you mix chemicals, heat liq-uids, perform procedures that could result in flying particles, or per-form any tasks that could injure your eyes. When performing theseprocedures, everyone at the lab station must wear safety goggles.
6. When using a flame or a hot plate, keep combustible materials includ-ing paper, clothing, jewelry, and hair safely away from the heat source.If you are heating something in a container, be sure the container hasan opening and point the open end away from people.
7. Hot plates, burners, glassware, and other materials remain hot for along time. Use special caution during the cooling of these objects. Donot hesitate to ask for help, or for tongs or other special materials tohandle these objects.
8. The use of acids, bases, and many other laboratory chemicals requiresspecial precautions. You should handle these chemicals only as in-structed, and their use must be supervised by your teacher.
9. Use sharp or pointed objects such as scissors, knives, and pins in sucha way as to avoid puncture injuries.
10. Dispose of materials as directed. Do not dispose of solids in sinks orput hazardous materials into wastebaskets.
• 708 •

11. Keep the work area neat and clean. At the end of the procedure, returnequipment and materials as you are instructed. Unplug electrical devicesand turn off gas and water unless instructed otherwise by your teacher.
12. Know the location of and how to use safety equipment and materialssuch as running water and fire-retarding devices. Also know how tonotify another adult if the teacher is unable to respond to events.
APPENDIX B: A FORMAT FOR LABORATORY REPORTS
This lab report format is presented as a general guide to help students organize labactivities and written reports. Reports for laboratory activities are required for admis-sion to the Regents examination. For some lab activities, your teacher may present labsin a written guided format. At other times, you may not be given special written in-structions about how to conduct and report on a particular lab. Or, you may be askedto completely plan and conduct your own procedure. For those cases, this format is of-fered to help you organize, conduct, and report on your laboratory activity. Be sure youunderstand whether each student must submit a report or if one report for the wholelab group is sufficient. Different lab groups should not work together or produce vir-tually identical lab reports. In general, it is best to keep lab reports neat, and brief, butcomplete.
Open-Ended Laboratory Report Format
Title: The name of the lab. This may be a brief indication of what is beinginvestigated.
Date: The date the lab procedure was performed.
Names: List all members of the lab group.
Objective(s): A clear statement of what your lab procedure is intended toexplore.
Materials: Make a list of all the special equipment and supplies needed toconduct the laboratory procedure.
Procedure: In a sequence of numbered steps, tell how this lab wasperformed. These steps should be clear enough that a person who is notfamiliar with the activity can follow them and obtain good results. Pleaseinclude any safety precautions or other warnings that may be necessary.
Observations/Data/Graphs: List the outcome of your procedure in aneat and organized format. This will include the data you collect, anymathematical steps taken with the data, and graph(s) to clarify yourfindings.
Conclusions or Discussion: The conclusion should relate yourobservations and results to the objectives at the beginning of the labreport.
APPENDICES ● 709

APPENDIX C: THE INTERNATIONAL SYSTEM OF UNITS (S.I.)
S.I. units were based on European measures commonly known as the metric system.They are used by the people of every major nation of the world except the UnitedStates. Scientific publications usually use S.I. or metric units. Most S.I. units are re-lated to larger and smaller units by a factor of 10. The system of measures most com-monly used in the United States is sometimes known as United States customary units.
Basic UnitsBasic units (meter, liter, gram) are not composed of other units. Derived units are a com-bination of basic units. Examples of derived units include volume, which can be measuredin meters cubed (distance3); speed, which is measured in meters per second (distance/time); and density, which is measured in grams per cubic centimeter (mass/volume).
Approximate Quantity S.I. Unit Symbol U.S. Equivalentlength meter m 39.37 inches (about 3 inches longer
than 1 yard)mass kilogram kg 2.204 poundstime second s (Identical units)temperature kelvin* K (Note the conversion chart to
degrees Fahrenheit or Celsius inthe Earth Science Reference Tables)
*°Celsius is often used in metric measures. Kelvins should be expressedwithout a degree (°) sign.
S.I. and Metric Prefixes with Examples
Prefix Symbol Multiple Example (length)kilo k 1000 kilometer (1 km � 1000 m)centi c 1/100 centimeter (1 cm � 0.01 m)milli m 1/1000 millimeter (1 mm � 0.001 m)Prefixes for other multiples of ten are sometimes used, but the threeshown above are the most common prefixes.
Conversions Between S.I. (Metric) and U.S. Customary UnitsThese conversion factors are limited to a convenient number of decimal places.
Length1 centimeter � 0.394 inch (1 inch � 2.54 centimeters)1 meter � 39.37 inches (1 foot � 0.341 meter)1 kilometer � 0.62 mile (1 mile � 1.61 kilometers)
Volume and Capacity1 liter � 1.06 quarts (1 quart � 0.95 liter)1 milliliter � 0.035 ounce (1 ounce � 28.4 milliliters)The cubic centimeter is sometimes used as the equivalent of the milliliter.
710 ● APPENDICES

Mass1 gram � 0.035 ounce (1 ounce � 28.4 grams)1 kilogram � 2.204 pounds (1 pound � 0.4536 kg � 453.6 grams)
APPENDIX D: PHYSICAL CONSTANTS
Speed of light: 300,000,000 m/s (186,000 mi/s)[1 light-year is about 6 trillion (6 � 1012) mi or 10 trillion km]Lowest possible temperature: 0 K (�273°C or �460°F)Density of water: 1 g/mL (at 3.98°C)Mass of hydrogen atom: 1.67 � 10�27 kg
APPENDIX E: GRAPHS IN SCIENCE
It is often easier to understand data when it is presented in the form of a simple graph.Making and reading graphs are important skills to scientists and others. There aremany kinds of graphs, but the two-dimensional line graph, bar graph, and pie graphare the most commonly used forms. A line graph is used to show continuous change. Abar graphs and pie graphs shows unconnected data values.
Chapter 1 (pages 2 to 26) has a section on making graphs.If you need to make a graph, follow these rules to get the best results.
1. Remember that the purpose of a graph is to make data more mean-ingful. Keep the graph simple and neat, but include all necessaryinformation.
2. Label the two axes with the quantity (such as mass, temperature, orwhatever you are graphing) and the appropriate units (such as gramsor °C).
3. Label the axes with numbers that are appropriate for the range ofdata. The data (line or bars) should extend at least half way along eachof the two axes. Graphs that simply represent general relationshipsmay be shown without including numbers and units on the axes. Itshould be understood that values on graphs usually increase to theright along the x axis and upward along the y axis.
4. Usually, the independent variable is graphed along the bottom, or xaxis. For example, if your graph shows the amount of rock weatheringthat occurs through time, time should increase along the bottom axis.Because time influences the amount of weathering, rather than weath-ering affecting the passage of time, time is considered the independentvariable. Values of the independent variable are usually selected toshow how the dependent variable changes.
APPENDICES ● 711

5. When the data has been plotted, a clear pattern may become visible.Sometimes the data points form a line that can be drawn with astraight edge. In other graphs, a smooth curve better fits the data.Draw the graph line accordingly.
6. Logically, some graph lines pass through the origin (0, 0), and othersdo not. Consider what you are graphing and draw the graph line ac-cordingly.
7. All measurements include some error. Error can be made very small,but error cannot be eliminated. For this reason, it is possible that themost appropriate line will not pass through the center of each datapoint. It may be a straight line or a gentle curve that clearly shows thetrend and estimated values of the data. This is sometimes called a“best fit” line.
8. A title, usually shown near the top of the graph, helps to identify thepurpose of the graph. For example, a graph titled “Average MonthlyTemperatures at Buffalo, New York” makes the meaning of the graphclear.
9. The guidelines above are not always followed. Graphs may violate oneor more of these rules. As long as the graph makes the data moremeaningful, it has fulfilled its principal function.
APPENDIX F: EARTH SCIENCE REFERENCE TABLES
In recent years between a third and a half of the questions on the Regents exam haveinvolved the use of the Earth Science Reference Tables. Furthermore, that docu-ment has many words you will need to understand. You can download and print the2010 edition of the Earth Science Reference Tables at http://www.emsc.nysed.gov/osa/reftable/earthscience-rt/esrt2010-engw.pdf
If you have your own copy of the Reference Tables, you can use a marker to high-light the terms and tables you do not understand. Ask your teacher to explain themto you.
712 ● APPENDICES
Glossary
This glossary can be used as a study aid. The terms that follow are helpfulin learning Regents Earth science. Please be aware that the primary impor-tance of these terms is their applications to understanding Earth systems. Ifyou are not familiar with some of these terms, you may wish to use the indexof this book to find them within their scientific context. Definitions aloneare of limited use.
The entries for the terms are intended to help you understand how thewords are applied in this specific course. Broader and more precise defini-tions can be found in textbooks that are more advanced and other referencematerials.
The abbreviation ESRT is used to highlight terms used and sometimesclarified in the Earth Science Reference Tables. Many important terms that arenot listed here, such as specific rock types and names of geologic ages, maybe understood using charts in the Reference Tables.
• 713 •
abrasion: The grinding away of rock by fric-tion with other rocks
absolute age: An age expressed as a specificamount of time, absolute age always includesa unit of time; numerical age (ESRT)
absolute humidity: The mass of water vaporin each cubic unit of air
acid precipitation: Precipitation (snow orrain) with corrosive (low pH) chemical proper-ties, generally the result of pollution from theburning of fossil fuels
agents of erosion: Moving water, wind, or ice that causes the transport of weatheredmaterials
air mass: A large body of air that is relativelyuniform in temperature and humidity (ESRT)
altitude: The angular elevation of an objectabove the horizon
angle of insolation: The angle betweenEarth’s surface and incoming rays of sunlight;angle of the sun above the horizon
Antarctic Circle: The latitude (66.5°S) southof which the sun does not rise on theSouthern Hemisphere’s winter solstice; thelatitude (66.5°S) south of which the sun is inthe sky for 24 h on the Southern Hemi-sphere’s summer solstice (ESRT)
anticyclone: A region of relatively highatmospheric pressure
aquifer: An underground zone of porousmaterial that contains useful quantities ofgroundwater
arctic air mass: A large body of very cold airthat originated in the Arctic (ESRT)
Arctic Circle: The latitude (66.5°N) north ofwhich the sun does not rise on the NorthernHemisphere’s winter solstice; the latitude(66.5°N) north of which the sun is in the skyfor 24 h on the Northern Hemisphere’ssummer solstice (ESRT)
arid climate: A climate that has little rain andlow humidity

asteroid: An irregularly shaped rocky massthat is smaller than a planet and occupies anorbit around the sun; most are found betweenthe orbits of Mars and Jupiter
asthenosphere: The upper part of the mantle,capable of slow deformation and flow underheat and pressure (ESRT)
astronomy: The study of Earth’s motionsand the objects beyond Earth, such as planetsand stars
atmosphere: The layer of gases that sur-rounds a celestial body (ESRT)
avalanche: a large amount of snow and rockthat moves rapidly downhill over a steep slope
axis: An imaginary line that passes throughEarth’s North and South poles
azimuth: The compass direction specified asan angle. Azimuth starts at 0° at due north andprogresses through east (90°), south (180°),west (270°), and back to north (360°, or 0°).
banding: The light- and dark-colored layersof mineral that form parallel to foliation inmetamorphic rocks (ESRT)
barometer: An instrument used to measureair pressure
barrier islands: Offshore features, similar tosandbars, that rise above sea level
bed load: The sediments that roll or bouncealong the bottom of a stream
bedrock: The solid, or continuous, rock thatextends into Earth’s interior
big bang: The theory that the universeformed as a concentration of matter expandedexplosively
bioclastic sedimentary rocks: Rocks com-posed of materials made from or by livingorganisms (ESRT)
biological activity: The actions of plants andanimals that cause weathering
blizzard: A winter snowstorm that producesheavy snow and winds of 35 mph (56 km/h)or greater
boiling: The change in state from liquid togas (vapor) at the boiling temperature
caldera: A large, bowl-shaped depressionformed when the top of a volcano collapsesinto the emptied magma chamber
capillarity: The tendency of a substance to pullwater into tiny spaces, or pores, by adhesion
celestial objects: Objects in the sky that arebeyond Earth’s atmosphere
chemical change: A change, such as rusting,that results in the formation of a new substance
chemical weathering: A natural process thatoccurs under conditions at Earth’s surface,forming new compounds
classification: The organization of objects,ideas, or information according to theirproperties
clastic: Sedimentary rocks that are composedof the weathered remains of other rocks; frag-mental (ESRT)
cleavage: The tendency of some minerals tobreak along smooth, flat surfaces (ESRT)
climate: The average weather conditions overa long time, including the range of conditions
cloud: A large body of tiny water droplets orice crystals suspended in the atmosphere
cloud-base altitude: The height at whichrising air begins to form clouds
comet: An object made of ice and rock frag-ments that revolves around the sun usually ina highly eccentric orbit; it may be visible peri-odically in the night sky as a small spot oflight with a long tail
compounds: Substances made up of morethan one kind of atom (element) combinedinto larger units called molecules
714 ● GLOSSARY
condensation: The process by which asubstance changes from a gas to a liquid(ESRT)
condensation nuclei: Tiny particles of solidssuspended in the air on which water con-denses to form clouds
conduction: The movement of heat thatoccurs as heated molecules pass their vibra-tional energy to nearby molecules
conservation: The careful use, protection,and restoration of our natural resources
contact metamorphism: The process inwhich an intrusion of hot, molten magmacauses changes in the rock close to it (ESRT)
continental air mass: A large body of air thathas relatively low humidity because it origi-nated over land (ESRT)
continental climate: A climate characterizedby large seasonal changes in temperature
continental glacier: A glacier that flows out-ward from a zone of accumulation to cover alarge part of a continent
contour line: A line on a map that connectsplaces having the same elevation (height aboveor below sea level)
convection: A form of heat flow that movesmatter and energy as density currents underthe influence of gravity (ESRT)
convection cell: The pattern of circulationthat involves vertical and horizontal flow
convergence: The act of moving together(ESRT)
convergent plate boundary: A place wherelithospheric plates collide (ESRT)
coordinate system: A grid in which eachlocation has a unique designation defined bythe intersection of two lines (ESRT)
Coriolis effect: The apparent curvature of thepath of winds and ocean currents as they
travel long distances over Earth’s surface;caused by Earth’s rotation
correlation: Matching bedrock layers by rocktype or by age
cosmic background radiation: Weak electro-magnetic radiation (radio waves) left over fromthe formation of the universe (big bang)
crater: A bowl-shaped depression at the topof a volcano caused by an explosive eruptionor the impact of an object from space
crystalline sedimentary rocks: Sedimentaryrocks that form by precipitation (ESRT)
cyclone: (1) A region of relatively low atmo-spheric pressure; (2) term applied to hurricanesin the Indian Ocean; (3) synonym for tornado
decay product: The stable, ending material ofradioactive decay (ESRT)
decay-product ratio: A comparison of theamount of the original radioisotope with theamount of its decay product (ESRT)
deforestation: Cutting forests to clear theland for other uses
delta: A deposit of sediment built into a largebody of water by deposition from a stream
density: The concentration of matter, or themass per unit volume (ESRT)
deposition: The settling, or release, of sedi-ments that have been carried by an agent oferosion (ESRT)
dew: Liquid water that forms by condensationon cold surfaces
dew point: The temperature at which air issaturated with water vapor (ESRT)
dew-point temperature: The temperature towhich air must be cooled to become saturatedwith moisture (ESRT)
discharge: The amount of water flowing pasta particular place in a specified time
GLOSSARY ● 715

divergence: The act of moving apart
divergent plate boundary: A place wherelithospheric plates separate (ESRT)
Doppler effect: The apparent change in fre-quency and wavelength of energy radiated bya source as a result of the motion of thesource or the observer
Doppler radar: A device that uses reflectedradio waves to measure at a distance windspeed and direction
drainage divides: The high ridges, fromwhich water drains in opposite directions, thatseparate one watershed from another
drainage pattern: The path of a stream,which is influenced by topography and geo-logic structures
drought: A long period of dry weather
drumlins: Streamlined hills of glacial originaligned north-to-south that have steep sides, ablunt north slope, and a gentle slope to thesouth; made of till
dune: A hill or ridge of wind-blown sand
duration of insolation: The amount of timethe sun is visible in the sky, or the number ofhours between sunrise and sunset
dynamic equilibrium: The state of balance inwhich opposing processes take place at thesame rate; a state of balance of events
Earth science: The science that applies thetools of the physical sciences to study Earth;including the solid Earth, its oceans, atmos-phere, and core, and surroundings in space
earthquake: A sudden movement of Earth’scrust that releases energy (ESRT)
eccentricity: A measure of the elongation ofan ellipse (ESRT)
eclipse: (See lunar eclipse and solar eclipse.)
ecology: The branch of science that is con-cerned with the relationships betweenorganisms and their environment
El Niño: The periodic replacement ofupwelling cold water by warm water along thewestern coast of South America
elements: The basic substances that are thebuilding blocks of matter (ESRT)
ellipse: A closed curve formed around twofixed points such that the total distance fromany point on the curve to both fixed points isconstant
epicenter: The place on Earth’s surfacedirectly above an earthquake’s focus (ESRT)
equator: An imaginary line that circles Earthhalfway between the North and South Poles(ESRT)
equilibrium: A state of balance
equinox: One of the two days each year onwhich the sun rises due east and sets duewest, on which the length of day and night areequal, on which the sun’s vertical rays are atthe equator; the first day of spring or fall
erosion: The transportation of sediments bywater, air, glaciers, or by gravity acting alone.(See also agents of erosion.) (ESRT)
erratics: Large rocks transported from onearea to another by glaciers
escarpment: A steep slope or a cliff of resis-tant rock that marks the edge of a relativelyflat area
evaporation: The change in state from liquidto gas when the temperature is below theboiling point
evolution: The gradual change in livingorganisms from generation to generation, overa long period of time
exfoliation: A type of physical weatheringcaused by expansion that breaks rock intolarge curved slabs
exponential notation: A method ofexpressing very large and very small numbersusing powers of 10
716 ● GLOSSARY

extinction: The death and disappearance ofevery individual of a particular species (ESRT)
extrusion: The movement of magma ontoEarth’s surface (ESRT)
faults: Cracks in Earth’s crust along whichmovement occurs
felsic: Describes light-colored minerals rich inaluminum or rocks made of these minerals; fel-sic rocks are rich in feldspar and quartz (ESRT)
field: A region in which a force, temperature,land elevation, or another quantity can bemeasured at any location (ESRT)
floodplain: A flat region next to a stream orriver that can be covered by water in times offlood
flotation: The method by which particles thatare too large to be carried in solution or bysuspension float on water
fluid: Any substance that can flow, usually aliquid or a gas
focus: (1) The place where rock begins to sep-arate during an earthquake, usually locatedunderground. (2) Either of the two fixed pointsthat determine the shape of an ellipse (ESRT)
fog: Very low clouds that reach the ground(ESRT)
foliation: The alignment of mineral crystals,caused by metamorphism (ESRT)
fossils: A record of prehistoric life preservedin rock (ESRT)
fracture: The way minerals break alongcurved surfaces (ESRT)
fragmental: Describes sedimentary rocks thatare composed of the weathered remains ofother rocks; clastic (ESRT)
freezing: The change in state from liquid tosolid
freezing rain: Rain that freezes on contactwith Earth’s surface
frequency: A measure of how many wavespass a given point in a given period of time
front: A boundary, or interface, between airmasses (ESRT)
frost: Ice crystals that form when water vaporcomes in contact with surfaces whose temper-ature is below 0°C
frost wedging: A form of physical weatheringcaused by repeated freezing and thawing ofwater within cracks in rocks
galaxy: A huge group of stars held together bygravity
geocentric: A model of the universe thatassumed that Earth is stationary and at thecenter of the universe
geologists: Scientists who study the materials,origin, history, and structure of Earth and howit changes
geology: The study of the rock portion ofEarth, its interior, and surface processes
geosphere: The mass of solid and moltenrock that extends more then 6000 km fromEarth’s solid surface to its center
glacier: A large mass ice that flows over landdue to gravity
global warming: A long-term increase in theaverage temperature of Earth’s atmosphere, itis the result of the increased concentration ofcarbon dioxide and other greenhouse gases inthe atmosphere
graded bedding: Within a layer of sediment,the gradual change in sediment size frombottom (large) to top (small) showing theorder in which particles settled; verticalsorting
gradient: The change in any field value perunit distance (ESRT)
gravity: The force of attraction between allobjects
GLOSSARY ● 717
greenhouse effect: The process by whichcarbon dioxide and water vapor absorb heatradiation, increasing the temperature ofEarth’s atmosphere
Greenwich Mean Time: The basis of stan-dard time throughout the world; based onmeasurements of the position of the sun inGreenwich, England
grooves: Furrows of glacial origin in bedrockthat are deeper and wider than striations
groundwater: Water that enters the groundand occupies free space in soil and sedimentas well as openings in bedrock, includingcracks and spaces between grains
hail: Pellets of ice, which grow larger as theyrepeatedly become coated with water, and arethen blown higher into cold air where thecoating of water freezes; eventually the ice pel-lets become heavy enough to fall to theground. (Hail is most common during thun-derstorms.) (ESRT)
half-life period: The time it takes for half ofthe atoms in a sample of radioactive elementto decay (ESRT)
hardness: The resistance of a mineral tobeing scratched (ESRT)
hazard: Unsafe conditions that pose a threatof property damage, injury, or loss of life
heliocentric: A model of the universe thatplaces the sun at the center of the solar system
high-pressure system: A place where cool,dry air sinks lower into the atmosphere
horizontal sorting: A decrease in the size ofsediment particles with distance from theshore, produced as a stream enters calm water
hot spot: A long-lived source of magmawithin the asthenosphere and below themoving lithospheric plates (ESRT)
humidity: The water-vapor content of air(ESRT)
hurricane: A large storm of tropical originthat has sustained winds in excess of 74 mph(120 km/h) (ESRT)
hydrologic cycle: A model that representswater movement and storage within Earth, onthe surface, and within the atmosphere
hydrosphere: Earth’s liquid water, includingoceans, surface water, and groundwater
hygrometer: An instrument used to measureatmospheric humidity
igneous rocks: Rocks that form by the solidi-fication of melted rock (ESRT)
inclusion: A fragment of one type of rock thatis enclosed in another rock
index fossils: Fossils used to establish the ageof rocks; they must be easy to recognize,found over a large geographic area, and haveexisted for a brief period of geologic time(ESRT)
inertia: The tendency of an object at rest toremain at rest or an object in motion to moveat a constant speed in a straight line unlessacted on by an unbalanced force
inference: A conclusion based on observa-tions
infiltration: The process in which watersoaks into the ground
insolation: Solar energy that reaches Earth(incoming solar radiation)
intrusion: The movement of magma to a newposition within Earth’s crust. A body of rockthat was injected into surrounding rock asmagma
island arc: A curved line of volcanic islandsthat are the result of partial melting of a tec-tonic plate where it descends beneath anotheroceanic plate
isobars: Isolines (see also) that connect loca-tions with the same atmospheric pressure on aweather map
718 ● GLOSSARY

isoline: A line on a field map that connectsplaces having the same field quantity value
isotherm: A line on a field map that connectsplaces having the same temperature
isotopes: Atoms of the same element thatcontain different numbers of neutrons in theirnucleus (ESRT)
jet streams: Wandering currents of air farabove Earth’s surface that influence the pathof weather systems (ESRT)
joule (J): Unit used to measure energy (ESRT)
Jovian planet: A planet whose composition issimilar to Jupiter’s; also know as a gas giant(ESRT)
kettle: A small closed basin formed in amoraine
lake-effect storms: Precipitation events thatoccur downwind from large lakes as the resultof moisture that enters the air over the lake;especially common as early winter snowevents
land breezes: Light winds that blow from theland to the water; they usually develop atnight as the air over the land becomes coolerthan the air over the water
landform: A feature of a landscape
landscape: A region that has landforms thatare related by similarities in shape, climate,and/or geologic setting; the general shape of alarge area of the land surface, such as plains,plateau, or mountain (ESRT)
landslide: The rapid, downslope movement ofrock and soil
latent heat: Energy absorbed or releasedwhen matter changes state (ESRT)
latitude: The angular distance north or southof the equator (ESRT)
lava: Melted rock coming from a volcano, orsuch rock that has cooled and hardened
levees: Banks along a river of natural orhuman origin
lightning: Sudden electrical discharges withinclouds, between clouds, and between cloudsand the ground that are seen as flashes oflight
light-year: The distance electromagneticenergy can travel in 1 year, approximately 6trillion mi (10 trillion km)
liquefaction: The process in which strongshaking allows water to surround the particlesof sediment, changing the sediments into amaterial with the properties of a thick fluid
lithosphere: The outermost, relatively brittlelayer of solid Earth, which includes the crustand upper mantle (ESRT)
lithospheric plate: A major section of Earth’souter solid shell that generally moves as arigid unit
logarithmic: A scale in which an increase ofone unit translates to a 10-fold increase in thequantity measured
longitude: The angular distance east or westof the prime meridian (ESRT)
longshore transport: The motion of sedi-ment parallel to the shore caused by waves
low-pressure system: A region of atmo-spheric convergence where low-density airrises, a cyclone
luminosity: The total energy output of a star;absolute brightness (ESRT)
lunar eclipse: A short-term darkening of themoon caused by the moon orbiting throughEarth’s shadow [Occurs only during the full-moon phase.]
luster: The way light is reflected and/orabsorbed by the surface of a mineral (ESRT)
mafic: Describes dark-colored minerals richin magnesium (ESRT)
magma: Hot, liquid rock within Earth (ESRT)
GLOSSARY ● 719

major axis: The distance across an ellipsemeasured at it widest point
maritime air mass: A large body of air thathas relatively high humidity because it origi-nated over the ocean or other large body ofwater (ESRT)
maritime climate: A humid climate thatoccurs over the oceans and in coastal locations
mass movement: The motion of soil or rockdown a slope without the influence of run-ning water, wind, or glaciers
meander: A curve that develops in the path ofa river when the river flows over relatively flatland
mechanical weathering: The breaking up ofrock into smaller particles without a change incomposition; physical weathering
melting: The change in state from solid toliquid (ESRT)
Mercalli scale: A scale for measuring earth-quake intensity based on the reports of peoplewho felt the quake and observed the damage itcaused
mesosphere: The layer of Earth’s atmospheredirectly above the stratosphere, in which tem-perature decreases with increasing altitude(ESRT)
metamorphic rocks: Rocks that form as aresult of heat and/or pressure on other rockscausing chemical (mineral) or physicalchanges (ESRT)
meteor: A streak of light produced as a mete-oroid burns due to friction with Earth’satmosphere
meteorite: a meteoroid (see also) that strikesEarth’s surface
meteoroid: A piece of rock that movesthrough space
meteorologist: A scientist who studies theweather
meteorology: The study of Earth’s atmo-sphere and how it changes
mid-latitude cyclone: An area of low pressureor a storm system, such as those that usuallymove eastward across the United States
mid-ocean ridges: A system of underwatermountain ranges that circles Earth like theseams on a baseball (ESRT)
Milky Way galaxy: The group of billions ofstars that includes the sun and our solarsystem, it is visible as a faint band of lightacross the night sky
mineral: A natural inorganic, crystalline solidthat has a specific range of composition andconsistent physical properties (ESRT)
model: Anything that is used to representsomething else
Moho: The boundary between Earth’s crustand mantle (ESRT)
Mohs scale: A special scale of hardness usedto identify minerals (ESRT)
monsoons: Seasonal changes in the directionof the prevailing winds, causing changes intemperature and rainfall
moraine: A deposit of unsorted glacial sedi-ment (till) pushed into place by an advancingglacier
mountain landscape: A rugged landscapethat has great relief from the top of thehighest peaks to deep valleys, commonlyunderlain by resistant rock types and distortedstructures including folds and faults
natural resources: Any material from theenvironment that is used by people
neap tides: The smallest tidal range, whichoccurs when the sun and moon are at rightangles as observed from Earth
nonrenewable resources: Resources thatexist in a fixed amount or for which the rateof regeneration is so slow that use of theseresources will decrease their availability
720 ● GLOSSARY

nuclear fusion: The process by which thenuclei of light elements, such as hydrogen,under intense heat and pressure form thenuclei of heavier elements, such as helium
oblate: Slightly flattened at the poles
observations: Information gathered throughthe use of sight, touch, taste, smell, andhearing
ocean current: Flow of ocean water, usuallyhorizontally, that transports energy and bio-logical nutrients, and can influence theclimate of nearby land areas
ocean trench: A deep-ocean location whereold lithosphere moves back into Earth’s inte-rior; also called a subduction zone or aconvergent plate boundary (see also) (ESRT)
oceanography: The study of the oceans thatcover most of Earth
ores: Rocks that are mined to obtain a sub-stance they contain of economic value
organic matter: The remains of living organ-isms in which plants can grow
origin: How something was formed
origin time: The time at which a fault shiftedto produce an earthquake (ESRT)
original horizontality: The principle that nomatter the present angle or orientation ofsedimentary rock layers, the layers were origi-nally horizontal and were tilted afterdeposition
outcrop: A place where bedrock is exposed atEarth’s surface
outgassing: The process in which bubbles ofhot gas escape from magma exposed toreduced pressure near Earth’s surface
outwash: Sorted sediments deposited bywater from a melting glacier
overland flow: The water from precipitationthat flows downhill under the influence of
gravity until it reaches a stream or seeps intothe ground; runoff
paleontology: The study of fossils
paradigm: A coherent set of principles andunderstandings
percent error: A comparison of the size of anerror with the size of the value being mea-sured (ESRT)
permeability: The ability of soil or sedimentto allow water to flow through it
phase: The observed shape of the lighted por-tion of a celestial object, for example, themoon or Venus
phases of matter: The states of matter: solid,liquid, and gas
physical weathering: The breaking up ofrock into smaller particles without a change incomposition; mechanical weathering (see also)
plains: Relatively flat landscapes, commonly atlow elevation and usually underlain by flat-lying sedimentary rocks; the range of elevationis small (ESRT)
plastic: A material that is solid under short-term stress, but flows like a liquid when stressis applied over a long period of time
plate tectonics: A theory of crustal move-ments that combines sea-floor spreading withcontinental drift (ESRT)
plateau: A rolling landscape or elevated, com-paratively flat region with modest topographicrelief (ESRT)
plutonic: Describes igneous rocks that formdeep underground (ESRT)
polar air mass: A large body of cold air thatoriginated near one of Earth’s poles (ESRT)
polar front: The boundary between two great convection cells; the most commonpath of the upper atmosphere polar jetstream. (ESRT)
GLOSSARY ● 721
polarity: The direction of a magnetic fielddetermined with an instrument such as amagnetic compass
pollution: A sufficient quantity of any mate-rial or form of energy in the environment thatharms humans or the plants and animals onwhich they depend
porosity: The ability of a material to holdwater in open spaces, or pores
precipitation: (1) The settling of solids fromsolution, often the result of the evaporation ofseawater (ESRT) (2) Water that falls to Earthas rain, show, sleet, or hail (ESRT)
prevailing winds: The most common winddirection and speed at a particular locationand time of year (ESRT)
primary waves (P-waves): Longitudinalearthquake waves that cause the ground tovibrate forward and back along the directionof travel; the earthquake waves that travel thefastest; P-waves can travel through solids, liq-uids, and gases (ESRT)
prime meridian: The north-south linethrough Greenwich, England, from whichlongitude is measured (ESRT)
profile: A cross section, of an object
psychrometer: An instrument, made up oftwo thermometers mounted side-by-side on anarrow frame, that is used to determine thedew-point temperature and relative humidity;also known as a wet- and dry-bulb ther-mometer (ESRT)
radar: A method or device that uses reflectedradio waves to locate or map distant objects orweather events; an acronym from radio detec-tion and ranging
radiation: The transfer of energy in the formof electromagnetic waves
radioactive: Describes atoms that break downspontaneously, releasing energy and/or sub-atomic particles to become different elements(ESRT)
radioisotope: An unstable isotope that breaksdown spontaneously at a predictable rate
radiometric dating: determining absolute agewith radioactive isotopes
rain: Liquid precipitation that falls quickly;precipitation droplets larger than drizzle(ESRT)
rain showers: Short periods of rain (ESRT)
redshift: A displacement of the spectral linesof very distant stars and galaxies, an increasein the wavelength of starlight caused by rapidrelative motion of the star away from theobserver (see Doppler effect)
reflection: The process by which lightbounces off a surface or material
refraction: The bending of light and otherenergy waves as they enter a substance of dif-ferent density
regional metamorphism: The process inwhich a large mass of rock is changed by heatand pressure due to large-scale movement ofEarth’s crust (ESRT)
relative age: The age of one thing comparedto the age of another
relative humidity: A comparison of theactual water-vapor content of the air with themaximum amount of water vapor the air canhold at a given temperature (ESRT)
relief: The difference in elevation from thehighest point to the lowest point on the landsurface in a specific region
renewable resources: Resources that can bereplaced by natural processes at a rate that willnot decrease their availability
residual soil: Soil that formed in place andremains there
Richter scale: A scale for measuring earth-quake magnitude based on measurementsfrom seismographs
722 ● GLOSSARY

rock: A substance that is or was a natural partof the solid Earth, or lithosphere (ESRT)
runoff: The water from precipitation thatflows downhill under the influence of gravityuntil it reaches a stream, or seeps into theground; runoff may also include stream flow
sandbar: A low ridge of sand deposited alongthe shore by currents
satellite: An object in space that revolvesaround another object as a result of gravity
saturated air: The condition in which air isholding as much moisture as it can at a par-ticular temperature
scattering: The reflection of light in manydifferent directions
science: A universal method of gathering,organizing, analyzing, and using informationabout the environment
scientific notation: (See exponential notation.)
sea breezes: Light winds that blow from thewater to the land that usually develop in thelate morning or afternoon when the landwarms; they continue into the evening untilthe land cools
sea-floor spreading: The process in whichnew lithosphere is made at the mid-oceanridges, and adds on to older material thatmoves away from the ridges on both sides
secondary waves (S-waves): Transverseearthquake waves that cause the ground tovibrate side-to-side, perpendicular to thedirection of travel; S-waves travel throughsolids, but not liquids or gases (ESRT)
sediment: The loose material created by theweathering of rock (ESRT)
sedimentary rocks: Rocks that form as aresult of the compression and cementing ofweathered rock fragments or shells of once-living animals (ESRT)
seismic moment: A scale for measuring themagnitude of an earthquake based on thetotal energy released by the earthquake
seismograph: An instrument that measuresthe magnitude of earthquakes
seismologists: Scientists who study earth-quakes
seismology: A science that deals with earth-quakes
silicate: A mineral that contains silicon andoxygen
sleet: A form of precipitation that consists ofrain drops that freeze before they reach theground; also known as ice pellets. Unlike hail,sleet does not require violent winds aloft(ESRT)
smog: A mixture of fog and air pollution par-ticles, especially smoke from the burning offossil fuels
snow showers: Short periods of snowfall(ESRT)
soil: A mixture of weathered rock and theremains of living organisms in which plantscan grow
soil horizons: The layers of a mature soil
solar eclipse: A short-term darkening of thesun caused by the moon passing in its orbitbetween Earth and the sun [Occurs onlyduring the new (dark) moon phase]
solar noon: The time at which the sunreaches its highest point in the sky
solar time: Time based on observations ofwhen the sun reach its highest point andcrosses a north-south line through the sky
solution: The method by which dissolvedsolids are carried in water
sorting: The separation of particles of sedi-ment as a result of differences in their shape,density, or size
GLOSSARY ● 723

source region: The location in which an airmass originated
species: A group of organisms so similar thatthey can breed to produce fertile offspring
specific heat: The energy needed to raise thetemperature of 1 gram of a substance 1 Cel-sius degree (ESRT)
spring: a place where groundwater flows ontothe surface of the ground
spring tides: The largest tidal range, whichoccurs when Earth, the sun, and the moon arein a line with one another (not related toEarth’s seasons)
station model: A standard format used to dis-play abbreviated weather data
strain: The elastic bending of rocks inresponse to stress
stratosphere: The layer of Earth’s atmos-phere directly above the troposphere, in whichthe temperature increases with increasing alti-tude (ESRT)
streak: The color of the powdered form of amineral (ESRT)
stream: Flowing water, such as a brook, river,or even an ocean current
stream system: All the streams that drain aparticular geographic area
stress: Force that tends to distort rock,resulting in slow bending or fracture
striations: Parallel scratches in bedrock thatwere made by rocks transported by glaciers
subduction zone: A region in which Earth’scrust is destroyed as it is pulled down into themantle (ESRT)
summer solstice: The name generally appliedto the day of the year with the longest periodof sunlight (For observers in the NorthernHemisphere, this occurs near June 21. TheNorthern Hemisphere summer solstice occurs
when the vertical rays of the sun are at theTropic of Cancer. In the Southern Hemi-sphere, the summer solstice occurs inDecember when the vertical rays of the sunare at the Tropic of Capricorn.)
superposition: The concept that, unless rocklayers have been moved, each layer is olderthan the layer above it and younger than thelayer below it
surf zone: An area on the shore that extendsfrom where the waves’ base touches the oceanbottom to the upper limit the waves reach onthe beach
suspension: How small particles that settlevery slowly are carried by water or how cloudparticles stay in the sky
tectonics: Large-scale motions of Earth’scrust that are responsible for uplift andmountain building (ESRT)
temperate climate: A moderate climate thathas large seasonal changes in temperature
temperature: A measure of the averagekinetic energy of the molecules in a substance(ESRT)
terminal moraine: Irregular, hilly deposits oftill formed where a glacier stopped advancingand began to melt back
terrestrial coordinates: Coordinates basedon Earth’s system of latitude and longitude
terrestrial planet: A rocky planet whosecomposition is similar to Earth’s (ESRT)
texture: The surface characteristics of a rockthat are the result of size, shape, and arrange-ment of mineral grains (ESRT)
thermometer: An instrument used to mea-sure temperature
thermosphere: The highest layer of Earth’satmosphere, located directly above the meso-sphere, in which temperature rises withincreasing altitude (ESRT)
724 ● GLOSSARY

thunderstorm: A rainstorm that producesthunder, lightning, strong winds, and some-times hail (ESRT)
tidal range: The difference between thelowest water level and the highest water level
tides: The twice- (or once-) daily cycle ofchange in sea level caused by the gravitationalinfluence of the moon and sun on Earth’soceans
till: Unsorted sediments deposited by a glacier
topographic map: An isoline map on whichthe isolines, called contour lines, connectplaces having the same elevation
topography: The shape of the land
tornado: A small, usually short-lived stormthat has extremely high winds (ESRT)
transform boundary: A place where twolithospheric plates move past each otherwithout creating new lithosphere ordestroying old lithosphere (ESRT)
transpiration: The process by which plantsrelease water vapor to the atmosphere, largelythrough pores in their leaves
transported soil: Soil that formed in onelocation and was moved to another location
travel time: The time between the breakingof the rocks that causes an earthquake andwhen the event is detected at a distant loca-tion (ESRT)
tributary: A stream that flows into a largerstream
Tropic of Cancer: The greatest latitude northof the equator reached by the sun’s verticalray; 23.5°N (ESRT)
Tropic of Capricorn: The greatest latitudesouth of the equator reached by the sun’s ver-tical ray; 23.5°S (ESRT)
tropical air mass: A large body of warm airthat originated close to the equator (ESRT)
troposphere: The lowest layer of Earth’satmosphere, in which temperature decreaseswith increasing altitude (ESRT)
tsunami: A series of waves caused by an earth-quake or underwater landslide that can causedamage and loss of lives in coastal locations
unconformity: A buried erosion surface thatrepresents a gap in the record of Earth’shistory
uniformitarianism: The concept that thegeological processes that took place in thepast are similar to those that occur now
urbanization: The development of heavilypopulated areas
valley glaciers: Glaciers that begin in highmountain areas and flow through valleys tolower elevations
vaporization: The change in state from liquidto gas (vapor) at any temperature (ESRT)
velocity: Speed; change in distance divided bychange in time; sometimes velocity is used toinclude both speed and direction (ESRT)
vent: A place where lava comes to the surface
vertical rays: Sunlight that strikes Earth’ssurface at an angle of 90°
vertical sorting: Within a layer of sediment,the gradual change in sediment size frombottom (large) to top (small) showing theorder in which particles settled; gradedbedding
vesicular: Rocks that contain gas pockets, orvesicles (ESRT)
volcanic: Fine-grained, extrusive igneousrocks (ESRT)
volcano: An opening in Earth’s surfacethrough which molten magma (lava) erupts
water table: The upper limit of the under-ground zone of saturation or the top surfaceon an aquifer
GLOSSARY ● 725

watershed: The geographic area drained by aparticular river or stream; drainage basin
weather: The short-term conditions ofEarth’s atmosphere at a given time and place(ESRT)
weather hazard: Weather events that gen-erate strong winds, excessive precipitation, andother hazards
weathering: The physical and chemicalchanges in rocks that occur when they areexposed to conditions at Earth’s surface
winter solstice: The name generally appliedto the day of the year with the shortest periodof sunlight (For observers in the Northern
Hemisphere, this occurs near December 22.The Northern Hemisphere winter solsticeoccurs when the vertical rays of the sun are atthe Tropic of Capricorn. In the SouthernHemisphere, the winter solstice occurs in Junewhen the vertical rays of the sun are at theTropic of Cancer.)
zenith: The point in the sky directly over anobserver’s head
zone of aeration: The part of the rock andsoil in which air fills most of the availablespaces
zone of saturation: The part of the rock andsoil where all available spaces are filled withwater
726 ● GLOSSARY

Index
• 727 •
AAbrasion, 90, 166, 167
resistance to, 169–170weathering by, 191
Absolute age, 382, 400, 401Absolute humidity, 476, 482, 483Absolute time, establishing,
395–401Absolute zero, 439, 442Absorption spectrum, 682Acid pollution, 172Acid precipitation, 172, 570Adhesion, 238Adirondack Mountains, 299
acid damage in, 571climate in, 588, 593as dome structure, 294faulting in, 295garnet mines in, 133radial drainage in, 219rocks in, 276, 425, 641scenic and recreational value
in, 289–290snow in, 271
Advisory (weather), 566Agate, 91–92, 102Age
absolute, 382, 400, 401relative, 381–382
Agents of erosion, 188–192Agriculture, ground pollution in,
156Air, 87
cooling of, 486–487Air masses, 522–524
arctic, 524codes for, 524continental, 524, 554–555maritime, 524polar, 524, 560sources regions for, 523–524symbols for, 527tropical, 524, 552, 560
Air pollution, 149–150, 158–159,570–571
Air pressure, 444–446altitude and, 496humidity, winds and, 499–500
measuring, 444–446temperature, winds and,
498–499on weather map, 537
Air temperature on weather map,536
Alaska current, 591Alaska oil pipeline, preparation
against earthquake threats,364
Aleutian Islands, 350Allegheny Plateau, 276, 296, 299Almandine garnet, 91, 133Alps, 293Altitude, 607
air pressure and, 496Aluminum, 89, 120, 148Amazon River, 216American bison, 416American Plate, 354Amethyst, 102Amphiboles, 91, 102, 115, 123,
132, 136Amplitude, 451Anchorage, Alaska, 307Andes Mountains, 350Andromeda, 696, 697Anemometer, 446, 447, 495Angle(s)
divisions of, 41–43of insolation, 454–457
Animals. See also specific by nameair-breathing, 421role of, in soil formation, 176
Annular drainage, 219Anorthosite, 641Antarctica, 274, 282Antarctic Circle, 623Anthropocene Era, 423–424Anticyclones, 525Apollo program, 639–640Appalachian Plateau, 294Aquifers, 239Archaeopteryx, 423Arches National Park, Moab,
Utah, 39Arctic air masses, 524Arctic Circle, 623Argon, 36
Arid climate, 580Armstrong, Neil, 639Asteroids, 672–673Asthenosphere, 344, 345, 348Astrology, 606–607Astronauts, 34, 661, 663Astronomy, 675
celestial objects in, 607,625–628
defined, 5–6, 606Earth’s motions in, 620–629geocentric model in, 618–619heliocentric model in, 619–620internal clock and, 608–609stars in, 628–631sun’s path across sky in,
609–618telescopes in, 685
Atacama Desert, 591Atlantic Ocean, 216, 588Atmosphere, 35, 36–38, 327, 437
carbon dioxide in, 37, 566changes in, 566–571greenhouse effect and, 461measuring water in, 476–479science of, 439storage of energy in, 470–474visibility of sun and, 458water vapor in, 474–476
Atmospheric pressure, 444, 446,496
Atoms, 87, 439structure of, 395–396
Autumn, 613–614, 623, 625Autumnal equinox, 613Avalanche, 374–375Avalanche shed, 374Axis, 41Azimuth, 60, 607
BBalance scales, 9, 14Banding, 132Bar graphs, 22Barnard’s Star, 691Barometer, 444–446Barometric pressure, 444, 446

Barometric trends on weathermap, 537–538
Barrier islands, 262Basalt, 121, 122, 124, 125, 252,
325, 502Bay of Fundy, 256Beach, 259, 262
sand on, 167source of sediment for,
259–260Bed load, 189Bedrock, 147, 166, 570
inclusions in, 366–367New York, 425–426permeability of, 234
Big bang, 700, 701Big Dipper (constellation), 44,
625, 627, 631Bigsby Pond, topographic map
of, 69Big Thompson River, flood of,
561Bioclastic rocks, 129–130Biological activity in physical
weathering, 168–169Biological evolution, 7, 414Biological productivity, 152Biology
environmental, 7evolutionary, 7, 414
Biosphere, 85Biotite, 91, 103, 115, 123, 132
crystal shape of, 98Black holes, 694Blizzards, 554–555Blue planet, Earth as, 228,
247–248Blue supergiant stars, 692Body fossils, 407, 408–409Boiling, 472Brass, 147Breccia, 127, 641Breezes
land, 504sea, 502–503
Bronx, 298Bronze, 147Brooks, 208Buffalo (animal), 416Buffalo, New York, 468Building codes, weather hazards
and, 564
CCalcite, 91, 101, 104, 115, 570
as cementing material, 126,127, 139
crystal shape of, 97, 98hardness of, 96special properties of, 100weathering of, 169, 171
Calcium, 89Calcium carbonate, 104, 171–172Caldera, 371Calendar time, 609California
climate in, 361–362geologic hazards in, 361–362
California Current, 590Cape Cod, Massachusetts, 176Capillarity, 237–238Carbon-12, 395–396, 400Carbon-14, 397, 400Carbon dioxide, 461
in the atmosphere, 37, 566greenhouse effects and, 568human-caused emissions of, 8
Carbonic acid, 171–172Cascade Mountains, 346Cassiopeia (constellation), 625,
631Castor, 625Catastrophic events, 429, 431Catskill Mountains, 274, 296,
299climate of, 593
Catskills-Allegheny Plateau, 299Celestial objects. See also specific
Earth’s motions and, 625–628position of, 607
Cellsconvection, 309, 500–501, 505,
512first, 413
Celsius scale, 441–442Cenozoic Era, 423–424Centimeters, 14Ceres, 672Chalk, 411Chemical changes, 171Chemical precipitates, 129Chemical reactions, 90, 91Chemical weathering, 171–175,
249Chemistry, 5, 6Chile, 2010 earthquake in, 364,
366
Chlorofluorocarbons (CFCs),158, 453
Chlorophyll, 130Chromosomes, 415Cinder cone volcanoes, 370Circadian rhythm, 608Classification, 118–119Clastic (fragmental) rocks,
126–129Clay, 104–105, 129, 131, 191
as cementing material, 126,127, 139
chemical weathering of, 173crystal shape of, 99landslides and, 373–374luster of, 94
Cleavage, 97–99, 116Climate, 438–439
arid, 580changes in, 578–580continental, 589defined, 580–581effect of latitude on, 582–585geographic factors affecting,
586–587, 593influence of, on landscape
development, 295maritime, 589monsoon, 590ocean currents and, 254–255polar, 580rain shadow, 587showing of, on graphs,
594–596temperate, 580
Climate shifts, 7Clocks, 9Clock time, 46
establishment of, 608–609Closed system, 137Cloud cover, 448
on weather map, 537Cloud droplets, 448–449Clouds
defined, 486formation of, 486–488
Clusters, 696Coal, 87, 115, 129–130, 138,
149–150, 155Coastlines, changes in, 259–264Coefficient, 10Cold fronts, 527–528Colorado Plateau, 185, 292Colorado River, 153, 185, 204,
214
728 ● INDEX

Color of minerals, 91–92, 116Columbia Plateau, 292Comets, 567, 673Compass directions, 59–60, 607Composite volcanoes, 370Compounds, 89Concrete, 150–151Condensation, 230–231,
472–473, 486, 487Condensation nuclei, 487–488Conduction, 308, 342, 458–459,
460, 502Conglomerate, 127–128, 139Conservation, 154–155Constellations, 44, 625–626, 627,
631Construction materials, 150–151Contact metamorphism, 135, 389Continental air masses, 524,
554–555Continental climate, 589Continental Divide, 207Continental drift, 4, 335–336Continental glaciers, 177, 185,
274–275, 282, 423Continents, movement of,
334–343Contour interval, 64, 67Contour lines, 64, 66–67Convection, 230, 308, 342–343,
459–460Convection cells, 309, 500–501,
505, 512, 585Convergence, zones of, 505Convergent boundaries, 349–350Coordinate system, 21Copernicus, 619Copper, 94, 146–147, 148, 502
as element, 88–89Coprolites, 410Coral, 115Coriolis, Gaspard-Gustave, 506Coriolis effect, 253–254,
506–509, 560, 621mid-latitude cyclones, 525wind and, 514
Correlation, 427Corundum, 93Cosmic background radiation,
700Crater Lake, 371Craters, 369Creeks, 208Crescent phase, 649
Cross-cutting relationships,387–389
Crushed stone, 150Crystalline ice, 90Crystalline sedimentary rocks,
129Crystals, 87–88
shape of, 96–97Currents
density, 253ocean, 254–255, 590–591, 621turbidity, 253
Customary system ofmeasurement, 13
Cyclones, 525mid-latitude, 525, 533–534
DDaily apparent motions, 628–629Dams, failure of, from
earthquakes, 365Darwin, Charles, 414–415Data on weather maps, 534–541Decay product, 396Decay-product ratio, 399Deep-focus earthquakes,
349–350Deforestation, 592Delaware River, flood of, 562Delta, 193, 210Dendritic drainage, 218–219Density
defined, 15determination of, 15–18erosion and, 190formula for, 16of minerals, 100
Density currents, 253Dependent variable, 21, 23Deposition, 185, 193–198, 473
defined, 193effect of particle density on,
195effect of particle shape on, 195effect of particle size on, 194by glaciers, 277–280by ice, 197–198by meltwater, 280–281running water in sorting
sediments, 195–196by wind, 196–197
Depositional features ofcoastlines, 262–264
Desert pavement, 191, 192
Desertsrocky versus sandy, 191streams in, 228
Devonian rocks, 417Dew, 473Dew point, 230, 476–479
cooling of air and, 486–487relative humidity and, 483on weather map, 536
Dew-point temperature, 476–477Diamond, 89, 93, 326
hardness of, 96Diamond anvil, 327Diatomaceous earth, 411Diatomite, 411Dinosaur National Monument,
407, 408Dinosaurs, 417, 423Directions, compass, 59–60Discharge, 216Divergence, 505Divergent boundaries, 348–349Divisions of angles, 41–43DNA, evolution and, 415–416Dolomite, 129Dolostone, 129, 294Doppler, Christian Johann, 698Doppler effect, 698Doppler radar, 495, 565Double Arch (Arches National
Park), 39Double stars, 627Doyle, Sir Arthur Conan, 380Drainage divides, 207Drainage patterns, 218–219Drizzle, 449Droughts, 563Drumlins, 279–280Dry-bulb temperature, 478–479,
483Dunes, 196–197Duration of insolation, 457–458Dust storms, 154, 487Dwarf planets, 672Dynamic equilibrium, 199, 273
EEagle Nebula, 604Early warning systems, 565–566Earth
beginning of life on, 412–413as Blue Planet, 228, 247–248changes in geography of,
353–355
INDEX ● 729

Earth (Cont’d.)chemical composition of, 35circulation of solar energy
over, 458–462core of, 327, 346crust of, 35, 148, 154, 325, 339density of, 346diameter of, 326insolation and, 453–454interior of, 117, 324–329,
344–347pressure in, 346–347temperature of, 345–346
internal energy of, 308–309magnetic field of, 60–62,
338–339magnetic poles of, 338–339mantle of, 325–327moon and, 650–652parts of, 35–40revolution of, 620rotation of, 61, 606, 620–621seasons and motion of,
622–625shape of, 1, 31–34size of, 34–35surface conditions of, 668–669temperature of, 116–117view of motion of, from space,
621–622warming of, by sun, 451–458water on, 228–231, 248
Earthquakes, 7causes of, 306–310deep-focus, 349–350defined, 307finding origin times, 316–318,
323–324as geologic hazard, 362–368locating, 318–323measurement of, 311–314plate boundaries and, 347–348preparedness for, 367–368radiation of energy from,
314–318selected historic, 365shadow zone of, 328–329subduction zone, 349as trigger for landslides, 364
Earthquake scales, 311–314Earth science
branches of, 5–6defined, 5–6reasons for studying, 7–9
relationship to other sciences,6–7
Eccentricity, 644calculating, 644–646
Eclipse, 652lunar, 32, 653, 654predicting, 653–654solar, 652–653, 654
Ecology, 6Einstein, Albert, 688Electrical energy, 151Electromagnetic energy, 460Electromagnetic radiation, 606,
689–690Electromagnetic spectrum,
682–683Electromagnetic wavelength, 685Electromagnetic waves, 451–452Electron microscopes, 87Electrons, 395Elements, 36, 88, 682. See also
specific elementsElevation, climate and, 586Ellipse, 642El Niño, 255Emergency planning, 564–565Emperor Chain of islands, 352Energy
electrical, 151electromagnetic, 460kinetic, 206, 439, 475, 648orbital, 648potential, 648solar, 151, 451, 454, 458–462storage of, in atmosphere,
470–474wind, 151
Enfield Glen, 185Engineering decisions, geologic
hazards and, 375Enhanced Fujita scale of tornado
intensity, 560Environmental awareness, 8–9Environmental biology, 7Environmental factors, effect of,
on weathering, 174–175Epicenter, 310Equator, 33–34, 41Equilibrium, 460–461
between deposition anderosion, 198–199
dynamic, 199, 273Equinox, 458, 611
autumnal, 613vernal, 612, 622
Eratosthenes, 34–35Erie Canal, 206Erie-Ontario Lowlands, 296, 299Eris, 672Erosion, 118, 412, 427
agents of, 188–192defined, 185–186equilibrium between
deposition and, 198–199glacier, 192, 275–276water, 188–191wind, 154, 191
Erratics, 277Errors in measurement, 19–20Estimation, 14–15
of density, 17Eurypterid, 421, 422Evaporation, 230, 474–475, 482
defined, 475energy supporting, 475kinetic energy and, 475rate of, 475–476
Evolutionbiological, 7, 414dinosaur, 423DNA and, 415–416organic, 7, 413–417principles of, 414–415
Evolutionary biology, 7Exfoliation, 167–168Exponential notation, 10–11Extinction, 416
mass, 422Extraterrestrial life, search for,
686–687Extrusion, 121, 389Eye of the storm, 556Eye wall, 557Eyjafjallajokull, eruption of, 373
FFahrenheit scale, 441Faults, 293, 294–295, 310Feldspar, 89–90, 94, 102, 104,
132, 136, 173crystal shape of, 98hardness of, 96
Felsic lavas, 370Felsic magma, 350Felsic minerals, 120, 350Felsic rocks, 337, 341, 369Fields, 62–64Finger Lakes, 276, 278, 289, 299,
588
730 ● INDEX

Finger Lakes region, 185, 276Fire Island, 262Flash floods, 561–562Floodplains, 209–210, 291Floods, 7, 207, 553, 561–563Flotation, 188–189Flowchart, identifying minerals
with, 105–106Fluids, 87, 459
convection in, 342–343defined, 342
Fluorite, hardness of, 96Focus, 310, 642Fog, 448, 487Folds, 293Foliation, 132, 133Food chain, 152Formula for density, 16, 57Formula for eccentricity, 644Formula for gradient, 71Fossil fuels, 149–150, 568
burning of, 172costs of, 158–159
Fossil limestone, 115Fossil mold, 409–410Fossils, 7, 126, 407–417
body, 407, 408–409comparing types of, 427–429defined, 407index, 417, 420, 427trace, 407, 410
Fossil wood, 411Foucault, Jean, 620Foucault pendulum, 620–621Fracture, 97–99Freezing, 473–474Freezing rain, 449, 554Frequency, 698Freshwater, 39, 153, 154Fronts, 526
cold, 527–528occluded, 531polar, 532–533stationary, 531–532symbols for, 527warm, 528–531
Frost, 90, 473–474Frost wedging, 166–167Full moon, 649Fusion, nuclear, 451, 689
GGabbro, 125, 252Galaxies, 694
Andromeda, 696, 697Milky Way, 695–696, 700
Galena, 93, 94crystal shape of, 98density of, 100
Galileo, 619, 667, 671Galileo thermometer, 17Galveston, Texas, hurricane
damage in, 550–551Gamma rays, 452, 685Garnet, 94, 133, 136
crystal shape of, 99Gases, 87
chlorofluorocarbon, 158greenhouse, 461natural, 149
Geiger counter, 101Gemini (constellation), 625Genesee River, 185, 290, 415Geocentric model, 618–619Geographic features, effect of, on
climate, 593Geographic Information System
(GIS), 25–26Geography, changes in Earth’s,
353–355Geological event sequencing,
381–401contact metamorphism in, 389cross-cutting relationships in,
387–389determining, 381–382establishing absolute time in,
395–401inclusions in, 386–387interpreting geologic profiles,
392–395original horizontality in,
384–386superposition in, 383–384unconformities in, 389–392uniformitarianism in, 383
Geologic factors, influence of, onlandscape development,294–295
Geologic hazards, 361–375earthquakes as, 362–368engineering decisions and, 375mass movements as, 373–375volcanoes as, 368–373
Geologic profiles, interpreting,392–395
Geologic record, 416Geologic time
Anthropocene Era in, 423–424
Cenozoic Era in, 423–424division of, 417–424
Geologic time (Cont’d.)Mesozoic Era in, 423, 431of New York State, 418–419,
424–426Paleozoic Era in, 421–422, 425Permian Period in, 425Precambrian time in, 420–421,
425Geologists, 327, 381
correlation of rock layers by,426–431
Geology, 5Geosphere, 40, 437Gibbous phase, 649Glacial ice, shrinkage of, 579Glacial moraines, 297–298Glacial striations, 274, 276Glacial till, 299Glacier National Park, 578Glaciers, 153, 197–198
continental, 177, 185,274–275, 282, 423
coverage of, New York Stateby, 270–271
defined, 192, 271–272deposition by, 277–280erosion by, 192, 275–276polar, 579–580valley, 272–273
Glaze, 92Glen Canyon, 214Global climate change,
measuring, 579Globalization, 144Global marketplace, 144–146Global Positioning System (GPS),
26, 49–50Global warming, 158–159,
568–569, 579–580Globe, 57Glomar Challenger (oceanographic
research ship), 340Gneiss, 132, 139Gold, 146, 147, 148
density of, 100as element, 88
Google Earth, 42Gorge, 185Graded bedding, 194Gradient, 71–73, 209
stream, 213Grand Canyon, 170, 185, 380
INDEX ● 731

Granite, 85, 115, 120, 122, 123,124–125, 139, 502
chemical weathering of, 173common minerals in, 86formation of, 167–168
Graphiteas element, 89special properties of, 100
Graphsbar, 22guidelines for making, 23–24line, 21, 22making and using, 20–24pie, 22, 23showing climate on, 594–596
Gravel, 150Gravity, 62, 444, 647–648
tides and, 256–257Great Bear (constellation), 626Great Bear Lake, topographic
map of, 65Great Lakes, 206, 299, 468, 501,
588Great Plains, 153, 291Great Red Spot, 670Great Salt Lake, 153, 216Greenhouse effect, 461–462,
568Greenhouse gases, 461Greenland, 274, 282Greenwich, England, Royal
Observatory in, 42Greenwich Mean Time (GMT),
46, 48, 49Greenwich meridian, 42Grooves, 274, 276Ground cover, 231Ground pollution, 156–157Groundwater, 228–229
availability of, 238–239movement of, 234–238occurrence of, in specific
zones, 232–233problems with, 239–241
Gulf of California, 310Gulf Stream, 254, 590Gypsum, 90, 129
hardness of, 96
HHail, 449–450, 552, 553Haiti, 2010 earthquake in,
363–364Half-life periods, 396
working with, 398–400Halite, 90, 115, 188
crystal shape of, 98special properties of, 100
Halley’s comet, 673Harbor Hill Moraine, 280Hardness, 95–96, 116Hawaii, Big Island of, 351, 370Hawaiian Islands, 351–352
volcanoes on, 369–370Hazards, 362
geologic, 361–375weather, 563–566
Heatlatent, 470specific, 470
Heliocentric model, 619–620Helium, 682, 683Hematite, 93Hertzsprung-Russell diagram,
690Hess, Harry, 338High-pressure systems, 505, 508Hilo, Hawaii, tsunami damage in,
366Himalaya Mountains, 293, 294,
350Hoover Dam, 214Horizontal sorting, 196Hornblende, 102, 115Hornfels, 135Hot spots, 351–352Howe Caverns, 172Hubbert, M. King, 84Hubble, Edwin, 697, 698–699Hubble Space Telescope, 604,
684Hudson Highlands, 295, 296,
298, 425Hudson-Mohawk lowlands, 205Hudson River, 214, 216, 290,
295, 296, 298, 299meaning to New York State,
205–206Hudson Valley, 298
climate of, 593Humidity, 442–444
absolute, 476, 482air pressure, winds and,
499–500describing, 524relative, 443, 472–484, 514
Hurricane Ike, 551, 558Hurricane Katrina, 212, 550, 561,
563
Hurricanes, 7, 212, 556–559, 564damage caused by, 550–551wind speed during, 495
Hydrogen, 439, 682Hydrologic cycle, 229–231, 249Hydrosphere, 35, 36, 38, 39, 327,
437chemical composition of, 35
Hygrometer, 478
IIce, 90, 271–272
deposition by, 197–198Ice ages, 281–283Icebergs, 274–275Ice caps, polar, 229Iceland, 2010 volcanic eruption
in, 373Ice sheets, 274Igneous rocks, 116–117, 118,
119, 137–138age of, 339classification of, 120–124common, 124–125
Impressions, 409–410Inclusions, 366–367Independent variables, 21, 23Index fossils, 417, 420, 427Indian-Austrian Plate, 350, 367Indian Ocean, earthquake in,
366–367Indonesia, eruption of Tambora
in, 429Inertia, 646Inference, 10, 345Infiltration, 176, 231, 232Information, scientists in
gathering and analyzing,9–15
Insolation, 453–454, 613angle of, 454–457duration of, 457–458
Intergovernmental Panel onClimate Change, 569
Internal clock, 608–609International system of
measurement, 12–14, 609Intrusions, 120, 389
igneous, 387Ionizing radiation, 101Iron, 36, 120, 125, 147–148, 171,
327, 502Iron oxide, 171, 173Island arc, 350
732 ● INDEX
Isobaric maps, 514–515Isobars, 496, 508Isoline, 62–64, 496Isoline maps, 64, 75, 76Isotherms, 62–64Isotopes
defined, 396radioactive, 395–397
JJapan, islands of, 350Jet streams, 512–514Joints, 219Jones Beach, 262Joules (J), 470Jovian planets, 666, 670–671Jupiter, 664, 665, 670
KKauai, 351, 352Kelvin scale, 442Kepler, Johannes, 619Kettle lakes, 279, 298Kettles, 278–279Kilauea, eruptions of, 351, 369Kilograms, 14Kimberlites, 326Kimberly, South Africa, 326Kinetic energy, 206, 439, 648
evaporation and, 475
LLagoons, 262Lake-effect storms, 468–469,
554, 593Lake Erie, 299, 425, 468, 588,
593Lake Meade, 214Lake Ontario, 294, 299, 425, 468,
588, 593Lake Ronkonkoma, 298Land breezes, 504Landforms, 290Landmarks, changes in natural,
164Landscapes, 290–293
factors influencingdevelopment of,294–295
mountain, 292–293in New York State, 296
Landslides, 186, 373–374earthquakes as trigger for, 364
Latent heat, 470Latitude, 41
effect of, on climate, 582–585salinity and, 250sun’s path and, 617–618
Lava, 116, 123felsic, 370
Lead, 502Legend, 67Lepus the rabbit (constellation),
625Letchworth Gorge, 185, 290, 299Levees, 212–213, 563Lichens, 169Life
atmosphere and, 567–568beginning of, on Earth,
412–413Life science, 5, 7Lightning, 552–553Light-year, 697Limestone, 115, 133, 138,
171–172, 570weathering of, 169
Limestone caverns, 172Line graphs, 21, 22Liquefaction, 364Liquids, 87Lithosphere, 35, 38, 39–40, 340,
344, 348Lithospheric plates, 341–343Local Group, 696Location, determination of,
40–50Lockport dolostone, 294, 383Lodestone, 60Logarithmic scale, 314Long Island, 240–241, 262,
297–298, 425, 501beaches on, 280–281, 289climate of, 588, 593weather history in, 564
Long Island Sound, 588Longitude, 42
finding, 46–50sun’s path and, 617
Longshore transport, 261–262Love Canal, 156Low-pressure systems, 504–505,
508–509Luminosity, 690Lunar eclipse, 32, 653, 654Lunar surface, 641–642
Luster, 93–95, 116metallic, 93–94nonmetallic, 94
Lyra the harp (constellation), 625
MMafic minerals, 120, 350Mafic rocks, 337Magma, 116, 326
felsic, 350Magnesium, 36, 89, 120,
125Magnet, Earth as a, 60–62Magnetism, 60–61Magnetite, 91
density of, 100special properties of, 100
Main sequence stars, 691–692Major axis, 644Makemake, 672Mammals, 423–424Mammoth Caves, 172Manhattan, 298Manhattan Prong, 298Mantle, 327, 328, 344Maps, 56–59
isobaric, 514–515isoline, 64, 75, 76political, 57road, 57star, 627–628topographic, 64–77weather, 62, 75
Map scale, 67–70Marble, 133–134, 172, 570Maria, 642Mariner’s sextant, 44Maritime air masses, 524Maritime climate, 589Mars, 604, 665, 669
atmosphere of, 567Mass movements, 186–187,
373–375Mastodon, 408–409Materials, specific heats of
common, 502Mathematical models, 56Matter, 439
density of, 15–18phrases of, 470states of, 470–471
Maui, 351Mauna Kea, 370Meanders, 210–212
INDEX ● 733

Measurementcustomary system of, 13errors in, 19–20metric system of, 12–14, 609
Melting, 471–472Meltwater, deposition by,
280–281Mercalli scale, 311–312, 314Mercury, 444Mercury (planet), 640, 664, 665,
666–667phases of, 667–668surface of, 462
Meridians, 42Mesosphere, 38Mesozoic Era, 423, 431Metallic luster, 93–94Metal ores, 146–148Metamorphic rocks, 117–118,
119, 138, 299formation of, 130–137
Metamorphism, 138, 412contact, 135regional, 134–135
Meteor Crater, 674, 675Meteorites, 327, 412, 675
composition of, 346Meteoroids, 675Meteorologists
in describing air masses, 522in predicting weather,
485–486, 522in tracking weather fronts,
526–527Meteorology, 5, 439Meteors, 674–675
impact of, 417Metersticks, 9Methane, 461Metric rulers, 14Metric system, 12–14Mexico, 1985 earthquake in, 363Miami, Florida, hurricane
damage in, 550Mica, 103, 104Microscopes, 9
electron, 87Mid-Atlantic Ridge, 346, 348, 354Mid-latitude cyclones, 525
evolution of, 533–534Mid-latitude temperatures,
583–584Mid-ocean ridges, 337–338, 340,
342, 348–349Milky Way galaxy, 695–696, 700
Mineral identification tests, typesof, 91
Mineralscharacteristics of, 86–88cleavage of, 97–99, 116color of, 91–92, 116common, 101–107crystal shape of, 96–97defined, 85–86, 88–90density of, 100felsic, 350fracture of, 97–99hardness of, 95–96, 116identifying, by observable
properties, 90–101identifying with a flowchart,
105–106luster of, 93–95, 116mafic, 350properties of common, 107special properties of, 100–101streak in, 92–93using, 148–149
Mississippi River, 188, 213, 216delta in, 193flooding of, 562
Mississippi Valley, 291Moab, Utah, Arches National
Park in, 39Models
defined, 56–57mathematical, 56scale, 57
Mohawk River, 299Moho, 325Mohs, Friedrich, 95Mohs scale of hardness, 95–96Molecules, 89, 439, 442Molokai, 351Monsoon climate, 590Monsoons, 511–512Moon
apparent size of, 654–655Earth and, 651–652eclipse of, 32, 653, 654exploration of, 639–640history of, 640–642lunar surface of, 641–642orbit of, around Earth,
650–651origin of, 641phases of, 648–652tides and, 257
Moraines, 277–279glacial, 297–298
Moss, 169Mountains, 118, 292–293
climate and, 586–587Mount Chimborazo, 586Mount Kilimanjaro, 586Mount Marcy, 299Mount McKinley, 293Mount St. Helens, eruption of,
350, 370–371, 372, 429Mount Vesuvius, eruption of, 177Mount Washington, 494, 495Mount Whitney, 305Mudflow, 187Muscovite, 103
crystal shape of, 98Mutations, 415
NNa-Ca feldspar, 102National Weather Service,
565–566Native copper, 89Natural disasters, 7
cost of, 550–551Natural gas, 149Natural resources, 7–8, 84,
145–146Nazca Plate, 349, 354Neap tides, 258Nebula, 628, 663, 694Nebular contraction, 662–663Neptune, 664, 665, 671, 673Neutrons, 395Neutron star, 694Newark Basin, 298New Orleans, 212
flooding in, 563New York bedrock, 425–426New York City
Central Park in, 274, 276climate of, 590determining location in, 40
New York Stateclimate in, 295coverage of, by glaciers,
270–271effect of geographic features
on climate in, 593fossils in, 409–410garnet as official mineral of,
133geologic history of, 418–419,
424–426landscapes of, 296
734 ● INDEX

meaning of Hudson River to,205–206
natural wonders in, 289–290seasonal winds in, 512stromatolites in, 412–413unconformities in, 390wind farms in, 151
New York State Thruway, 206Niagara Escarpment, 294Niagara Falls, 156, 166, 289
profile of rock layers at,383–384
Niagara River, 294Nile River delta, 193Nitric acid, 172, 570Nitrogen, 499
in atmosphere, 36Nitrogen oxides, 172Nitrous oxide, 461Nonmetallic luster, 94Nonrenewable resources
construction materials as,150–151
defined, 146–151fossil fuels as, 149–150metal ores as, 146–148using mineral resources, 148
North American Plate, 351, 362North Atlantic Current, 254North Pole, 33, 43, 61, 609North Star, 33, 43–45Notation
exponential, 10–11scientific, 10
Nuclear fusion, 451, 689Nuclear physics, 7
OOahu, 351Oblate shape, 34Observations, 2–3, 9
qualitative, 9quantitative, 9
Obsidian, 123, 125Occluded fronts, 531Ocean currents, 254, 590–591,
621climate and, 254–255
Oceanographers, 250Oceanography, 5Oceans
circulation of water in,253–255
investigating, 250–252
Ocean trenches, 341Ocean water
composition of, 248–249origin of, 248source of salt in, 249–250
Ogallala aquifer, 154Oil, 84, 149. See also PetroleumOld Man of the Mountain, 166Olivine, 89, 104, 120On the Origin of Species by Means
of Natural Selection(Darwin), 414
Onyx, 102Open clusters, 627Optical telescopes, 683–684Orbital energy, 648Orbits, describing, 642–646Ores, 146Organic evolution, 7, 413–417Organic matter, 175Organic rocks, 129–130Origin, 116Original horizontality, 384–386Origin time, finding, for
earthquakes, 316–318,323–324
Orion the hunter (constellation),625, 631
Oswego, 296Outcrop, 385, 427Outer planets, 670–671Outgassing, 566Outwash, 280Overland flow, 208, 249Oxygen, 89, 101, 102, 439, 499
for air-breathing animals, 421in Earth, 36
Ozone, 158, 421, 452–453, 567
PPacific Ocean, 153Pacific Plate, 351, 354, 362Paleontology, 407, 420Paleozoic Era, 421–422, 425Palisades, 298Pangaea, 335, 422Paradigm, 334
shift in, 334–335Parallels, 41Parkfield, California, 305Particles
effect of density, on deposition,195
effect of shape, on deposition,195
effect of size, on deposition,194
Passenger pigeons, 416Pegmatite, 123Penzias, Arno, 699–700Percent deviation, 19Percent error, 19Permeability, 231, 234–235Permian Period, 425Peru-Chile Trench, 349–350Petrified wood, 409Petroleum, 87, 149, 155Phases
of matter, 470of the moon, 648–652
Photosynthesis, 421, 453, 567, 592Phyllite, 132Physical weathering, 166–169,
174Physics, 5, 6Pie graphs, 22, 23Pitch, 698Plagioclase feldspar, 102, 115,
123, 124special properties of, 100
Plains, 291, 299Planets
dwarf, 672grouping of, 665–671outer (Jovian), 666, 670–671properties shared by, 663–665terrestrial, 665, 666–669
Plastic, 345Plateaus, 291–292Plate boundaries, 347–353
types of, 348–351Plate tectonics, 4, 334–355, 663
changes in Earth’s geography,353–355
internal structure of Earth,344–347
movement of continents in,334–343
plate boundaries in, 347–353Pleistocene Epoch, 281Pluto, 671–672Plutonic rocks, 120Polar air masses, 524, 560Polar climate, 580Polar fronts, 532–533Polar glaciers, 579–580Polar ice caps, 153, 229
INDEX ● 735
Polaris, 33, 43–45, 622, 627, 629,631
Polarity, 339, 340Polar regions, temperatures in, 584Political maps, 57Pollution
acid, 172air, 149–150, 158–159,
570–571defined, 156ground, 156–157water, 157–158, 207, 239
Pollux, 625Polychlorinated biphenyls
(PCBs), 157Ponds, 279Population growth, 145Porcelain, 94Porosity, 235–237Portage Glacier, 273Potassium, 89Potassium-40, 397Potassium feldspar, 102, 115, 123Potential energy, 648Precambrian time, 420–421, 425Precipitation, 129, 231, 448–450,
584–585acid, 172, 570forms of, 449–450, 467–469measuring, 449predicting, 485–486on weather map, 537
Pressure, Earth’s internal,346–347
Prevailing winds, 510, 589–590Primary waves, 314–315, 318,
320, 323, 328Prime meridian, 42Producers, 152Profile, 73–75Protons, 395Proxima Centauri, 697Psychrometer, 478Pumice, 123, 125Pyrite, 91, 93, 94Pyroxene, 91, 102, 120, 124, 132
QQualitative observations, 9Quantitative observations, 9Quarter moon, 649Quartz, 89, 91, 94, 97, 102, 115,
123, 132, 136chemical weathering of, 173
hardness of, 96rose, 91smoky, 91weathering of, 169
Queenston Shale, 383
RRadar, 495
Doppler, 565Radial drainage, 219Radiation, 308, 451, 502
cosmic background, 700electromagnetic, 606, 689–690of energy from earthquakes,
314–318ultraviolet, 453
Radioactive dating, 400Radioactive decay, 396–397Radioactive isotopes, 395–397
selecting best, 400–401Radioactive wastes, 156–157Radioactivity, 396Radiometric dating, 641Radio telescopes, 685, 687, 695Radio waves, 452, 686–687Rain, 449, 552. See also
Precipitationfreezing, 449, 554
Rain shadow climate, 587Rain shower, 552Ratio, 57Real-time satellite coverage, 565Recycling, 148, 155Red dwarf stars, 691–692Redshift, 697–699Reduction, 154–155Reference tables, 106Reflection, 454Refraction, 328, 453–454, 458Regional metamorphism,
134–135Relative age, 381–382Relative humidity, 443, 472–484,
514Remote sensing, 328Renewable resources, identifying
important, 151–154Replacement, 155, 409Residual soil, 177Resistance to abrasion, 169–170Resources. See also Natural
resources; Nonrenewableresources
conservation of, 154–155
Revolution, 620Rhyolite, 122, 125Richter scale, 312–313, 314Rigel, 692Ring of Fire, 371River rocks, 166, 167River system, 206–213
deltas in, 210floodplains in, 209–210levees in, 212–213meanders in, 210–212watersheds in, 206–208
Road maps, 57Rochester, 290, 296Rock cycle, 137–139, 165–166,
663Rock gypsum, 129Rocks
age of, 340–341categories of, 116–137correlation of layers, by
geologists, 426–431defined, 115felsic, 337, 341, 369igneous, 116–117, 118, 119,
137–138mafic, 337metamorphic, 117–118, 119,
138, 299river, 166, 167sedimentary, 117, 119, 138,
291Rock salt, 115, 188Rocky Mountains, 153, 204, 293Rose quartz, 91Rotation, 61, 606, 620Royal Observatory in Greenwich,
England, 42Rubidium-87, 397Running water in sorting
sediments, 195–196Runoff, 208Rusting, 171
SSaffir-Simpson scale of hurricane
intensity, 557Sagan, Carl, 36Salinity, latitude and, 250Salt, source of, in oceans,
249–250Salt water, 39, 153Saltwater invasion, 240–241
736 ● INDEX

San Andreas Fault, 305, 310,351, 354, 362
Sand, 150beach, 262shatter, 167, 168
Sandbars, 262Sandstone, 115, 128, 139
weathering of, 169San Francisco, 310
1906 earthquake in, 364Satellite, 640
determining orbit of, 646–648Saturated air, 443Saturn, 664, 665, 670Scale models, 57Scatter, 454Schist, 132Schoharie Creek, washout of
bridge over, 375Science(s)
branches of, 5defined, 2–4facts of, 2inquiry in, 26methods of, 2–3relationship of Earth science
to, 6–7Scientific notation, 10Scientists
effect of technology on workof, 25–26
in gathering and analyzinginformation, 9–15
making and using graphs,20–24
use of metric system by, 13Scoria, 123, 125Scorpio, 631Sea breezes, 502–503Seafloor spreading, 337–341Sea scorpion, 421Seasons
Earth’s motions and, 622–625path of sun and, 610–615
Secondary waves, 314–315, 318,319–320, 323, 328
Secret Caverns, 172Sediment, 117, 166, 188–189
glacial, 277source of, for beaches, 259–260
Sedimentary rocks, 117, 119,138, 291
deposition of, in layers,384–386
formation of, 126–130
Sediments, sorting of, by runningwater, 195–196
Seismic moment, 313Seismic waves, 40, 314–315, 325,
327, 344Seismographs, 312–313Seismology, 311Septic system, 239SETI (Search for Extraterrestrial
Intelligence), 686–687Sewage, 239–240Shale, 128, 131–132, 291Shatter sand, 167, 168Shield volcanoes, 370Shorelines, management of
active, 264–265Sierra Nevada Mountains, 586Silica, as cementing material,
126, 127, 139Silicate, 101Silicon, 89, 101, 102Silicon dioxide, 89Siltstone, 128Silver, 94, 146Sleet, 449, 553–554Smith, Tilly, 367Smog, 570Smoky quartz, 91Snow, 90, 231, 271, 449,
467–469lake-effect storms and,
468–469Snow shower, 554Sodium, 89Sodium chloride, 188Soil, 152–153
defined, 175formation of, 175–177residual, 177transported, 177
Soil horizons, 176Solar eclipse, 652–653, 654
annular, 655Solar energy, 151, 451, 454
circulation of, over Earth,458–462
Solar noon, 46, 47, 609Solar system
data on, 665origin of, 662–663planets in, 663–665
Solar time, 46, 47Solids, 87Solution, 188Sorting, 195–196
horizontal, 196vertical, 194
Source regions, 523–524Southern Cross (constellation),
45stars of, 34
South Pole, 33, 45, 61, 609Space
Apollo program and, 639–640colonizing, 661–662view of Earth’s motion from,
621–622Species, 414Specific heat, 470, 502Spectroscopes, 686Spirit Lake, 370Spit, 262Spring, 612, 622Springs, 228Spring sides, 257–258Starlight, 688Star maps, 627–628Stars, 687–690
birth of, 692–693blue supergiant, 692classification of, 690–692death of a massive, 693–694death of an average, 693defined, 687effect of Earth’s motions on,
628–629energy escape from, 689–690investigation of, 681–686main sequence, 691–692middle age, 693nuclear fusion in, 689red dwarf, 691–692
Staten Island, 298States of matter, 470–471
changes in state, 471–474Stationary fronts, 531–532Station model, 535Steel, 147–148
hardness of, 96Storm surges, 558, 564Storm warning, 566Storm watch, 566Strain, 309Stratosphere, 38Streak in minerals, 92–93Streak plate, 92, 96Streak test, 92Streams, 206
features of, 209–213gradient of, 213
INDEX ● 737

Streams, (Cont’d.)size of, 216–217source of water in, 227–228velocity of, 213–215
Stream system, 206Stress, 309Striations, 192Stromatolites, 412–413Subduction zones, 340–341, 342,
371earthquakes in, 349volcanoes in, 371
Submersibles, 252Subsidence, 241Sulfur, 88–89, 91Sulfuric acid, 570Sumatra, damage from tsunami
in, 366–367Summer, 613, 622–623Summer monsoon
thunderstorms, 562Summer solstice, 613Sun
apparent path of, across thesky, 609–610
apparent size of, 654–655changes of path with the
seasons, 610–615objects orbiting, 671–675path of, and observer’s
location, 617–618role of, in warming Earth,
451–458tides and, 257–258
Superclusters, 696Superposition, 383–384, 427Surface area, chemical
weathering and, 172–174Surface ocean currents, 58Surf zones, 261Suspension, 188Susquehanna River, flood of, 562
TTableland, 291Taconic Mountains, 298Talc, 94
hardness of, 96special properties of, 100
Tambora, eruption of, 429Tasmanian tiger, 416Technology, effect of, on work of
scientists, 25–26Tectonic plates, 59
Tectonics, 341Telescopes, 9
optical, 683–684radio, 685, 687, 695
Temperate climate, 580Temperature, 62, 439–442
air pressure, wind and, 498–499defined, 439describing, 524dew-point, 476–477Earth’s internal, 345–346latitude and, 582–584measuring, 439–442wet-bulb, 478–479, 483
Temperature scales, 441–442Terminal moraine, 278Terrestrial coordinates, 40–43Terrestrial planets, 665, 666–669Terrestrial winds, 584–585Texture, 120Thermometers, 9, 439–442
Galileo, 17Thermosphere, 38Thunder, 552Thunderstorms, 552–554Tidal range, 255–256Tides
causes of, 255–259gravity and, 256–257moon and, 257sun and, 257–258
Till, 277, 280glacial, 299
Time zones, 46–47, 48Tin, 147Topaz, 93Topographic maps, 64–77
common features of, 66–71Topographic profiles, 73–75Topography, 66Tornadoes, 7, 559–561, 566
wind speed in, 495Toxic chemicals, 156Trace fossils, 407, 410Transform boundaries, 350–351Transpiration, 230, 475, 592Transplanted soil, 177Travel time, 318Trenches, 252Tributary, 208Trilobites, 417, 422Tropical air masses, 524, 552,
560Tropic of Cancer, 583, 609, 623
Tropic of Capricorn, 583, 609,623
Tropics, temperature in, 582–584Troposphere, 37–38, 552
chemical composition of, 35Tsunami, 366–367Tug Hill Plateau, 299, 468Tully Valley, landslide in,
373–374Turbidity currents, 253Twain, Mark, 521
UUltraviolet radiation, 453Unconformities, 389–392Uniformitarianism, 383, 427United Nations, 569United States Geological Survey
(USGS), 66topographic maps, 64
Universefuture of, 700–702history of, 696–700structure of, 694–696
Uplift, 118, 134, 168Uranium, 396Uranium-235, 396Uranium-238, 396, 397Uranus, 665, 671Urban heat islands, 592–593Urbanization, 592Ursa Major (constellation), 626,
631Ursa Minor (constellation), 631U-shaped valleys, 276, 290Utah Slot Canyons, 185
VValdez, Alaska, 307Valley glaciers, 272–273Valley Heads Moraine, 278Valleys, 275–276
U-shaped, 276, 290V-shaped, 209, 210, 275
Vaporization, 472Vapor trails, 488Variables
dependent, 21, 23independent, 21, 23
Vegetation, 592Velocity, stream, 213–215Ventifacts, 191, 369Venus, 640, 664, 665, 667
738 ● INDEX

atmosphere of, 567phases of, 667–668surface of, 462
Vernal equinox, 612, 622Vertical ray, 622Vertical sorting, 194Vesicles, 122–123Vesicular texture, 122Visibility on weather map, 536Volcanic glass, 123, 125Volcanic rocks, 121
weathering of, 177Volcanoes, 118, 177, 368–373.
See also specific by namedefined, 368eruptions of, 7, 177, 350, 351,
369, 370–371, 372, 373,417, 429, 487, 566
in Hawaii, 351as hazards, 371–373mafic, 350types of, 369–371
Vollmer, Frederick, 6V-shaped valleys, 209, 210, 275
WWallace, Alfred Russel, 414Warm fronts, 528–531Water, 153–154
in carrying excess heat energy,470–471
climate and large bodies of,588–589
density of, 17on Earth, 228–231, 248erosion by, 188–191in hydrosphere, 36measuring, in atmosphere,
476–479properties of, 473sources of, 475–476in streams, 227–228
Water cycle, 229–231Water pollution, 157–158, 207,
239Watersheds, 206–208Water table, 232–233
Watertown, 296Water vapor, 37, 123, 248,
442–444, 461, 500entrance into atmosphere,
474–476Watkins Glen, 185, 186Wavelength, 451–452Waves, 260Weather
defined, 438elements of, 438–450on weather map, 536
Weather events, hazards posedby, 551–563
Weather forecasting, 521–522Weather fronts, 526–527Weather hazards, protection
from, 563–566Weather history, identifying
area’s, 564Weathering, 118, 152–153, 166
by abrasion, 191chemical, 171–175, 249effect of environment on,
174–175mechanical, 166physical, 166–169, 174reasons for, 165–166of volcanic rocks, 177
Weather instruments, placementof, 450
Weather maps, 62, 75data shown on, 534–539drawing, 541–543gathering data for, 539–541in making predictions,
543–544symbols on, 535
Wegener, Alfred, 4, 335–336, 337,338
Weight, 647Wet-bulb temperature, 478–479,
483Whirlpool Sandstone, 384Willamette Meteorite, 675Wilson, J. Tuzo, 341Wilson, Robert, 699–700Wind, 446–447
causes of, 496–500deposition by, 196–197direction of, on weather map,
536humidity, air pressure and,
499–500local, 500–504measuring, 446–447prevailing, 510, 589–590rate of evaporation and, 476regional, 504–515speed of, 494–495speed of, on weather map,
536–537temperature, air pressure and,
498–499terrestrial, 584–585
Wind erosion, 154, 191Wind vane, 446Winter, 614–615, 623, 625Winter solstice, 614Wood, 152, 155
fossil, 411petrified, 409
XX-rays, 452, 685
YYearly apparent motions, 631Yellowstone National Park, 308
ZZenith, 607Zero, absolute, 439, 442Zinc, 147Zone
of aeration, 232of convergence, 505of saturation, 232of subduction, 252
Zoning, weather hazards and, 564
INDEX ● 739

• 740 •
Photo Credits
All Photographs, except those listed below were provided courtesy of the author,Thomas McGuire.
Unit 1, Earth from space, courtesy of NASA; Figure 1-3, Geologist, courtesy orDr. Frederick Vollmer, State University of New York, New Paltz; Figure 2-6,Man using sextant, courtesy of Dominique Prinet, by Des Ramsay; Figures 3-8, 3-11, 3-Q1, courtesy of USGS; Figure 5-1, Geologist on lava, courtesy ofMonica Buckner; Figure 6-4, Average daily solar insolation, courtesy of projectsol.aps.com/solar/data_insolation.asp; Figure 6-Q8, Image of New York City,courtesy of NASA/GSFC/ METI/ERSDAC/JAROS, and U.S./Japan ASTER Science Team; Figure 8-9, Adapted from NASA images; Figure 11-Q19,Beach damage, courtesy of USGS; Figure 15-1, Old map, Public Domain; Fig-ure 16-1, US Seismic Hazard Regions, based on USGS on-line publicationhttp://pubs.usgs.gov/fs/ 2003/fs017-03; Figure 16-2, Destruction in Sumatracaused by a tsunami, U.S. Navy Photo, Photographer’s Mate 2nd Class Phillip A.McDaniel; Figure 16-4, Mount St. Helens, Washington, 1980 eruption, cour-tesy of USGS, Joseph Rosenbaum; Figure 18-5 (r.), Stromatolites in Shark BayAustralia, Dr. J. Richard Kyle, University of Texas at Austin; Figure 19-7,Anemometer, courtesy of U.S. Department of Energy’s Atmospheric RadiationMeasurement Program; Figure 19-10, Weather station, courtesy of NOAA;Figure 19-14, Earth’s energy budget, image courtesy of NASA’s ERBE (EarthRadiation Budget Experiment) program; Figure 20-1, Average seasonal snow-fall in Western NYS, courtesy NOAA; Figure 21-1, Isobaric map, modified from NOAA data map; Figure 21-11, Northern and Southern Hemisphere hur-ricanes, based on NASA hurricane images; Figure 22-1, Air mass sourcesadapted from NASA image; Figure 22-Q4, Weather map adapted from NOAAimage; Figure 22-Q10, Weather map of the Northeast, courtesy of NOAA; Fig-ure 23-1, 1900 Galveston hurricane damage, courtesy NOAA; Figure 23-7,Tornado, courtesy of NOAA; Figure 23-11, Graph of Mauna Loa MonthlyMean Carbon Dioxide, courtesy of NOAA; Figure 23-Q6, Saffir-Simpson Hur-ricane Scale, courtesy of NOAA; graphic Design by R.L. Sheperd; Figure 23-Q9, Map showing Number of Billion Dollar Natural Disasters by state,1980–2009, courtesy of NOAA; Figure 24-1, Graph of mean temperature 1000to 2010, Public Domain; Figure 24-4, Climate regions adapted from NOAAmap; Unit 8, Eagle Nebula, courtesy of NASA; Figure 25-Q15, Graph of thealtitude of the sun at local noon, Cornel University; Figure 26-1, AstronautJohn W. Young on the moon, courtesy of NASA; Figure 26-5, Phases of themoon, courtesy of U.S, Naval Observatory; Figure 27-4, Saturn, courtesy ofNASA; Figure 27-5, Comet of 1882, Public Domain; Figure 28-1, White lightpassing through a prism © Adam Hart-Davis; Figure 28-2 (r.), Hubble SpaceTelescope, courtesy of NASA; Figure 28-6, Spiral galaxy NCG 4414, courtesyof NASA; Figure 28-7, Summer Milky Way, courtesy Jens Hackman,http://www.kopfgeist.com