chapter 2* - strategies for water quality assessmentchapter 2* - strategies for water quality...
TRANSCRIPT

Water Quality Assessments - A Guide to Use of Biota, Sediments and Water in Environmental Monitoring - Second Edition Edited by Deborah Chapman © 1992, 1996 UNESCO/WHO/UNEP ISBN 0 419 21590 5 (HB) 0 419 21600 6 (PB)
Chapter 2* - Strategies for water quality assessment
*This chapter was prepared by M. Meybeck, V. Kimstach and R. Helmer
2.1. Introduction
The operations involved in water quality assessment are many and complex. They can be compared to a chain of about a dozen links and the failure of any one of them can weaken the whole assessment. It is imperative that the design of these operations must take into account the precise objectives of the water quality assessment. During the 1950s, in the early days of modern water quality monitoring, activities were rarely focused on particular issues. However, the water quality assessment process has now evolved into a set of sophisticated monitoring activities including the use of water chemistry, particulate material and aquatic biota (e.g. Hirsch et al., 1988). Many manuals on water quality monitoring methods already exist (e.g. Alabaster, 1977; UNESCO/WHO, 1978; Krenkel and Novotny, 1980; Sanders et al., 1983; Barcelona et al., 1985; WMO, 1988; Yasuno and Whitton, 1988; WHO, 1992) although most of these consider only one type of water body (i.e. rivers, lakes or groundwaters) or one approach to monitoring (e.g. chemical or biological methods). Few manuals exist which consider all water bodies (e.g. Hem, 1989). This guidebook presents the combined use of water, particulate matter and biological monitoring in order to produce comprehensive water quality assessments for the principal types of freshwater bodies. However, economic constraints frequently mean that the variables to be monitored, and the methods to be used, must be chosen carefully to ensure water quality assessment objectives are met as efficiently as possible.
2.2. The water quality assessment process
As defined in Chapter 1, water quality assessment is the overall process of evaluation of the physical, chemical and biological nature of the water, whereas water quality monitoring is the collection of the relevant information. This guidebook concentrates on the whole assessment process, in different types of water bodies. The details of monitoring methods and approaches which can be applied in the field are given in the practical handbook by Bartram and Ballance (1996).
2.2.1. Monitoring, survey and surveillance
The main reason for the assessment of the quality of the aquatic environment has been, traditionally, the need to verify whether the observed water quality is suitable for
intended uses. The use of monitoring has also evolved to help determine trends in the quality of the aquatic environment and how that quality is affected by the release of contaminants, other anthropogenic activities, and/or by waste treatment operations (impact monitoring). More recently monitoring has been carried out to estimate nutrient or pollutant fluxes discharged by rivers or groundwaters to lakes and oceans, or across international boundaries. Monitoring to determine the background quality of the aquatic environment is also now widely carried out, as it provides a means of comparison with impact monitoring. It is also used simply to check whether any unexpected change is occurring in otherwise pristine conditions, for example, through the long range transport of atmospheric pollutants (note, however, that natural water quality is very variable depending on local conditions).
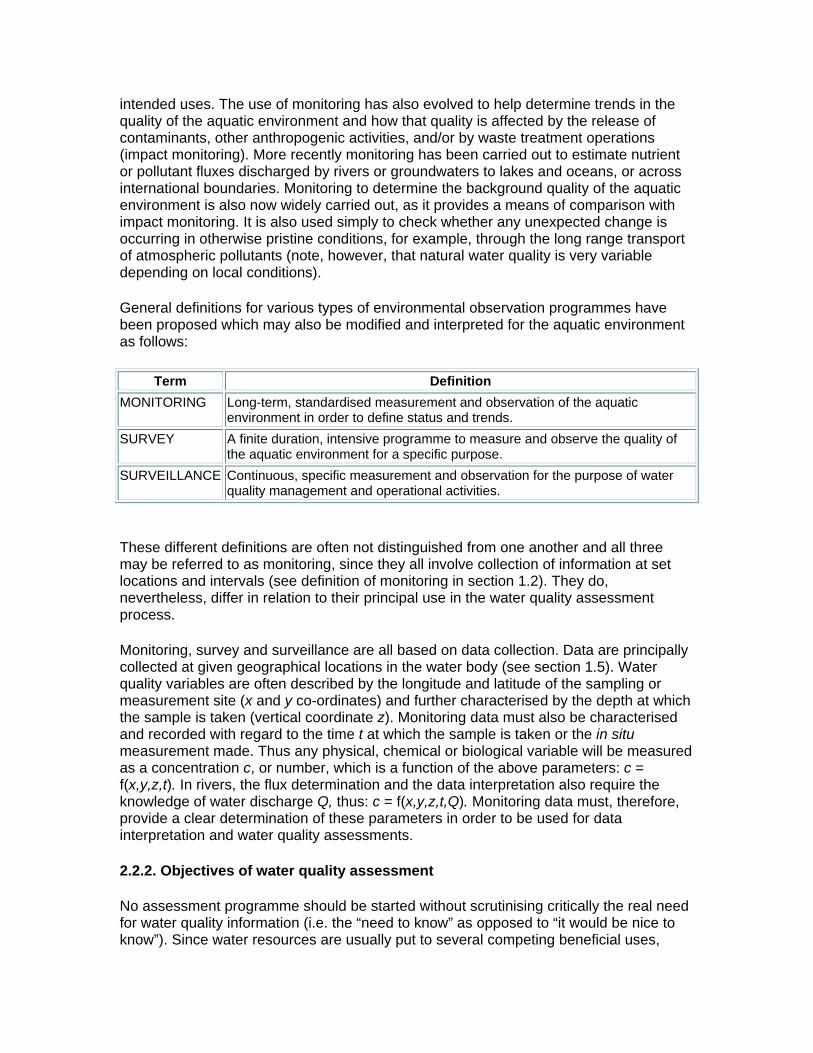
General definitions for various types of environmental observation programmes have been proposed which may also be modified and interpreted for the aquatic environment as follows:
Term Definition MONITORING Long-term, standardised measurement and observation of the aquatic
environment in order to define status and trends. SURVEY A finite duration, intensive programme to measure and observe the quality of
the aquatic environment for a specific purpose. SURVEILLANCE Continuous, specific measurement and observation for the purpose of water
quality management and operational activities.
These different definitions are often not distinguished from one another and all three may be referred to as monitoring, since they all involve collection of information at set locations and intervals (see definition of monitoring in section 1.2). They do, nevertheless, differ in relation to their principal use in the water quality assessment process.
Monitoring, survey and surveillance are all based on data collection. Data are principally collected at given geographical locations in the water body (see section 1.5). Water quality variables are often described by the longitude and latitude of the sampling or measurement site (x and y co-ordinates) and further characterised by the depth at which the sample is taken (vertical coordinate z). Monitoring data must also be characterised and recorded with regard to the time t at which the sample is taken or the in situ measurement made. Thus any physical, chemical or biological variable will be measured as a concentration c, or number, which is a function of the above parameters: c = f(x,y,z,t). In rivers, the flux determination and the data interpretation also require the knowledge of water discharge Q, thus: c = f(x,y,z,t,Q). Monitoring data must, therefore, provide a clear determination of these parameters in order to be used for data interpretation and water quality assessments.
2.2.2. Objectives of water quality assessment
No assessment programme should be started without scrutinising critically the real need for water quality information (i.e. the “need to know” as opposed to “it would be nice to know”). Since water resources are usually put to several competing beneficial uses,

monitoring which is used to acquire necessary information should reflect the data needs of the various users involved (Helmer, 1994). Consequently, there are two different types of monitoring programmes, depending on how many assessment objectives have to be met:
• Single-objective monitoring which may be set up to address one problem area only. This involves a simple set of variables, such as: pH, alkalinity and some cations for acid rain; nutrients and chlorophyll pigments for eutrophication; various nitrogenous compounds for nitrate pollution; or sodium, calcium, chloride and a few other elements for irrigation.
• Multi-objective monitoring which may cover various water uses and provide data for more than one assessment programme, such as drinking water supply, industrial manufacturing, fisheries or aquatic life, thereby involving a large set of variables. The Commission of the European Communities has a list in excess of 100 micropollutants to be considered in drinking water alone.
The implementation of the assessment programme objectives may focus on the spatial distribution of quality (high station number), on trends (high sampling frequency), or on pollutants (in-depth inventories). Full coverage of all three requirements is virtually impossible, or very costly. Consequently preliminary surveys are necessary in order to determine the necessary focus of an operational programme. Table 2.1 summarises the existing types of water quality operations in relation to their main objectives.
The process of determining objectives should start with an in-depth investigation of all factors and activities which exert an influence, directly or indirectly, on water quality. Inventories have to be prepared on:
• the geographical features of the area, including: topography, relief, lithology, pedology, climate, land-use, hydrogeology, hydrology etc.,
• water uses, including: dams, canals, water withdrawal for cities and industries, agricultural activities, navigation, recreation, fisheries, etc., and
• pollution sources (present and expected), including: domestic, industrial and agricultural, as well as their stage of pollution control and waste treatment facilities.
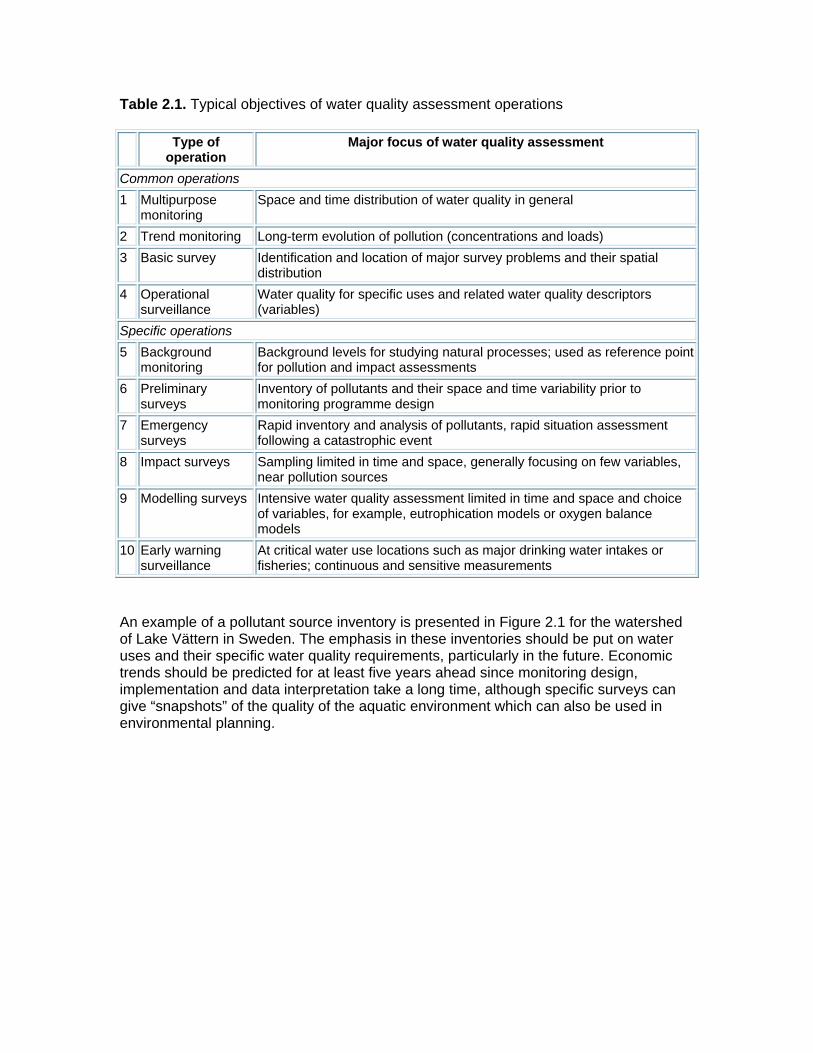
Table 2.1. Typical objectives of water quality assessment operations Type of
operation Major focus of water quality assessment
Common operations 1 Multipurpose
monitoring Space and time distribution of water quality in general
2 Trend monitoring Long-term evolution of pollution (concentrations and loads) 3 Basic survey Identification and location of major survey problems and their spatial
distribution 4 Operational
surveillance Water quality for specific uses and related water quality descriptors (variables)
Specific operations 5 Background
monitoring Background levels for studying natural processes; used as reference point for pollution and impact assessments
6 Preliminary surveys
Inventory of pollutants and their space and time variability prior to monitoring programme design
7 Emergency surveys
Rapid inventory and analysis of pollutants, rapid situation assessment following a catastrophic event
8 Impact surveys Sampling limited in time and space, generally focusing on few variables, near pollution sources
9 Modelling surveys Intensive water quality assessment limited in time and space and choice of variables, for example, eutrophication models or oxygen balance models
10 Early warning surveillance
At critical water use locations such as major drinking water intakes or fisheries; continuous and sensitive measurements
An example of a pollutant source inventory is presented in Figure 2.1 for the watershed of Lake Vättern in Sweden. The emphasis in these inventories should be put on water uses and their specific water quality requirements, particularly in the future. Economic trends should be predicted for at least five years ahead since monitoring design, implementation and data interpretation take a long time, although specific surveys can give “snapshots” of the quality of the aquatic environment which can also be used in environmental planning.

Figure 2.1. A pollutant source inventory for the Lake Vättern basin, Sweden (After Hakanson, 1977)
In addition to the above investigations, preliminary water quality surveys may be carried out for the following specific purposes:
• to determine the time and space variability of the quality of the aquatic environment in order to select sampling stations and frequencies,
• to determine the key descriptors to be considered, and
• to assess the feasibility and cost of a monitoring programme.
It cannot be over-emphasised that the benefits for an optimal monitoring operation, drawn from careful preliminary planning and investigation, by far outweigh the efforts spent during this initial phase. Mistakes and over-sights during this part of the programme may lead to costly deficiencies, or overspending, during many years of routine monitoring!
2.2.3. Elements of water quality assessment
The possible types of water quality assessment programmes are numerous. These should be designed or adopted according to objectives set on the basis of environmental

conditions, water uses (actual and future), water legislation, etc. Once the objectives have been set, a review of existing water quality data, sometimes supported by preliminary surveys, determines the monitoring design. Following the implementation of the various assessment activities an important step which is often underestimated, if not omitted, is data interpretation. This should be followed by recommendations to relevant water authorities for water management, water pollution control, and eventually the adjustment or modification of monitoring activities.
There are certain standard elements which are common to all water quality assessment programmes. They are more, or less, extensively developed depending on the type of assessment required. The generalised structure of a water quality assessment programme is given in Figure 2.2 and described below:
The key elements of an assessment programme
1. Objectives These should take into account the hydrological factors, the water uses, the economic development, the legislative policies etc. Necessary decisions involve whether the emphasis should be put on concentrations or loads, or spatial or time distributions, and the most appropriate monitoring media.
2. Preliminary surveys
These are short-term, limited activities to determine the water quality variability, the type of monitoring media and pollutants to be considered, and the technical and financial feasibility of a complete monitoring programme.
3. Monitoring design This includes the selection of types of pollutants, station location, sampling
frequency, sampling apparatus, etc. 4. Field monitoring operations
These include in situ measurements, sampling of appropriate media (water, biota, particulate matter), sample pretreatment and conservation, identification and shipment.
5. Hydrological monitoring
This includes water discharge measurements, water levels, thermal profiles, etc., and should always be related to the water quality assessment activities.
6. Laboratory activities
These include concentration measurements, biological determinations, etc.
7. Data quality control This must be undertaken by using analytical quality assurance within each
laboratory, and amongst all laboratories participating in the same programme, and by checking field operations and hydrological data.
8. Data storage treatment and reporting
This is now widely computerised and involves the use of databases, statistical analysis, trend determinations, multi-factorial correlation, etc., and presentation and dissemination of results in appropriate forms (graphs, tabulated data, data diskettes, etc.).
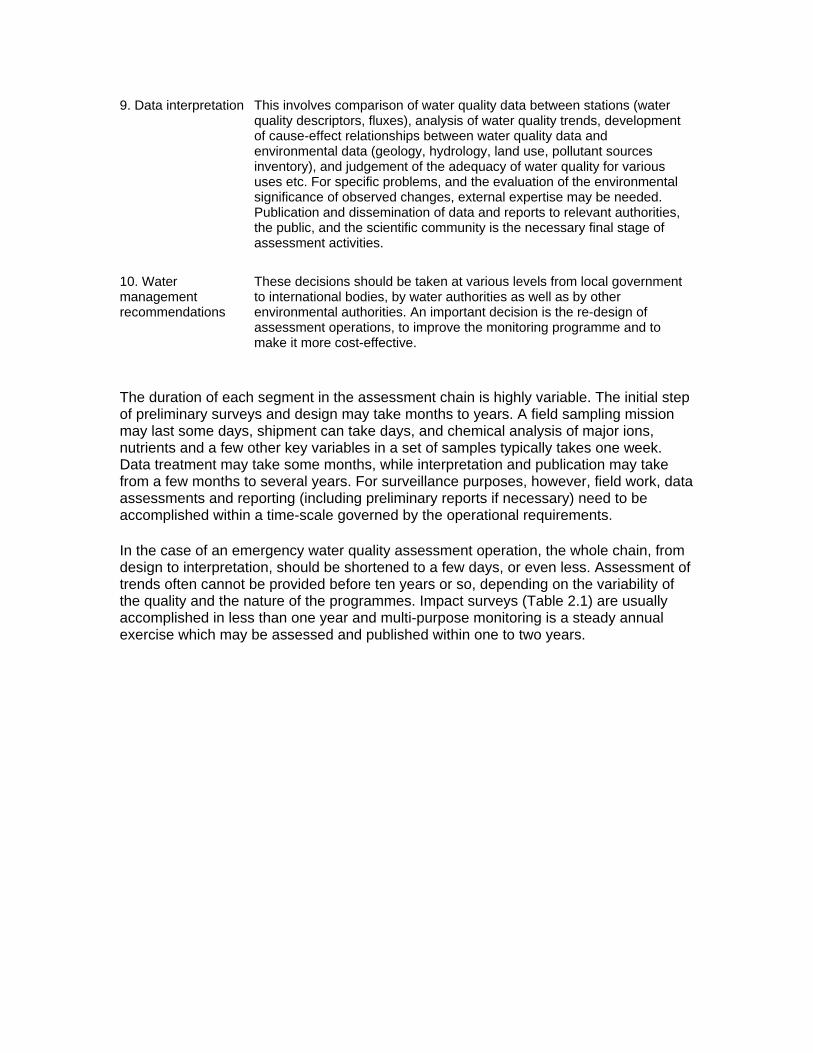
9. Data interpretation This involves comparison of water quality data between stations (water quality descriptors, fluxes), analysis of water quality trends, development of cause-effect relationships between water quality data and environmental data (geology, hydrology, land use, pollutant sources inventory), and judgement of the adequacy of water quality for various uses etc. For specific problems, and the evaluation of the environmental significance of observed changes, external expertise may be needed. Publication and dissemination of data and reports to relevant authorities, the public, and the scientific community is the necessary final stage of assessment activities.
10. Water management recommendations
These decisions should be taken at various levels from local government to international bodies, by water authorities as well as by other environmental authorities. An important decision is the re-design of assessment operations, to improve the monitoring programme and to make it more cost-effective.
The duration of each segment in the assessment chain is highly variable. The initial step of preliminary surveys and design may take months to years. A field sampling mission may last some days, shipment can take days, and chemical analysis of major ions, nutrients and a few other key variables in a set of samples typically takes one week. Data treatment may take some months, while interpretation and publication may take from a few months to several years. For surveillance purposes, however, field work, data assessments and reporting (including preliminary reports if necessary) need to be accomplished within a time-scale governed by the operational requirements.
In the case of an emergency water quality assessment operation, the whole chain, from design to interpretation, should be shortened to a few days, or even less. Assessment of trends often cannot be provided before ten years or so, depending on the variability of the quality and the nature of the programmes. Impact surveys (Table 2.1) are usually accomplished in less than one year and multi-purpose monitoring is a steady annual exercise which may be assessed and published within one to two years.
Figure 2.2. The structure of water quality assessment operations
2.2.4. Levels of water quality assessment
Experience shows that it is not easy to choose the optimum level of assessment needed to generate precisely the data required for specific purposes and objectives. Most of the time, assessment is achieved principally through monitoring activities (i.e. long-term standardised measurement and observation). The monitoring phase must generate the data which are essential for meaningful interpretation and management decisions, but must not lead to a vast collection of unnecessary data which are costly to obtain, but do not contribute to the required understanding of water quality. Furthermore, monitoring activities, by necessity, must be commensurate with the socio-economic and technical and scientific development of the country. For example, some water quality variables (e.g. organic micropollutants and trace elements) require highly trained technicians and costly laboratory facilities. In a simplified manner, it is possible to distinguish three levels:
• Simple monitoring based on a limited number of samples, simple analyses or observations, and data treatment which can be performed by pocket calculator.
• Intermediate-level monitoring requiring some specific laboratory facilities and more financial support to increase the number of stations, samples, analytical variables, etc. Personal computers (PCs) are recommended for processing data.
• Advanced-level monitoring involving sophisticated techniques and highly trained technicians and engineers. The analytical facilities can perform any pollutant determination required, with an increasing number of variables per sample, and of samples taken. Large computer data storage and handling facilities, such as a mainframe computer, are required for data treatment.
All elements of assessment, from objective setting to data interpretation, will be related to these three levels. The ultimate aim is to promote monitoring operations from the basic level to the more elaborate ones, in accordance with increasing complexity of water quality problems and the capabilities to perform scientific programmes. The above three monitoring levels will be referred to throughout this guidebook.
2.3. Typical water quality monitoring programmes
In principle, there could be as many types of monitoring programmes as there are objectives, water bodies, pollutants and water uses, as well as any combination thereof. In practice, assessments are limited to about ten different types of operations which are summarised in Tables 2.1 and 2.2, giving details of the different types of monitoring operations. It should be noted that, in the past, many countries or water authorities have installed multi-purpose or multi-objective monitoring programmes without conducting the necessary preliminary surveys which are considered necessary. Critical scrutiny of results after several years of operation has led to a second generation of programmes with more differentiated objectives such as impact assessment, trend analysis or operational management decisions.
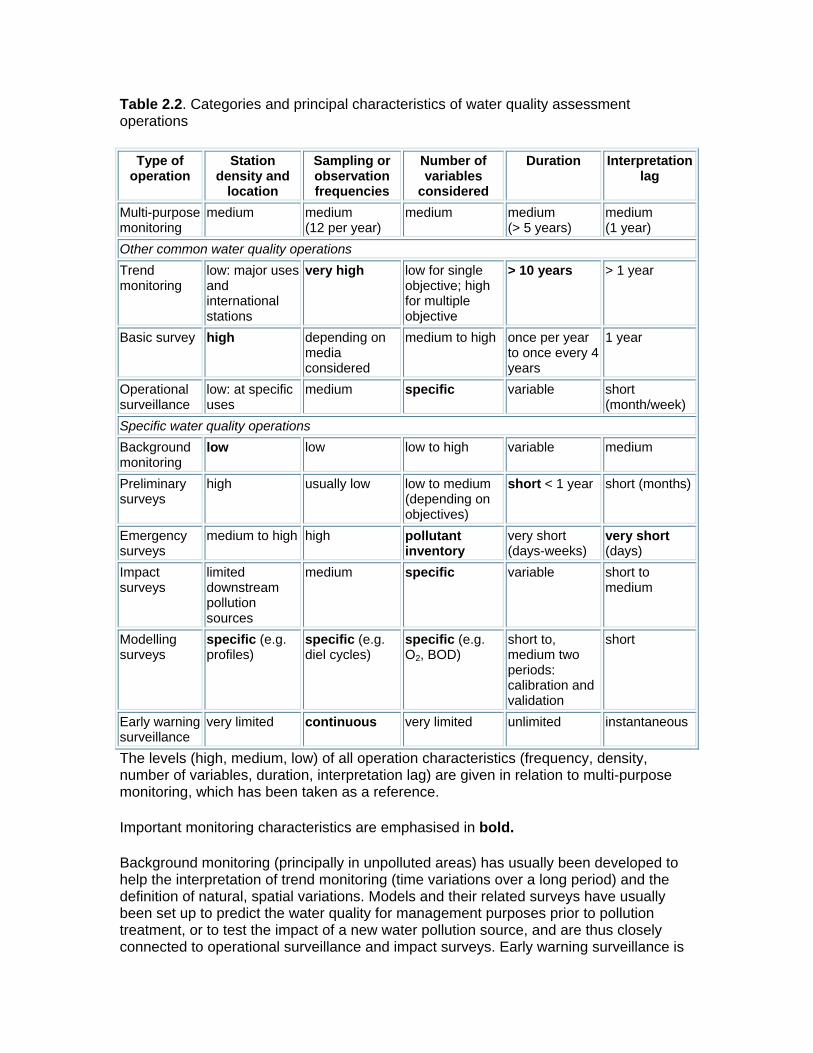
Table 2.2. Categories and principal characteristics of water quality assessment operations
Type of operation
Station density and
location
Sampling or observation frequencies
Number of variables
considered
Duration Interpretation lag
Multi-purpose monitoring
medium medium (12 per year)
medium medium (> 5 years)
medium (1 year)
Other common water quality operations Trend monitoring
low: major uses and international stations
very high low for single objective; high for multiple objective
> 10 years > 1 year
Basic survey high depending on media considered
medium to high once per year to once every 4 years
1 year
Operational surveillance
low: at specific uses
medium specific variable short (month/week)
Specific water quality operations Background monitoring
low low low to high variable medium
Preliminary surveys
high usually low low to medium (depending on objectives)
short < 1 year short (months)
Emergency surveys
medium to high high pollutant inventory
very short (days-weeks)
very short (days)
Impact surveys
limited downstream pollution sources
medium specific variable short to medium
Modelling surveys
specific (e.g. profiles)
specific (e.g. diel cycles)
specific (e.g. O2, BOD)
short to, medium two periods: calibration and validation
short
Early warning surveillance
very limited continuous very limited unlimited instantaneous
The levels (high, medium, low) of all operation characteristics (frequency, density, number of variables, duration, interpretation lag) are given in relation to multi-purpose monitoring, which has been taken as a reference.
Important monitoring characteristics are emphasised in bold.
Background monitoring (principally in unpolluted areas) has usually been developed to help the interpretation of trend monitoring (time variations over a long period) and the definition of natural, spatial variations. Models and their related surveys have usually been set up to predict the water quality for management purposes prior to pollution treatment, or to test the impact of a new water pollution source, and are thus closely connected to operational surveillance and impact surveys. Early warning surveillance is
undertaken for specific uses in the event of any sudden and unpredictable change in water quality, whereas emergency surveys of a catastrophic event should be followed in the medium and long-term by impact surveys. For practical reasons, several types of regular monitoring are often combined and some sampling stations will belong to several programmes.
Multi-dimensional approaches to water quality assessment have become an inevitable necessity. About a hundred years ago the quality of the aquatic environment was defined by a few analyses of water, but this definition has now reached a level of complexity which requires simultaneous consideration of multiple aspects. One dimension concerns physico-chemical variables, such as nitrates, chromium and polyaromatic hydrocarbons, another concerns guidelines and criteria for given water uses and another concerns different monitoring media (water, suspended or deposited sediments, colloids, whole organisms, selected biological tissues). Different aquatic environments (streams, rivers, wetlands, lakes, reservoirs, all types of groundwaters) react differently to pollution with different temporal (from minutes to years) and spatial (vertical, transverse, longitudinal, upstream/downstream) scales of variability. In addition, aquatic organisms have to be considered, from bacteria to mammals, including various types of biological features, such as community structure or bioassays.
In reality, water quality is never considered in all its dimensions. In most cases the assessment approach is determined by the perceived importance of the aquatic environment, on the objectives of the operation and on the human and financial resources available. For example, lake eutrophication is mostly considered through nutrient analysis, biomass estimates by means of chlorophyll measurements, dissolved oxygen profiles, and a few indicator species of phytoplankton (see Chapters 7 and 8).
Monitoring activities are also greatly dependent on the level of deterioration of the aquatic environment. At each stage there is a specific type of monitoring as described in Table 2.1. Background monitoring determines the natural concentrations and verifies that xenobiotic organic substances were not found at that stage. Specific monitoring of early change is required to assess the subtle changes that characterise anthropogenic impacts. The fundamental question at this stage is what forthcoming issues should be considered within basic monitoring which is routinely performed on all water bodies. Often, water quality issues are studied by explanatory and/or predictive models, which need intensive, specific monitoring and which are necessary for defining the basis for mitigating measures and regulations. Once the issue is more fully understood, environmental impact assessments can be focused on the issue until control measures are successful. If they are not successful, water quality degradation becomes a major concern and early warning monitoring might have to be installed. This type of monitoring is often used at drinking water intakes to warn of upstream, accidental pollution events.
2.4. Design of assessment programmes
Once the objectives have been clearly identified, four steps are essential in the good design of an assessment programme: (i) the selection of the appropriate media to sample, (ii) the determination of water quality variability through preliminary surveys, (iii) the integration of hydrological and water quality monitoring, and (iv) the periodic review and modification of the design of the programme.
2.4.1. Selection of media to sample
Three principal media can be used for aquatic monitoring: water, particulate matter and living organisms. The quality of water and particulate matter is estimated through physical and chemical analysis. Biological quality can be determined through: (i) specific ecological surveys (e.g. invertebrate species or bacterial counts) which can lead to the elaboration of biotic indices, (ii) specific bioassays using one or several species (e.g. bacteria, crustacea, algae) such as toxicity tests, algal growth tests, respiration rates, etc., (iii) histological and enzymatic studies in selected organisms, and (iv) chemical analysis of body tissues from selected organisms (see Chapter 5).
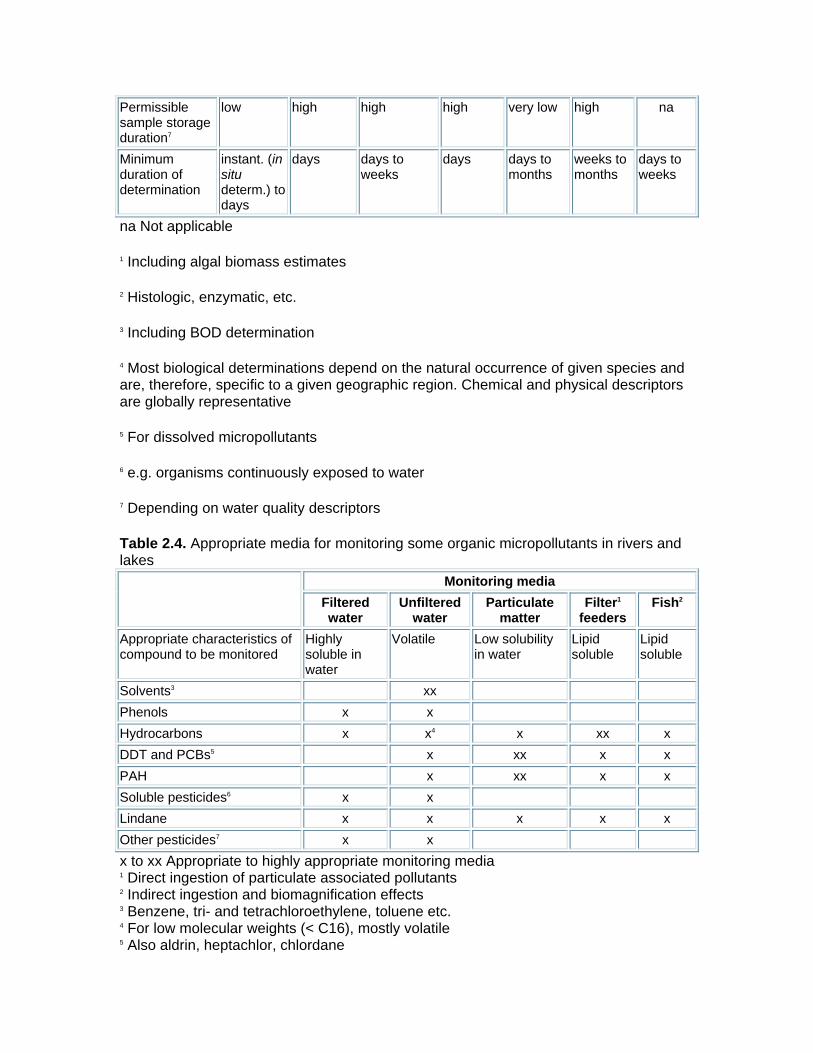
Each aquatic medium has its own set of characteristics for monitoring purposes, e.g. applicability to water bodies, inter-comparability, specificity to given pollutants, possibility of quantification such as fluxes and rates, sensitivity to pollution with the possibility of amplifying the pollution signal by several orders of magnitude, sensitivity to sample contamination, time-integration of the information received from instantaneous (for point sampling of the water) to integrated (for biotic indices), required level of field personnel, storage facility of samples, and length of the water quality determination process from field operation to result. The most significant characteristics of each medium are given tentatively in Table 2.3, i.e. water with dissolved components, particles in the deposited or suspended state, living organisms used for chemical analyses, ecological surveys, biotests, and physiological analyses. Water, itself, is by far the most common monitoring medium used to date, and the only one directly relevant to groundwaters. Particulate matter is widely used in lake studies and in trend monitoring, whereas biological indices based on ecological methods are used more and more for river and lake assessments. An example of selection of appropriate media for monitoring selected organic micropollutants in rivers and lakes is given in Table 2.4.
The information obtained from samples of water, particulate matter and aquatic organisms reflects different environmental time spans. The analysis of water from a grab sample represents a very short time period in the history of the aquatic environment, sometimes less than one hour for many chemical measurements, such as ammonia. Nevertheless, when river discharge is stable, a grab sample is also supposed to be stable for at least a day, if not more. Diurnal fluctuations, which are now commonly studied in eutrophic lakes and rivers, are responsible for marked variations in concentrations of nutrients, dissolved oxygen, pH, conductivity, calcium and bicarbonates. Careful interpretation of grab sample analysis is, therefore, necessary even for bioassays performed with grab sample material.
Dynamic toxicity tests, such as fish tests (see Figure 5.5) are representative of a slightly longer period of time (possibly several hours) depending on the resistance of the test organisms to the pollutants present. Algal production in a water body is commonly assessed by pigment concentration and is an integrated measure of two to three days prior to sampling, since the day to day variation in chlorophyll concentrations is rarely greater than 20 per cent.
During periods of steady water discharge, the analysis of suspended matter integrates environmental conditions for at least one or two weeks, but it can take months, or a even a few years, to observe changes in the quality of deposited sediments.
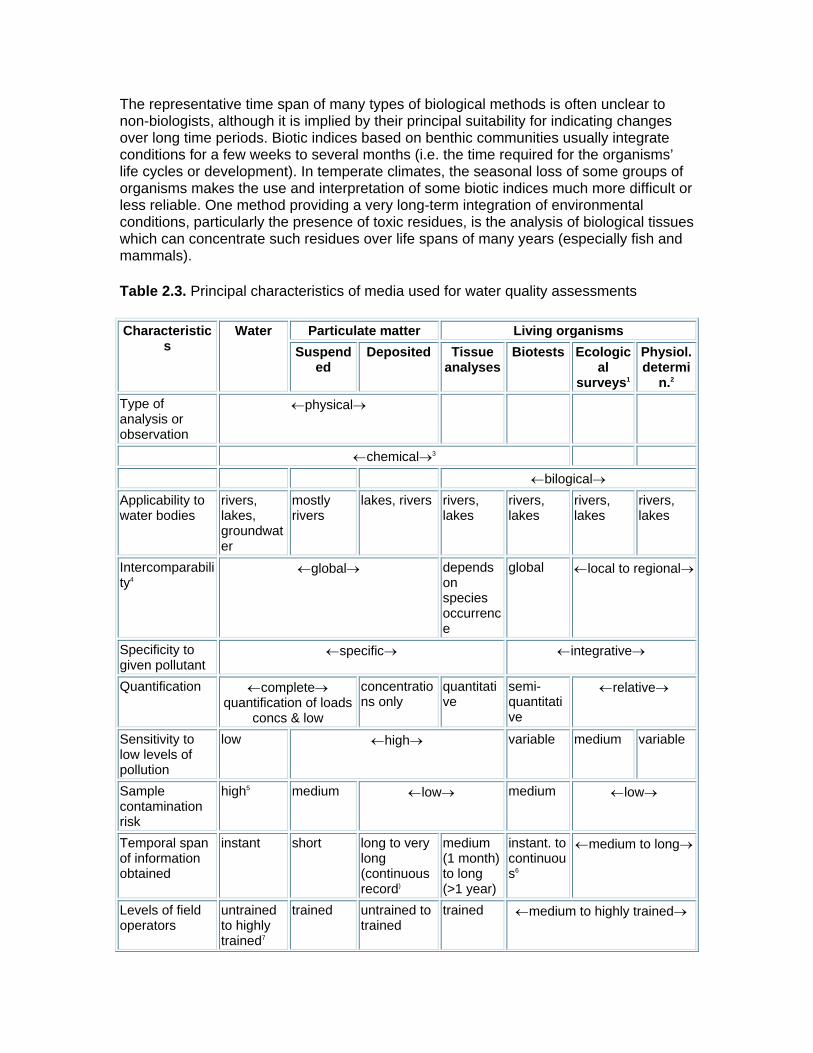
The representative time span of many types of biological methods is often unclear to non-biologists, although it is implied by their principal suitability for indicating changes over long time periods. Biotic indices based on benthic communities usually integrate conditions for a few weeks to several months (i.e. the time required for the organisms’ life cycles or development). In temperate climates, the seasonal loss of some groups of organisms makes the use and interpretation of some biotic indices much more difficult or less reliable. One method providing a very long-term integration of environmental conditions, particularly the presence of toxic residues, is the analysis of biological tissues which can concentrate such residues over life spans of many years (especially fish and mammals).
Table 2.3. Principal characteristics of media used for water quality assessments
Particulate matter Living organisms Characteristics
Water
Suspend
ed Deposited Tissue
analysesBiotests Ecologic
al surveys1
Physiol. determi
n.2 Type of analysis or observation
←physical→
←chemical→3
←bilogical→ Applicability to water bodies
rivers, lakes, groundwater
mostly rivers
lakes, rivers rivers, lakes
rivers, lakes
rivers, lakes
rivers, lakes
Intercomparability4
←global→ depends on species occurrence
global ←local to regional→
Specificity to given pollutant
←specific→ ←integrative→
Quantification ←complete→ quantification of loads
concs & low
concentrations only
quantitative
semi-quantitative
←relative→
Sensitivity to low levels of pollution
low ←high→ variable medium variable
Sample contamination risk
high5 medium ←low→ medium ←low→
Temporal span of information obtained
instant short long to very long (continuous record)
medium (1 month) to long (>1 year)
instant. to continuous6
←medium to long→
Levels of field operators
untrained to highly trained7
trained untrained to trained
trained ←medium to highly trained→
Permissible sample storage duration7
low high high high very low high na
Minimum duration of determination
instant. (in situ determ.) to days
days days to weeks
days days to months
weeks to months
days to weeks
na Not applicable
1 Including algal biomass estimates
2 Histologic, enzymatic, etc.
3 Including BOD determination
4 Most biological determinations depend on the natural occurrence of given species and are, therefore, specific to a given geographic region. Chemical and physical descriptors are globally representative
5 For dissolved micropollutants
6 e.g. organisms continuously exposed to water
7 Depending on water quality descriptors
Table 2.4. Appropriate media for monitoring some organic micropollutants in rivers and lakes
Monitoring media
Filtered water
Unfiltered water
Particulate matter
Filter1 feeders
Fish2
Appropriate characteristics of compound to be monitored
Highly soluble in water
Volatile Low solubility in water
Lipid soluble
Lipid soluble
Solvents3 xx Phenols x x Hydrocarbons x x4 x xx x DDT and PCBs5 x xx x x PAH x xx x x Soluble pesticides6 x x Lindane x x x x x Other pesticides7 x x x to xx Appropriate to highly appropriate monitoring media 1 Direct ingestion of particulate associated pollutants 2 Indirect ingestion and biomagnification effects 3 Benzene, tri- and tetrachloroethylene, toluene etc. 4 For low molecular weights (< C16), mostly volatile 5 Also aldrin, heptachlor, chlordane

6 TCA, paraquat, metham-sodium, carbamates 7 Such as triazine compounds, isoproturon, chlortoluron, 2,4-D, etc. Chemical approaches should not automatically be preferred to biological approaches because both have advantages and shortcomings (Table 2.5). Instead, the two approaches should be regarded as complimentary. Each category of water quality assessment operations (see Table 2.2) has its own requirements in relation to the characteristics given in Table 2.3. Some practically relevant examples are: • All monitoring activities should take into account such characteristics as continuity of the monitoring chain and the required levels of field operators.
• International monitoring programmes should consider, among others, the inter-comparability, the quantification, and the sample storage requirements.
• Trend monitoring should consider the signal amplification, the duration of information obtained, the sample storage capacity, etc.
• Basic surveys within a given region should consider biological monitoring (chemical analyses of tissues, biotic indices, physiological determinations) and/or particulate matter monitoring.
• Operational surveillance for a specific use is usually focused on water analysis and the duration of the determinations should be short.
• Impact surveys may consider field biotic indices.
• Emergency surveys imply the sampling of each medium for rapid or delayed chemical analysis and physiological effects.
• Early warning surveillance mostly relies on the continuous exposure of sensitive organisms to water and/or on the continuous measurement of some chemicals (e.g. ammonia).
• Background monitoring and surveys undertaken for modelling purposes may involve all three monitoring media.

Table 2.5. Advantages and shortcomings of biological and chemical water quality monitoring
Biological monitoring Chemical monitoring Advantages Good spatial and temporal integration Possibility of very fine temporal variations Good response to chronic, minor pollution events
Possibility of precise pollutant determination
Signal amplification (bioaccumulation, biomagnification)
Determination of pollutant fluxes
Real time studies (in-line bioassays) Valid for all water bodies, including groundwaters Measures the physical degradation of the aquatic habitat
Standardisation possible
Shortcomings General lack of temporal sensitivity High detection limits for many routine analyses
(micropollutants) Many semi-quantitative or quantitative responses possible
No time-integration for water grab samples
Standardisation difficult Possible sample contamination for some micropollutants (e.g. metals)
Not valid for pollutant flux studies High costs involved in surveys Not yet adapted to groundwaters Limited use for continuous surveillance
2.4.2. Water quality variability and sampling frequency
Water quality is a highly variable aspect of any water body, although it is more variable in rivers than in lakes, but much less so in aquifers. Variabilities occur not only with regard to their spatial distribution but also over time. As indicated in section 2.2.1 any variable is a function of space and time: c = f(x,y,z,t). Not all of these four parameters have equal influence in the different types of water bodies as demonstrated in Table 2.6 for surface and groundwaters. Rivers generally have only one spatial dimension (i.e. longitudinal) and a pronounced time variability whereas groundwaters are characterised by low, to very low, time variability and two to three spatial dimensions. Therefore, it is essential to have sufficient knowledge of the hydrodynamics of each water body.
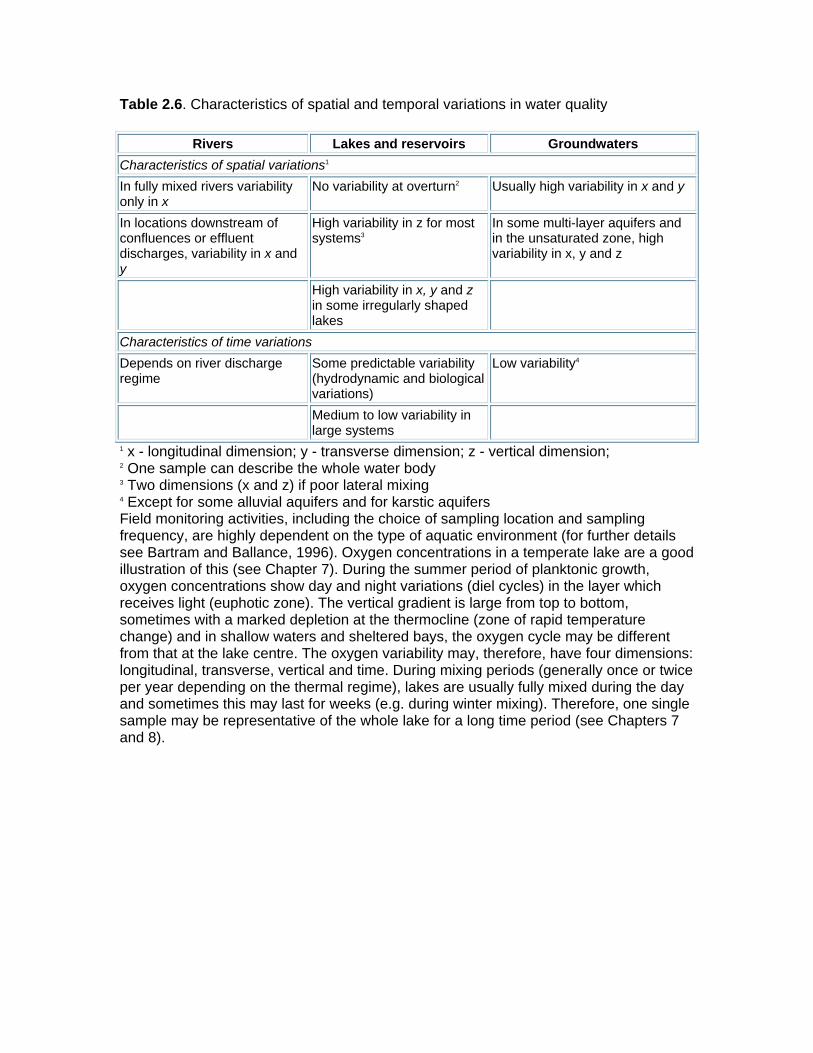
Table 2.6. Characteristics of spatial and temporal variations in water quality
Rivers Lakes and reservoirs Groundwaters Characteristics of spatial variations1 In fully mixed rivers variability only in x
No variability at overturn2 Usually high variability in x and y
In locations downstream of confluences or effluent discharges, variability in x and y
High variability in z for most systems3
In some multi-layer aquifers and in the unsaturated zone, high variability in x, y and z
High variability in x, y and z in some irregularly shaped lakes
Characteristics of time variations Depends on river discharge regime
Some predictable variability (hydrodynamic and biological variations)
Low variability4
Medium to low variability in large systems
1 x - longitudinal dimension; y - transverse dimension; z - vertical dimension; 2 One sample can describe the whole water body 3 Two dimensions (x and z) if poor lateral mixing 4 Except for some alluvial aquifers and for karstic aquifers Field monitoring activities, including the choice of sampling location and sampling frequency, are highly dependent on the type of aquatic environment (for further details see Bartram and Ballance, 1996). Oxygen concentrations in a temperate lake are a good illustration of this (see Chapter 7). During the summer period of planktonic growth, oxygen concentrations show day and night variations (diel cycles) in the layer which receives light (euphotic zone). The vertical gradient is large from top to bottom, sometimes with a marked depletion at the thermocline (zone of rapid temperature change) and in shallow waters and sheltered bays, the oxygen cycle may be different from that at the lake centre. The oxygen variability may, therefore, have four dimensions: longitudinal, transverse, vertical and time. During mixing periods (generally once or twice per year depending on the thermal regime), lakes are usually fully mixed during the day and sometimes this may last for weeks (e.g. during winter mixing). Therefore, one single sample may be representative of the whole lake for a long time period (see Chapters 7 and 8).
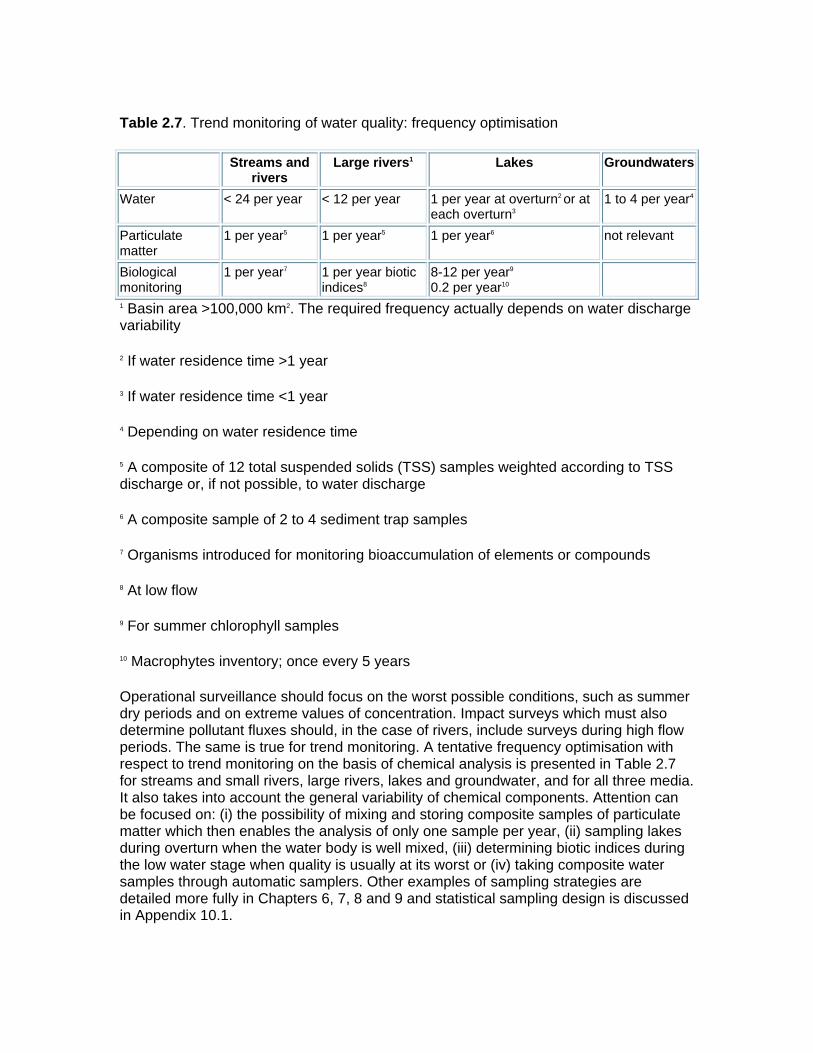
Table 2.7. Trend monitoring of water quality: frequency optimisation
Streams and rivers
Large rivers1 Lakes Groundwaters
Water < 24 per year < 12 per year 1 per year at overturn2 or at each overturn3
1 to 4 per year4
Particulate matter
1 per year5 1 per year5 1 per year6 not relevant
Biological monitoring
1 per year7 1 per year biotic indices8
8-12 per year9 0.2 per year10
1 Basin area >100,000 km2. The required frequency actually depends on water discharge variability
2 If water residence time >1 year
3 If water residence time <1 year
4 Depending on water residence time
5 A composite of 12 total suspended solids (TSS) samples weighted according to TSS discharge or, if not possible, to water discharge
6 A composite sample of 2 to 4 sediment trap samples
7 Organisms introduced for monitoring bioaccumulation of elements or compounds
8 At low flow
9 For summer chlorophyll samples
10 Macrophytes inventory; once every 5 years
Operational surveillance should focus on the worst possible conditions, such as summer dry periods and on extreme values of concentration. Impact surveys which must also determine pollutant fluxes should, in the case of rivers, include surveys during high flow periods. The same is true for trend monitoring. A tentative frequency optimisation with respect to trend monitoring on the basis of chemical analysis is presented in Table 2.7 for streams and small rivers, large rivers, lakes and groundwater, and for all three media. It also takes into account the general variability of chemical components. Attention can be focused on: (i) the possibility of mixing and storing composite samples of particulate matter which then enables the analysis of only one sample per year, (ii) sampling lakes during overturn when the water body is well mixed, (iii) determining biotic indices during the low water stage when quality is usually at its worst or (iv) taking composite water samples through automatic samplers. Other examples of sampling strategies are detailed more fully in Chapters 6, 7, 8 and 9 and statistical sampling design is discussed in Appendix 10.1.
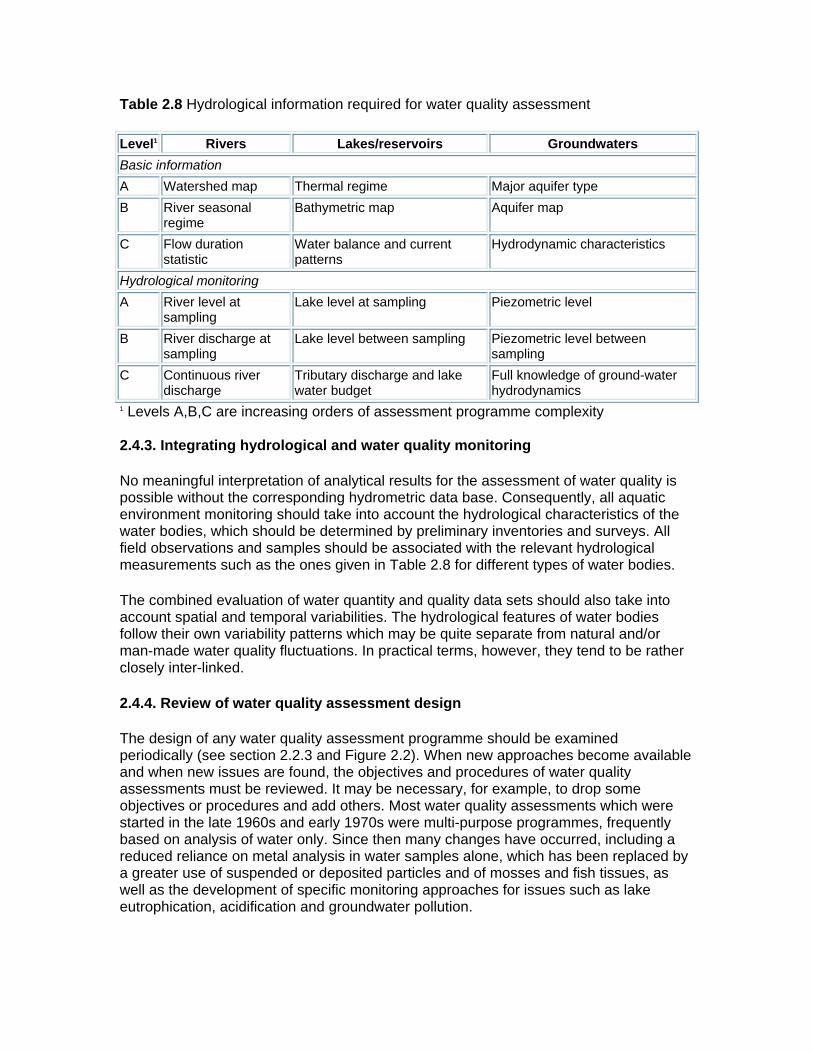
Table 2.8 Hydrological information required for water quality assessment
Level1 Rivers Lakes/reservoirs Groundwaters Basic information A Watershed map Thermal regime Major aquifer type B River seasonal
regime Bathymetric map Aquifer map
C Flow duration statistic
Water balance and current patterns
Hydrodynamic characteristics
Hydrological monitoring A River level at
sampling Lake level at sampling Piezometric level
B River discharge at sampling
Lake level between sampling Piezometric level between sampling
C Continuous river discharge
Tributary discharge and lake water budget
Full knowledge of ground-water hydrodynamics
1 Levels A,B,C are increasing orders of assessment programme complexity 2.4.3. Integrating hydrological and water quality monitoring
No meaningful interpretation of analytical results for the assessment of water quality is possible without the corresponding hydrometric data base. Consequently, all aquatic environment monitoring should take into account the hydrological characteristics of the water bodies, which should be determined by preliminary inventories and surveys. All field observations and samples should be associated with the relevant hydrological measurements such as the ones given in Table 2.8 for different types of water bodies.
The combined evaluation of water quantity and quality data sets should also take into account spatial and temporal variabilities. The hydrological features of water bodies follow their own variability patterns which may be quite separate from natural and/or man-made water quality fluctuations. In practical terms, however, they tend to be rather closely inter-linked.
2.4.4. Review of water quality assessment design
The design of any water quality assessment programme should be examined periodically (see section 2.2.3 and Figure 2.2). When new approaches become available and when new issues are found, the objectives and procedures of water quality assessments must be reviewed. It may be necessary, for example, to drop some objectives or procedures and add others. Most water quality assessments which were started in the late 1960s and early 1970s were multi-purpose programmes, frequently based on analysis of water only. Since then many changes have occurred, including a reduced reliance on metal analysis in water samples alone, which has been replaced by a greater use of suspended or deposited particles and of mosses and fish tissues, as well as the development of specific monitoring approaches for issues such as lake eutrophication, acidification and groundwater pollution.
This complexity can be illustrated by the example of river monitoring in France over the past years. Monitoring is performed at three levels (Meybeck, 1994):
• Research and development of new methods by specialised institutions; current research is carried out on diatom indices, cytochrome P-450 in fish and on-line bioassays, etc.
• Testing of some new approaches by river basin authorities.
• Standardisation and general application at the country level.
The use of biotic indices, based on benthic communities, started with the beginning of the regular, national monitoring programme in 1971 (now the Reseau National de Bassin). This approach was gradually improved and is now standardised. After an initial period of basic multi-purpose monitoring, the French national network evolved to handle eutrophication and micro-pollutants through the monitoring of aquatic mosses, deposited sediments and, more recently, suspended matter, as well as specific monitoring for modelling in a few lakes. Specific early warning monitoring systems are being developed by the water supply industries.
2.5. Implementation of water quality assessment programmes
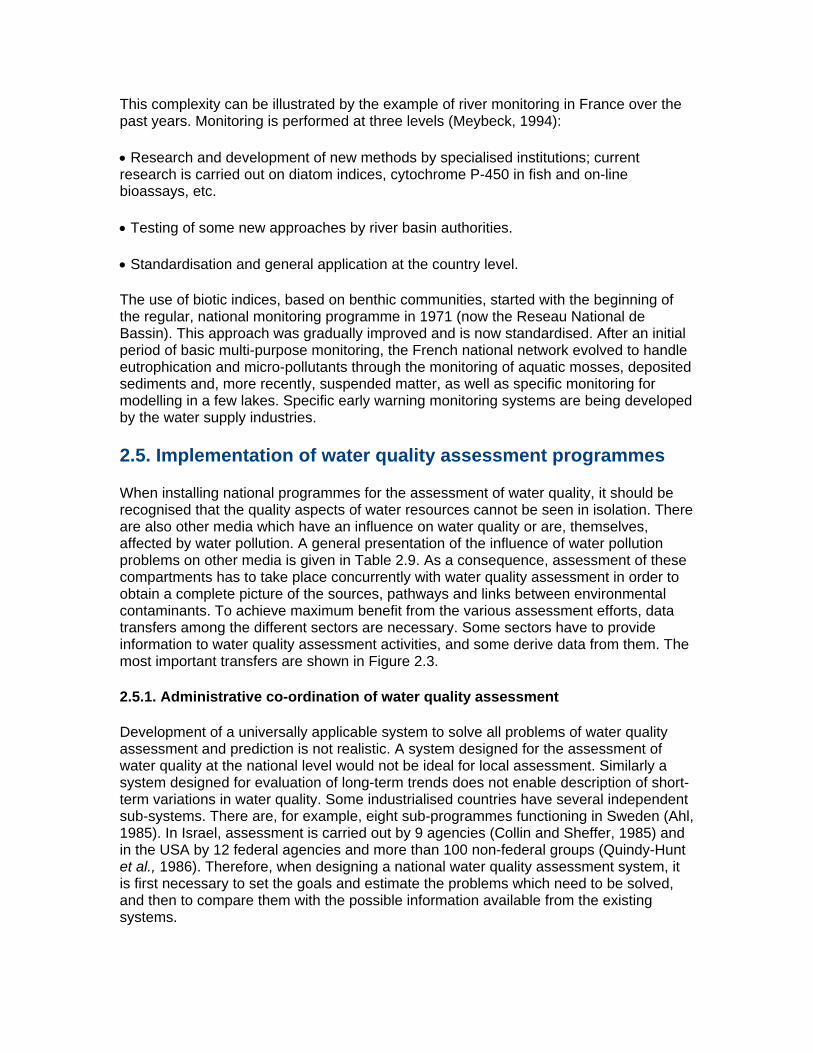
When installing national programmes for the assessment of water quality, it should be recognised that the quality aspects of water resources cannot be seen in isolation. There are also other media which have an influence on water quality or are, themselves, affected by water pollution. A general presentation of the influence of water pollution problems on other media is given in Table 2.9. As a consequence, assessment of these compartments has to take place concurrently with water quality assessment in order to obtain a complete picture of the sources, pathways and links between environmental contaminants. To achieve maximum benefit from the various assessment efforts, data transfers among the different sectors are necessary. Some sectors have to provide information to water quality assessment activities, and some derive data from them. The most important transfers are shown in Figure 2.3.
2.5.1. Administrative co-ordination of water quality assessment
Development of a universally applicable system to solve all problems of water quality assessment and prediction is not realistic. A system designed for the assessment of water quality at the national level would not be ideal for local assessment. Similarly a system designed for evaluation of long-term trends does not enable description of short-term variations in water quality. Some industrialised countries have several independent sub-systems. There are, for example, eight sub-programmes functioning in Sweden (Ahl, 1985). In Israel, assessment is carried out by 9 agencies (Collin and Sheffer, 1985) and in the USA by 12 federal agencies and more than 100 non-federal groups (Quindy-Hunt et al., 1986). Therefore, when designing a national water quality assessment system, it is first necessary to set the goals and estimate the problems which need to be solved, and then to compare them with the possible information available from the existing systems.
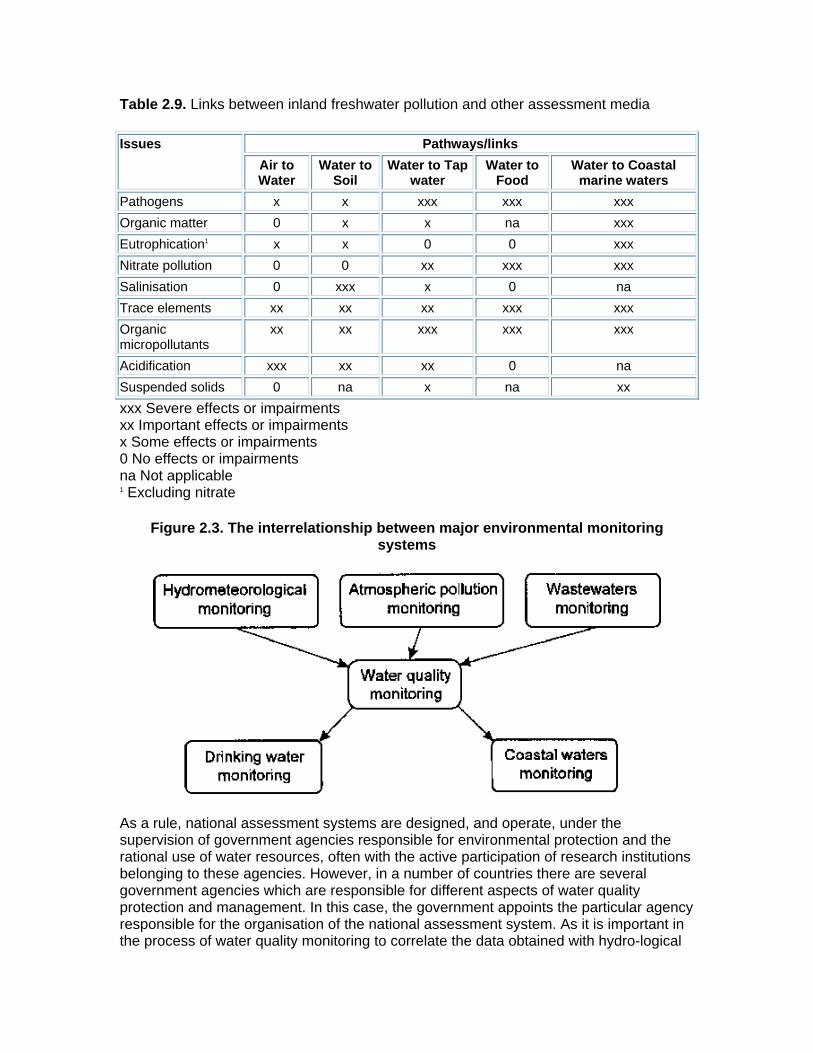
Table 2.9. Links between inland freshwater pollution and other assessment media
Pathways/links Issues
Air to Water
Water to Soil
Water to Tap water
Water to Food
Water to Coastal marine waters
Pathogens x x xxx xxx xxx Organic matter 0 x x na xxx Eutrophication1 x x 0 0 xxx Nitrate pollution 0 0 xx xxx xxx Salinisation 0 xxx x 0 na Trace elements xx xx xx xxx xxx Organic micropollutants
xx xx xxx xxx xxx
Acidification xxx xx xx 0 na Suspended solids 0 na x na xx xxx Severe effects or impairments xx Important effects or impairments x Some effects or impairments 0 No effects or impairments na Not applicable 1 Excluding nitrate
Figure 2.3. The interrelationship between major environmental monitoring systems
As a rule, national assessment systems are designed, and operate, under the supervision of government agencies responsible for environmental protection and the rational use of water resources, often with the active participation of research institutions belonging to these agencies. However, in a number of countries there are several government agencies which are responsible for different aspects of water quality protection and management. In this case, the government appoints the particular agency responsible for the organisation of the national assessment system. As it is important in the process of water quality monitoring to correlate the data obtained with hydro-logical

information, and to compute fluxes, this work is often carried out by hydrometeorological services as in Chile (Merino et al., 1985), Panama (Muschett, 1985) and the former USSR (Izrael, 1984). The responsibilities of the head agency include, not only the organisation of the basic national monitoring programmes, but also the co-ordination of the work of other programmes supplying information to the general data bank. With the increasing number of independent agencies providing different functions within the monitoring system the management gets more difficult. Therefore, the involvement of all agencies should be well defined.
An assessment system should be designed in such a way that it can provide information, at all levels, i.e. international, national (federal), regional and local. The requirement for additional information from other assessment programmes or agencies also depends on the level of assessment undertaken. The national (or federal) level of assessment, which is based on the programmes of the principal agency, can include data taken from other agencies as well as summarised information taken at regional and local levels.
From a geographical point of view it is ideal if water quality information can be obtained in relation to major river basins. In some countries, e.g. New Zealand, the UK and France (McBride et al., 1985), national assessment programmes are undertaken in this way. However, in a number of countries where the local authorities are organised within regional administrations, the assessments are carried out according to the administrative and territorial divisions of the country, as in the former USSR (Izrael et al., 1978) and Finland (Laaksonen, 1985). In this situation, the information can be transformed into river basin data sets. Ideally this should be done by one of the institutions responsible for processing the data at the national level.
2.5.2. Field operations
The personnel in charge of sample collection, field handling and field measurements must be specially trained for these activities. The choice of personnel for sampling depends on a number of factors which include the geographic features of the region and the system of transportation. For example, in a small country such as Panama (Muschett, 1985), sampling is carried out by laboratory personnel going to the field for nearly a week to take samples, conduct field analyses, and transport samples back to the laboratory by public transport. In countries of larger size which possess a more developed monitoring system, specially trained field personnel often conduct the sampling, as well as train and organise the work of additional personnel. This approach is practised in Canada (Whitlow, 1985). In large countries which have a poor transportation system, relatively more personnel are required. In this situation specialists from hydrometeorological and hydrological stations, for example, may be used, although these personnel often do not possess the necessary training in water sampling for water quality monitoring.
When sampling is carried out by a specialised team, it is desirable that the means of transportation can also be used as a mobile “laboratory” for filtration, field measurements and sample storage. When working in lakes and reservoirs different types of vessels, including small boats, may be used. Special ships with on-board laboratories are only justified for large water bodies for which the travel time exceeds 48 hours and/or if systematic investigations of high intensity are required.
Recently, helicopters have come into use for sampling in remote areas deprived of roads. In addition, special multi-parametric, portable instruments which enable measurements of pH, redox potential, oxygen, conductivity, turbidity, etc., now exist. Automatic water quality stations are also available commercially. However, they still require regular, and sometimes sophisticated, maintenance. Therefore, they are more commonly used for operational surveillance or early warning monitoring.
Everyone participating in sampling should be thoroughly instructed on safety regulations appropriate to their work and assisted in the case of an emergency. Such instruction sessions should be organised routinely and systematically. Special attention should be paid to the careful use of boats. Specific safety requirements should also be followed when sampling during winter ice cover.
2.5.3. Laboratory organisation
Laboratories must be selected or set up to meet the objectives of each assessment programme. Attention should be paid mainly to the choice of analytical methods. The range of concentrations measured by the chosen methods must correspond to the concentrations of the variable in a water body and to the concentrations set by any applicable water quality standards. For example, water quality standards often require the total absence of certain toxic pollutants. In such cases the detection limit of the analytical method must be very low to determine whether the water quality meets the standard. The less sensitive the method, the greater the permitted deviation of the pollutant concentration from the predetermined standard.
During the initial stages of development of a national monitoring system, it is reasonable to focus on the basic variables of water quality which, as a rule, do not require expensive, sophisticated equipment. Gradually, the number of variables measured can be increased in relation to the financial resources of the monitoring agency. The elaborate equipment and technical skills necessary for the measurement of complex variables are not needed in every laboratory.
In many countries, monitoring laboratories are organised on two tiers: regional laboratories (lower level) to conduct basic determinations not requiring very complex equipment, and central laboratories (higher level) to conduct more complex analyses requiring elaborate equipment and well-trained personnel. In addition, the central laboratories often provide the regional laboratories with methodologies and analytical data quality control. The two tier approach is used for laboratories in industrialised countries such as Canada (Whitlow, 1985) and Finland (Laaksonen, 1985) as well as in some developing countries such as Tanzania (Gumbo, 1985). However, in large countries three levels may be necessary, allowing local laboratories to make routine analyses nearer to sampling sites. For example, in Russia there are about 80 local laboratories, headed by 24 regional laboratories. Management of the entire network for national monitoring in Russia is undertaken by the Hydrochemical Institute. This Institute acts as a central reference laboratory whenever it is necessary to conduct either complex or arbitration analyses.
Comparability of water quality data from different laboratories can only be ensured if identical or, at least, similar methods are used. There are many comprehensive standard manuals and guidebooks describing laboratory methods in detail, such as the
GEMS/WATER Operational Guide (WHO, 1992) and the practical guide to the methods discussed in this volume (Bar-tram and Ballance, 1996). The use of such guidebooks helps ensure the compatibility of the data supplied to national and global monitoring systems. Manuals developed in countries which have great experience in monitoring design, for example the USA (APHA, 1989), are in common use in a number of countries such as Uruguay (Balmelli and Alciaturi, 1985), Egypt (El-Gamal and Shafik, 1985) and the Fiji Islands (Chandra, 1985).
Progress in analytical chemistry has stimulated the appearance of new, more elaborate and more efficient methods. However, replacement of existing methods often results in data comparability problems with older methods which can cause problems in the statistical analysis of data-time series. Studies of the compatibility of new with old analytical methods must be undertaken. If a new method is accepted into a monitoring programme an overlap period is required where samples are analysed by both the new and the old methods.
2.6. Data processing
Analytical data collected by laboratories, together with the information on sampling sites and hydrological parameters, are usually sent (mostly in coded form) to a data treatment centre. The function, allocation and number of these centres are determined by the volume of information processed, the density of the monitoring network and the geographical peculiarities of the country. Nevertheless, it is reasonable to have a common information centre which summarises the data from the entire country. As some countries participate in the GEMS/WATER project, their data are stored in the GLOWDAT (GLObal Water DATa Management System) format (WHO, 1992) or a similar system (see Chapter 10). The GLOWDAT format was developed on the basis of NAQUADAT (The NAtional Water QUALity Accounting DATa Bank) used in Canada (Whitlow, 1985).
For phase two of GEMS/WATER, which started in the early 1990s, a new data processing software was introduced called RAISON/GEMS (Lam and Swayne, 1991). The RAISON (Regional Analysis by Intelligent Systems on a Microcomputer) system is a fully integrated database, spreadsheet and graphic interpretation package with geographic information (GIS) and expert system capabilities for personal computers. This software is specifically designed for GEMS/WATER applications and is used widely by national centres participating in this project (UNEP/WHO, 1992).
The main objective of a modern data processing centre is the development, replenishment and management of the data bank and the functioning of the automated information system on which it is based. The objectives of such a centre with a data bank already functioning are:
• information coding (for cases where it is submitted in a decoded form),
• logical control of acquired information,
• exchange of coded information with the data processing centre of higher priority,

• entering the data into an information fund or data bank,
• preparation of regular, standard, information materials on the state of water bodies (reviews, annual reports, etc.), and
• satisfaction of consumers’ special demands.
During the development of a data bank, the centre must conduct intensive work on the preparation and management of the information and software systems. These tasks determine both the quality of the data handling and of the various forms of output e.g. statistics, trends, charts, bar graphs, etc. However, at the initial stage of the data bank development, attention should be focused principally on the accuracy of the stored information because the forms of output may be improved in the process of data bank exploitation. Chapter 10 describes more fully these data processing activities.
2.7. Data quality control
Data quality control is a complex and time-consuming activity which must be undertaken continuously to ensure meaningful water quality assessments. This is particularly crucial for some of the chemical analyses carried out on water samples, such as dissolved trace elements, pesticides or even ammonia and phosphates. Errors can occur in many operations of the assessment process as indicated in Table 2.10.
2.7.1 Quality control of field work
Detailed descriptions of methods and the appropriate recommendations for field work, field sampling and sample storage are given in Bartram and Ballance (1996). Some basic principles are highlighted in the following sub-sections.
Sampling and sample representativeness
When sampling, it is always necessary to follow recommended procedures to avoid collection of unrepresentative samples. Each method, or piece of sampling apparatus, has appropriate procedures which should be followed, accurately and at every sampling occasion. In addition, simple, basic rules such as avoiding any unnecessary disturbance of the site prior to sampling (e.g. by standing downstream and collecting the sample upstream) must be followed. A full discussion of sampling procedures and precautions is beyond the scope of this chapter as it depends largely on the nature of the monitoring programme and the media to be sampled. Further information is given in the appropriate chapters and in Bartram and Ballance (1996).
Strict observance of the sampling requirements developed for a given site (type of sampler, sampling depth, cross-sectional samples, etc.) usually enables collection of representative samples. Nevertheless, to assure representativeness, it is recommended that replicate samples be taken occasionally to determine temporal (at one point in a certain time interval) and spatial (simultaneously at different points of the given water body, e.g. river cross-section) variability. Temporal variability is usually determined in preliminary surveys to check diel variations, seasonal variations and the influence of river floods, etc. Groundwater systems are usually more complex and less accessible

than rivers or lakes, and obtaining representative samples is often very difficult, as described in Chapter 9.
Table 2.10. Some possible sources of errors in the water quality assessment process with special reference to chemical methods
Assessment step
Operation Possible source of error Appropriate actions
Monitoring design
Site selection Station not representative(e.g. poor mixing in rivers)
Preliminary surveys
Frequency
determination Sample not representative(e.g. unexpected cycles or variations between samples)
Field operations Sampling Sample contamination(micropollutant
monitoring) Decontamination of sampling equipment, containers, preservatives
Filtration Contamination or loss Running field blanks Field measurement Uncalibrated operations
(pH, conduct., temperature) Inadequate understanding of hydrological regime
Field calibrations Replicate sampling Hydrological survey
Sample shipments to laboratory
Sample conservation and identification
Error in chemical conservation Lack of cooling Error in biological conservation Error and loss of label Break of container
Field spiking Appropriate field pretreatment Field operator training
Laboratory Preconcentration Contamination or loss Decontamination of laboratory equipment and facilities
Analysis Contamination Quality control of laboratory air, equipment and distilled water
Lack of sensitivity Lack of calibration
Quality assurance tests (analysis of control sample; analysis of standards)
Error in data report Check internal consistency of data (e.g. with adjacent sample, ionic balance etc.)
Computer facility
Data entry and retrieval
Error in data handling Checks by data interpretation team
Interpretation Data interpretation Lack of basic knowledge Ignorance of appropriate statistical methods Omission in data report
Appropriate training of scientists
Publication Data publication Lack of communication and dissemination of results to authorities, the public, scientists, etc.
Setting of goals and training to meet the need of decision makers
Sample treatment and storage
All water quality variables should be grouped according to the specific operations preceding analysis (filtration, preservation, types of bottles for storage and transportation of the sample, conditions and permissible time of storage). Some advanced monitoring may require as many as 20 different storage vessels. For each analytical category, accurate observance of the predetermined requirements of the sample handling is necessary; deviation from these requirements could result in serious errors. The recording of each field operation step is important for quality control, especially if the operator might deviate from predetermined procedures.
Collected samples can be contaminated by inadequately or inappropriately cleaned glassware, filters, filter apparatus, chemicals used for preservation, etc. Thus great care must be taken in the cleaning of equipment and in the checking for purity of chemicals used. Water quality variables which should be determined in the field immediately after sampling need individual aliquots which cannot be used for further analytical work. In addition, field analytical operations should follow a defined sequence in order to avoid contamination. For example, conductivity must not be determined after measurements of pH in the same water sample because concentrated electrolytes from the reference electrode used in the pH determination may enter the sample and affect the conductivity measurement.
During field operations, periodic blank samples (one blank for every ten water samples) are required to determine errors arising from contamination. Usually, for this purpose a distilled water sample is subjected to all the operations carried out for the environmental sample such as filtration, storage and preservation. The blank is then shipped, with the other samples, to the laboratory for analysis. When blank tests show evidence of contamination, additional investigations must be made during the next round of sampling; one blank should be taken for each separate step in the field and laboratory operations to determine the source of contamination. Contamination during sampling is often difficult to detect. Cross checks with highly cleaned, simple samplers (such as PTFE (polytetrafluoroethylene) bottles) should be carried out regularly. To determine the reproducibility of field operations, periodic analysis of duplicate aliquots collected from one sample (i.e. split samples) is recommended.
2.7.2. Analytical quality control
Experts agree that 10 to 20 per cent of resources, including manpower, should be directed towards ensuring the quality of analytical determinations for common water quality variables (WHO, 1992). When trace pollutants (e.g. pesticides and trace elements) are measured, the resources required for quality control may reach 50 per cent. Unfortunately, in many countries this problem is not given adequate attention. This results in unreliable data and hence, unsatisfactory solutions to the water quality problems addressed by the monitoring programme.
To provide high quality analyses, it is necessary to fulfil a number of basic requirements:

(i) The analytical methods should have characteristics (range of measured concentrations, sensitivity, selectivity) which are adequate for the water body being monitored and must pass an inter-laboratory calibration test.
(ii) The instrumental equipment of the laboratory and the available technical accessories must correspond to the set of analytical methods chosen.
(iii) The laboratory must have adequate conditions for the maintenance of analytical instruments.
(iv) A reliable and steady supply of laboratory reagents, solvents, gases of special grade, as well as standard samples and mixtures must be provided.
(v) The laboratory personnel should be sufficiently trained and qualified to carry out the necessary analytical operations properly.
(vi) A programme of systematic quality control must be organised.
Each of the above is obligatory for the proper functioning of an analytical laboratory. Requirements (i) to (v) would enable a laboratory to undertake water analyses, but requirement (vi) (analytical quality control (AQC), also known as analytical quality assurance) is necessary to ensure the quality of the data. There are two parts to AQC: intra-laboratory control carried out systematically within a laboratory, which has been well developed in many water quality manuals, and external (inter-laboratory) control carried out periodically (once or twice a year). External (inter-laboratory) control is checked by the laboratory or research institute responsible for the functioning of the monitoring system. For this purpose, several “unknown” control samples are sent to the participating laboratories for analysis and subsequent comparison of the data. If differences in the analytical results are found, the laboratories must then identify and correct the problem. Although these samples may not actually differ from those used in an intra-laboratory control exercise, the concentrations of each component of the samples should be known only to the organisers of the quality control exercise. For further details see Bartram and Ballance (1996).
2.7.3. Control of data storage and treatment
Every stage of data handling increases the risk of introduced errors. Most risk is associated with human error during written transcription or during “keying-in” via a computer keyboard. Such errors can be reduced by using direct electronic recording and data transfer processes, but such options are expensive. Whenever suspect data are encountered (at whatever stage of the data handling process), they must be checked against the original records of the sample analysis. In cases where the data are handled by a central facility, checking involves going back to the original laboratory.
Errors arising during the transcription of data from laboratory notebooks to record books or computer databases can only be reduced by careful checking of the original and copied data for mistakes, and correcting them immediately. This time is well spent, particularly when the data have been entered onto a computer system. Where entry of the data occurs via keyboards, careful and integrated design of raw data recording forms and a computer entry template can substantially reduce input errors. The likelihood of

new errors is reduced when data are also handled by electronic means for interpretation and reporting procedures. Some modern analytical equipment eliminates errors by storing its output directly onto computer diskettes.
In many organisations, individuals responsible for data entry have no knowledge of water quality. Therefore, it is important to have the database checked periodically by an expert who is capable of spotting obvious errors. Some computer database systems, either commercially available or custom designed, have the ability to automatically check and flag values which are outside the normally expected ranges (or those set by the user) for each variable. The manipulation of data and the production of routine outputs such as graphs, may also be done by individuals with no special knowledge of water quality. It is, therefore, important that appropriate experts, or specially trained individuals, are used for the final analysis and interpretation of data. This enables a further check to be made for unusual or unlikely values during the interpretation phase.
Another common problem is loss of data due to accidental erasure of computer files. Fortunately, there are several precautions which can be taken to avoid this problem. The raw, unprocessed data should be held on a master file with limited access, possibly controlled by the use of a password system, or protected from manipulation other than copying. In addition, there should always be at least a second, and possibly even a third, copy of the master file (e.g. on diskette) in a location away from the computer, and where it is safe from fire, theft, etc. The back-up file needs to be updated frequently to minimise loss if the main file is erased. Updating can occur daily (for databases receiving daily additions) or weekly (for databases receiving occasional inputs).
2.8. Interpretation and dissemination of data
Interpretation of data and communication of results are the final two steps in an assessment programme. Correctly interpreted data will not be of much use if they are not disseminated to all relevant authorities, scientists, and the public in a form which is readily understandable by, and acceptable to, the target audience. The form and level of data presentation is, therefore, crucial. Often it is advisable to produce two types of data publications: (i) a comprehensive, detailed report containing all relevant data and interpretations thereof and (ii) an executive summary (in an illustrated and simple form) which highlights the major findings. Usually, the interpretation of data is undertaken by specialised professionals such as: (i) the relevant scientists, e.g. hydrologists, hydrobiologists, chemists or geologists, (ii) the data treatment team and (iii) professionals from other organisations such as environmental protection agencies, health authorities, national resource agencies (e.g. energy, fisheries), and in some countries, transportation and agriculture departments.
A tentative list of the major means of data analysis pertinent to each type of water body, (with increasing complexity of monitoring operations) is presented in Table 2.11, specifically for the assessment of chemical water quality. Interpretations should always refer to the objectives, and should also propose improvements, including simplifications, in the monitoring activities, as well as needs for further research and guidelines for environmental planning and economic development. Subsequently, these findings should be discussed with the appropriate local, regional or national authorities and, as required, others such as the industrial development and/or national planning boards. Besides these authorities, results should be communicated to water resource managers,
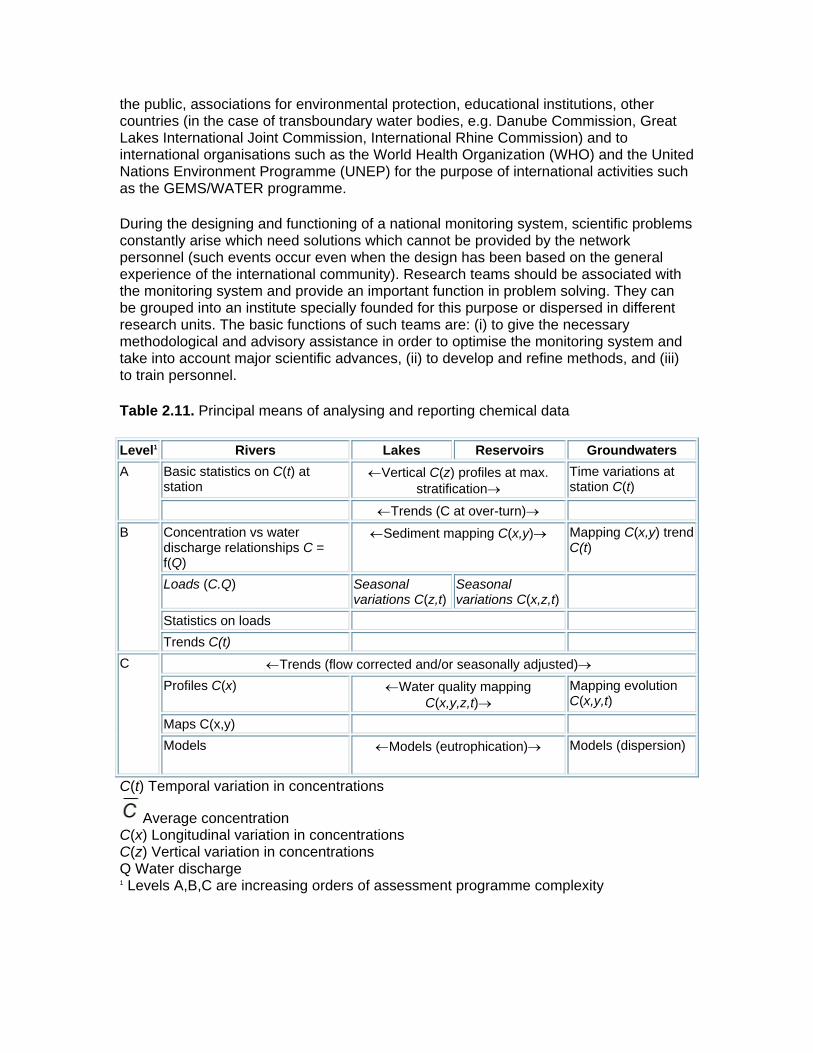
the public, associations for environmental protection, educational institutions, other countries (in the case of transboundary water bodies, e.g. Danube Commission, Great Lakes International Joint Commission, International Rhine Commission) and to international organisations such as the World Health Organization (WHO) and the United Nations Environment Programme (UNEP) for the purpose of international activities such as the GEMS/WATER programme.
During the designing and functioning of a national monitoring system, scientific problems constantly arise which need solutions which cannot be provided by the network personnel (such events occur even when the design has been based on the general experience of the international community). Research teams should be associated with the monitoring system and provide an important function in problem solving. They can be grouped into an institute specially founded for this purpose or dispersed in different research units. The basic functions of such teams are: (i) to give the necessary methodological and advisory assistance in order to optimise the monitoring system and take into account major scientific advances, (ii) to develop and refine methods, and (iii) to train personnel.
Table 2.11. Principal means of analysing and reporting chemical data
Level1 Rivers Lakes Reservoirs Groundwaters Basic statistics on C(t) at station
←Vertical C(z) profiles at max. stratification→
Time variations at station C(t)
A
←Trends (C at over-turn)→
Concentration vs water discharge relationships C = f(Q)
←Sediment mapping C(x,y)→ Mapping C(x,y) trend C(t)
Loads (C.Q) Seasonal variations C(z,t)
Seasonal variations C(x,z,t)
Statistics on loads
B
Trends C(t)
←Trends (flow corrected and/or seasonally adjusted)→ Profiles C(x) ←Water quality mapping
C(x,y,z,t)→ Mapping evolution C(x,y,t)
Maps C(x,y)
C
Models ←Models (eutrophication)→ Models (dispersion)
C(t) Temporal variation in concentrations
Average concentration C(x) Longitudinal variation in concentrations C(z) Vertical variation in concentrations Q Water discharge 1 Levels A,B,C are increasing orders of assessment programme complexity
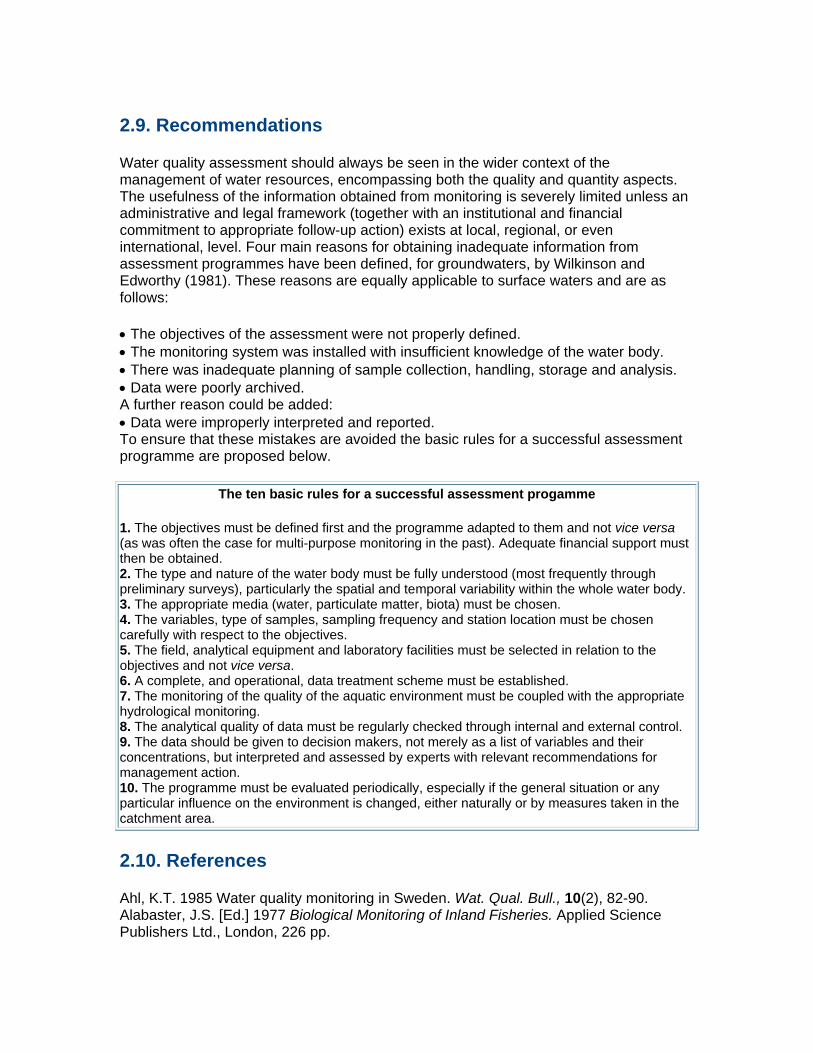
2.9. Recommendations
Water quality assessment should always be seen in the wider context of the management of water resources, encompassing both the quality and quantity aspects. The usefulness of the information obtained from monitoring is severely limited unless an administrative and legal framework (together with an institutional and financial commitment to appropriate follow-up action) exists at local, regional, or even international, level. Four main reasons for obtaining inadequate information from assessment programmes have been defined, for groundwaters, by Wilkinson and Edworthy (1981). These reasons are equally applicable to surface waters and are as follows:
• The objectives of the assessment were not properly defined. • The monitoring system was installed with insufficient knowledge of the water body. • There was inadequate planning of sample collection, handling, storage and analysis. • Data were poorly archived. A further reason could be added: • Data were improperly interpreted and reported. To ensure that these mistakes are avoided the basic rules for a successful assessment programme are proposed below.
The ten basic rules for a successful assessment progamme
1. The objectives must be defined first and the programme adapted to them and not vice versa (as was often the case for multi-purpose monitoring in the past). Adequate financial support must then be obtained. 2. The type and nature of the water body must be fully understood (most frequently through preliminary surveys), particularly the spatial and temporal variability within the whole water body. 3. The appropriate media (water, particulate matter, biota) must be chosen. 4. The variables, type of samples, sampling frequency and station location must be chosen carefully with respect to the objectives. 5. The field, analytical equipment and laboratory facilities must be selected in relation to the objectives and not vice versa. 6. A complete, and operational, data treatment scheme must be established. 7. The monitoring of the quality of the aquatic environment must be coupled with the appropriate hydrological monitoring. 8. The analytical quality of data must be regularly checked through internal and external control. 9. The data should be given to decision makers, not merely as a list of variables and their concentrations, but interpreted and assessed by experts with relevant recommendations for management action. 10. The programme must be evaluated periodically, especially if the general situation or any particular influence on the environment is changed, either naturally or by measures taken in the catchment area.
2.10. References
Ahl, K.T. 1985 Water quality monitoring in Sweden. Wat. Qual. Bull., 10(2), 82-90. Alabaster, J.S. [Ed.] 1977 Biological Monitoring of Inland Fisheries. Applied Science Publishers Ltd., London, 226 pp.

APHA 1989 Standard Methods for the Examination of Water and Wastewater. 17th edition, American Public Health Association, Washington DC., 1268 pp.
Balmelli, L.J. and Alciaturi, F.A. 1985 Water quality monitoring in Uruguay. Wat. Qual. Bull., 10(2), 96-97.
Barcelona, M.J., Gibb, J.P., Helfrich, J.A. and Garske, E.E. 1985 Practical Guide for Groundwater Sampling. ISWS Contract Report 374, Illinois State Water Survey, Champaign, Illinois, 94 pp.
Bartram, J. and Ballance, R. [Eds] 1996 Water Quality Monitoring: A Practical Guide to the Design and Implementation of Freshwater Quality Studies and Monitoring Programmes. Chapman and Hall, London.
Chandra, A. 1985 Water quality monitoring in the Fiji Islands. Wat. Qual. Bull., 10(4), 197-203, 217.
Collin, M. and Sheffer, S.M. 1985 Water quality monitoring in Israel. Wat. Qual. Bull., 10(4), 186-188.
El-Gamal, A. and Shank, Y. 1985 Monitoring of pollutants discharging to the River Nile and their effect on river water quality. Wat. Qual. Bull, 10(3), 111-115, 161.
Gumbo, F.J. 1985 Water quality monitoring in Tanzania. Wat. Qual. Bull., 10(4), 174-180, 215-216.
Hakanson, L. 1977 Sediments as Indicators of Contamination. Investigation in the Four Largest Swedish Lakes. Naturvarsverkets Kimnologiska Undersökning Report 92, Uppsala, 159 pp.
Helmer, R. 1994 Water quality monitoring: national and international approaches. In: Hydrological, Chemical and Biological Processes of Transfer, Motion and Transport of Contaminants in Aquatic Environments (Proceedings of the Rostov-on-Don Symposium, May 1993). IAHS Publication No. 219, International Association of Hydrological Sciences, Wallingford, UK.
Hem, J.D. 1989 Study and Interpretation of the Chemical Characteristics of Natural Water. Water Supply Paper 2254, 3rd edition, US Geological Survey, Washington, D.C., 263 pp.
Hirsch, R.M., Alley, W.M. and Wilber, W.G. 1988 Concepts for a National Water-Quality Assessment Program. U.S. Geological Survey Circular 1021. United States Geological Survey, Denver, CO, 42 pp.
Izrael, Yu.A. 1984 Ecology and Control of the Environment State. Gidrometeoizdat, Moscow, 560 pp, [In Russian].
Izrael, YU.A., Gasilina, N.K., Rovinskiy, F.Ya. and Philippova, L.M. 1978 Realization of the Environmental Pollution Monitoring System in the USSR. Gidrometeoizdat, Leningrad, 115 pp, [In Russian].
Krenkel, P.A. and Novotny, V. 1980 Water Quality Management. Academic Press, New York.
Laaksonen, R. 1985 Water quality monitoring in Finland. Wat. Qual. Bull., 10(3), 140-145, 161.
Lam, D.C.L. and Swayne, D.A. 1991 Integrating database, spreadsheet, graphics, GIS, statistics, simulation models and expert systems: experiences with the RAISON system on microcomputers. In: Decision Support Systems, NATO ASI Series, Vol. G26, Springer-Verlag, Berlin, Heidelberg.
McBride, G.B., Smith, D.G. and Pridmore, R.D. 1985 Water quality monitoring in New Zealand. Wat. Qual. Bull., 10(2), 91-95, 105.
Merino, R., Sandoval, R. and Grilli, A. 1985 Monitoring of water quality in Chile. Wat. Qual. Bull., 10(3), 116-119.
Meybeck, M. 1994 De la qualité des eaux a l’état de santé des écosystèmes aquatiques: pourquoi, comment, où? In: Les variables biologiques: des indicateurs de l’état de santé des écosystèmes aquatiques, Actes du colloque 2-3 Nov. 1994, Min. de l’Environnement, Paris, 187-199.
Muschett, D. 1985 Water quality monitoring in Panama. Wat. Qual. Bull., 10(2), 80-81, 105.
Quindy-Hunt, M.S., McLaughlin, R.D. and Quintanilha, A.T. 1986 Instrumentation for Environmental Monitoring. Volume 2, Water. 2nd edition, Lawrence Bercley Lab. Environmental Instrumentation Survey, John Wiley and Sons, New York, 982 pp.
Sanders, T.G., Ward, R.C., Loftis, J.C., Steele, T.D., Adrian, D.D. and Yevjevich, V. 1983 Design of Networks for Monitoring Water Quality. Water Resources Publications, Littleton, Colorado, 323 pp.
UNEP/WHO 1992 Report of the RAISON/GEMS Software Expert Review Meeting, May 11-15, 1992, Burlington, Ontario, Canada. GEMS Report Series No. 14. United Nations Environment Programme, Nairobi.
UNESCO/WHO 1978 Water Quality Surveys. A Guide for the Collection and Interpretation of Water Quality Data. Studies and Reports in Hydrology 23, United Nations Educational, Scientific and Cultural Organization, Paris, 350 pp.
Whitlow, S.H. 1985 Water quality assessment in Canada. Wat. Qual. Bull., 10(2), 75-79.
WHO 1992 GEMS/WATER Operational Guide. Third edition. World Health Organization, Geneva.
Wilkinson, W.B. and Edworthy, K.J. 1981 Groundwater quality systems - money wasted? In: W. van Duijvenbooden, P. Glasbergen and H. van Lelyveld [Eds] Quality of Groundwater. Proceedings of an International Symposium, Noordwijkerhout. Studies in Environmental Science No. 17, Elsevier, Amsterdam, 629-642.
WMO 1988 Manual on Water Quality Monitoring. WMO Operational Hydrology Report, No. 27, WMO Publication No. 680, World Meteorological Organization, Geneva, 197 pp.
Yasuno, M. and Whitton, B.A. 1988 [Eds] Biological Monitoring of Environmental Pollution. Tokai University Press, Tokyo.