chapter 2. one-dimensional kinematics -...
TRANSCRIPT
Copyright © 2010 Pearson Education, Inc.
Chapter 2. One-Dimensional
Kinematics
Chapter 2.1. Displacement and
Velocity
Copyright © 2010 Pearson Education, Inc.
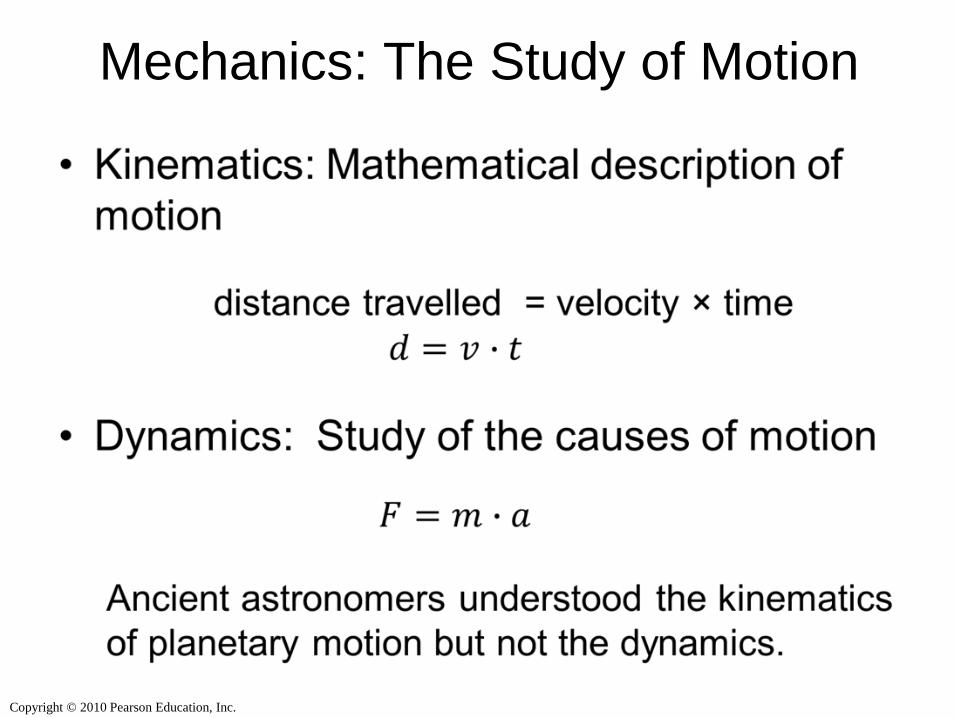
Mechanics: The Study of Motion
Copyright © 2010 Pearson Education, Inc.
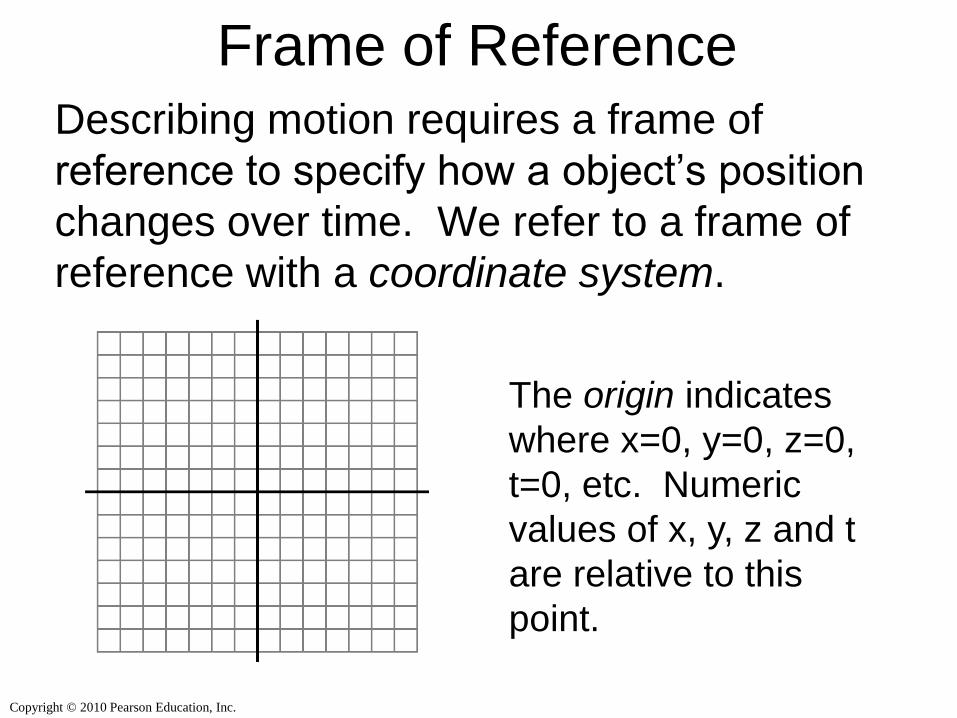
Frame of Reference Describing motion requires a frame of
reference to specify how a object’s position
changes over time. We refer to a frame of
reference with a coordinate system.
The origin indicates
where x=0, y=0, z=0,
t=0, etc. Numeric
values of x, y, z and t
are relative to this
point.
Copyright © 2010 Pearson Education, Inc.
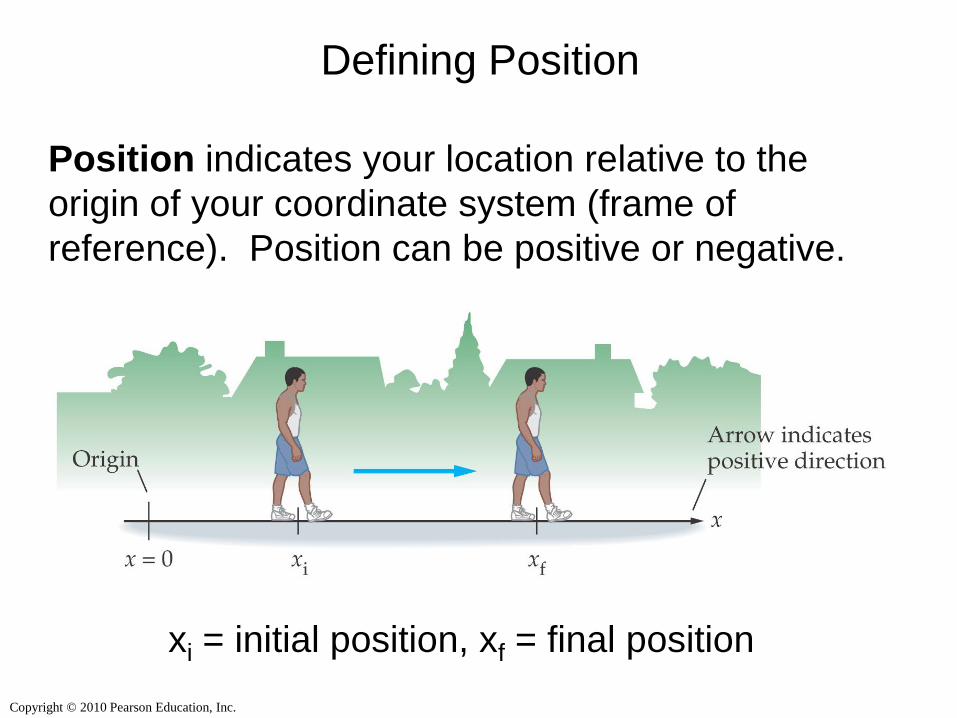
Defining Position
Position indicates your location relative to the
origin of your coordinate system (frame of
reference). Position can be positive or negative.
xi = initial position, xf = final position
Copyright © 2010 Pearson Education, Inc.
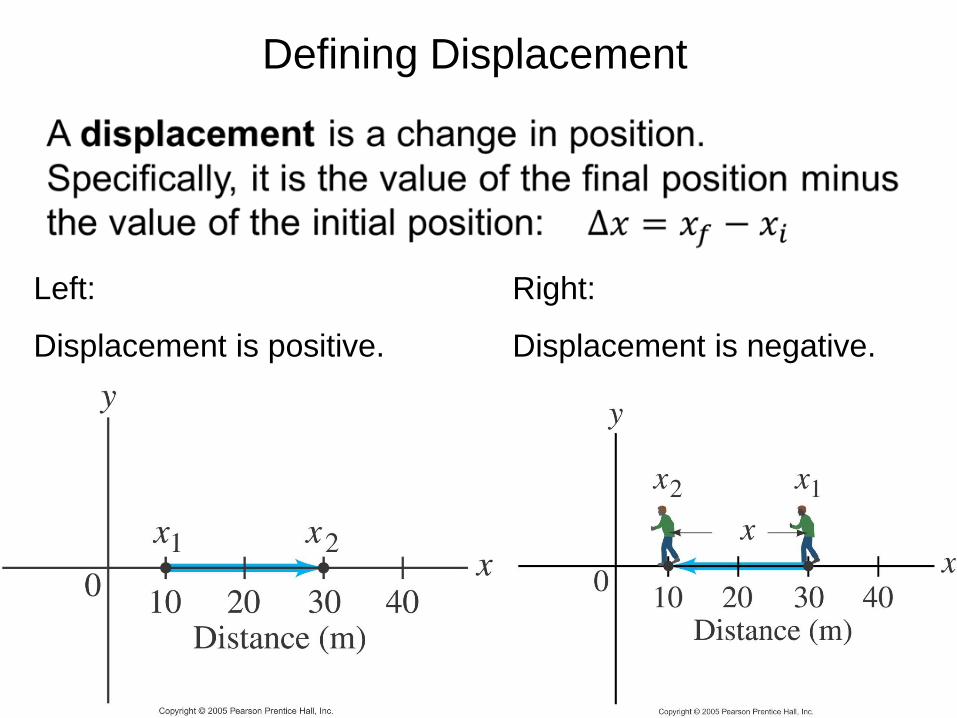
Defining Displacement
Left:
Displacement is positive.
Right:
Displacement is negative.
Copyright © 2010 Pearson Education, Inc.
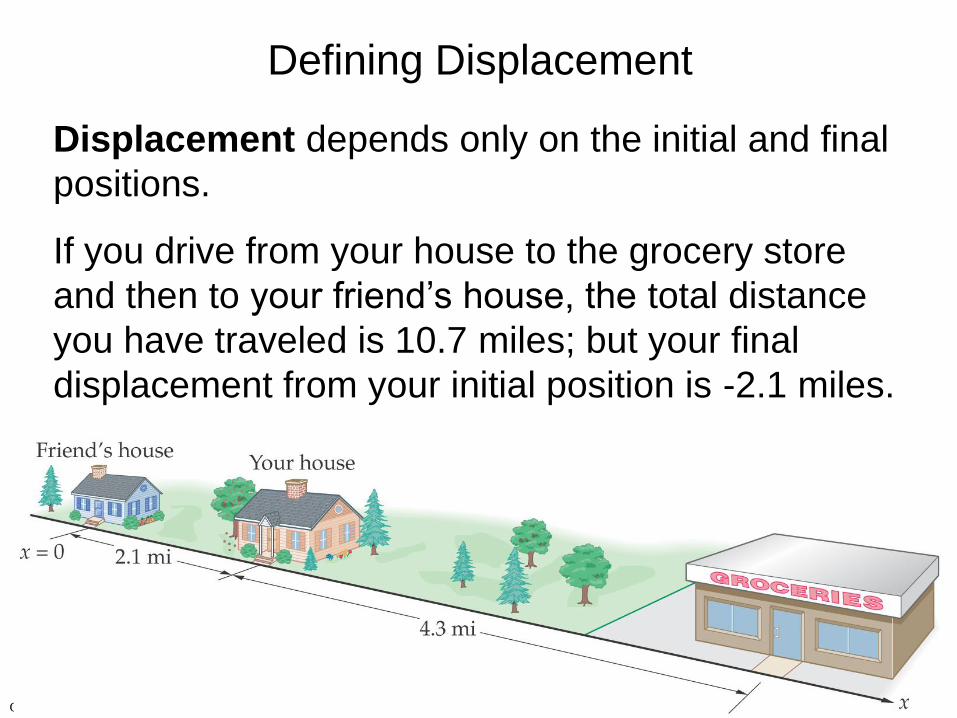
Defining Displacement
Displacement depends only on the initial and final
positions.
If you drive from your house to the grocery store
and then to your friend’s house, the total distance
you have traveled is 10.7 miles; but your final
displacement from your initial position is -2.1 miles.
Copyright © 2010 Pearson Education, Inc.
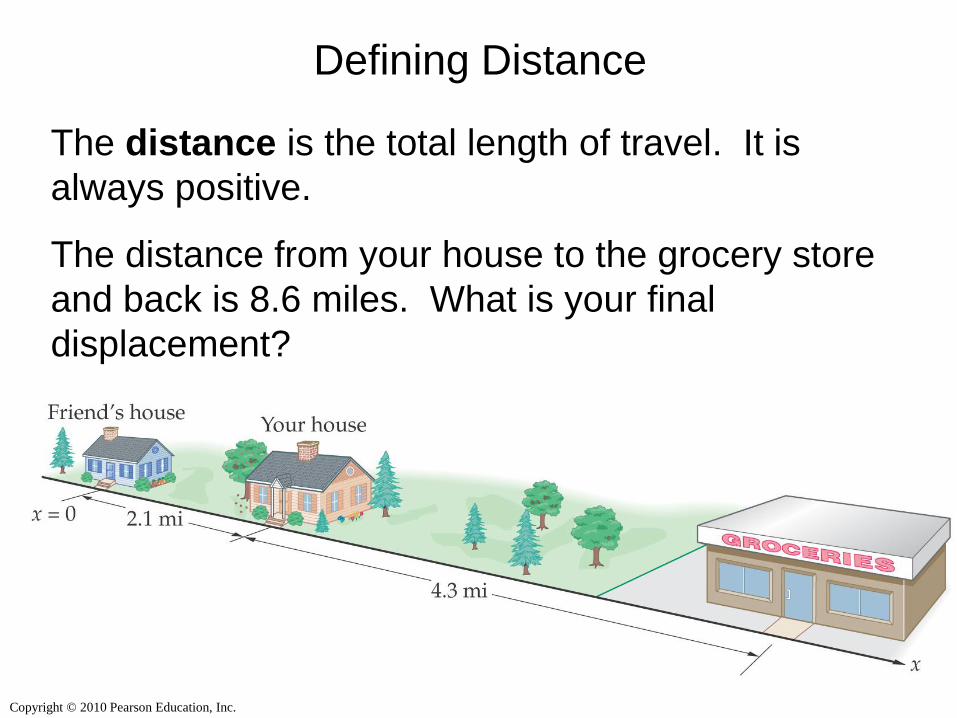
Defining Distance
The distance is the total length of travel. It is
always positive.
The distance from your house to the grocery store
and back is 8.6 miles. What is your final
displacement?
Copyright © 2010 Pearson Education, Inc.
Scalar vs. Vector
Scalar: a numerical value (magnitude).
Vector: a quantity with both magnitude and
a direction in one or more dimensions.
Graphically, vectors are represented by
arrows.
• Distance is a scalar. Distance is always
positive.
• Position and Displacement are vectors.
Negative values indicate “in a negative
direction relative to the origin”.
Copyright © 2010 Pearson Education, Inc.
Position vs. Displacement
• Position is relative to the origin (x=0).
• Displacement is relative your initial
position (xi): ∆x = xf – xi
Notation: ∆ = “delta” = “change in”
• Position and Displacement can be positive
or negative.
Copyright © 2010 Pearson Education, Inc.
Question 2.1
A space shuttle takes off from the Kennedy
Space Center in Florida, circles Earth seven
times, and lands at Edwards Air Force Base
in California. A photographer travels from
Kennedy to Edwards to take a picture of the
astronauts.
Q: Who has the greater final displacement,
the astronauts, the photographer, or neither?
A: Neither, their displacement is the same.
Copyright © 2010 Pearson Education, Inc.
Question 2.2 Displacement
Does the displacement of an object
depend on the specific location of
the origin of the coordinate system?
a) yes
b) no
c) it depends on the
coordinate system
Copyright © 2010 Pearson Education, Inc.
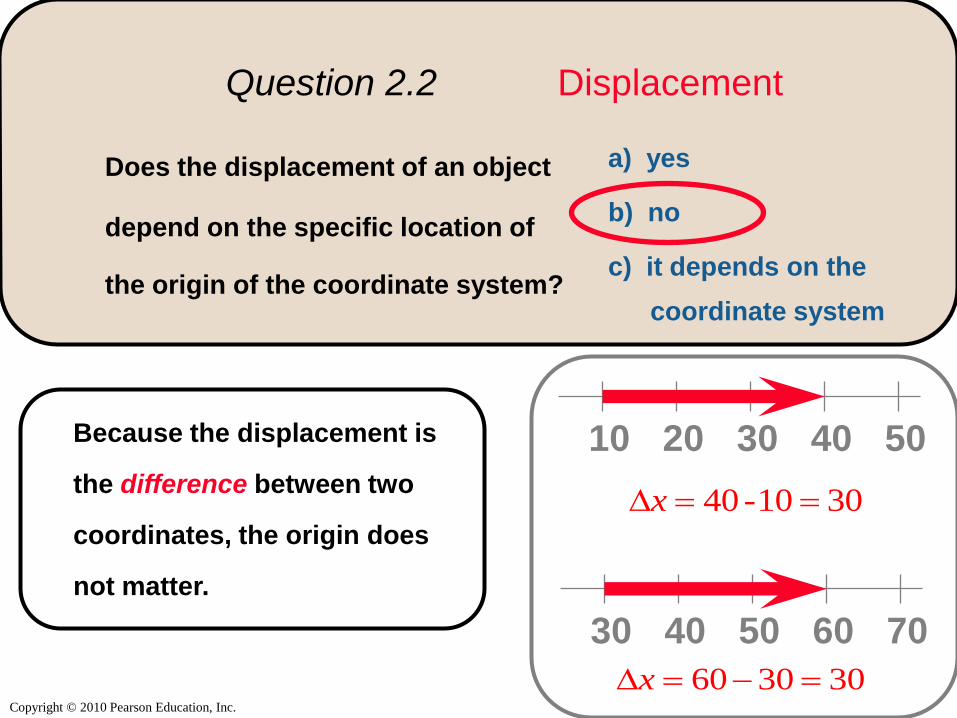
Question 2.2 Displacement
10 20 30 40 50
30 40 50 60 70
40 -10 30x
60 30 30x
Does the displacement of an object
depend on the specific location of
the origin of the coordinate system?
a) yes
b) no
c) it depends on the
coordinate system
Because the displacement is
the difference between two
coordinates, the origin does
not matter.
Copyright © 2010 Pearson Education, Inc.
Does the odometer in a car
measure distance or
displacement?
a) distance
b) displacement
c) both
Question 2.4 Odometer
Copyright © 2010 Pearson Education, Inc.
Does the odometer in a car
measure distance or
displacement?
a) distance
b) displacement
c) both
If you go on a long trip and then return home, your odometer does not
measure zero, but it records the total miles that you traveled. That
means the odometer records distance.
Question 2.4 Odometer
Follow-up: how would you measure displacement in your car?
Copyright © 2010 Pearson Education, Inc.
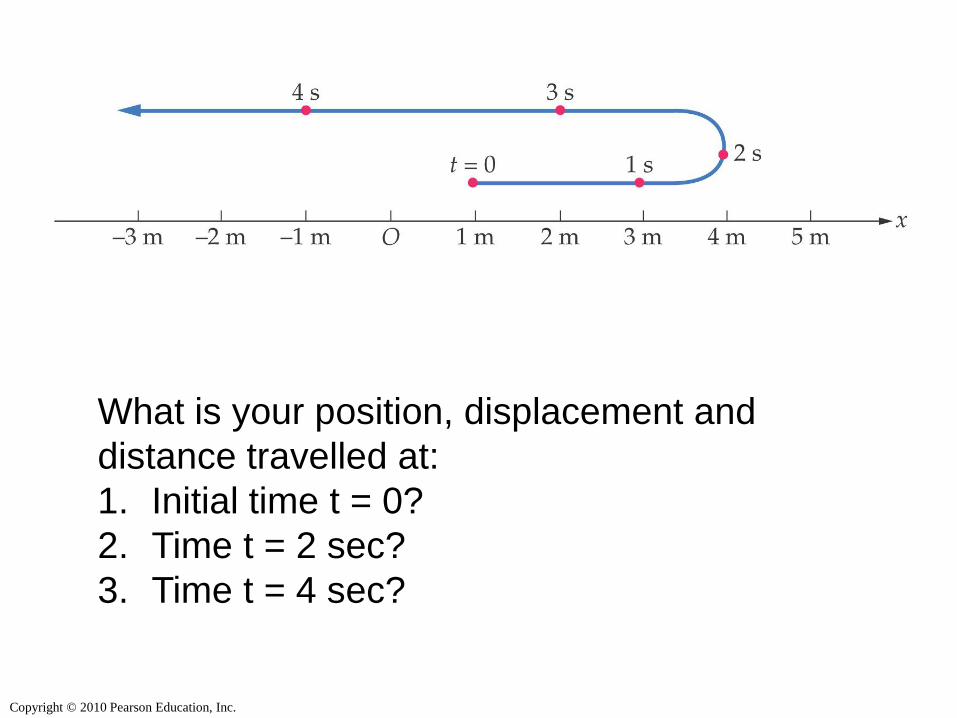
What is your position, displacement and
distance travelled at:
1. Initial time t = 0?
2. Time t = 2 sec?
3. Time t = 4 sec?
Copyright © 2010 Pearson Education, Inc.
Speed and Velocity
Copyright © 2010 Pearson Education, Inc.
Average Speed
Copyright © 2010 Pearson Education, Inc.
Average Velocity
Copyright © 2010 Pearson Education, Inc.
Example Problem 1
A kingfisher is a bird that catches fish by
plunging into the water from a height of
several meters. If a kingfisher dives from a
height of 8.0 m and reaches the water in 2.0
s, what was its speed?
Ave. speed = distance / elapsed time
= 8.0 m / 2.0 s
= 4.0 m/s
Copyright © 2010 Pearson Education, Inc.
Example Problem 1b
If the kingfisher dives from a height of 7.0 m
with an average speed of 4.00 m/s, how
long does it take for it to reach the water?
Ave. speed = distance / elapsed time
4.00 m/s = 7.0 m / ∆t
∆t = 7.0 m / (4.00 m/s) = 1.75 s = 1.8 s
Copyright © 2010 Pearson Education, Inc.
Example Problem 2
A car travels at 55 mph due north. On a
different road, a van travels at 55 mph due
east. Are their velocities the same?
No.
Their speeds are the same.
The magnitudes of their velocities are the
same.
Their directions are different.
Their velocities are different.
Copyright © 2010 Pearson Education, Inc.
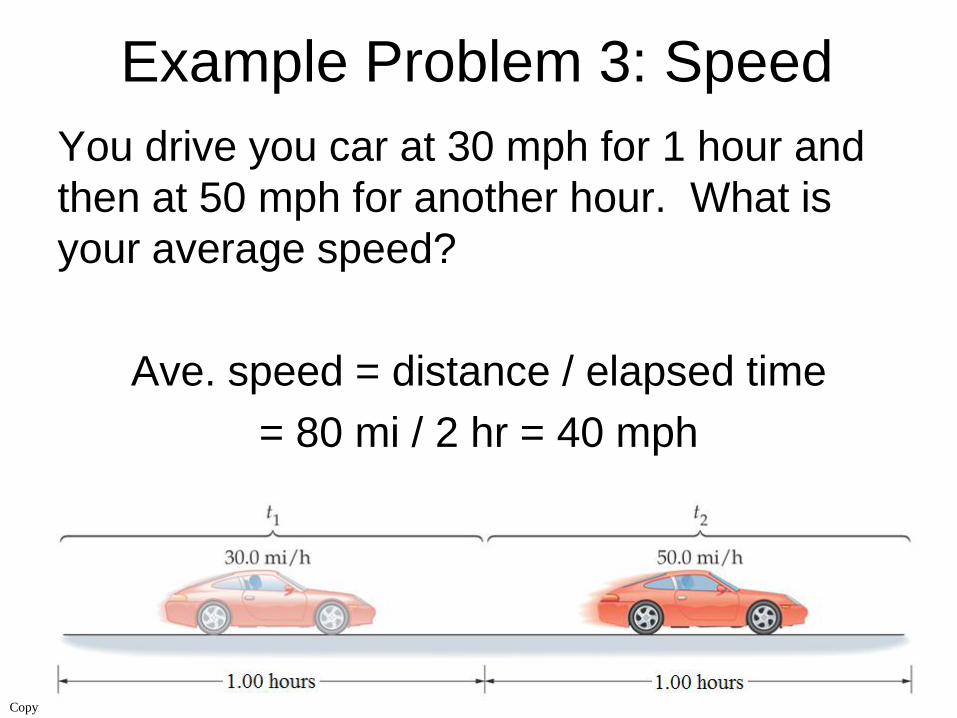
Example Problem 3: Speed
You drive you car at 30 mph for 1 hour and
then at 50 mph for another hour. What is
your average speed?
Ave. speed = distance / elapsed time
= 80 mi / 2 hr = 40 mph
Copyright © 2010 Pearson Education, Inc.
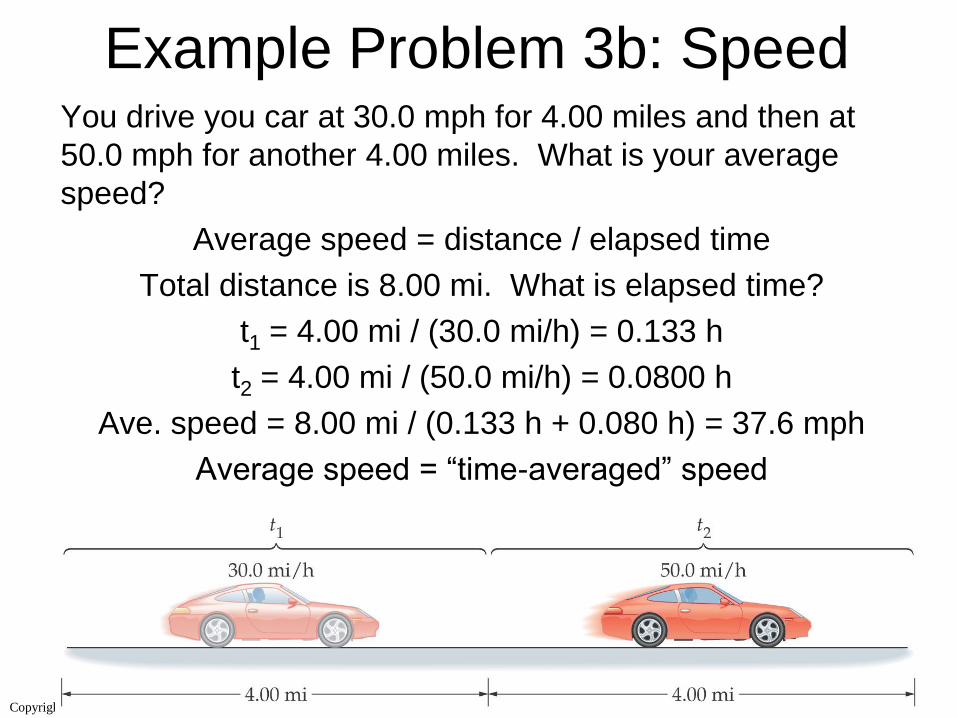
Example Problem 3b: Speed You drive you car at 30.0 mph for 4.00 miles and then at
50.0 mph for another 4.00 miles. What is your average
speed?
Average speed = distance / elapsed time
Total distance is 8.00 mi. What is elapsed time?
t1 = 4.00 mi / (30.0 mi/h) = 0.133 h
t2 = 4.00 mi / (50.0 mi/h) = 0.0800 h
Ave. speed = 8.00 mi / (0.133 h + 0.080 h) = 37.6 mph
Average speed = “time-averaged” speed
Copyright © 2010 Pearson Education, Inc.
Example Problem 4: Velocity
You start at position x = 10 m, and walk to
position x = 5 m in 10 seconds. What was
your average velocity?
Average velocity = (xf – xi) / (tf – ti)
= (5 m – 10 m) / 10 s
= -0.5 m/s
Copyright © 2010 Pearson Education, Inc.
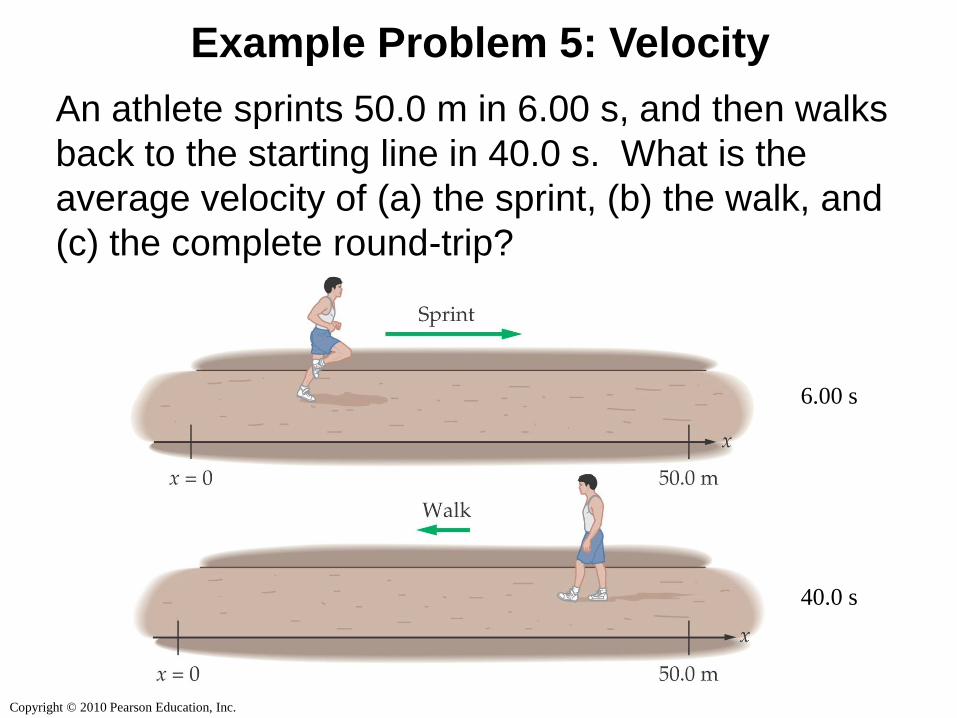
Example Problem 5: Velocity
An athlete sprints 50.0 m in 6.00 s, and then walks
back to the starting line in 40.0 s. What is the
average velocity of (a) the sprint, (b) the walk, and
(c) the complete round-trip?
6.00 s
40.0 s
Copyright © 2010 Pearson Education, Inc.
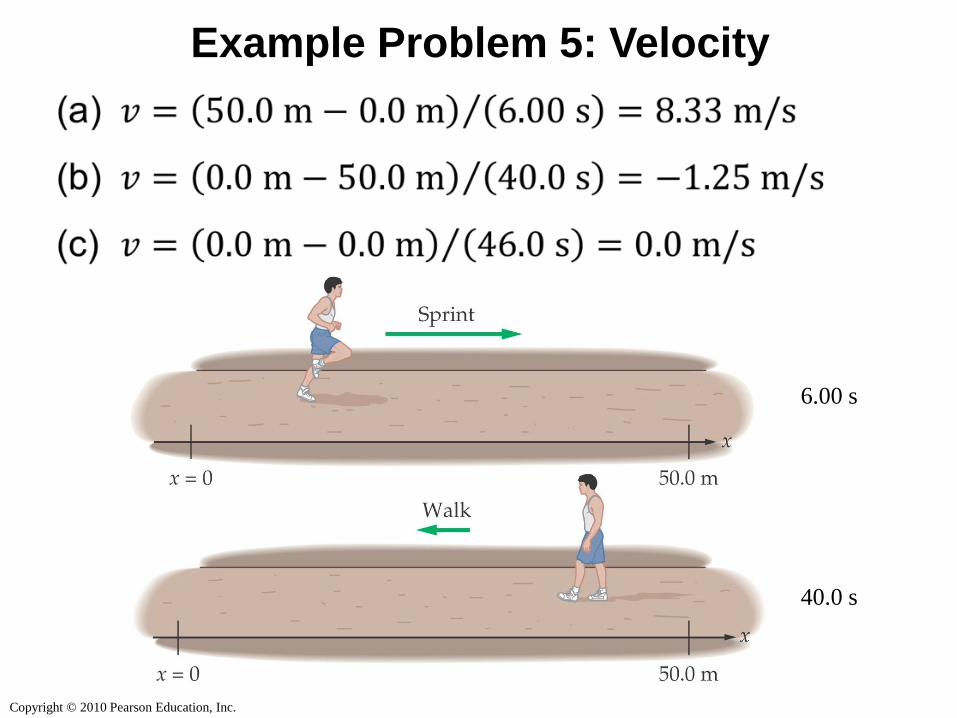
Example Problem 5: Velocity
6.00 s
40.0 s
Copyright © 2010 Pearson Education, Inc.
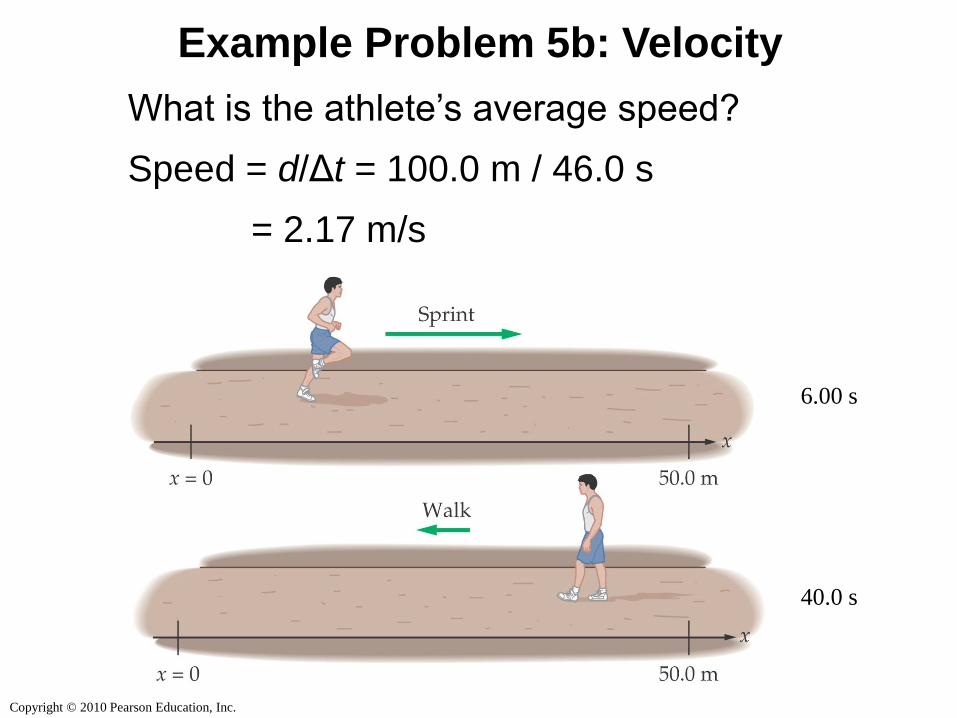
Example Problem 5b: Velocity
6.00 s
40.0 s
What is the athlete’s average speed?
Speed = d/Δt = 100.0 m / 46.0 s
= 2.17 m/s
Copyright © 2010 Pearson Education, Inc.
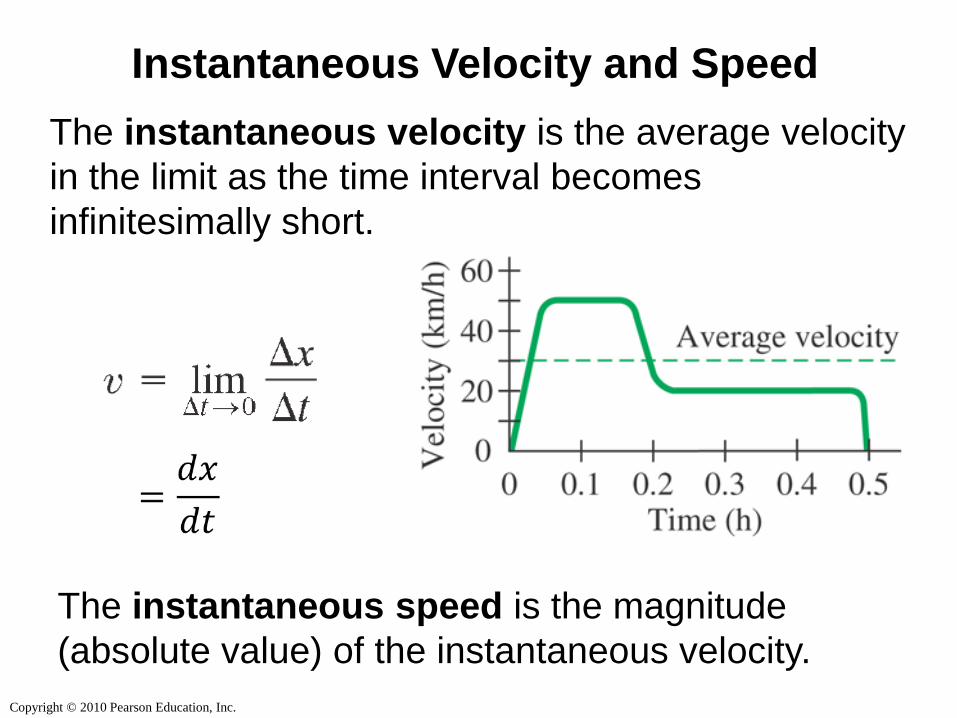
Instantaneous Velocity and Speed
The instantaneous velocity is the average velocity
in the limit as the time interval becomes
infinitesimally short.
The instantaneous speed is the magnitude
(absolute value) of the instantaneous velocity.
Copyright © 2010 Pearson Education, Inc.
If the position of a car is
zero, does its speed have to
be zero?
a) yes
b) no
c) it depends on
the position
Question 2.3 Position and Speed
Copyright © 2010 Pearson Education, Inc.
If the position of a car is
zero, does its speed have to
be zero?
a) yes
b) no
c) it depends on
the position
No, the speed does not depend on position; it depends on the change
of position. Because we know that the displacement does not depend
on the origin of the coordinate system, an object can easily start at x =
–3 and be moving by the time it gets to x = 0.
Question 2.3 Position and Speed
Copyright © 2010 Pearson Education, Inc.
Does the speedometer in a
car measure velocity or
speed?
a) velocity
b) speed
c) both
d) neither
Question 2.5 Speedometer
Copyright © 2010 Pearson Education, Inc.
Does the speedometer in a
car measure velocity or
speed?
a) velocity
b) speed
c) both
d) neither
The speedometer clearly measures speed, not velocity. Velocity is a
vector (depends on direction), but the speedometer does not care
what direction you are traveling. It only measures the magnitude of
the velocity, which is the speed.
Question 2.5 Speedometer
Follow-up: how would you measure velocity in your car?
Copyright © 2010 Pearson Education, Inc.
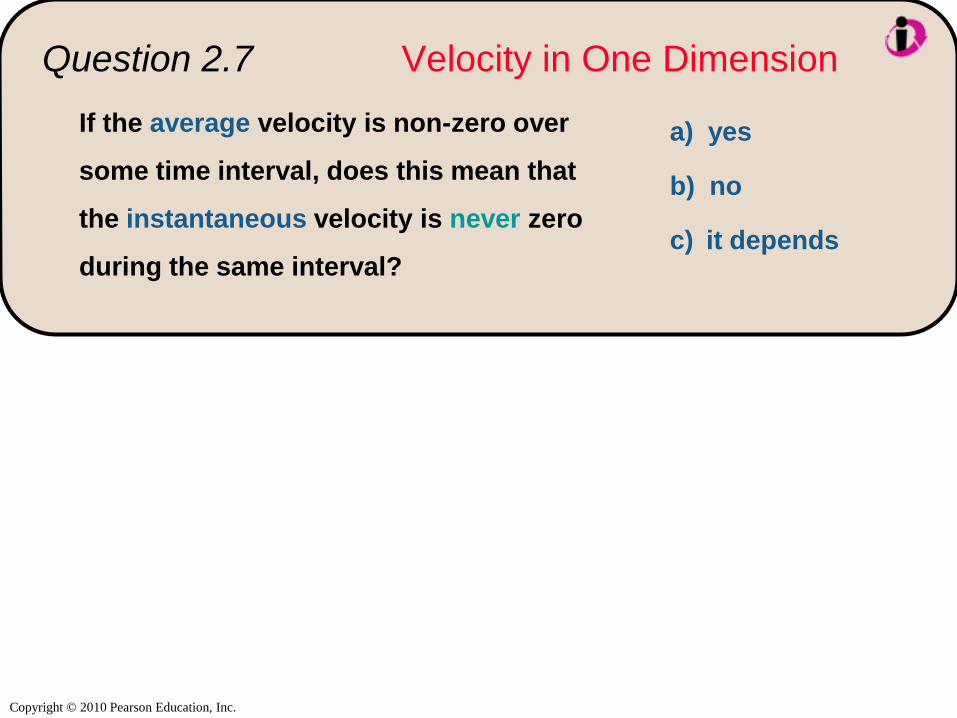
Question 2.7 Velocity in One Dimension
If the average velocity is non-zero over
some time interval, does this mean that
the instantaneous velocity is never zero
during the same interval?
a) yes
b) no
c) it depends
Copyright © 2010 Pearson Education, Inc.
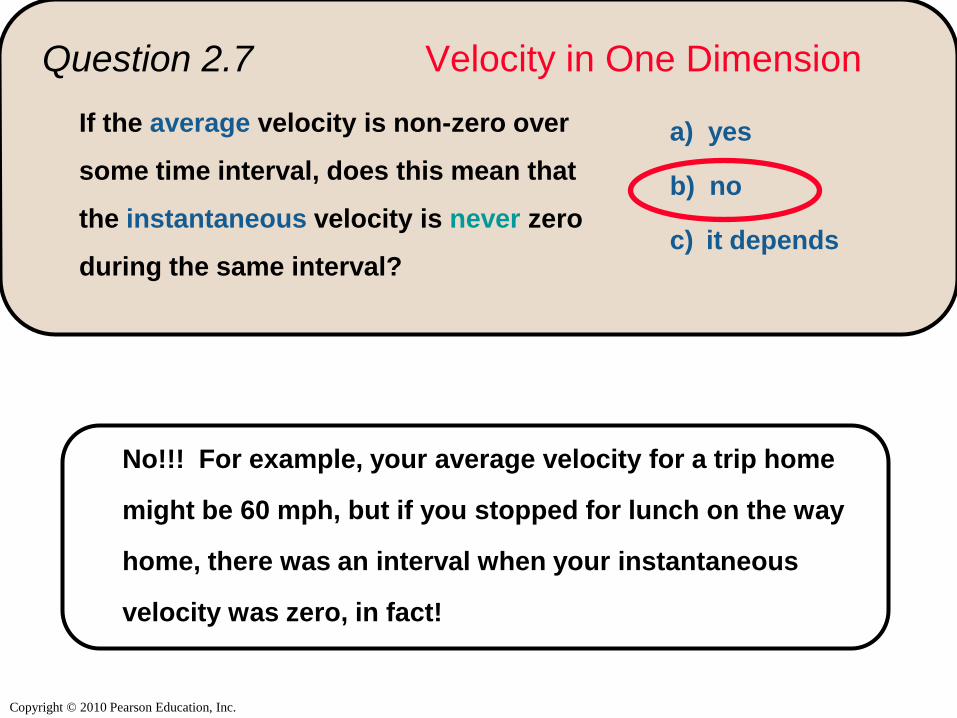
Question 2.7 Velocity in One Dimension
No!!! For example, your average velocity for a trip home
might be 60 mph, but if you stopped for lunch on the way
home, there was an interval when your instantaneous
velocity was zero, in fact!
If the average velocity is non-zero over
some time interval, does this mean that
the instantaneous velocity is never zero
during the same interval?
a) yes
b) no
c) it depends
Copyright © 2010 Pearson Education, Inc.
Position-Time Graphs
Copyright © 2010 Pearson Education, Inc.
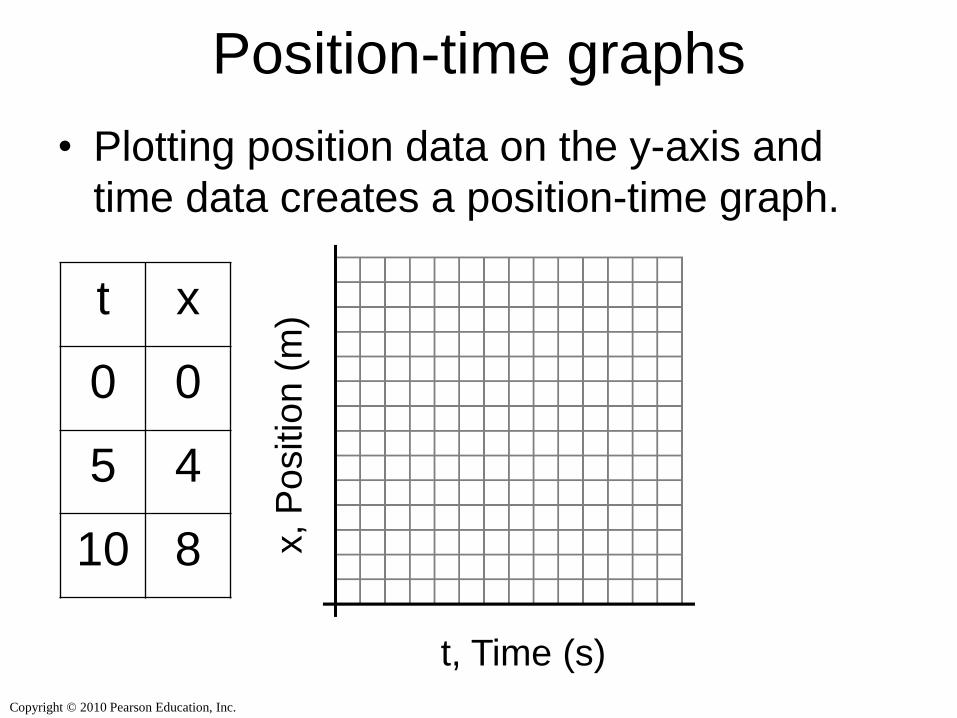
Position-time graphs
• Plotting position data on the y-axis and
time data creates a position-time graph.
t, Time (s)
x, P
ositio
n (
m) t x
0 0
5 4
10 8
Copyright © 2010 Pearson Education, Inc.
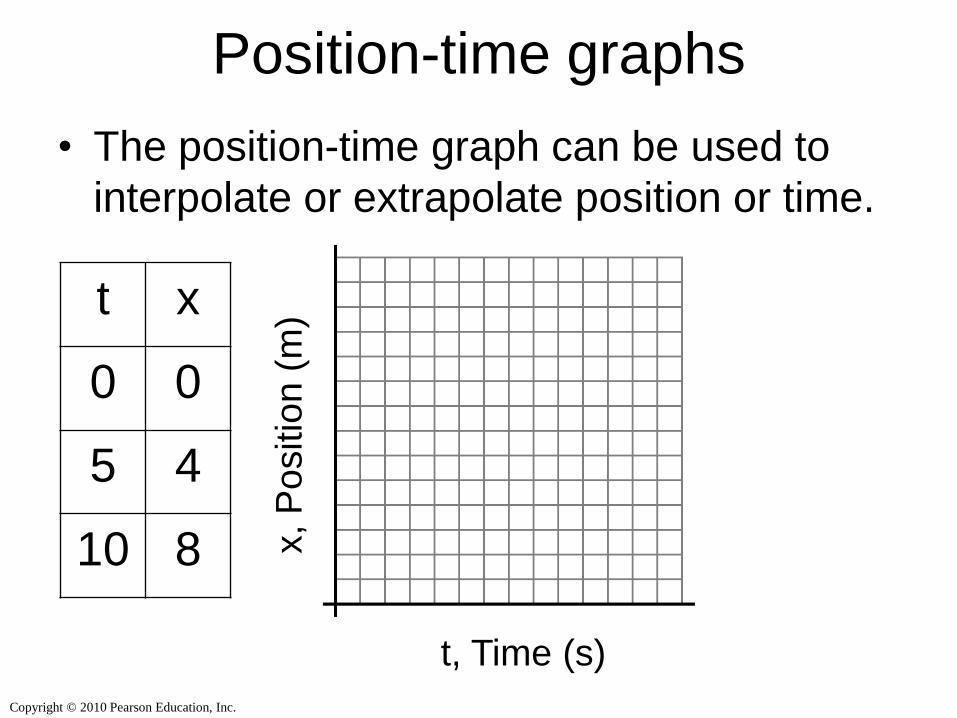
Position-time graphs
• The position-time graph can be used to
interpolate or extrapolate position or time.
t, Time (s)
x, P
ositio
n (
m) t x
0 0
5 4
10 8
Copyright © 2010 Pearson Education, Inc.
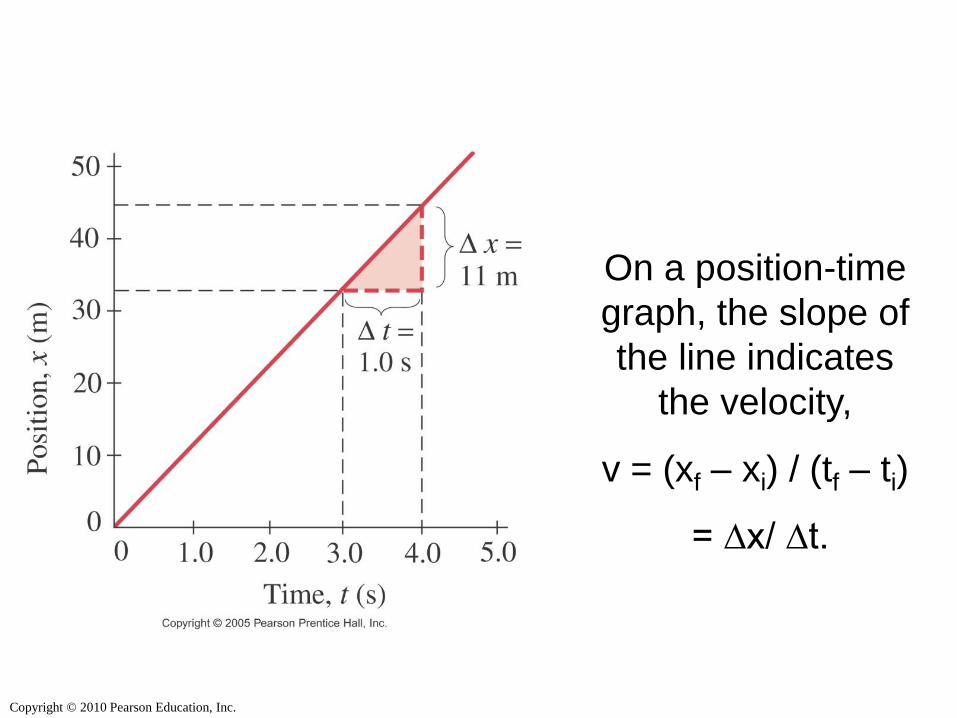
On a position-time
graph, the slope of
the line indicates
the velocity,
v = (xf – xi) / (tf – ti)
= ∆x/ ∆t.
Copyright © 2010 Pearson Education, Inc.
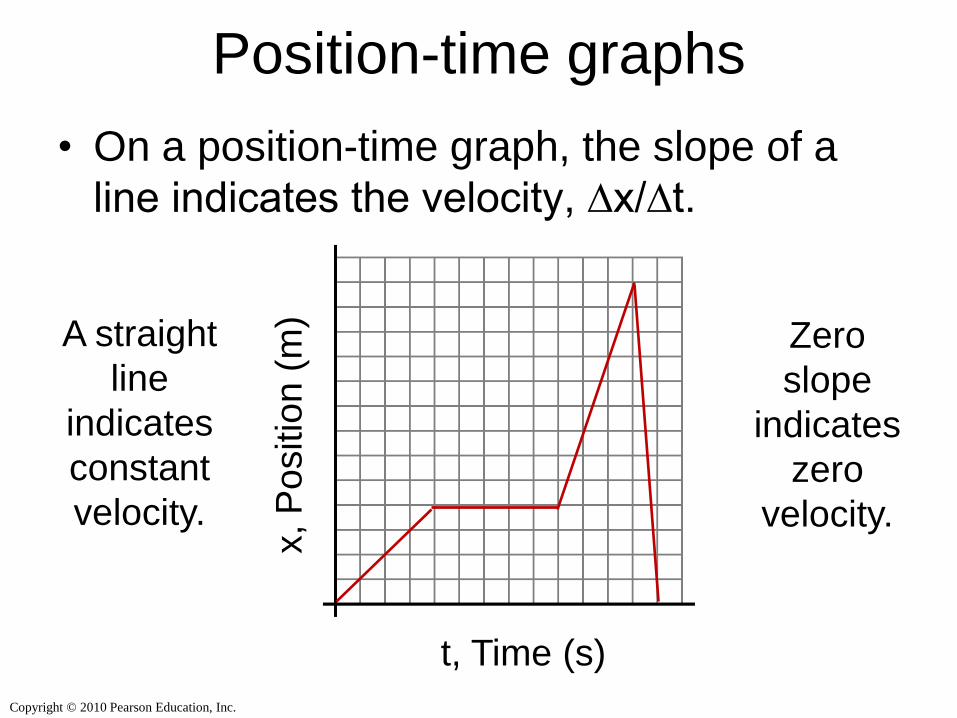
Position-time graphs
• On a position-time graph, the slope of a
line indicates the velocity, ∆x/∆t.
t, Time (s)
x, P
ositio
n (
m)
A straight
line
indicates
constant
velocity.
Zero
slope
indicates
zero
velocity.
Copyright © 2010 Pearson Education, Inc.
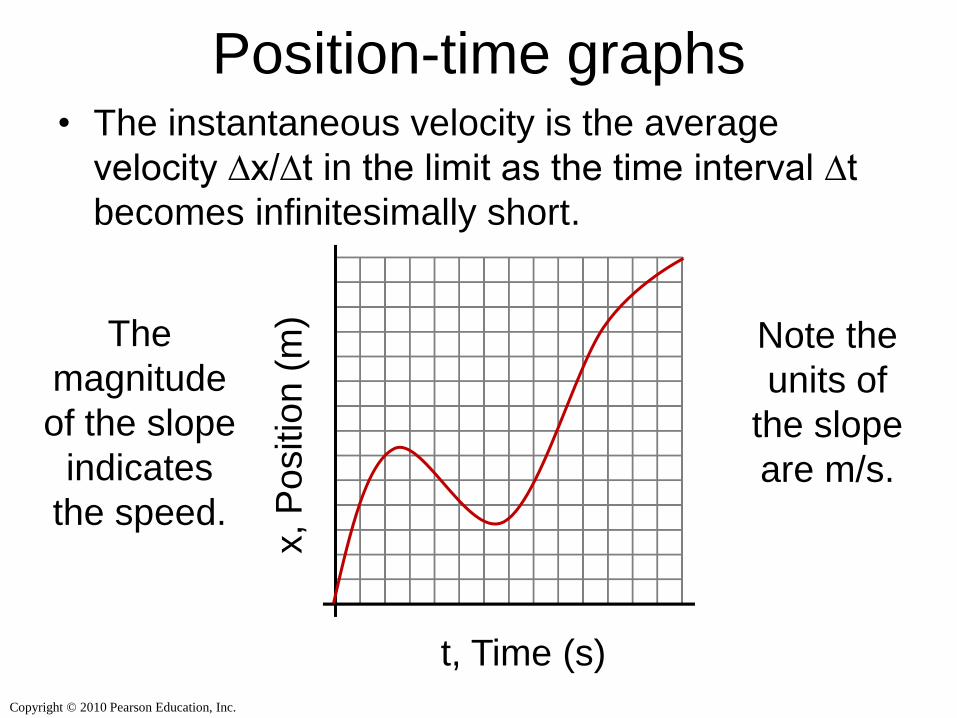
Position-time graphs • The instantaneous velocity is the average
velocity ∆x/∆t in the limit as the time interval ∆t
becomes infinitesimally short.
t, Time (s)
x, P
ositio
n (
m)
The
magnitude
of the slope
indicates
the speed.
Note the
units of
the slope
are m/s.
Copyright © 2010 Pearson Education, Inc.
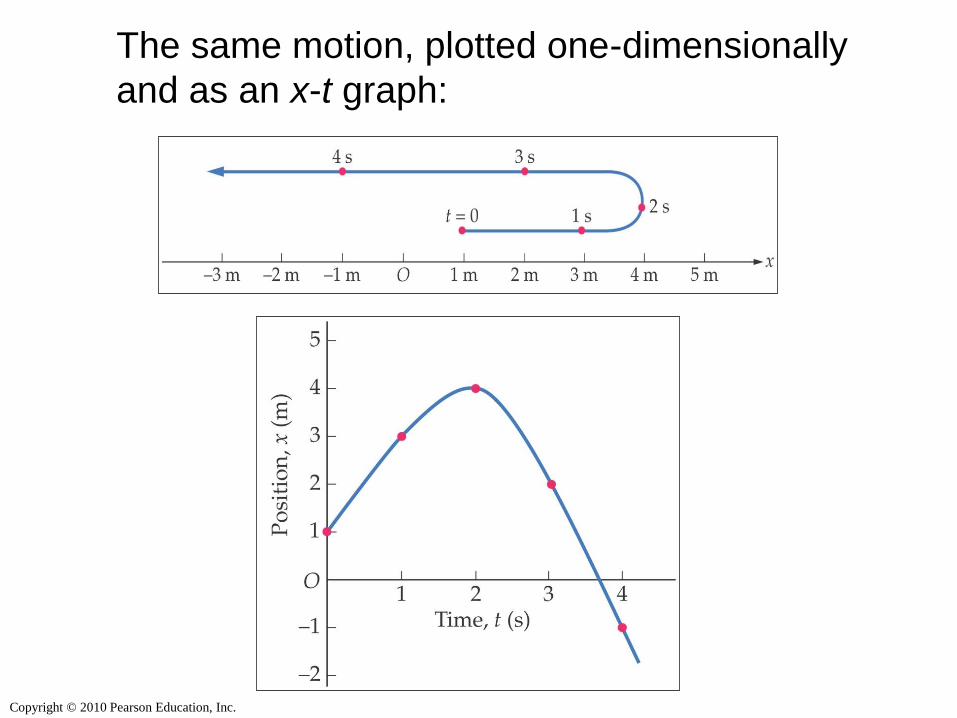
The same motion, plotted one-dimensionally
and as an x-t graph:
Copyright © 2010 Pearson Education, Inc.
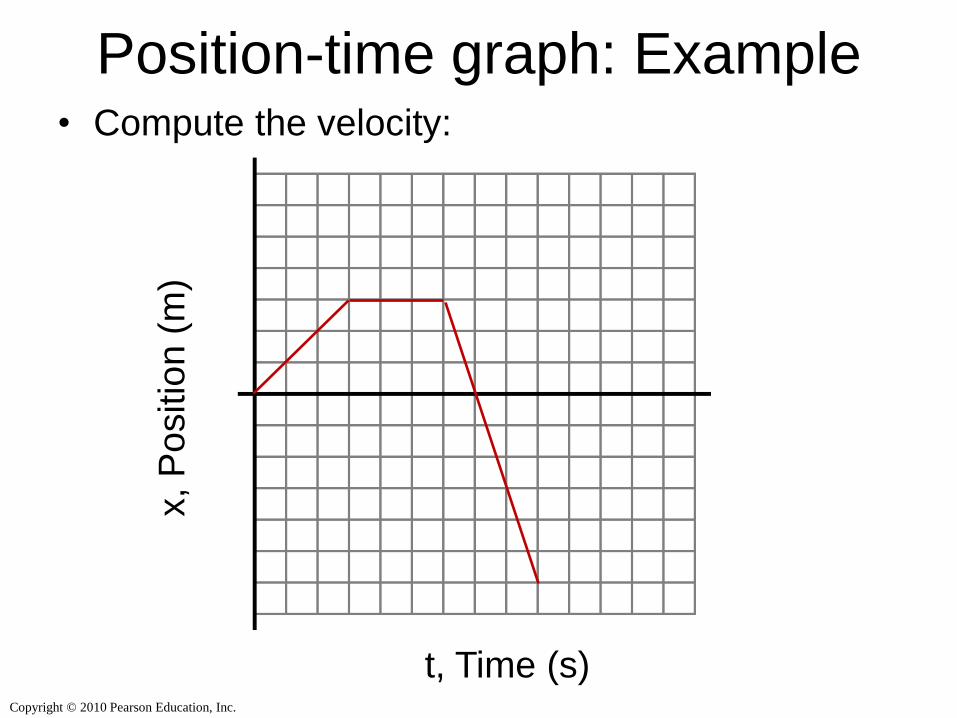
Position-time graph: Example • Compute the velocity:
t, Time (s)
x, P
ositio
n (
m)
Copyright © 2010 Pearson Education, Inc.
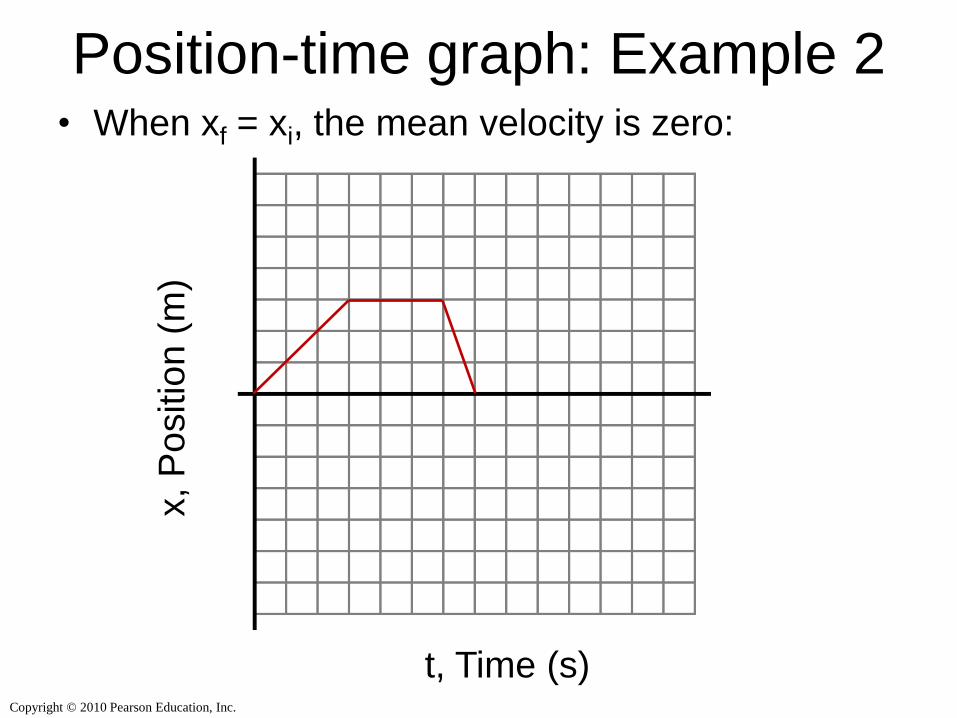
Position-time graph: Example 2 • When xf = xi, the mean velocity is zero:
t, Time (s)
x, P
ositio
n (
m)
Copyright © 2010 Pearson Education, Inc.
Equation of Motion
for Constant Velocity
Copyright © 2010 Pearson Education, Inc.
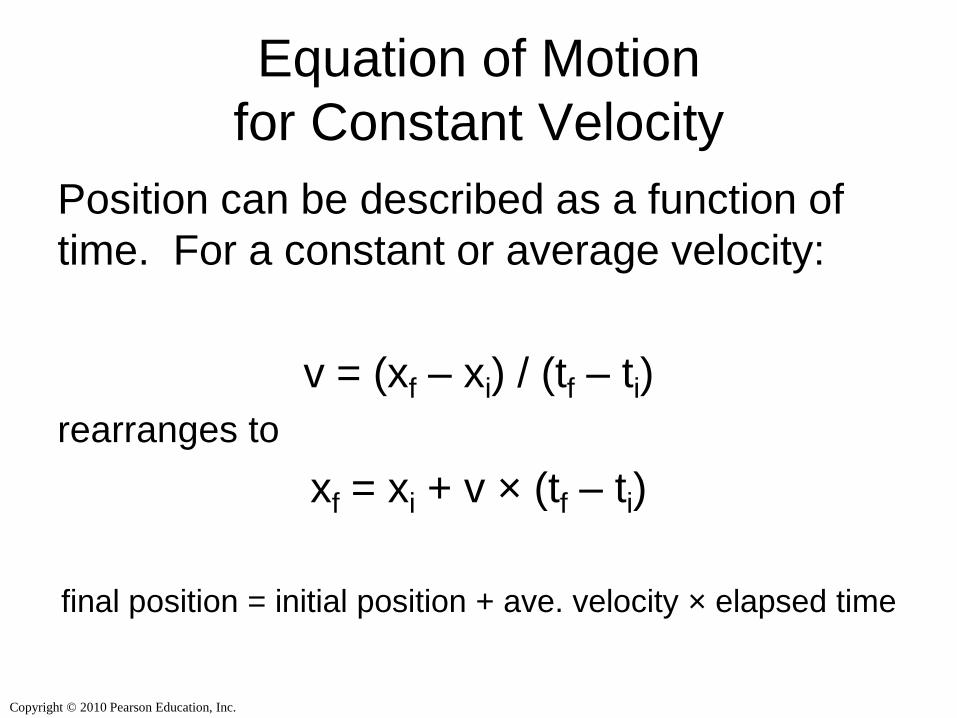
Equation of Motion
for Constant Velocity
Position can be described as a function of
time. For a constant or average velocity:
v = (xf – xi) / (tf – ti)
rearranges to
xf = xi + v × (tf – ti)
final position = initial position + ave. velocity × elapsed time
Copyright © 2010 Pearson Education, Inc.
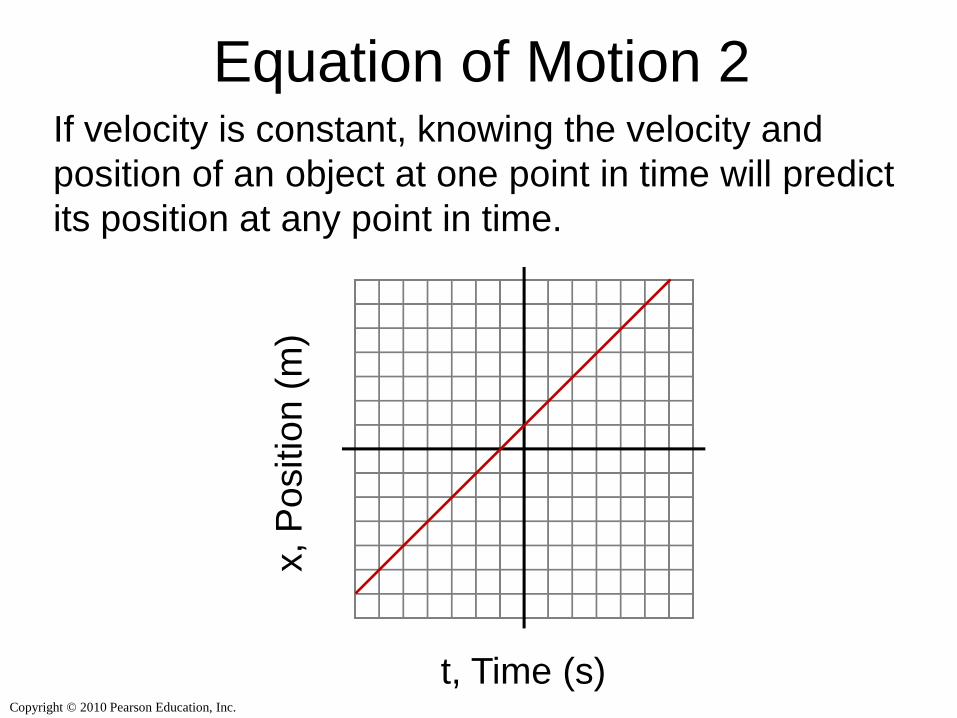
Equation of Motion 2 If velocity is constant, knowing the velocity and
position of an object at one point in time will predict
its position at any point in time.
x, P
ositio
n (
m)
t, Time (s)
Copyright © 2010 Pearson Education, Inc.
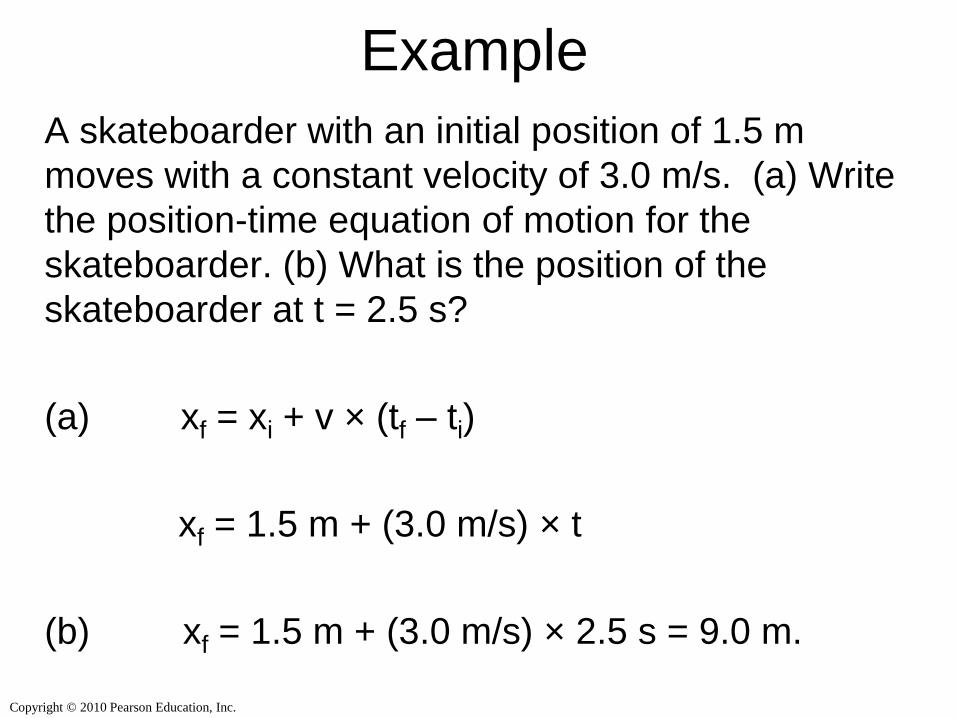
Example
A skateboarder with an initial position of 1.5 m
moves with a constant velocity of 3.0 m/s. (a) Write
the position-time equation of motion for the
skateboarder. (b) What is the position of the
skateboarder at t = 2.5 s?
(a) xf = xi + v × (tf – ti)
xf = 1.5 m + (3.0 m/s) × t
(b) xf = 1.5 m + (3.0 m/s) × 2.5 s = 9.0 m.
Copyright © 2010 Pearson Education, Inc.
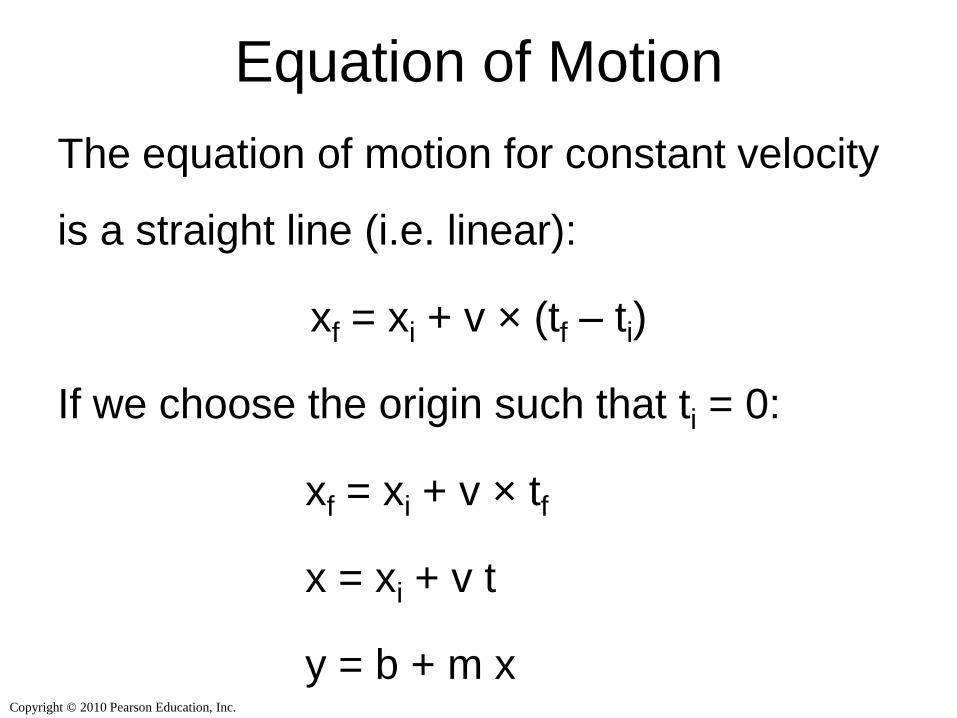
Equation of Motion
The equation of motion for constant velocity
is a straight line (i.e. linear):
xf = xi + v × (tf – ti)
If we choose the origin such that ti = 0:
xf = xi + v × tf
x = xi + v t
y = b + m x
Copyright © 2010 Pearson Education, Inc.
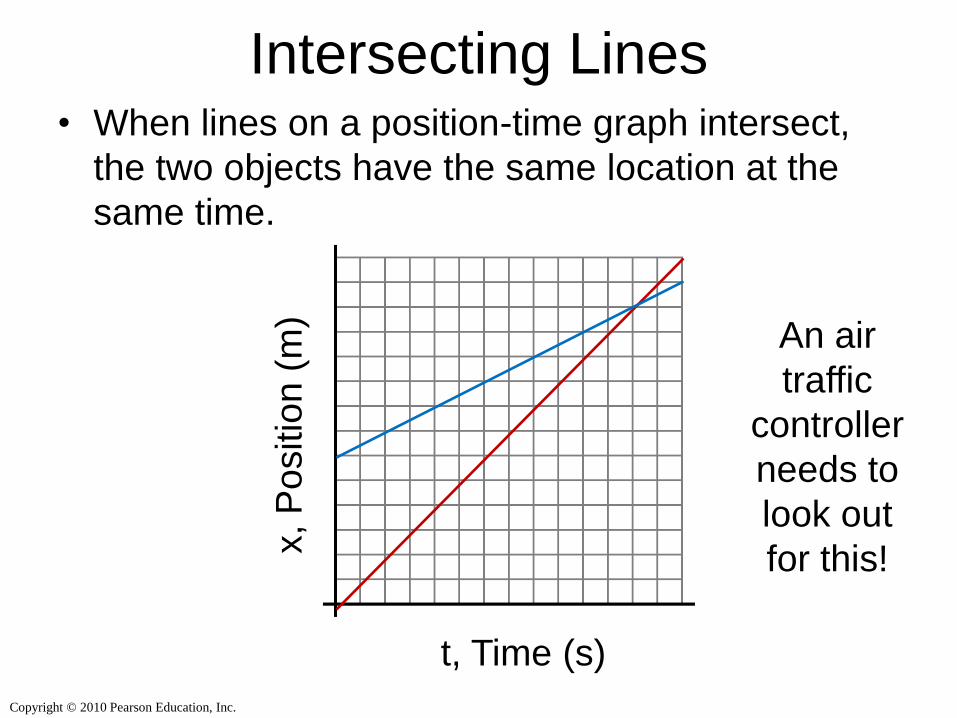
Intersecting Lines • When lines on a position-time graph intersect,
the two objects have the same location at the
same time.
t, Time (s)
x, P
ositio
n (
m)
An air
traffic
controller
needs to
look out
for this!
Copyright © 2010 Pearson Education, Inc.
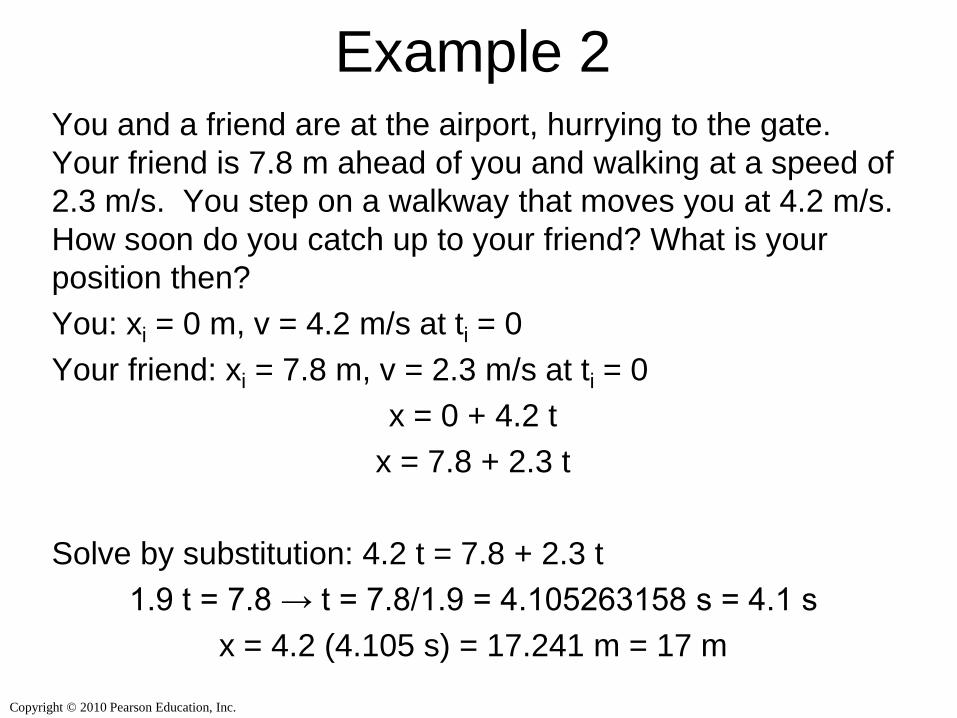
Example 2 You and a friend are at the airport, hurrying to the gate.
Your friend is 7.8 m ahead of you and walking at a speed of
2.3 m/s. You step on a walkway that moves you at 4.2 m/s.
How soon do you catch up to your friend? What is your
position then?
You: xi = 0 m, v = 4.2 m/s at ti = 0
Your friend: xi = 7.8 m, v = 2.3 m/s at ti = 0
x = 0 + 4.2 t
x = 7.8 + 2.3 t
Solve by substitution: 4.2 t = 7.8 + 2.3 t
1.9 t = 7.8 → t = 7.8/1.9 = 4.105263158 s = 4.1 s
x = 4.2 (4.105 s) = 17.241 m = 17 m
Copyright © 2010 Pearson Education, Inc.
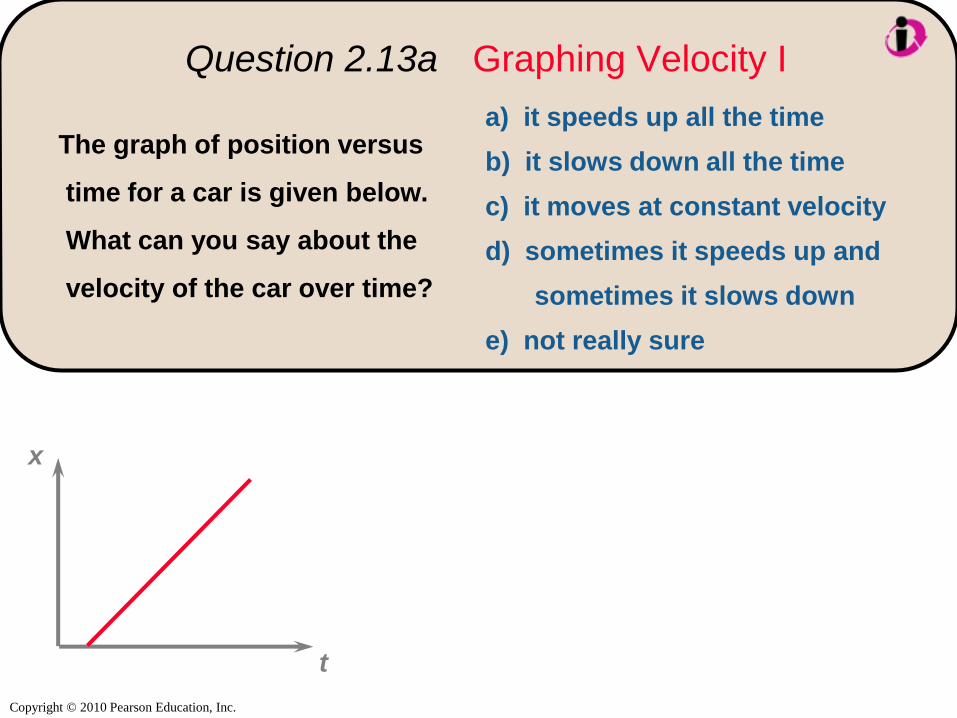
Question 2.13a Graphing Velocity I
t
x
The graph of position versus
time for a car is given below.
What can you say about the
velocity of the car over time?
a) it speeds up all the time
b) it slows down all the time
c) it moves at constant velocity
d) sometimes it speeds up and
sometimes it slows down
e) not really sure
Copyright © 2010 Pearson Education, Inc.
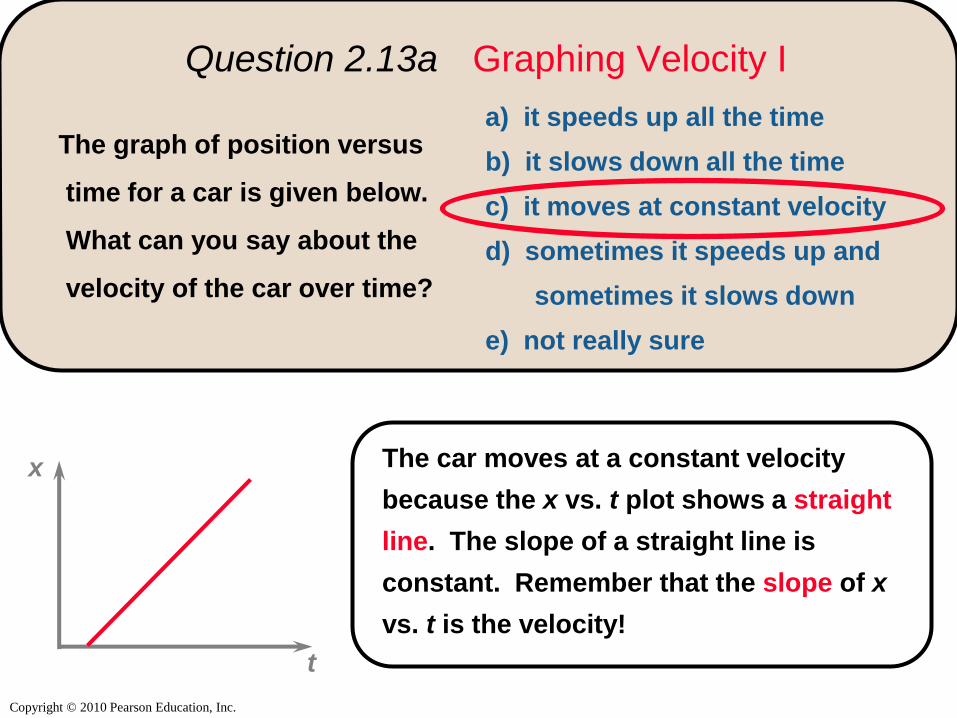
Question 2.13a Graphing Velocity I
t
x
The graph of position versus
time for a car is given below.
What can you say about the
velocity of the car over time?
The car moves at a constant velocity
because the x vs. t plot shows a straight
line. The slope of a straight line is
constant. Remember that the slope of x
vs. t is the velocity!
a) it speeds up all the time
b) it slows down all the time
c) it moves at constant velocity
d) sometimes it speeds up and
sometimes it slows down
e) not really sure
Copyright © 2010 Pearson Education, Inc.
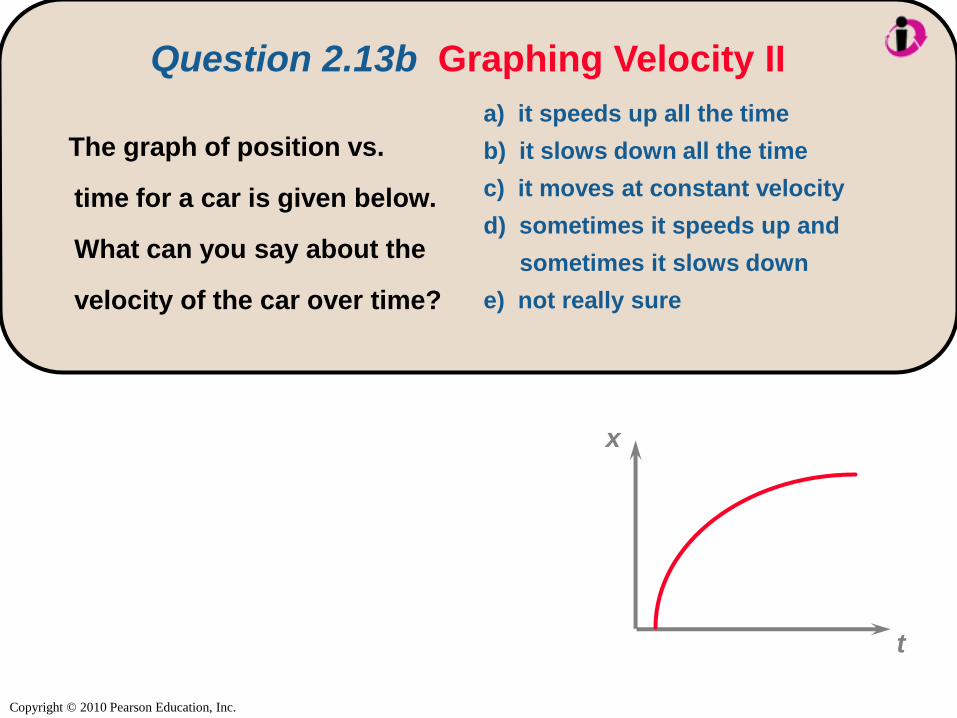
t
x
a) it speeds up all the time
b) it slows down all the time
c) it moves at constant velocity
d) sometimes it speeds up and
sometimes it slows down
e) not really sure
The graph of position vs.
time for a car is given below.
What can you say about the
velocity of the car over time?
Question 2.13b Graphing Velocity II
Copyright © 2010 Pearson Education, Inc.
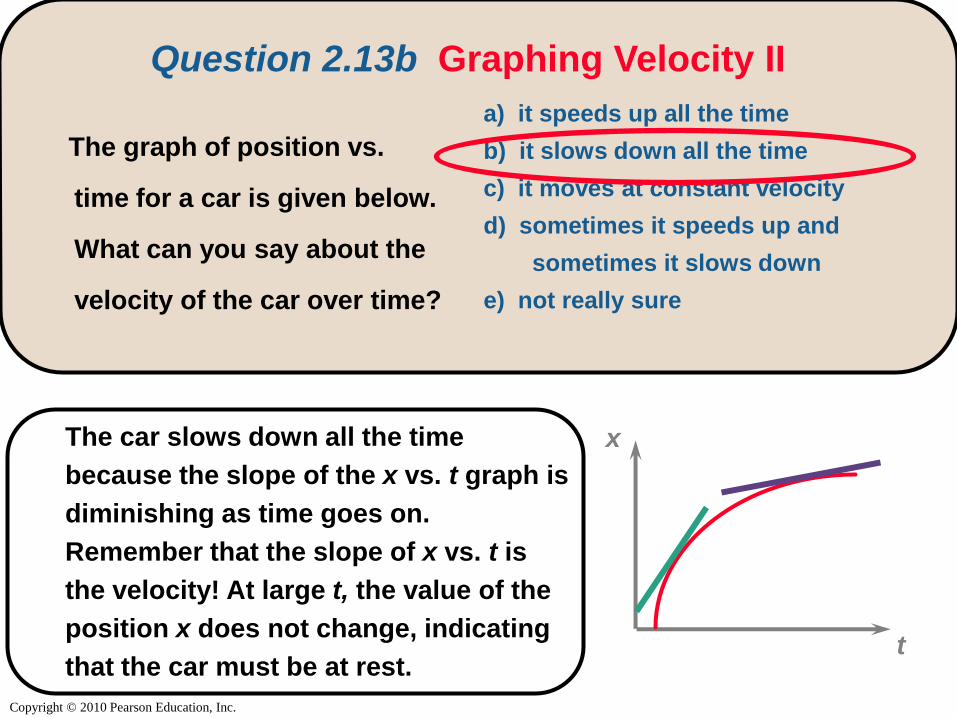
a) it speeds up all the time
b) it slows down all the time
c) it moves at constant velocity
d) sometimes it speeds up and
sometimes it slows down
e) not really sure
x
The graph of position vs.
time for a car is given below.
What can you say about the
velocity of the car over time?
The car slows down all the time
because the slope of the x vs. t graph is
diminishing as time goes on.
Remember that the slope of x vs. t is
the velocity! At large t, the value of the
position x does not change, indicating
that the car must be at rest. t
Question 2.13b Graphing Velocity II
Copyright © 2010 Pearson Education, Inc.
Does Time Exist?
• Opinion 1: “The past no longer exists, the future does not
yet exist; only the present exists.”
– “Time” is how we measure change.
• Opinion 2: Time exists.
– How else could the speed of light (in m/s) be a
universal constant?
– All physical matter exists in 3 dimensions of space,
time and mass/energy.
• In any case:
– Time is a unique dimension; it is unidirectional and
moving.
– Practically, treating Time as a dimension is expedient:
it allows us to predict the future and diagnose the
past, which is what we want to know.
Copyright © 2010 Pearson Education, Inc.
Car Lab
or Acceleration Lab p 48