chapter 2: millennium development goals · as shown in chapter 1, environmental goods and services...
TRANSCRIPT

41
“Achieving MDG 7 is an important precondition
for achieving all the other MDGs”
-Achim SteinerUnited Nations Under-Secretary General
Executive Director of the United Nations
Environment Programme (UNEP) 2006
(Steiner 2006)
This chapter has a special focus: it assesses Kenya’s progress towards achieving the targets associated
with the Millennium Development Goals. As shown in Chapter 1, environmental goods and services
underpin economic and social development; thus maintaining and improving the environment’s
viability is essential for Kenya to be able to adequately support its growing population and achieve its
development plans. In its efforts to achieve Vision 2030, the Government of Kenya is working towards a
long-term plan based on the Millennium Development Goals (MDGs). In addition to increasing budgetary
allocation for them and tracking and monitoring progress, it has undertaken a number of capacity-building and
sensitization activities at the district level. This chapter notes how Kenya has made important strides towards
achieving some of the MDG targets, while reversing environmental degradation remains a major challenge.
The Millennium Declaration The eight Millennium Development Goals (MDGs) (Table 1 on the following page) provide a framework to
plan and implement development, and include time-bound targets and indicators by which progress can be
measured over the period from 1990 until 2015 when the targets are expected to be met. Each year, the United
Nations Secretary-General presents a report to the United Nations General Assembly on progress achieved
towards implementing the Declaration, based on the 60 selected indicators and 21 targets aggregated at global
and regional levels.
By 2008, it was apparent that no African country was likely to achieve all of its goals by 2015. The
international community strengthened partnerships with Africa at the highest level to ensure that its
development needs are mainstreamed in the global economy. Numerous environmental, social, and political
constraints, however, continuously pose signifi cant challenges to achieving the MDGs in Africa (IISD 2008).
Figure 1 shows the proportion of sub-Saharan countries that had attained various levels of seven of the MDGs.
Chapter 2: Millennium Development Goals
PrimaryCompletion
Sanitationaccess
Gender(primary)
Gender(secondary)
Childmortality
Birthsattended
Wateraccess
-100
100
-50
0
50
Insufficient data
Achieved target
On-track to meet target
Off-track to meet target
Seriously off-track to meet target
Progress Assessment:
perc
enta
ge
Figure 1: Sub-Saharan Africa's progress towards MDG targets
(Source: World Bank 2008)
Painted face and headdress of a
Kikuyu tribeswoman
The Kikuyu make up the largest
tribal population in Kenya. There
are about 5 347 000 Kikuyu people
in Kenya, equal to about 22 per cent
of Kenya's total population. By
tradition, the Kikuyu are farmers;
their homelands in the foothills of
Mt. Kenya and highlands on either
side of the Rift Valley are some of the
most intesively farmed areas of the
country (Gordon 2005, CIA 1996).

42Table 1: The MDGs and their associated targets and indicators
Goals and Targets (from the Millennium Declaration) Indicators for monitoring progress
Goal 1: Eradicate extreme poverty and hunger
Target 1.A: Halve, between 1990 and 2015, the proportion 1.1 Proportion of population below $1 (PPP) per daya
of people whose income is less than one dollar a day 1.2 Poverty gap ratio
1.3 Share of poorest quintile in national consumption
Target 1.B: Achieve full and productive employment and decent work for all, 1.4 Growth rate of GDP per person employed
including women and young people 1.5 Employment-to-population ration
1.6 Proportion of employed people living below $1 (PPP) per day
1.7 Proportion of own-account and contributing family workers in total employment
Target 1.C: Halve, between 1990 and 2015, the proportion 1.8 Prevalence of underweight children under-fi ve years of age
of people who suff er from hunger 1.9 Proportion of population below minimum level of dietary energy consumption
Goal 2: Achieve universal primary education
Target 2.A: Ensure that, by 2015, children everywhere, 2.1 Net enrolment ratio in primary education
boys and girls alike, will be able to complete a full course 2.2 Proportion of pupils starting grade 1 who reach grade 5
of primary schooling 2.3 Literacy rate of 15-24 year-olds
Goal 3: Promote gender equality and empower women
Target 3.A: Eliminate gender disparity in primary and 3.1 Ratios of girls to boys in primary, secondary and tertiary education
secondary education, preferably by 2005, and in all levels 3.2 Share of women in wage employment in the non-agricultural sector
of education no later than 2015 3.3 Proportion of seats held by women in national parliament
Goal 4: Reduce child mortality
Target 4.A: Reduce by two-thirds, between 1990 and 2015, 4.1 Under-fi ve mortality rate
the under-fi ve mortality rate 4.2 Infant mortality rate
4.3 Proportion of one year-old children immunised against measles
Goal 5: Improve maternal health
Target 5.A: Reduce by three-quarters, between 1990 and 5.1 Maternal mortality ratio
2015, the maternal mortality ratio 5.2 Proportion of births attended by skilled health personnel
Target 5.B: Achieve, by 2015, universal access to 5.3 Contraceptive prevalence rate
reproductive health 5.4 Adolescent birth rate
5.5 Antenatal care coverage (at least one visit and at least four visits)
5.6 Unmet need for family planning
Goal 6: Combat HIV/AIDS, malaria and other diseases
Target 6.A: Have halted by 2015 and begun to reverse the spread of HIV/AIDS 6.1 HIV prevalence among population aged 15-24 years
6.2 Condom use at last high-risk sex
6.3 Proportion of population aged 15-24 years with comprehensive correct knowledge of HIV/AIDS
6.4 Ratio of school attendance of orphans to school attendance of non-orphans aged 10-14 years
Target 6.B: Achieve, by 2010, universal access to treatment for HIV/AIDS for 6.5 Proportion of population with advanced HIV infection with access to antiretroviral drugs
all who need it
Target 6.C: Have halted by 2015 and begun to reverse 6.6 Incidence and death rates associated with malaria
the incidence of malaria and other major diseases 6.7 Proportion of children under 5 sleeping under insecticide-treated bednets
6.8 Proportion of children under 5 with fever who are treated with appropriate anti-malarial drugs
6.9 Incidence, prevalence and death rates associated with tuberculosis
6.10 Proportion of tuberculosis cases detected and cured under directly observed treatment short course
Goal 7: Ensure environmental sustainability
Target 7.A: Integrate the principles of sustainable 7.1 Proportion of land area covered by forest
development into country policies and programmes 7.2 CO2 emissions, total, per capita and per $1 GDP (PPP)
and reverse the loss of environmental resources 7.3 Consumption of ozone-depleting substances
7.4 Proportion of fi sh stocks within safe biological limits
7.5 Proportion of total water resources
Target 7.B: Reduce biodiversity loss, achieving, by 2010, a signifi cant 7.6 Proportion of terrestrial and marine areas protected
reduction in the rate of loss 7.7 Proportion of species threatened with extinction
Target 7.C: Halve, by 2015, the proportion of people without sustainable 7.8 Proportion of population using an improved water source
access to safe drinking water and basic sanitation 7.9 Proportion of population using an improved sanitation facility
Target 7.D: By 2020, to have achieved a signifi cant improvement in 7.10 Proportion of urban population living in slumsb
the lives of at least 100 million slum dwellers
Goal 8: Develop a global partnership for development
Target 8.A: Develop further an open, rule-based, predictable, non-discriminatory Some of the indicators listed below are monitored separately for the least developed countries (LDCs), Africa,
trading and fi nancial system landlocked developing countries and small island developing States.
Includes a commitment to good governance, development and Offi cial development assistance (ODA)
poverty reduction—both nationally and internationally 8.1. Net ODA, total and to the least developed countries, as percentage of OECD/DAC donors’ gross national income
Target 8.B: Address the special needs of the least developed countries 8.2. Proportion of total bilateral, sector-allocable ODA of OECD/DAC donors to basic social services (basic
education, primary health care, nutrition, safe water and sanitation)
Includes: tariff and quota free access for the least 8.3 Proportion of bilateral offi cial development assistance of OECD/DAC donors that is untied
developed countries’ exports; enhanced programme of 8.4 ODA received in landlocked developing countries as a proportion of their gross national incomes
debt relief for heavily indebted poor countries (HIPC) and 8.5 ODA received in small island developing States as a proportion of their gross national incomes
cancellation of offi cial bilateral debt; and more generous
ODA for countries committed to poverty reduction Market access
8.6 Proportion of total developed country imports (by value and excluding arms) from developing countries
Target 8.C: Address the special needs of landlocked and least developed countries, admitted free of duty
developing countries and small island developing 8.7 Average tariff s imposed by developed countries on agricultural products and textiles and clothing
States (through the Programme of Action for the from developing countries
Sustainable Development of Small Island Developing 8.8 Agricultural support estimate for OECD countries as a percentage of their gross domestic product
States and the outcome of the twenty-second special 8.9 Proportion of ODA provided to help build trade capacity
session of the General Assembly)
Target 8.D: Deal comprehensively with the debt problems of Debt sustainability
developing countries through national and international 8.10 Total number of countries that have reached their HIPC decision points and number that have reached their
measures in order to make debt sustainable in the long term. HIPC completion points (cumulative)
8.11 Debt relief committed under HIPC and MDRI Initiatives
8.12 Debt service as a percentage of exports of goods and services
Target 8.E: In cooperation with pharmaceutical companies, provide 8.13 Proportion of population with access to aff ordable essential drugs on a sustainable basis
access to aff ordable essential drugs in developing countries
Target 8.F: In cooperation with the private sector, make available the 8.14 Telephone lines per 100 population
benefi ts of new technologies, especially information and communications 8.15 Cellular subscribers per 100 population
8.16 Internet users per 100 population
The Millennium Development Goals and targets come from the Millennium Declaration, signed by 189 countries, including
147 heads of State and Government, in September 2000 (http://www.un.org/millennium/declaration/ares552e.htm) and
from further agreement by member states at the 2005 World Summit (Resolution adopted by the General
Assembly—A/RES/60/1, http://www.un.org/Docs/journal/asp/ws.asp?m=A/RES/60/1). The goals and targets are interrelated
and should be seen as a whole. They represent a partnership between the developed countries and the developing countries
“to create an environment—at the national and global levels alike —which is conducive to development and the elimination of poverty”.
a For monitoring country poverty trends, indicators based on national poverty lines should be used, where available.
b The actual proportion of people living in slums is measured by a proxy, represented by the urban population living in households
with at least one of the four characteristics: (a) lack of access to improved water supply; (b) lack of access to improved sanitation;
(c) overcrowding (3 or more person per room); and (d) dwellings made of non-durable material. Source: UN 2007b
42

43
Environmental Links to the MDGsEnvironmental resources and conditions have a signifi cant impact on many aspects of poverty and
development, and achieving environmental sustainability is fundamental to achieving all of the MDGs. One
of the most powerful ways to help achieve the fi rst MDG — eradicate extreme poverty and hunger — is to
ensure environmental quality and quantity is maintained in the long term (Table 2).
Table 2: Key links between the environment and the MDGs
MDG 1: Eradicate poverty and hunger Poor people often depend on natural resources and ecosystems
for income and livelihoods (food, shelter, medicine, water, etc.).
The economy of the poorest countries often relies on natural
resources exports, such as agricultural commodities and raw
materials, and ecotourism.
MDG 2: Universal primary education Time spent collecting water and fuelwood by children—
especially girls, and especially during droughts—can reduce
the time at school or prevent school attendance.
MDG 3: Gender equality Time spent collecting water and fuelwood by women can
reduce the time for schooling, undertaking income-generating
activities, and participating in community decision-making.
Unequal access to land and other natural resources limits
possibilities for decision-making and empowerment.
MDG 4: Reduce child mortality Children are more vulnerable to environment-related health
problems because their immune systems are not fully
developed and their metabolisms are diff erent from those of
adults. Environment-related diseases (diarrhoea, acute
respiratory infection, leukaemia, childhood cancer, etc.) are
primary causes of child mortality. Increasing the provision of
clean, accessible water (MDG 7) can signifi cantly decrease
child mortality (MDG 4) and fatal diseases (MDG 6), making it
possible for children and women to go to school (MDGs 2
and 3).
MDG 5: Improve maternal health Exposure to indoor air pollution and carrying heavy loads of
water and fuelwood negatively aff ect women’s health, can
make women less fi t for childbirth, and put them at greater risk
of complications during pregnancy.
MDG 6: Combat disease Most diseases in developing countries are environmental in
origin, as specifi c environmental conditions may contribute to
the growth and the spread of illnesses and limit access to
treatment facilities and supplies. For example, a range of
environmental factors aff ect malaria, since stagnated water
and increasing temperatures associated with climate change
create favourable conditions for disease-carrying mosquitoes.
Undisturbed forests also harbour fewer malaria vectors,
thereby reducing exposure to disease.
(Source: UNDP 2006)
Joh
an
ne
s A
kiw
um
i/U
NE
P
Lush vegetation in forest understory provides biodiversity
44
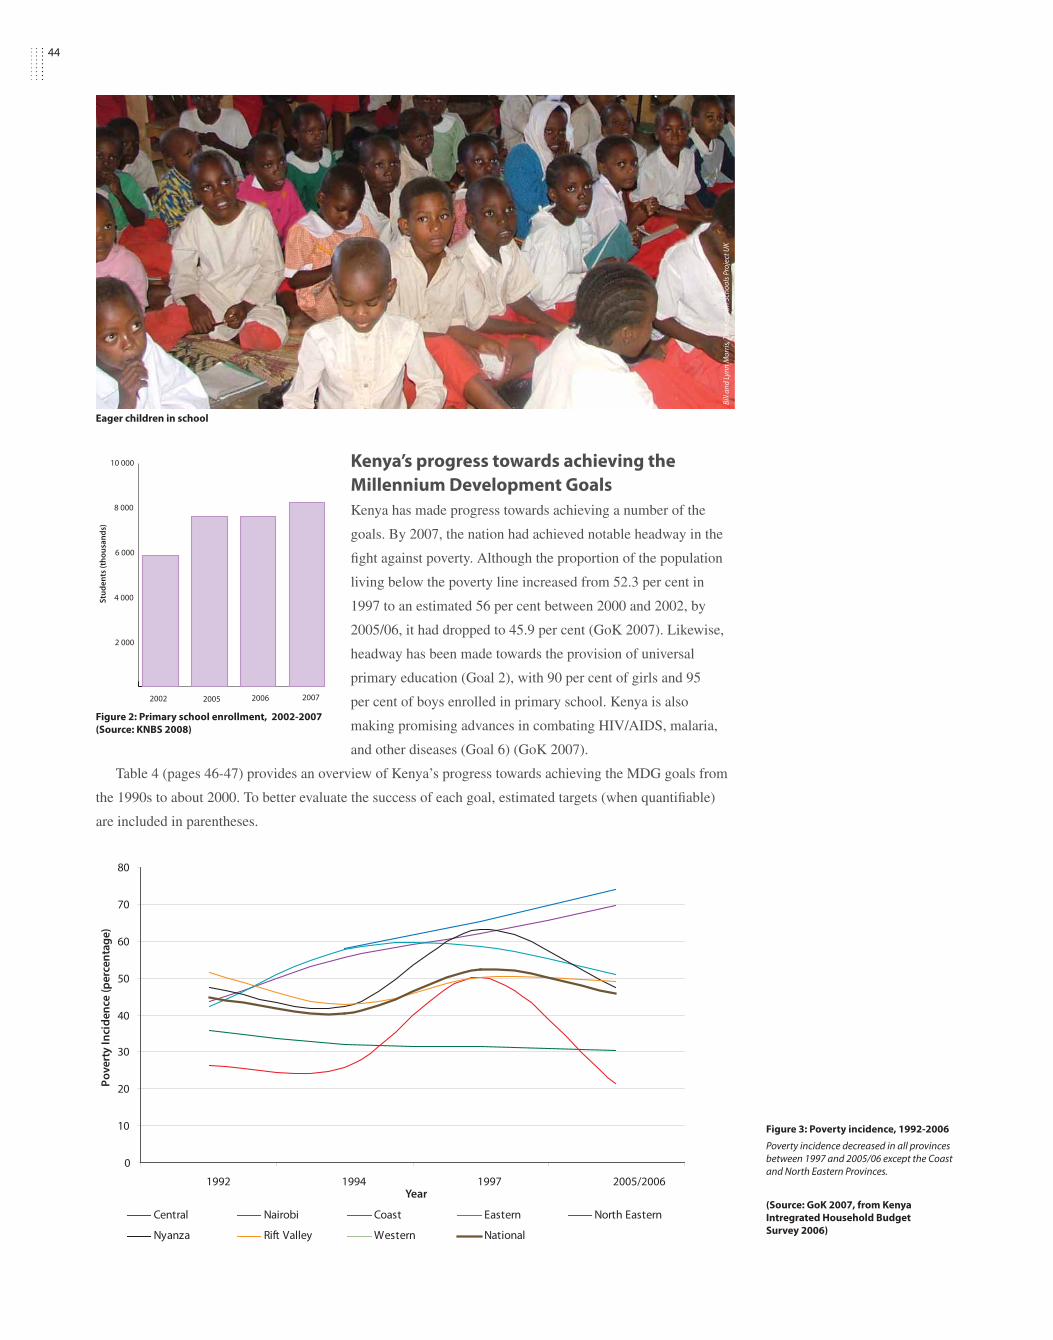
Kenya’s progress towards achieving the
Millennium Development Goals
Kenya has made progress towards achieving a number of the
goals. By 2007, the nation had achieved notable headway in the
fi ght against poverty. Although the proportion of the population
living below the poverty line increased from 52.3 per cent in
1997 to an estimated 56 per cent between 2000 and 2002, by
2005/06, it had dropped to 45.9 per cent (GoK 2007). Likewise,
headway has been made towards the provision of universal
primary education (Goal 2), with 90 per cent of girls and 95
per cent of boys enrolled in primary school. Kenya is also
making promising advances in combating HIV/AIDS, malaria,
and other diseases (Goal 6) (GoK 2007).
Table 4 (pages 46-47) provides an overview of Kenya’s progress towards achieving the MDG goals from
the 1990s to about 2000. To better evaluate the success of each goal, estimated targets (when quantifi able)
are included in parentheses.
Stu
de
nts
(th
ou
san
ds)
2 000
10 000
8 000
6 000
4 000
2006 2007 2005 2002
Figure 2: Primary school enrollment, 2002-2007
(Source: KNBS 2008)
Figure 3: Poverty incidence, 1992-2006
Poverty incidence decreased in all provinces
between 1997 and 2005/06 except the Coast
and North Eastern Provinces.
(Source: GoK 2007, from Kenya
Intregrated Household Budget
Survey 2006)
Bill
an
d L
ynn
Mo
rris
, Th
e K
enya
n S
cho
ols
Pro
ject
UK
0
10
20
30
40
50
60
70
80
1992 1994 1997 2005/2006
Central Nairobi Coast Eastern North Eastern
Nyanza Rift Valley Western National
Po
ve
rty
In
cid
en
ce (
pe
rce
nta
ge
)
Year
Eager children in school
45
Kenya’s progress towards MDG 7: Ensure Environmental Sustainability
Kenya’s environment has suffered from the impacts of human activities. Deforestation, land degradation,
and water pollution are some of the challenges the nation needs to address in order to achieve MDG 7.
The nation, however, has increased the proportion of land area protected for biological diversity from 12.1
per cent in 1990 to 12.7 per cent in 2007. A number of social and political factors continue to put pressure
on natural resources and compromise the effective implementation of sustainable development strategies
in Kenya. They include limited government capacity for environmental management and insuffi cient
institutional and legal frameworks for enforcement and coordination (UNDP 2005).
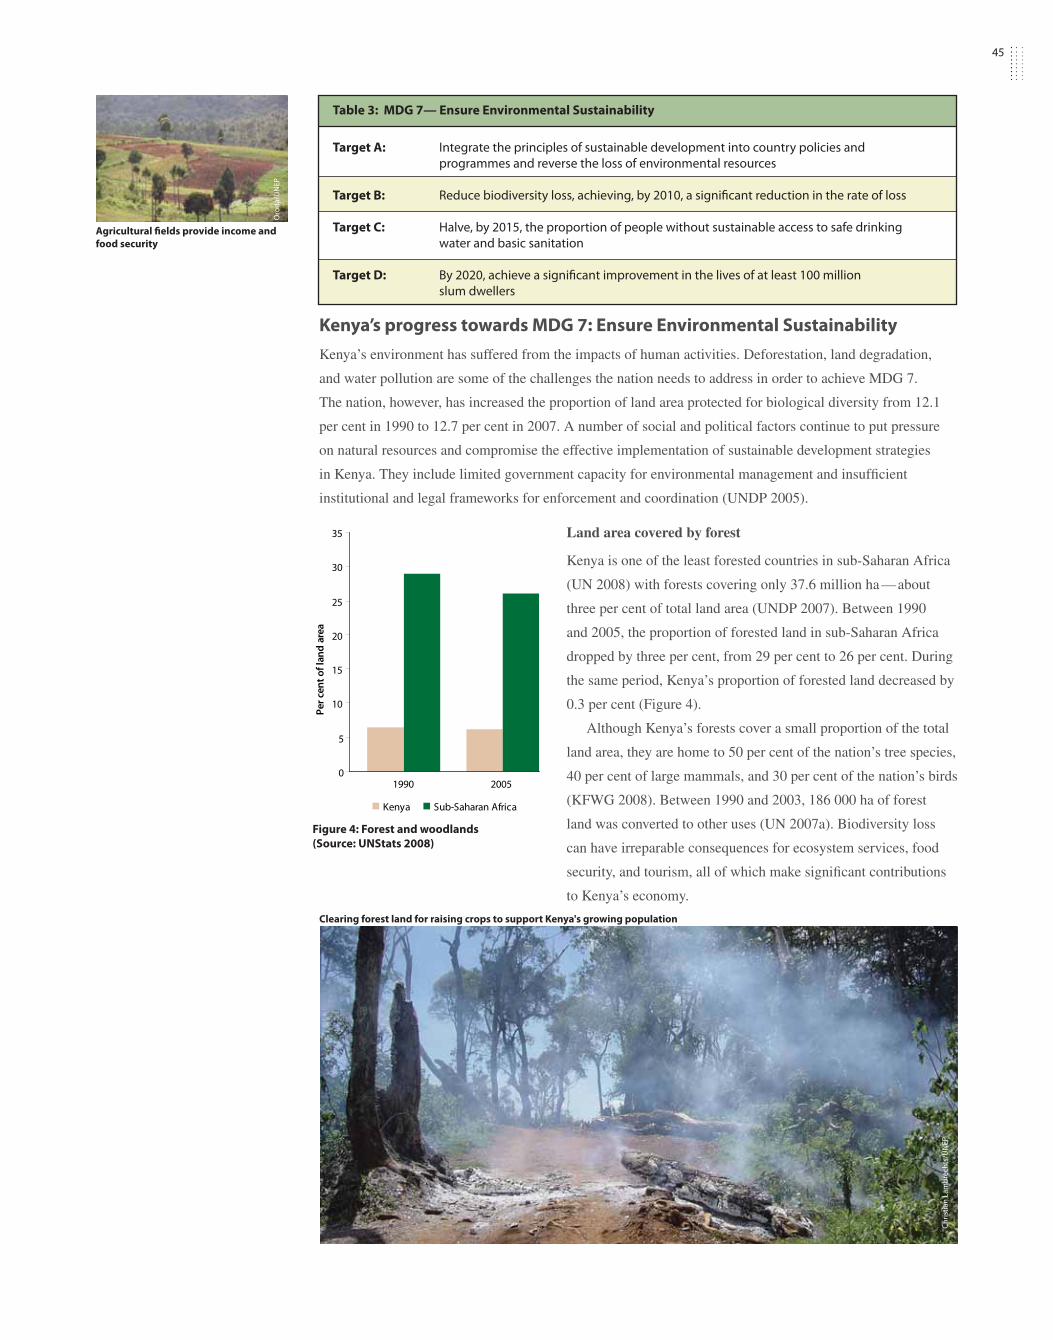
Land area covered by forest
Kenya is one of the least forested countries in sub-Saharan Africa
(UN 2008) with forests covering only 37.6 million ha — about
three per cent of total land area (UNDP 2007). Between 1990
and 2005, the proportion of forested land in sub-Saharan Africa
dropped by three per cent, from 29 per cent to 26 per cent. During
the same period, Kenya’s proportion of forested land decreased by
0.3 per cent (Figure 4).
Although Kenya’s forests cover a small proportion of the total
land area, they are home to 50 per cent of the nation’s tree species,
40 per cent of large mammals, and 30 per cent of the nation’s birds
(KFWG 2008). Between 1990 and 2003, 186 000 ha of forest
land was converted to other uses (UN 2007a). Biodiversity loss
can have irreparable consequences for ecosystem services, food
security, and tourism, all of which make signifi cant contributions
to Kenya’s economy.
Table 3: MDG 7— Ensure Environmental Sustainability
Target A: Integrate the principles of sustainable development into country policies and
programmes and reverse the loss of environmental resources
Target B: Reduce biodiversity loss, achieving, by 2010, a signifi cant reduction in the rate of loss
Target C: Halve, by 2015, the proportion of people without sustainable access to safe drinking
water and basic sanitation
Target D: By 2020, achieve a signifi cant improvement in the lives of at least 100 million
slum dwellers
Figure 4: Forest and woodlands
(Source: UNStats 2008)
0
5
1 0
1 5
2 0
2 5
3 0
3 5
1 9 9 0 2 0 0 5
P e
r c e
n t
o f
l a n
d a
r e a
K e n y a S u b - S a h a r a n A f r i c a
Ch
rist
ian
La
mb
rech
ts/U
NE
P
Oro
da
/UN
EP
Agricultural fi elds provide income and
food security
Clearing forest land for raising crops to support Kenya's growing population

46
Table 4: Indicators of Kenya’s progress towards the MDGs, 1990s and 2000s.
Goals and indicators Past2 Present3
(target)
(1990s) (2000s)
Goal 1: Eradicate extreme poverty and hunger
1.1 Population below $1 (PPP) per day, percentage - 52(1997)
1.2 Poverty gap ratio - -
1.3 Share of poorest quintile in national consumption, percentage 3.4 6(1997)
1.4 Growth rate of GDP per person employed, percentage -4.69 3.02
1.5 Employment-to-population ratio (both sexes), percentage 63.9 63.1
1.6 Proportion of employed people living below $1 (PPP) per day, percentage 47.1 17.4(1997)
1.7 Proportion of own-account and contributing family workers in total employment - -
1.8 Prevalence of underweight (moderate and severe), children under 5, percentage 22.3 19.9
1.9 Undernourished population, percentage 39 31(2002) (19)
Goal 2: Achieve universal primary education
2.1 Net enrollment ratio in primary education, percentage 64(1999) 76.2
2.2 Proportion of pupils starting grade 1 who reach last grade of primary, percentage 71.7 83.6 (100)
2.3 Literacy rate of 15-24 year-olds (male), percentage - 79.8(2000)
2.4 Literacy rate of 15-24 year-olds (female), percentage - 80.7 (2000)
Goal 3: Promote gender equality and empower women
3.1 Gender Parity Index in primary level enrollment 0.96 0.97 (1)
3.2 Gender Parity Index in secondary level enrollment 0.77 0.93 (1)
3.3 Gender Parity Index in tertiary level enrollment 0.54(2000) 0.6 (1)
3.4 Seats held by women in national parliament, percentage 1.1 7.2
3.5 Share of women in wage employment in the non-agricultural sector 21.4 32.2(1997)
Goal 4: Reduce Child Mortality
4.1 Under-fi ve mortality rate, per 1 000 live births 97 121 (32)
4.2 Infant mortality rate, per 1 000 live births 64 79
4.3 Children 1-year old immunized against measles, percentage 78 77
Goal 5: Improve maternal health
5.1 Maternal mortality ratio, per 100 000 live births 3653 560 (92)
5.2 Births attended by skilled health personnel, percentage 45.4 41.6 (100)
5.3 Contraceptive use among married women (15-49 yrs. old), percentage 32.7 39.3
5.4 Adolescent birth rate, per 1 000 women 118 116(2001)
5.5 Antenatal care coverage for at least four visits, percentage - 52.3
5.6 Antenatal care coverage for at least one visit, percentage 94.9 88.1
5.7 Unmet need for family planning (total), percentage 36.4 24.5
Goal 6: Combat HIV/AIDS, malaria and other diseases
6.1 People living with HIV, percentage 7.7(2001) 4.9
6.2 Condom use at last high-risk sex (female), percentage 14(1998) 25.4
6.3 Condom use at last high-risk (male), percentage 43 (1998) 46.8
6.4 Population 15-24 year-olds who have comprehensive correct knowledge of HIV/AIDS - 34
(female), percentage
1 1990-1993 unless otherwise indicated2 2003-2008 unless otherwise indicated3 GoK (2008a)
(Source: UNStats 2008)
46

47
6.5 Population 15-24 year-olds who have comprehensive correct knowledge of HIV/AIDs - 47
(male), percentage
6.6 Ratio of school attendance of orphans to school attendance of non-orphans 0.94 0.95
6.7 Proportion of population with advanced HIV infection with access to antiretroviral drugs, 27(2006) 38 (100)
percentage
6.8 Death reate associated with malaria, per 1 000 0.63(2000)5 1.354
6.9 Incidences of malaria, percentage 14(2000) 4 27.74
6.10 Death rate associated with tuberculosis, per 100 000 population 28.5 71.9
6.11 Incidences of tuberculosis, per 100 000 population 116.2 384.5
6.12 Prevalence of tuberculosis, per 100 000 population 132.9(2000) 334.1
6.13 Tuberculosis detection rate under directly observed treatment short course, percentage 56.6(1995) 70
6.14 Tuberculosis treatment success under directly observed treatment short course, 74.7(1995) 82.4
percentage
6.15 Proportion of children under 5 sleeping under insecticide-treated bed nets, percentage 2.9(2000) 525
6.16 Proportion of children under 5 with fever who are treated with appropriate anti-malarial 40.4(1998) 26.5
drugs, percentage
Goal 7: Ensure environmental sustainability
7.1 Land area covered by forest, percentage 6.5 6.2
7.2 Carbon emissions, total (thousand metric tonnes CO 2) 5 826 10 588
Carbon emissions, per capita (metric tonnes CO2) 0.2485 0.3054
Carbon emissions, kg CO2 per $1 GDP (PPP) - -
7.3 Consumption of all ozone-depleting substances, ODP metric tonnes 452.3 134.8
7.4 Proportion of fi sh stocks within safe biological limits - -
7.5 Proportion of total water resources used, percentage 6.7 8.9
7.6 Proportion of species threatened with extinction - -
7.7 Proportion of terrestrial and marine areas protected to total territorial area, percentage 11.9 12.7
7.8 Proportion of population using an improved drinking water source, percentage total 41 57 (82)
7.9 Proportion of population using an improved sanitation facility, percentage total 39 42 (78)
7.10 Slum population in urban areas, percentage 70.4 54.8
Goal 8: Develop a global partnership for development
8.1 Average tariff s imposed by developed countries on agricultural products from developing countries - -
8.2 Average tariff s imposed by developed countries on clothings from developing countries - -
8.3 Average tariff s imposed by developed countries on textiles from developing countries - -
8.4 Net ODA as a percentage of OECD/DAC donors' GNI - -
8.5 Net ODA to LDCs as a percentage of OECD/DAC donors' GNI - -
8.6 ODA that is untied - -
8.7 ODA to basic social services as a percentage of sector-allocable ODA - -
8.8 ODA received by landlocked developing countries as a proportion of their GNI - -
8.9 ODA received by small island developing states as a proportion of their GNI - -
8.10 Agricultural support estimate for OECD countries as a percentage of their GDP - -
8.11 Debt relief committed under HIPC and MDRI Initiatives - -
8.12 Debt service as percentage of exports of goods and services and net income from abroad, 28.6 6.8
8.13 Developed country imports from developing countries, admitted duty free - -
8.14 Developed country imports from the LDCs, admitted duty free - -
8.15 ODA provided to help build trade capacity - -
8.16 Total number of countries that have reached their HIPC decision points and number that - -
have reached their HIPC completion points (cumulative)
8.17 Population with access to aff ordable drugs 0.79 0.84
8.18 Telephone lines, per 100 population 0 20.91
8.19 Cellular subscribers, per 100 population 0 7.89
8.20 Internet users, per 100 population
4 GoK (2008b)5 GoK (2008c)
47

48
Carbon emissions
Worldwide, carbon dioxide (CO2) emissions reached 2 900 million
metric tonnes in 2004 and they continue to rise, as evident from
increasing concentrations of CO2 in the atmosphere. Per capita CO
2
emissions in sub-Saharan Africa were 0.9 metric tonnes between 1990
and 2004. This is less than one-tenth of the per capita CO2 emissions
in the developed world (UN 2007b). Kenya’s per capita emissions are
much lower than the sub-Saharan average (Figure 5), although there
was a slight increase from 1990 to 2004 (UN 2008). Nevertheless,
carbon pollution, resulting mainly from industries and the increasing
number of motor vehicles on Kenyan roads, is one of the leading
environmental health problems in the country affecting both rural and
urban populations (GoK 2007).
Figure 6: Changes in per capita carbon dioxide emissions in Kenya, 1990-2003
(UNStats 2008)
Reliance on fuelwood: a daunting challenge to
stemming deforestation
Fuelwood accounts for over 70 per cent of the total energy
consumption in Kenya (GoK 2004). This heavy reliance on
wood for fuel and other livelihood needs such as timber,
charcoal, building materials, and non-timber forests products,
poses a major threat to existing forests. About 67 per cent
of the national population depends on fi rewood for fuel (90
per cent for rural and 10 per cent for urban) with about 47
per cent of the national population depending on charcoal
(82 per cent urban and 32 per cent rural) (GoK 2008).
Since 1930, Kenya has lost about 65 per cent of its
original standing wood volume; Kenya’s growing population
threatens the few remaining forested areas and their
ecosystem goods and services.
Among the strategies needed to increase forest areas is
to reduce over-reliance on fuelwood consumption and
increase access to alternative energy sources (GoK 2007)
(Chapter 1).
Figure 5: Per capita carbon dioxide
emissions
(Source: UNStats 2008)
1990 1991 1992 1993 1994 1995 1996 1997 1998 1999 2000 2001 2002 20030.10
0.15
0.20
0.25
0.30
0.35
Me
tric
to
nn
es
pe
r ca
pit
a
Sim
on
e R
am
ella
/Flic
kr.c
om
0
0 . 1
0 . 2
0 . 3
0 . 4
0 . 5
0 . 6
0 . 7
0 . 8
0 . 9
1
1 9 9 0 2 0 0 4
M e
t r i c
t o
nn
es
pe
rca
pit
a
K e n y a S u b - S a h a r a n A f r i c a
Ch
rist
ian
La
mb
rech
ts/U
NE
P
Exhaust pipe spewing out carbon
emissions which contribute to
climate change

49
The proportion of the total area set aside as terrestrial and
marine protected areas
Kenya has 348 designated protected areas, representing 75 238 km2
or 12.7 per cent of the nation’s total territorial area (UNDP 2005).
These include fi ve Biosphere Reserves and three World Heritage Sites
(Thaxton 2007).
Over 6 500 plant species are found in Kenya of which 260 are
endemic. The nation also has more than 1 000 bird species and over
350 species of mammals, ranking it second highest among African
countries in species richness for these animal groups (GoK 2007).
The proportion of the
population using an improved
drinking water source
Overall, Kenya has made
progress since 1990 in providing its growing population access to clean
drinking water —more progress than sub-Saharian Africa in general.
In Kenya's urban areas, however, access had declined during that time.
Much effort is still needed to reach the 2015 target of halving the
number of Kenyans without access to clean drinking water.
0
2
4
6
8
1 0
1 2
1 4
1 9 9 0 2 0 0 7
P e
r c e
n t
K e n y a S u b - S a h a r a n A f r i c a
Figure 7: Protected area ratio to total
territorial area
(Source: UNStats 2008)
Figure 8: Proportion of the population
using improved drinking water sources
(Source: UNStats 2008)
In 2006, approximately 57 per cent of
Kenyan households used water from sources
considered safe.
Figure 9: Percentage of households
(urban and rural) with access to safe
water, 2005-2006
0
1 0
2 0
3 0
4 0
5 0
6 0
7 0
1 9 9 0 2 0 0 6
P e
r c e
n t
K e n y a S u b - S a h a r a n A f r i c a
!
!
!
!(
!
!
!\
!
!(
!
!
!(
!\
0 100 200Kilometres
¯
Joh
an
nes
Aki
wu
mi/
UN
EP
KN
BS
20
08
A crab blends in with its environment

50
Figure 10: Percentage of households
(urban and rural) with access to an
improved water source
!
!
!
!(
!
!
!\
!
!(
!
0 100 200Kilometres
¯
!
!(
!\
Increasing accessible water supplies tackles
several MDGs at once
Kenya is below the international water scarcity
threshold (1 000 m3 per person per year) with only
935 m3 available per person per year (FAO 2007),
and population growth is forecast to reduce this
fi gure to 359 m3 by 2020 (UN-Water 2006).
Kenya’s water resources are unevenly
distributed. Many of its arid regions receive only
250 mm or less of rain per year. Highly stressed
water systems include Lakes Victoria, Nakuru, and
Naivasha, as well as the Nzoia, Nyando, Turkwel,
Kerio, Athi, Voi, Tana, and Ewaso Nyiro rivers. In
addition, salinity levels in many water bodies, such
as Lake Turkana, are too high for human use of the
water. In arid regions, when they occur, rains come
mainly in violent storms causing erosion and
leaching nutrients from the soil.
Women have the main responsibility for
managing their household’s needs for water,
sanitation, and health. In a number of regions,
women and girls spend many hours a day fetching
water. In the Samburu District of central Kenya,
for example, some women walk more than nine
kilometres daily to fi nd water (Aguirre 2007). With
the increased frequency of droughts, women’s
trekking distances for water are increasing. The
time spent obtaining water is time that could
otherwise be devoted to schooling, child-care,
or to income-generating activities. In addition,
women are confronted with personal security
risks while away from home and they endure
immense physical burdens, since 20 litres of water
can weight about 20 kg (UNDP 2008) (Table 2).
Increasing the provision of clean, accessible
water to communities can signifi cantly decrease
child mortality and fatal diseases and make it
possible for children and women to go to school.
Access to clean water is therefore crucial in
attaining most of the MDG targets.
KN
BS
20
08
An
ge
la S
ev
in/F
lick
r.co
m
De
mo
sh/F
lick
r.co
m
Safe drinking water pump at a
local school

51
According to the Kenya Integrated Household Budget Survey,
only 49 per cent of Kenya’s rural population has access to clean
water compared to 83 per cent in urban areas (GoK 2007). This
disparity also exists between districts and regions (Figure 10). For
example, access to safe water varies from a high of 96 per cent in
Nairobi to as low as 14 per cent in Mwingi District (GoK 2007).
The proportion of the population using an improved
sanitation facility
An estimated 1 600 million people will need access to improved
sanitation over the period 2005-2015 to meet the MDG targets
(UNEP 2008). Yet if trends since 1990 continue, the world is
likely to miss the target by almost 600 million people. In Africa,
only northern Africa is on track to halve the proportion of people
without basic sanitation by 2015, whereas sub-Saharan Africa
is set to achieve only half of the 2015 objective, with a small
increase from 26 to 31 per cent between 1990 and 2006. To date,
only 19 per cent of the Kenyan population living in urban areas has access to proper sanitation facilities
(UnStats 2005). If this trend continues, Kenya is likely to miss the target.
Access to improved sanitation varies from region to region with the Western and Central provinces
enjoying better sanitation coverage at 96.2 per cent and 99.7 per cent, respectively. The North Eastern
Figure 11: Proportion of total population using
improved sanitation facilities
(Source: UNStats 2008)
0
5
1 0
1 5
2 0
2 5
3 0
3 5
4 0
4 5
1 9 9 0 2 0 0 6
P e
r c e
n t
K e n y a S u b - S a h a r a n A f r i c a
RIFT VALLEY
T
NORTH EASTERNEASTERN
NYANZA
CENTRAL
NAIROBI
UGANDA SOMALIA
ETHIOPIA SUDAN
UNITED REPUBLIC
OF TANZANIA
Other
Flush toilet
VIP latrine
Pit latrine
Uncovered pit latrine
Covered pit latrine
Bucket
None
Nairobi
Lake Turkana
Lake Victoria
Nyanza
Western
Rift Valley
Central
Eastern
North Eastern
Coast
0 1 0 0 2 0 0 K i l o m e t r e s
INDIAN
OCEAN
N
Figure 12: Percentage of households
using main types of toilet facilities
KIH
BS
20
05
/06

52
Province has the lowest access with only 36.7 per cent. Nationwide, Samburu and Turkana Districts are the
most underserved with only 11.6 per cent and 17.7 per cent, respectively (GoK 2007). Pit latrines, whether
improved or not, are the most widely used toilet facilities (Figure 12, page 51) and most sewerage collection
treatment and disposal systems were constructed 20 to 40 years ago. Over the last 30 years, there has been
inadequate funding to rehabilitate, upgrade, and expand water supplies and sewerage facilities (UNDG 2005).
Harvesting energy from human waste
In one part of the Kibera slums, a network of
public latrines has been built featuring a facility
that converts human waste to energy, which in
turn is used for lighting and heating water. The
human waste is put in an airtight biodigester from
which methane gas is captured and fi ltered into
an upper tank. During this process, solid waste is
also treated and fi ltered through reed beds before
being collected and sold as fertilizer. This is an
excellent example in which simple technologies
are applied in slum areas not only to improve
sanitation, but also raise incomes and provide
sustainable energy. (Source: Houreld 2008)
Me
ad
uv
a/F
lick
r.co
m
UN
EP
UN
EP
UN
EP
UN
EP
A sewage treatment facility improves the health and well-being of Kenya's people

53
The proportion of slum populations in urban areas
By the end of 2008, half the world’s population will
live in cities and towns and by 2050, 70 per cent of
people will live in urban areas. Both urban migration
and rapid population growth continue to expand the
number of urban dwellers, which will rise from 3 200
million people in 2008 to nearly 5 000 million by
2030, with most of the growth taking place in Africa
and Asia (UNEP 2008).
In 2005, one in three urban dwellers lived in
slum conditions. This means they lacked at least one
of the basic conditions of decent housing: adequate
Figure 14: Proportion of households with access to
secure tenure
(Source: UNStats 2008)
Slu
m P
op
ula
tio
n (
tho
usa
nd
s)
2 000
8 000
7 000
6 000
5 000
4 000
3 000
1 000
1990 2001
3.98m
7.60m
Figure 13: Slum population growth
(Source: KNBS 2008)
Mic
ha
el M
wa
ng
i/U
NE
PC
hri
stia
n L
am
bre
chts
/UN
EP
Per
cent
age
Ramshackle housing in a slum area
Aerial view of the Kibera slum
54
sanitation, improved water supply, durable housing, or adequate living space. Sub-Saharan Africa remains
one of the regions where the lack of adequate shelter among urban populations is most acute (UN 2007b).
In Kenya there has been a decline in the proportion of urban people living in slums (a decrease of 15.6 per
cent since 1990), although the actual number of slum dwellers only decreased by 88 059 during this time.
In 2005, four million Kenyans still lived in slums (UNStats 2008). The annual urban population growth rate
reached 3.2 per cent between 2000 and 2005, compared to 1.9 per cent in rural areas. Even with a decline in
the growth rate of slum dwellers, rapid urban expansion makes it a challenge to improve living conditions
quickly enough to meet the MDG target.
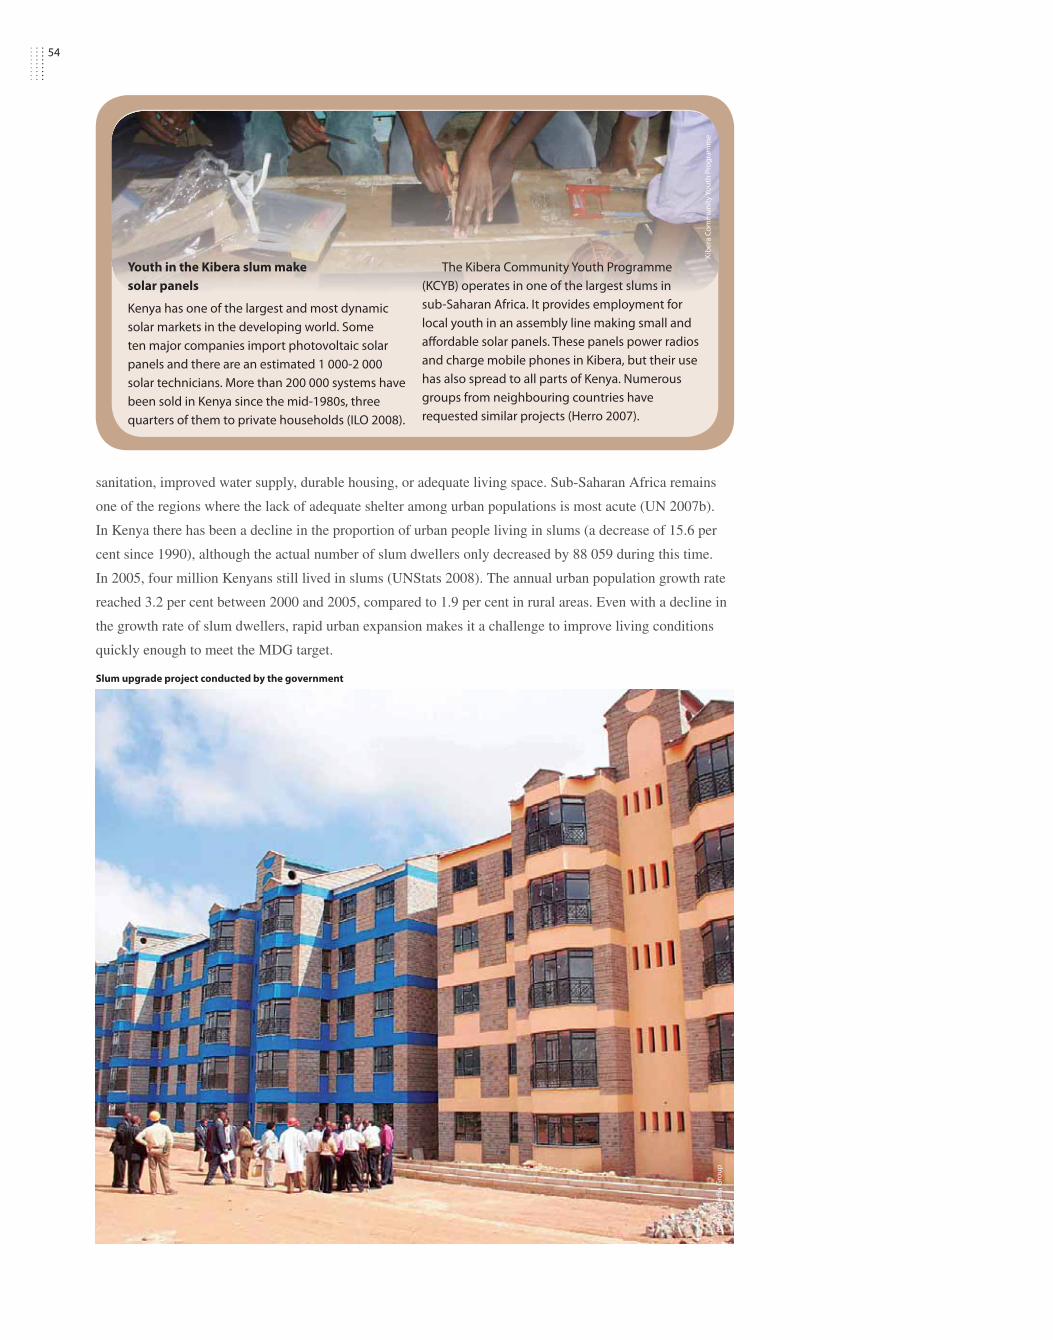
Youth in the Kibera slum make
solar panels
Kenya has one of the largest and most dynamic
solar markets in the developing world. Some
ten major companies import photovoltaic solar
panels and there are an estimated 1 000-2 000
solar technicians. More than 200 000 systems have
been sold in Kenya since the mid-1980s, three
quarters of them to private households (ILO 2008).
The Kibera Community Youth Programme
(KCYB) operates in one of the largest slums in
sub-Saharan Africa. It provides employment for
local youth in an assembly line making small and
aff ordable solar panels. These panels power radios
and charge mobile phones in Kibera, but their use
has also spread to all parts of Kenya. Numerous
groups from neighbouring countries have
requested similar projects (Herro 2007).
Na
tio
n M
ed
ia G
rou
p
Kib
era
Co
mm
un
ity
You
th P
rog
ram
me
Slum upgrade project conducted by the government

55
The Environment and PovertyDeveloping countries, such as Kenya, are still heavily reliant on revenues from exported natural resources
such as agricultural commodities. For example, in the 1990s, 53 per cent of Kenya’s export earnings were
derived from agricultural products such as coffee, sugar, and fl owers (Nyangito n.d.). Agriculture presently
accounts for 26 per cent of Kenya’s GDP (NEE 2008).
The distribution of poverty across Kenya varies from one province to another. Each province offers a
unique blend of environmental, geographical, and infrastructure characteristics, which in turn infl uence
poverty levels. Certain environmental factors can contribute to poverty alleviation (Figure 15).
Poor households rely heavily on expenditure-saving, labour intensive activities for their subsistence and
survival, such as collecting water and fuelwood or grazing animals on common lands. Common property
resources or open access lands are important sources of livelihoods for the poor, providing them with
a variety of goods, which can include food, water, fuel, fodder, bamboo, resin, gum, oils, construction
materials, honey, medicinal plants, and spices, among others.
Many poor households depend on their local environments for food security. Generally, food security
depends on food availability and stability, accessibility, and use. Poor soils and low agricultural productivity,
lack of control over land management, and competition from other users are some of the conditions that
threaten household food security. Food security is closely related to the achievement of a number of other
MDGs: for example, poor nutrition is implicated in more than half of all child deaths worldwide (Jolly
2001), showing the gains to be made by addressing food security in targeting goal 4, which calls for reducing
child mortality.
Over 36 per cent of all the rural poor Kenyans live on marginal lands or areas that are particularly
vulnerable to environmental degradation, such as fl oodplains, coastal areas, and degraded hillsides.
Depending on such lands for food can render poor people vulnerable to periodic hunger. Environmental
hazards and extreme events, such as droughts, fl oods, forest fi res, and landslides, are more damaging in
marginal and degraded ecosystems and the poor living there are least able to cope with their impacts. For all
these reasons, achieving the fi rst MDG—eradicating extreme poverty and hunger—requires renewed efforts
towards achieving MDG 7, through the sustainable management of land, water, biodiversity resources, and
the adequate provision of urban sanitation, potable water, and waste management.
Figure 15: The eff ect of six
environmental factors on poverty,
by province.
Studying the correlation of environmental
factors with poverty can aid in designing
poverty alleviation projects.
Central Province Locational Map
Rift ValleyProvince
Rift ValleyProvince
EasternProvince
0 50 Km.
Locational Map
Coast Province
North Eastern Province
EasternProvince
Indian Ocean
0 50 100 150 Km.
LakeTurkan
a
Eastern Province Locational Map
North EasternProvince
CoastProvince
CentralProvince
Rift ValleyProvince
Rift ValleyProvince
ETHIOPIA
0 50 100 150 Km.
Locational Map
North Eastern Province
SO
MA
LIA
EasternProvince
CoastalProvince
Nyanza Province
WesternProvince
Rift ValleyProvince
0 50 Km.
UG
AN
DA
TANZANIATANZANIA
TANZANIA
Locational Map
Locational Map
Rift Valley Province
0 50 100 150 200 Km.
WesternProvince
NyanzaProvince
UGANDA
EasternProvince
EasternProvince
CentralProvince
LakeTurkan
a
Locational Map
Western Province
NyanzaProvince
Rift ValleyProvince
UGANDA
0 50 Km.
Pove
rty
Decrease
Increase
Pove
rty
Decrease
Increase
Pove
rty
Decrease
Increase
Pove
rty
Decrease
Increase
Pove
rty
Decrease
Increase
Pove
rty
Decrease
Increase
Pove
rty
Decrease
Increase
Precipitation VariabilityLand SlopeFood FrequencyPresence of WetlandsTravel Time to RoadsAccess to Forest
Source: Okwi and others 2007
N
N N N N
N N
0 50 100 150 Km.

56
Climate Change and the MDGsClimate change refers to a change in the state of the climate that can be identifi ed (e.g., by
using statistical tests) by changes in the mean and/or the variability of its properties, and that
persists for an extended period, typically decades or longer. Climate change may be due to
natural internal processes or external forcings, or to persistent anthropogenic changes in the
composition of the atmosphere or in land use (IPCC 2008).
According to UNDP, the mean annual temperature in Kenya has increased by 1.0°C since 1960
representing an average rate of 0.21°C per decade. It is projected to increase by 1.0 to 2.8°C by the 2060s
and by the year 2100, temperatures in Kenya could increase by about 4°C causing variability of rainfall by
up to 20 per cent (Kabubo-Mariara 2007).
Given that a large portion of Kenya is semi-arid with high temperatures and low precipitation, frequent
droughts, water scarcity, and unpredictable climate variability will have the largest impacts on people living
in these regions. The agricultural sector, which relies on predictable rainfall and temperatures, will suffer the
most since it directly or indirectly supports 80 per cent of the population and agro-based industries support
much of Kenya’s economy (Kabubo-Mariara 2007). Kenya’s high dependence on natural resources, its
poverty levels and low capacity to adapt, and the existence of other signifi cant environmental stress make it
highly vulnerable to the impacts of climate change.
The impacts of climate change are linked with the achievement of key national development objectives
and the MDGs including: poverty, food insecurity, health threats, environmental degradation, and loss of
natural resources. Thus, the MDG’s development objectives will be constrained by climate change impacts
unless the capacity to adapt is strengthened.
Credit constraints, poverty, and a lack of information, however, remain signifi cant obstacles to adopting
both short- and long-term adaptation measures. There is a critical need for governments to support climate
change adaptation strategies, including monitoring climate change and disseminating information to farmers.
Farmers will need to improve management approaches, including crop diversifi cation; water harvesting,
recycling, and conservation; and the irrigation and shading and sheltering of crops (Kabubo-Mariara 2007).
The following section looks at the ways in which climate change is likely to affect incidences of droughts
and fl oods, health, food security, natural disaster, and land degradation, which are key to the achievement of
the MDGs in Kenya.
Na
tio
n M
edia
Gro
up
“The poorest countries and most
vulnerable citizens will suffer
the earliest and most damaging
setbacks of climate change, even
though they have contributed least
to the problem” (UNDP 2008)
56
Severe impact of drought on livestock and livelihoods

57
Climate Change and Human HealthHuman health is likely to be affected by various climate change-related health factors, including the
altered distribution of some infectious diseases and disease vectors (IPCC 2008). Projected trends in
climate change-related exposures will increase malnutrition and consequent disorders; increase the
number of people suffering from death, disease, and injury from heat waves, fl oods, storms, fi res and
droughts; and continue to change the range of some infectious disease vectors. The burden of diarrhoeal
diseases will increase and the geographical range of malaria will expand in some places and contract in
others (Confalonieri and others 2007).
RIFT VALLEY
T
NORTH EASTERNEASTERN
NYANZA
CENTRAL
NAIROBI
UGANDA SOMALIA
ETHIOPIA SUDAN
UNITED REPUBLIC
OF TANZANIA
Nairobi
Lake Turkana
Lake Victoria
Nyanza
Western
Rift Valley
Central
Eastern
North Eastern
Coast
0 1 0 0 2 0 0 K i l o m e t r e s
INDIAN
OCEAN 27 - 38
38 - 46
46 - 53
12 - 20
20 - 22
22 - 38
38 - 46
Per cent of population using a bed net
Per cent of populationsuffering from malariaor fever
N
Figure 16: The proportion of households
using bed nets and the proportion
suff ering from malaria
KN
BS
20
05
58
Lake Victoria
Low risk
Arid/Seasonal
Endemic Coast
Highland
Lake Endemic
Malaria Endemicity
UGANDA SOMALIA
ETHIOPIA SUDAN
UNITED REPUBLIC
OF TANZANIA
0 1 0 0 2 0 0 K i l o m e t r e s
INDIAN
OCEAN
N
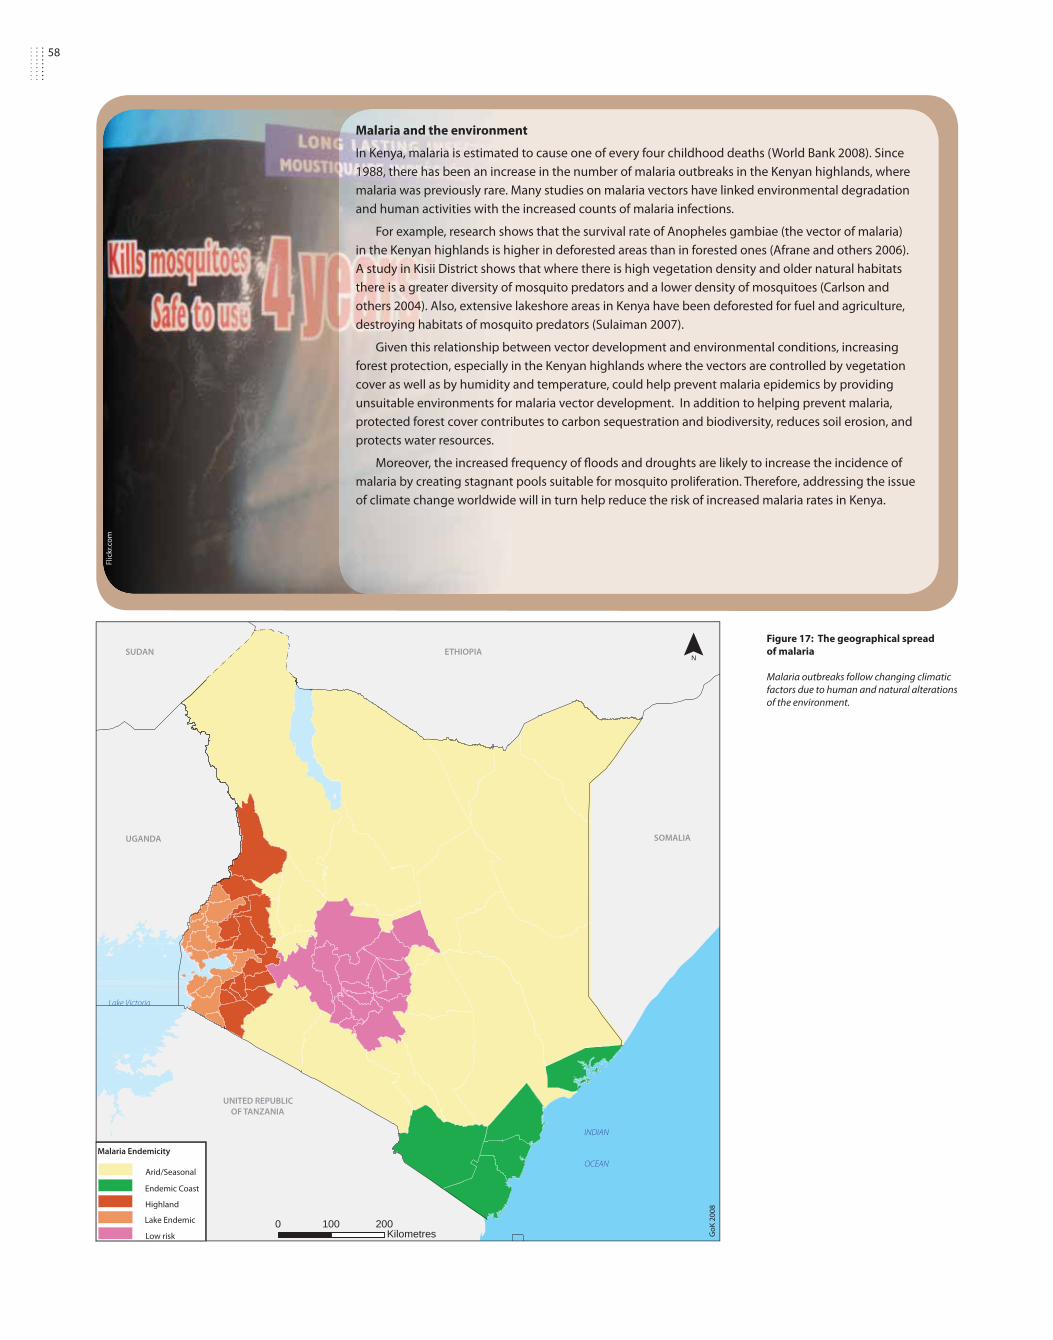
Malaria and the environment
In Kenya, malaria is estimated to cause one of every four childhood deaths (World Bank 2008). Since
1988, there has been an increase in the number of malaria outbreaks in the Kenyan highlands, where
malaria was previously rare. Many studies on malaria vectors have linked environmental degradation
and human activities with the increased counts of malaria infections.
For example, research shows that the survival rate of Anopheles gambiae (the vector of malaria)
in the Kenyan highlands is higher in deforested areas than in forested ones (Afrane and others 2006).
A study in Kisii District shows that where there is high vegetation density and older natural habitats
there is a greater diversity of mosquito predators and a lower density of mosquitoes (Carlson and
others 2004). Also, extensive lakeshore areas in Kenya have been deforested for fuel and agriculture,
destroying habitats of mosquito predators (Sulaiman 2007).
Given this relationship between vector development and environmental conditions, increasing
forest protection, especially in the Kenyan highlands where the vectors are controlled by vegetation
cover as well as by humidity and temperature, could help prevent malaria epidemics by providing
unsuitable environments for malaria vector development. In addition to helping prevent malaria,
protected forest cover contributes to carbon sequestration and biodiversity, reduces soil erosion, and
protects water resources.
Moreover, the increased frequency of fl oods and droughts are likely to increase the incidence of
malaria by creating stagnant pools suitable for mosquito proliferation. Therefore, addressing the issue
of climate change worldwide will in turn help reduce the risk of increased malaria rates in Kenya.
Figure 17: The geographical spread
of malaria
Malaria outbreaks follow changing climatic
factors due to human and natural alterations
of the environment.G
oK
20
08
Flic
kr.
com

59
Climate Change and Food SecuritySome 57.6 million ha in Kenya are devoted to agriculture. Of this, only 9.4 million ha or about 17 per cent
of the total land area is classifi ed as having high to medium potential for farming (DRSRS 2008, FAO 2000).
The arid and semi-arid lands (ASALs) cover over 48.0 million ha, accounting for about 83 per cent of the
total land area. In the ASALs, about 9 million ha can support some form of agriculture while 15 million
ha are just adequate for livestock keeping. The rest, amounting to 24 million ha, is dry and only suitable
for nomadic pastoralism. Productivity in lands of high to medium potential is declining in the face of
growing demands for food and other agricultural products. Soil erosion, loss of soil fertility, fl ooding, and
biodiversity loss are increasing in all areas (Survey of Kenya 2003).
Changing environmental factors related in part to climate change have already had an impact on
household food security for the many Kenyans who would benefi t from reliable forecasts, increased water
availability, and improved soil fertility to sustain their livelihoods.
0 100 200Kilometres
¯
!
!(
!
!\
!(
!
!(
!
\
Go
K 2
00
8, K
FS
SG
20
08
Figure 18: Food security distribution
Na
tio
n M
ed
ia G
rou
p
59
Maize is an important crop for
food security in Kenya

60
In some places, climate change has been implicated in decreased water resources, which has had a
cascading effect: increased trekking distances and water costs; more competition for declining water
supplies; failed crops; increased food prices; earlier livestock migrations; weaker livestock, predisposing
them to disease; and food insecurity as families are left without milk and animal products (KFSSG 2008).
Its effects on agriculture will be more pronounced in medium and low potential zones than in zones of high
agricultural potential (Kabubo-Mariara 2007).
Climate Change and Floods and Droughts Climate change is a likely factor in the increased intensity of El Niño events, resulting in more severe and
frequent fl oods and droughts. El Niños occur when a large area of the central and eastern equatorial Pacifi c
becomes warmer than normal. Recent research indicates that El Niños have been more intense since 1900
than at any time in the last 130 000 years (WHO n.d.).
In Kenya, droughts tend to occur every three years and last for one to two years, depending on the
climate zone.There has been an increased frequency of fl oods and droughts in Kenya over the past 10 years:
1996-1997; 1999-2001; and 2003-2006. These droughts decimated livestock populations and crop harvests,
and because they recurred so soon, households lacked suffi cient time to recover during intervening years
(USAID 2008).
Floods are also a major concern for Kenya’s food security. Lakeshore and coastal districts are
vulnerable to recurrent fl oods that lead to loss of life and crops, displacement of households, and destruction
of homes.
The impacts of drought on livestock
and livelihoods
Climate change is threatening the livelihoods of
thousands of Kenyans. One of the hardest hit communities
is the Maasai in the Magadi area of southern Kenya. Up
to 80 per cent of the Maasai in this region have lost their
cattle due to increasingly frequent drought, thought to
be a result of climate change. Water is becoming harder
to fi nd and in many places grass has stopped growing,
leaving no food for cattle, the main source of food and
income in this community of around 4 000. While some
attempts have been made to supply them with water,
experts say the eff ects of global warming are outstripping
these eff orts (IRIN 2008).
Mic
ha
el M
wa
ng
i/U
NE
P
Ste
ve W
eav
er/
Flic
kr.
com
Life in the desert. Note the use of woody vegetation for constructing shelter
61
Climate Change and Land Degradation
Floods and droughts can trigger or exacerbate the processes of land degradation, such as desertifi cation,
erosion, and landslides, affecting the amount and quality of land available for agricultural activities.
Resource depletion and poverty lead to further land degradation and unsustainable land use.
The increased frequency of extreme weather events (such as fl oods and droughts) has adversely affected
Kenya’s agricultural sector, especially in areas of highest farming potential and in the arid and semi-arid
lowlands (ASALs) (Kabubo-Mariara 2007). When nutrient-rich land for farming is lost, food insecurity
!\
!
!
!
!
!\
!
!
!
!
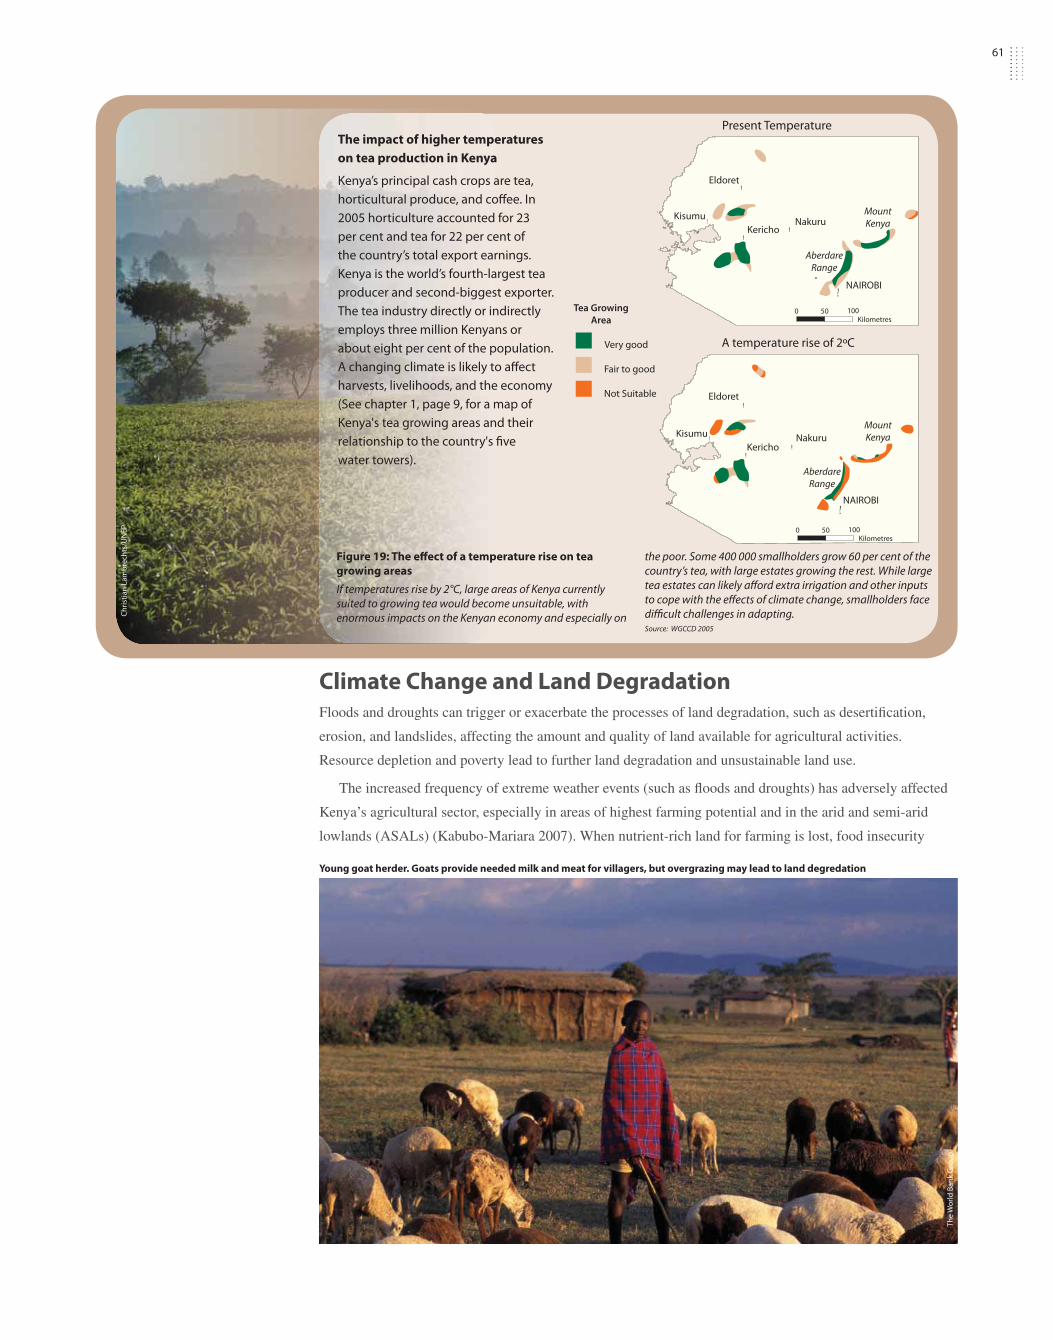
The impact of higher temperatures
on tea production in Kenya
Kenya’s principal cash crops are tea,
horticultural produce, and coff ee. In
2005 horticulture accounted for 23
per cent and tea for 22 per cent of
the country’s total export earnings.
Kenya is the world’s fourth-largest tea
producer and second-biggest exporter.
The tea industry directly or indirectly
employs three million Kenyans or
about eight per cent of the population.
A changing climate is likely to aff ect
harvests, livelihoods, and the economy
(See chapter 1, page 9, for a map of
Kenya's tea growing areas and their
relationship to the country's fi ve
water towers).
Figure 19: The eff ect of a temperature rise on tea
growing areas
If temperatures rise by 2°C, large areas of Kenya currently
suited to growing tea would become unsuitable, with
enormous impacts on the Kenyan economy and especially on
the poor. Some 400 000 smallholders grow 60 per cent of the
country’s tea, with large estates growing the rest. While large
tea estates can likely aff ord extra irrigation and other inputs
to cope with the eff ects of climate change, smallholders face
diffi cult challenges in adapting.Source: WGCCD 2005
Th
e W
orl
d B
an
k G
rou
p
Ch
rist
ian
La
mb
rech
ts/U
NE
P
Young goat herder. Goats provide needed milk and meat for villagers, but overgrazing may lead to land degredation

62
deepens. In addition, when vegetation re-growth in pastoral and marginal agricultural areas is limited, in
times of high rainfall the run-off cannot accumulate as effectively for water-storage purposes (USAID 2008).
Finally, faced with degrading lands, farmers may move their activities into natural habitats such as forests at
the expense of fl oral and faunal diversity.
Figure 20: Regions of Rift Valley Fever
outbreaks are located wihin fl ood
aff ected areas
Go
K 2
00
8d
Ch
rist
ian
La
mb
rech
ts/U
NE
P
Ch
rist
ian
La
mb
rech
ts/U
NE
P
Eroded land

63
Achieving the MDGs
Case Study: Kenya’s Sauri Millennium Village Project
In July 2004, Sauri, Kenya was selected to be the fi rst Millennium
Research Village. Sauri is a town of about 5 000 people located in Siaya
District, Nyanza Province.
The Millennium Villages Project is a United Nations initiative to
empower 12 impoverished rural communities in 10 African countries
to achieve the Millennium Development Goals within a ten-year
time frame. The villages represent each of Africa’s 12 principal agro-
ecological zones and farming systems. People in the selected villages
work with a wide range of experts, scientists, and local development
professionals in agriculture, nutrition, health, education, energy,
water, communications, and the environment. Some of the projects
include rainwater harvesting and improved springs; improved
sanitation through the construction of pit latrines; distribution of
treated mosquito nets and a malaria prevention communication
campaign; planting indigenous tree species around springs; and
establishing community tree nurseries. While the projects benefi t from
the knowledge and skills of international experts and large fi nancial
inputs, the Sauri project is providing valuable lessons on population,
health, and environment integration (Mutuo 2007, Millennium
Promise 2008).
Notable project achievements include the following:
• In 2004, 85 per cent of the population was experiencing food
insecurity; improvements in agricultural production helped
reduce food insecurity to 18 per cent by 2007.
• Maize production in Sauri has more than tripled — from 1.9
tonnes/ha to 6.2 tonnes/ha, with the help of inputs such as
fertilizer and improved seed.
• A school-feeding program has been implemented in all 28
primary schools across the Sauri cluster and is now providing
lunch to 17 514 students. By off ering nutritious, locally
produced food, the program has directly led to increased school
attendance and better academic performance.
• Out of the district’s 385 primary schools, Bar Sauri Primary School
is now one of the top academic performers, jumping from a rank
of 195th to the top 10.
• Malaria prevalence in Sauri is down from 55 per cent to 13
per cent due to the distribution of insecticide-treated bed nets
and improved clinics that can now facilitate malaria diagnosis
and treatment.
Climate Change and PestsClimate change will affect the nature and distribution of agriculture pests, diseases, and weeds, with impacts
on livestock and human health and in turn, on livelihoods, food security, and the economy. Temperature
increases may extend the geographic range of some insect pests, for example, with the tsetse fl y distribution
and human disease vectors most affected. The spread of the highly virulent peste de petits ruminants (PPR)
disease, which has a livestock mortality rate of 50 to 80 per cent, would exacerbate insecure food supplies
(KFSSG 2008).
Excessive rainfall promotes the reproduction of the Rift Valley Fever (RVF) mosquito and severe
infection outbreaks have typically followed El Niño events (WHO 2008). RVF outbreaks in the past have
worsened food insecurity among eastern pastoralists already suffering from severe drought and fl oods
(USAID 2006). Figure 20 shows the geographical distribution of Rift Valley Fever outbreaks and fl ooded
areas in Kenya during such an outbreak at the end of 2006.
Ge
rald
Yu
va
llos/
Flic
kr.
com
Mosquitoes can spread highly virulent diseases such as Rift Valley Fever and malaria

64
References
Aguirre, M. (2007). “The Pursuit of Water in Kenya”. International Medical Corps. http://www.imcworldwide.org/content/article/detail/1106 (Accessed on 8 October 2008)
Afrane, Y. A., Zhou, G., Lawson, B. W., Githeko, A., K., Yan, G. (2006). Effects of Microclimatic Changes Caused by Deforestation on the Survivorship and Reproductive Fitness of Anopheles gambiae in Western Kenya Highlands. American Journal of Tropical Medicine and Hygiene 74(5):772-778
Carlson, J.C., Byrd, B.D., Omlin, F.X. (2004). Field Assessments in Western Kenya Link Malaria Vectors to Environmentally Disturbed Habitats During the Dry Season. BMC Public Health 4(33): 1-7
CIA (1996). Field Listing - Ethnic groups. Central Intelligence Agency. https://www.cia.gov/library/publications/the-world-factbook/fi elds/2075.html (Accessed on 2 January 2009)
Confalonieri, U., Menne, B., Akhtar, R., Ebi, K L., Hauengue, M., Kovats, R. S., Revich, B., Woodward, A. (2007). “Climate Change 2007: Impacts, Adaptation and Vulnerability”. Contribution of Working Group II to the Fourth Assessment Report of the Intergovernmental Panel on Climate Change, Cambridge University Press, Cambridge, UK, pages 391–431.
DRSRS (2008). Department of Resource Surveys and Remote Sensing, Government of Kenya, Nairobi
FAO (2007). AQUASTAT Information System on Water and Agriculture, Food and Agriculture Organization of the United Nations, Land and Water Development Division, Rome. http://www.fao.org/nr/water/aquastat/data/query/index.html. (Accessed on 8 October 2008)
FAO (2008). Africover. Food and Agriculture Organization of the United Nations. http://www.africover.org/ (Accessed on 20 December 2008)
GoK (n.d.). “A Report on the Performance Status 2003-2004”. Health Management and Information System, Ministry of Health, Government of Kenya.http://www.health.go.ke/Healthfacilities/HMIS%202003%20and%202004.pdf (Accessed on 16 December 2008)
GoK (2004). “Economic Survey”. Central Bureau of Statistics, Ministry of Planning and National Development, Nairobi
GoK (2007). Millennium Development Goals, Status Report for Kenya – 2007. Government of Kenya, Nairobi. www.planning.go.ke/index.php?option=com_docman&task=doc_download&gid=35&Itemid=53 (Accessed on 11 December 2008)
GoK (2008). “Millennium Development Goals - Status Report for Kenya – 2007”. Ministry of State for Planning, National Development and Vision 2030, United Nations Development Programme, Government of Kenya, Nairobi
GoK (2008a). “Status And Trends of Millennium Development Goals (MDG’s) in Kenya”. Ministry of Health, Government of Kenya, Nairobi. http://www.health.go.ke/ (Accessed on 13 November 2008)
GoK (2008b). “Annual Health Sector Status Report 2005-2007”. Health Management Information Systems, Government of Kenya, Nairobi. http://www.health.go.ke/Healthfacilities/Annual%20Report%20_%20HMIS.pdf (Accessed on 13 November 2008)
GoK (2008c). Malaria Control Programme of Kenya, Division of Malaria Control Monitoring and Evaluation, Government of Kenya, Nairobi http://www.nmcp.or.ke/section.asp?ID=23 (Accessed on 13 November 2008)
GoK (2008d). Arid Lands Resource Management Project, Government of Kenya. http://www.aridland.go.ke/index.php (Accessed on 9 Janurary 2009)
Gordon, R.G., Jr. (ed.). (2005). Ethnologue: Languages of the World, Fifteenth edition. Dallas, Tex.: SIL International. http://www.ethnologue.com/ (Accessed on 2 January 2009)
Herro, A. (2007). “Youth Bring Low-Cost Solar Panels to Kenyan Slum”. Eye on Earth, Worldwatch Institute Online Features. http://www.worldwatch.org/node/5172 (Accessed on 18 October 2008)
Houreld, K. (2008). “In Kenya Slum, Sun and Sewage Fuel Progress”. Associated Press. http://www.statesman.com/news/content/news/stories/world/08/31/0831kenyasewage.html (Accessed on 8 October 2008)
IISD (2008). The Africa and MDGs High Level UNGA Events Bulletin. International Institute for Sustainable Development, 153(5) http://www.iisd.ca/ymb/africa-mdgs/ (Accessed on 9 October 2008)
ILO (2008). “Green Jobs: Towards Decent Work in a Sustainable, Low-Carbon World Report”. International Labor Organization. http://www.ilo.org/global/What_we_do/Publications/Newreleases/lang--en/docName--WCMS_098503/index.htm (Accessed on 8 October 2008)
IPCC (2008). “Climate Change 2007: Synthesis Report”. An Assessment of the Intergovernmental Panel on Climate Change. -http://www.ipcc.ch/ipccreports/ar4-syr.htm (Accessed on 16 October 2008)
IRIN (2008). “Kenya: Not Enough Food to Go Round”. UN Integrated Regional Information Networks. http://allafrica.com (Accessed on 29 December 2008)
Jolly, R. (2001). “Nutrition”. Our Planet. http://www.ourplanet.com/imgversn/122/jolly.html (Accessed on 29 December 2008)
Kabubo-Mariara, J., and Karanja, F. K. (2007). “The Economic Impact of Climate Change on Kenyan Crop Agriculture: A Ricardian Approach”. World Bank, Development Research Group and the Sustainable Rural and Urban Development Team. http://econ.worldbank.org/external/default/main?pagePK=64165259&theSitePK=469372&piPK=64165421&menuPK=64166093&entityID=000158349_20070828093150. (Accessed on 13 October 2008)
KFSSG (2008). “KFSSG’s Long Rains Assessment Report”. Kenya Food Security Steering Group. http://www.kenyafoodsecurity.org/ (Accessed on 9 October 2008)
KFWG (2008). “Forests in Kenya Overview – Management and Legislative Arrangement”. Kenya Forestry Working Group.
Overlooking the Rift Valley in Kenya

65
http://www.kenyaforests.org/index.php?option=com_content&task=view&id=61&Itemid=74 (Accessed on 26 November 2008)
KNBS (2008). Kenya National Bureau of Statistics. http://www.cbs.go.ke/ (Accessed on 18 November 2008)
Millennium Promise (2008). “Baseline Report of the MDG Indicators”, Sauri, Kenya http://www.millenniumpromise.org/site/PageServer?pagename=mv_1sauri (Accessed on 31 October 2008)
Minakawa, N., Omukunda, E., Zhou, G., Githeko, A., and Yan, G. (2006). Malaria Vector Productivity in Relation to the Highland Environment in Kenya.American Journal of Tropical Medicine and Hygiene. 75(3): 448-453
Mutuo, P. (2007). “Sauri Millennium Village:Two Years On”. African Green Revolution Conference, Oslo, Norway. http://www.africangreenrevolutionconference.com/2007/pdf/UN_Millennium_Villages_Project.pdf (Accessed on 31 October 2008)
NEE (2008). “Encyclopedia of the Nations: Kenya”. National Economies Encyclopedia. http://www.nationsencyclopedia.com/economies/Africa/Kenya.html (Accessed on 4 December 2008)
Nyangito, H. O. (n.d). “Kenya’s State of Agricultural Trade Reform in the Framework of World Trade Organization”. World Bank and the African Economic Research Consortium. Paper No. TP_08 http://www.aercafrica.org/documents/kenyashort.doc (Accessed on 17 October 2008)
Okwi, P. O., Ndeng’e, G., Kristjanson, P., Arunga, M., Notenbaert, A., Omolo, A., Henninger, N., Benson, T., Kariuki, P., and Owuor, J. (2007). Spatial Determinants of Poverty in Rural Kenya. Proceedings of the National Academy of Sciences 104 (43): 16799 – 16774
Steiner, A. (2006). Speech by Achim Steiner, United Nations Under-Secretary General and Executive Director of the United Nations Environment Programme (UNEP) to the Africities 4 Summit, Nairobi, 8 September, http://www.unep.org/Documents.Multilingual/Default.asp?DocumentID=490&ArticleID=5355&l=en (Accessed on 29 December 2008)
Sulaiman, S. (2007). “How is Climate Change Shifting Africa’s Malaria Map?” SciDev Net. http://www.scidev.net/es/climate-change-and-energy/climate-change-in-africa/opinions/cambio-climtico-altera-mapa-de-la-malaria-en-fri.htm (Accessed on 13 October 2008)
Survey of Kenya (2003). National Atlas of Kenya. Fifth Edition. Survey of Kenya, Nairobi
Thaxton, M. (2007). “Integrating Population, Health, and Environment in Kenya”. Population Reference Bureau, Washington, D.C. http://www.prb.org/pdf07/phe-kenya.pdf (Accessed on 14 October 2008)
UN (2007a). Statistical Yearbook. Fifty-fi rst issue. Department of Economic and Social Affairs. Statistics Division. United Nations.
UN (2007b). “The Millennium Development Goals Report 2007”. United Nations, http://www.un.org/millenniumgoals/pdf/mdg2007.pdf (Accessed on 8 October 2008)
UN (2008). “The Millennium Development Goals Report 2008”. On CD ROM, United Nations
UNDG (2005). “MDGs Status Report for Kenya 2005”. http://www.undg.org/archive_docs/6585-Kenya_Second_MDG_Report_-_Report.pdf. (Accessed on 8 October 2008)
UNDP (2005). “MDGs Status Report for Kenya”. United Nations Development Programme, Government of Kenya, Government of Finland.
UNDP (2006). “Making Progress on Environmental Sustainability”. Lessons and recommendations from a review of over 150 MDG country experiences. Environmental and Energy Group, Bureau for Development Policy, United Nations Development Programme.
UNDP (2007). Millennium Development Goals - Status Report for Kenya – 2007, United Nations Development Programme.
UNDP (2008). “Climate Change and the UN Millennium Development Goals”. http://www.undp.org/gef/adaptation/dev/02a.htm (Accessed on 8 October 2008)
UNEP (2008). Africa: Atlas of our Changing Environment. Division of Early Warning and Assessment (DEWA), United Nations Environment Programme, Nairobi, Kenya
UNStats (2005). “Progress towards the Millennium Development Goals, 1990-2005”. Statistics Division, Department of Economic and Social Affairs of the United Nations Secretariat. http://mdgs.un.org/unsd/mdg/Host.aspx?Content=Products/Progress2005.htm (Accessed on 16 October 2008)
UNStats (2008). “Millennium Development Goals Indicators”. United Nations Statistics Division. Department of Economic and Social Affairs. United Nations. http://unstats.un.org/unsd/mdg/Data.aspx. (Accessed on 16 October 2008)
UN-Water (2006). Kenya National Water Development Report. United Nations http://unesdoc.unesco.org/images/0014/001488/148866E.pdf. (Accessed on 8 October 2008)
USAID (2007). Kenya Food Security Update Report. United States Agency for International Development. http://www.fews.net/docs/Publications/Kenya_200612en.pdf (Accessed 27 October 2008)
USAID (2008). “Kenya Food Security Outlook Report”. United States Agency for International Development. http://www.fews.net/pages/country.aspx?gb=ke&l=en (Accessed on 27 October 2008)
WHO (n.d.) “World Malaria Report 2005”. World Health Organization. http://rbm.who.int/wmr2005/profi les/kenya.pdf (Accessed on 20 December 2008)
WHO (2008). Media Center. World Health Organization. http://www.who.int/mediacentre/factsheets/fs192/en/ (Accessed on 21 October 2008)
WGCCD (2005). “Africa – Up in Smoke?” The second report from the Working Group on Climate Change and Development. Oxfam. http://www.upinsmokecoalition.org/ (Accessed on 9 October 2008)
World Bank. (2008). Progress on the MDGs: September 2008 Update. Global Monitoring Report 2008, MDGs and the Environment Agenda for Inclusive and Sustainable Development. The World Bank, Washington D.C. http://web.worldbank.org/WBSITE/EXTERNAL/EXTDEC/EXTGLOBALMONITOR/EXTGLOMONREP2008/0,,contentMDK:21901842~menuPK:4738069~pagePK:64168445~piPK:64168309~theSitePK:4738057,00.html. (Accessed on 8 October 2008)
Ch
rist
ian
La
mb
rech
ts/U
NEP
66
Will
iam
Wa
rby/
Flic
kr.
com