chapter 2 : economic outlook for 2010 and … · of securities from its portfolio with an agreement...
TRANSCRIPT

20
CHAPTER 2 : ECONOMIC OUTLOOK FOR 2010 AND THE MEDIUM TERM
Summary
• The global recovery that began in mid-2009 should continue into 2010. But the pace of recovery is likely to be uneven and also vary across regions. Asian economies, particularly the Mainland and India, the two major emerging markets, are expected to take the lead in the recovery process. With the bounce-back in global production and trade, and with Asia more advanced in the recovery, Hong Kong’s external sector looks set for a further rebound in 2010, continuing the momentum in late 2009.
• Locally, consumer and business sentiments have been strengthening since
the latter half of last year, and with labour market conditions on the mend and the expected improvement in incomes, consumption is expected to gain further strength through the year. With much improved business sentiment after a dismal 2009, private investment should also stage some revival. Public sector works, underpinned by infrastructure construction, are expected to accelerate further and add strength to the recovery in domestic demand.
• Granting no major relapse in the global economy to the extent of disrupting
the recovery process now in Asia, the Hong Kong economy is forecast to revert to positive annual growth of 4% to 5% in 2010. Growth is likely to be driven by both external trade and domestic demand initially, but the outlook is a bit more uncertain in the second half after the exceptional fiscal boosts in major advanced economies are phased out.
• The main issue clouding over the economic outlook this year is the fragile
nature of the global recovery, especially with the economies in the United States and Europe merely driven by the extraordinary fiscal and monetary measures. Whether their private sector demand can take hold and fill the gap after the exceptionally large stimulus are withdrawn remains to be seen. The vulnerable fiscal positions of some European economies, the increasing risk of asset market bubbles in emerging market economies, increased volatility of the US dollar, and the rise of protectionism are also issues of concern. Being small and open, the Hong Kong economy will inevitably be affected if there are significant disruptions to the global recovery.
• With the economic recovery taking hold, some price pressures are likely to
return. Yet given the slack in the global economy, inflationary pressures
21
should remain moderate in most of 2010. Underlying consumer price inflation is forecast at 1.5% in 2010. Headline consumer price inflation will be slightly higher, forecast at 2.3%. Several factors may pose some upside risks to inflation and need to be closely monitored. These include the timing of exit strategy pursued by the major economies, the risk of rising food and oil prices in the international markets, and the possible weakening of the US dollar.
• The medium-term prospects for the Hong Kong economy are bright. Hong
Kong will continue to enhance its competitiveness and move towards a high value-added, knowledge-based economy. The strengthening economic relations with the Mainland will continue to uphold Hong Kong’s status as an international financial centre and a regional business hub. New initiatives will also be taken to deepen the integration with the Pearl River Delta and co-operation with the rest of the Mainland. Policy measures will be in place to promote the six recently identified economic areas to facilitate diversification and to complement the development of the traditional pillar industries. The large-scale infrastructure projects will enter their peak construction period in the coming years, thereby providing the impetus to aggregate demand in the economy. When completed, they will also significantly raise the productivity and efficiency of the economy. The trend GDP growth rate in real terms is forecast at 4% per annum from 2011 to 2014, and the trend rate of underlying consumer price inflation at 3%.
Major external factors 2.1 The global economy is gradually recovering from the worst recession in more than 60 years as the exceptionally large fiscal and monetary stimulus measures by governments and central banks helped to shore up demand and pulled the global economy from the brink of another Great Depression. Financial market conditions have also improved significantly. The global recovery process is expected to continue in 2010. However, the pace of recovery is likely to be uneven and vary vastly across regions. In the advanced economies, particularly the US and EU, economic growth is still constrained by the deleveraging process in both the household and banking sectors, and the growth momentum of private sector demand is still insufficient. The risk of a relapse into recession in these economies cannot be ruled out for sure. In this context, the timing and tactics of implementing exit strategies in these economies have become all the more important (Box 2.1).

22
Box 2.1
Unconventional monetary policy and its exit strategy in the United States
After the outbreak of the sub-prime mortgage crisis in mid-2007 in the United States, the Federal Reserve (the Fed) had been easing its monetary policy aggressively, through successive cuts in the Fed Fund Target Rate. By the end of April 2008, the Target Rate was cut cumulatively by 325 basis points(1). However, the abrupt escalation of the financial crisis in the latter part of 2008 prompted the Fed to step up its pursuit of unconventional monetary policy, on top of further cuts in the Fed Fund Target Rate to 0-0.25% by mid-December 2008.
Unconventional monetary policy refers to the means through which a central bank can provide additional monetary stimulus when its policy rates are close to the zero bound. Broadly speaking, the Fed carried out unconventional measures through four approaches. First, the Fed explicitly committed to keep short-term interest rates low in order to anchor market expectations, as enshrined in the statements by the Federal Open Market Committee (FOMC) since the latter part of 2008 and by the Fed officials on various public occasions. Second, the Fed provided extraordinary amounts of low-cost, short-term financing to financial institutions through existing or new facilities(2). Third, the Fed purchased longer-term government securities such as the US Treasuries and government-sponsored enterprise (GSE) debt with a view to reduce long-term private borrowing rates. Fourth, the Fed provided liquidity direct to borrowers and investors in key credit markets that saw dislocations(3). The latter three approaches share the common feature of making use of the asset side of the Fed’s balance sheet (i.e. involve lending or purchase of securities).
By now, the Fed’s extraordinary policy actions, many of which were unprecedented, have brought down the systemic risk in the financial markets significantly, and eased the liquidity risk through increased availability of short-term financing. However, the large expansion in the Fed’s balance sheet has also led to concerns that the excess liquidity could transform into rapid credit growth and thus inflation.
____________________ (1) Also, the spread between the primary discount window rate and the policy rate was cut to 25 basis
points from the usual 100 basis points within this time period. (2) For example, the term of the discount window loans was increased from overnight to 90 days; and new
facilities such as Term Auction Facility, Term Securities Lending Facility, and Primary Dealer Credit Facility were created to allow the Fed to provide liquidity to financial institutions based on collaterals which saw sharp decline in liquidity during the crisis time.
(3) These included the Asset-backed Commercial Paper Money Market Mutual Fund Liquidity Facility,
the Commercial Paper Funding Facility, the Money Market Investor Funding Facility, and the Term Asset-backed Securities Loan Facility.

23
Box 2.1 (Cont’d)
To address the issue, Fed Chairman Bernanke acknowledged publicly at the relatively early stage of the financial tsunami that the Fed will have to unwind its various lending programs at some point to be consistent with the Fed’s obligation to foster full employment and price stability(4). On various occasions later last year, specific ways were outlined through which the Fed could actively drain liquidity in the markets when the economic outlook allows them to do so. They are as followed: 1) the Fed could arrange large-scale reverse repurchase agreements (reverse repos) with financial market participants, involving the sale by the Fed of securities from its portfolio with an agreement to buy the securities back at a slightly higher price at a later date. In fact, the Fed confirmed that it had been conducting tests of reverse repos as announced in mid-October last year; 2) the Treasury could sell bills and then deposit the proceeds with the Federal Reserve; 3) the Fed could pay interest on the balances held by banks at the Fed, using the authority delegated by the Congress in the fall of 2008. On 28 December 2009, the Fed issued a consultation paper for changing its rules to enable the Fed to offer interest-bearing term deposits to eligible institutions through an auction mechanism; 4) the Fed could reduce reserves by selling a portion of its holdings of long-term securities in the open market. In fact, the size of the Fed’s balance sheet can contract automatically, as improving financial conditions lead to reduced use of the Fed’s liquidity facilities. As shown in Chart 1, most of the liquidity facilities by the Fed wound down significantly over 2009. Nevertheless, the size of the Fed’s balance sheet stayed broadly steady in 2009 (see Chart 2). The winding down of the liquidity facilities was offset by the significant increase in the level of securities held by the Fed over the course of the year, principally reflecting purchases of Treasury, agency, and agency-guaranteed mortgage-backed securities under the large scale asset purchase program announced by the FOMC. Chart 1 The usage of liquidity facilities provided by the Fed saw decline over time as
financial conditions improved
0
200
400
600
800
1,000
1,200
1,400
1,600
1,800
8/07 10/07 12/07 2/08 4/08 6/08 8/08 10/08 12/08 2/09 4/09 6/09 8/09 10/09 12/09 2/10
All Liquidity Facilities*Term Auction CreditCommercial Paper Funding FacilityCentral Bank Liquidity Swaps
US$Bn
____________________
(4) Fed Chairman Bernanke’s speech at the London School of Economics on 13 January 2009.
(http://www.federalreserve.gov/newsevents/speech/bernanke20090113a.htm)
24
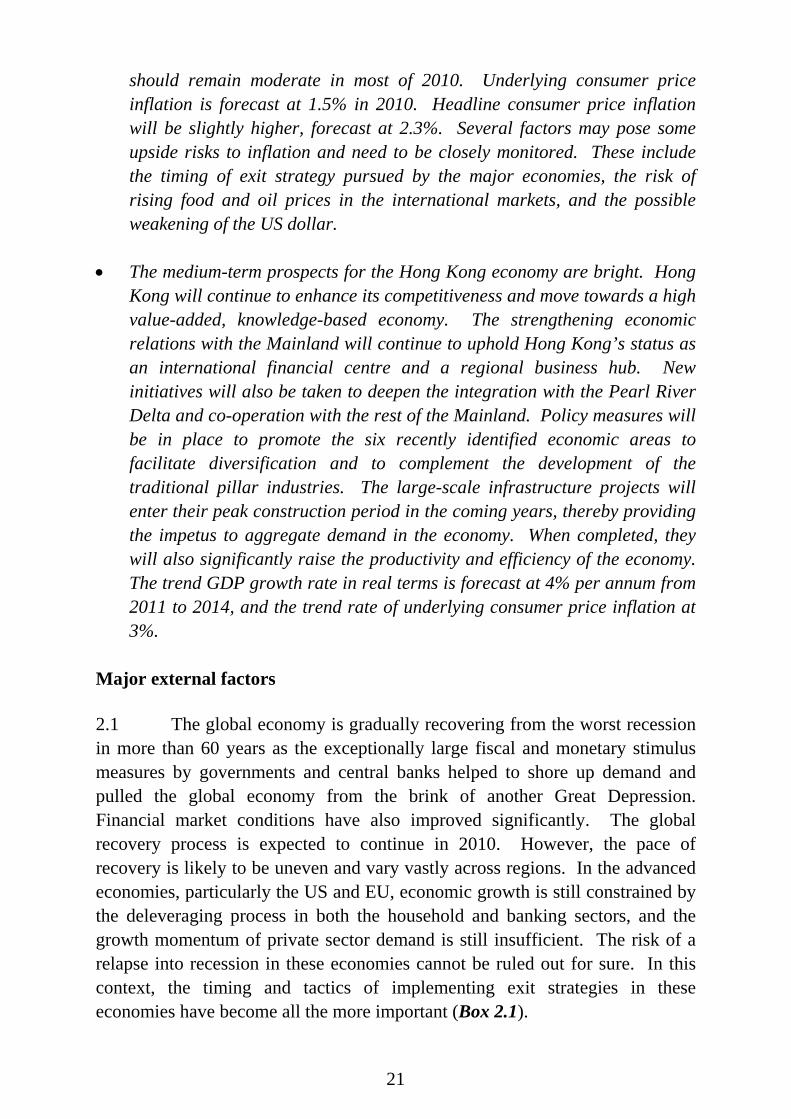
Box 2.1 (Cont’d) Chart 2 The composition of the balance sheet of the Federal Reserve changed as the
situation in the financial markets evolved
0
500
1,000
1,500
2,000
2,500
8/07 10/07 12/07 2/08 4/08 6/08 8/08 10/08 12/08 2/09 4/09 6/09 8/09 10/09 12/09 2/10
Total AssetsSecurities Held OutrightAll Liquidity Facilities*
US$Bn
Note: (*) All Liquidity Facilities include: Term Auction credit; primary credit; secondary credit; seasonal
credit; Primary Dealer Credit Facility; Asset-Backed Commercial Paper Money Market Mutual Fund Liquidity Facility; Term Asset-Backed Securities Loan Facility; Commercial Paper Funding Facility; outstanding principal amount of loans to American International Group, Maiden Lane LLC, Maiden Lane II LLC, Maiden Lane III LLC, and TALF LLC; and central bank liquidity swaps.
Summarized as “credit easing” policy approach, the Fed had adopted a varying mix of policy actions as the economic crisis evolved since mid-2007 or so. Similarly, the central banks of other major economies also adopted extraordinary policy actions, though the exact measures undertaken could be different depending on the institutional arrangements, to ease the monetary conditions in their economies. These measures made their mark in stabilising the overall economic situation as the global economy reversed to expansion since the latter half of 2009. While the recent situation of the US economy “are likely to warrant exceptionally low rates of an extended period”, as highlighted by the FOMC ‘s statement in late January this year, several of the Fed’s special liquidity facilities were already closed and most of the others would not be extended upon expiry in the coming months(5). Later, in his testimony to the Congress in mid-February, Fed Chairman Bernanke outlined a possible sequencing of steps and combination of tools to be deployed by the Fed in its exit strategy(6). The timing and the pace that the Fed is going to unwind its unconventional measures will bear important implication to the global economy in the period ahead. A premature withdrawal could risk a relapse to recession, while delayed action could inflict high inflation. The development in the Fed’s exit strategy has to be closely watched over as one of the key determinants of the global economic performance this year, and hence the performance of the Hong Kong economy, given its high degree of external orientation.
____________________ (5) FOMC’s statement on 27 January 2010.
(http://www.federalreserve.gov/newsevents/press/monetary/20100127a.htm)
(6) Bernanke’s testimony on the Fed’s exit strategy before the US House of Representatives. (http://www.federalreserve.gov/newsevents/testimony/bernanke20100210a.htm)

25
2.2 Emerging market economies in Asia, particularly the Mainland and India, are expected to take the lead in the recovery process. The rapid return to robust growth in the Mainland has benefited Hong Kong substantially and acted as an important anchor to the entire region during the crisis. Hong Kong, given its close economic ties with the Mainland and other Asian economies, should continue to benefit from the vibrant growth in Mainland and also the further recovery in Asia.
0
50
100
150
200
250
300
350
400
450
500
11/06 2/07 5/07 8/07 11/07 2/08 5/08 8/08 11/08 2/09 5/09 8/09 11/09
TED spreadOIS spread
Spreads (bps)
Diagram 2.1 : Global financial conditions have improved notablybut credit growth remains constrained by deleveraging
Global economic outlook 2.3 The US economy, the epicentre of the financial tsunami, has resumed growth in the latter half of last year, helped in a large part by the enormous fiscal and monetary stimulus measures. Retail sales have been expanding at a moderate pace, while import demand also tends to bottom out. However, the fundamentals of the recovery remain weak. Specifically, business investment is still lacklustre, unemployment is severe, job creation has yet to come, credit supply continues to be tight, and a visible turnaround in the property market remains to be seen. The on-going deleveraging process among US households and financial institutions as they rebuild their balance sheet strength will continue to contain the pace of recovery. Whether economic growth in the US will sustain, upon the withdrawal of fiscal and monetary stimulus measures, remains an issue of considerable concern to the entire world. 2.4 The EU economy actually suffered a deeper contraction than the US in the synchronised recession triggered by the global financial tsunami. While
26
the EU economy likewise resumed growth in the latter part of 2009 under the support of public sector policy, the pace of rebound is even slower than the US, and the tone of the recovery still very sluggish under severe credit restraint and rising unemployment. In addition, the fragile fiscal conditions in certain EU economies, such as Greece, Spain and Portugal, have added to the woes. These can be an additional source of risk to the economic outlook for the EU and even to the stability of the global financial markets. 2.5 Japan’s recovery from its worst recession in the post-war era is also likely to remain anaemic for some time to come. Business sentiment and private sector demand in general, while showing relative improvement of late, are still lacklustre. The possibility of a prolonged deflation is an additional issue for the Japanese economy. The fact that the Japanese government announced another round of stimulus measures in December last year in addition to the four rounds of measures announced between August 2008 and April 2009 underlines the prevailing weak status of the Japanese economy. 2.6 In sum, the current recovery in the advanced economies is mainly led by public sector policy stimulus, while a more notable revival in private sector demand has yet to be seen. The recovery is expected to be slow by past standards and could be uneven and bumpy in 2010. The real challenge will emerge in the latter part of the year when the support from stimulus measures begins to wane. In late January this year, the International Monetary Fund (IMF) forecast GDP growth in advanced economies at 2.1%, following a sharp contraction of 3.2% estimated for 2009. 2.7 In contrast, emerging economies in Asia have embarked on a firmer recovery path. Being heavily export-dependent, these economies inevitably took a heavy blow during the worst time of the crisis in the early part of 2009. Nevertheless, the firmer footing of these economies as compared to the Asian Financial Crisis in 1997-98, coupled with timely and appropriate policy actions, led to a faster recovery across the region. The swift return to a faster growth path in the Mainland economy since the second quarter of last year has contributed significantly to the stabilisation in the Asian region as a whole, providing a cushion against the shocks from the advanced economies. Granting no significant relapse in the US and European economies, the growth momentum in emerging Asia is likely to sustain and pick up further in 2010. According to the IMF, developing economies in Asia are forecast to grow by 8.4% in 2010, distinctly up from that of 6.5% growth in 2009. China and India will be the two major growth engines with growth forecast at 10.0% and 7.7% respectively.
27
-4
-2
0
2
4
6
8
10
2003 2004 2005 2006 2007 2008 2009 2010 * 2011 *
World
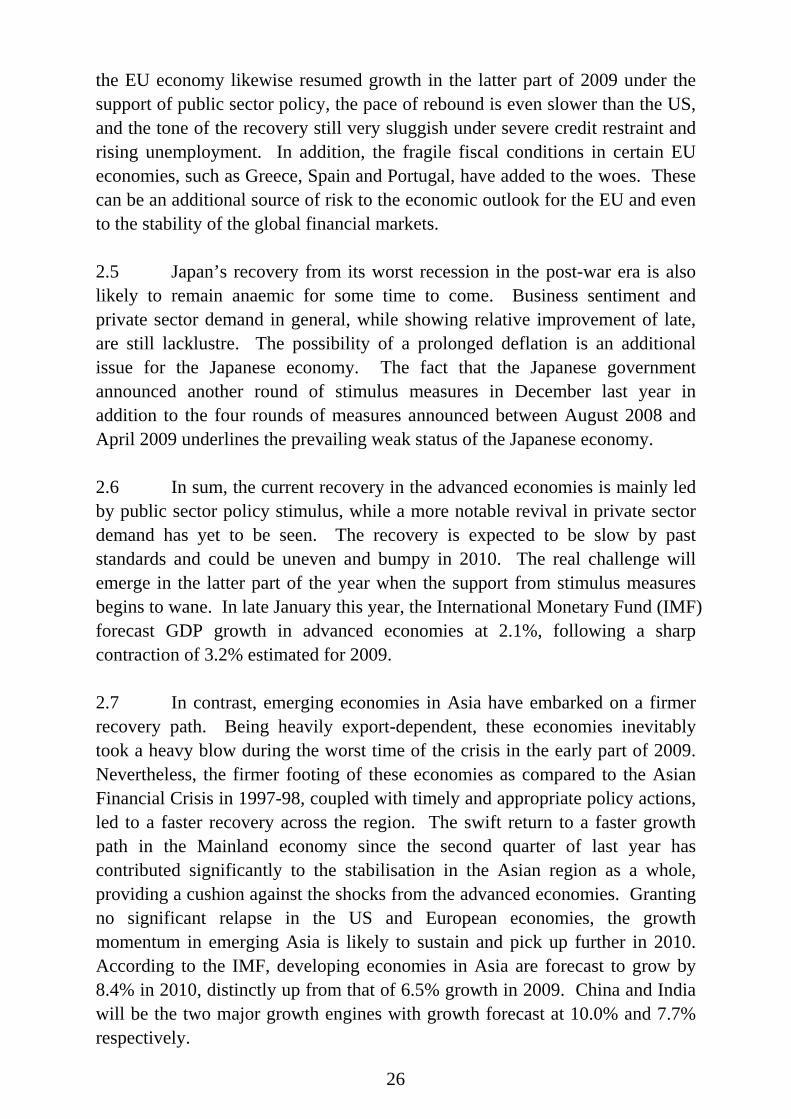
Source: IMF World Economic Outlook Update January 2010. (*) Forecast from the IMF.
Advanced economies
Emerging anddeveloping economies
Diagram 2.2 : Developing and emerging market economies will take the leadin the recovery process
Year-on-year rate of change in real terms (%)
2.8 For the Mainland economy in particular, growth momentum is expected to pick up distinctly further in 2010, benefiting on one hand from the normalisation of global trade, and on the other hand the structural economic transformation, shifting the sources of growth from investment to consumption. Since the end of last year, the Central Government has been taking steps to fine-tune the economy to redress the overcapacity sectors, rein in asset bubbles and contain inflation expectations. These will be conducive to the macroeconomic stability of the Mainland economy, thereby beneficial to Hong Kong’s economic performance in the period ahead.
28
Table 2.1 : Growth forecasts for major economies in 2010
2010
2009*
(%) IMF*
(%)
Private sector forecast ^
(%) World -0.8 3.9 - Advanced economies -3.2 2.1 -
US -2.4# 2.7 3.1 Euro area -3.9 1.0 1.3
Japan -5.3 1.7 1.5 Emerging market and
developing economies 2.1 6.0 - Developing Asia 6.5 8.4 -
Mainland China 8.7# 10.0 9.8 India 5.6 7.7 8.0
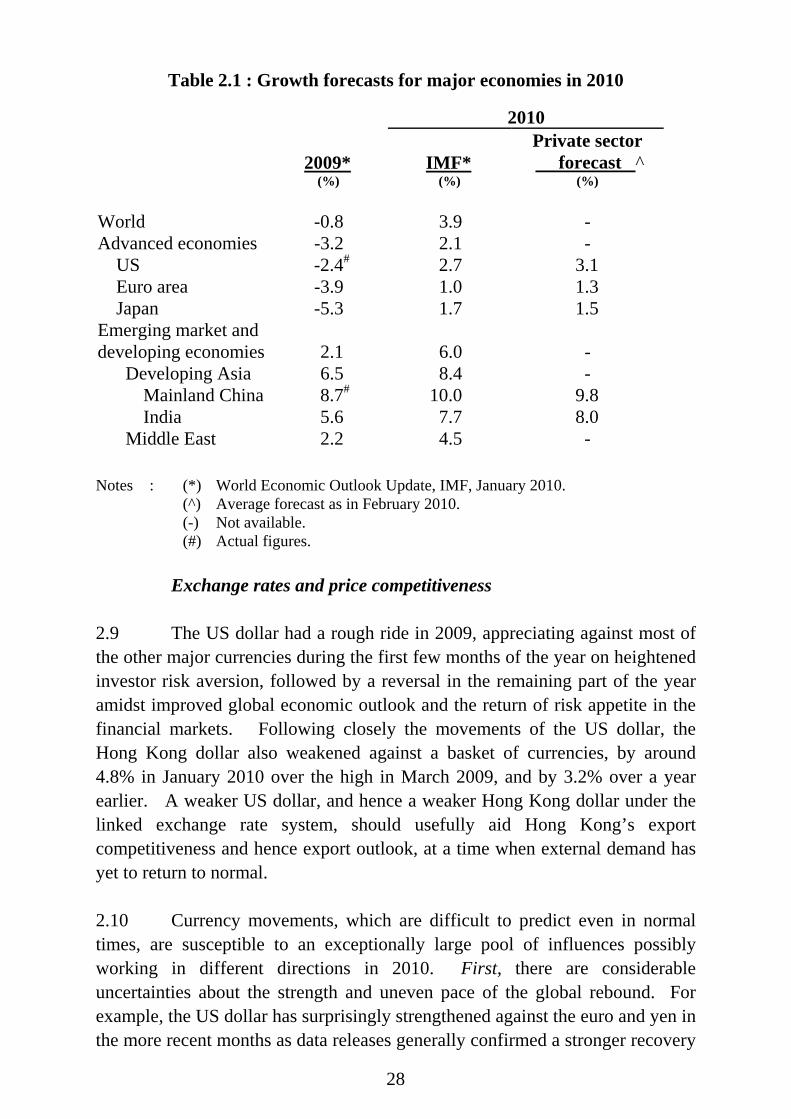
Middle East 2.2 4.5 - Notes : (*) World Economic Outlook Update, IMF, January 2010. (^) Average forecast as in February 2010. (-) Not available. (#) Actual figures. Exchange rates and price competitiveness 2.9 The US dollar had a rough ride in 2009, appreciating against most of the other major currencies during the first few months of the year on heightened investor risk aversion, followed by a reversal in the remaining part of the year amidst improved global economic outlook and the return of risk appetite in the financial markets. Following closely the movements of the US dollar, the Hong Kong dollar also weakened against a basket of currencies, by around 4.8% in January 2010 over the high in March 2009, and by 3.2% over a year earlier. A weaker US dollar, and hence a weaker Hong Kong dollar under the linked exchange rate system, should usefully aid Hong Kong’s export competitiveness and hence export outlook, at a time when external demand has yet to return to normal. 2.10 Currency movements, which are difficult to predict even in normal times, are susceptible to an exceptionally large pool of influences possibly working in different directions in 2010. First, there are considerable uncertainties about the strength and uneven pace of the global rebound. For example, the US dollar has surprisingly strengthened against the euro and yen in the more recent months as data releases generally confirmed a stronger recovery

29
in the United States than in Europe and Japan. But market sentiment may also easily swing back if incoming data releases disappoint the markets about the strength of the recovery going forward. Secondly, further complicating the situation are the additional uncertainties about the timing of exit strategies and possibly the differentiated pace in the unwinding of stimulus. A dilemma here is that a premature exit could stifle recovery and stir up renewed volatility to the financial markets, while delayed actions could add concern about inflation hikes. Thirdly, rising concern about worsening fiscal position and mounting public debt is another potential source of instability to the global exchange rate and financial markets. Thus, while the prevailing market view tends to see further weakness and downside to the US dollar, the currency developments in the period ahead are far from certain. Indeed, it is not unlikely that 2010 may see considerable fluctuations in the foreign exchange markets as the balance of different factors shifts through the year.
0.60
0.62
0.64
0.66
0.68
0.70
0.72
0.74
0.76
0.78
0.80
0.82
0.84
1/07 7/07 1/08 7/08 1/09 7/09 1/100.440.460.480.500.520.540.560.580.600.620.640.660.680.700.720.74
euro/US$pound/US$
85
90
95
100
105
110
115
120
125
1/07 7/07 1/08 7/08 1/09 7/09 1/101.30
1.35
1.40
1.45
1.50
1.55
1.60Yen/US$S$/US$
Diagram 2.3 : Exchange rate volatility likely to remain high in 2010(a) against euro and pound sterling (b) against yen and Singapore dollar
₤ S$Yen€
2.11 Given Hong Kong’s close economic relationships with the Mainland, the value of the Renminbi is also a key factor affecting the performance of Hong Kong’s external sector, including both trade in goods and services. The Renminbi had stayed more or less stable against the US dollar throughout 2009, despite foreign pressure from time to time on the Renminbi to appreciate. A stable Renminbi can help to reduce the exchange rate uncertainty facing Hong Kong companies given our integrated supply chain with the Mainland and our close ties on other fronts.

30
80
90
100
110
120
130
140
150
160
170
180
190
7/05 1/06 7/06 1/07 7/07 1/08 7/08 1/09 7/09 1/10
RMB against US$ RMB against EuroRMB against Yen RMB against S$RMB against Won
Index (20 Jul 2005=100)
Diagram 2.4 : A stable renminbi will help to reducethe uncertainty facing Hong Kong's traders
Note : An increase in the index represents an appreciation of renminbi against the currency concerned.
World inflation and global commodity prices
2.12 Inflationary pressures subsided on a world-wide basis in 2009 amid the global recession. Some economies even saw deflation as aggregate demand fell short of supply by a sizable margin. With the global economy likely to recover further in 2010, it is reasonable to see the return of some inflationary pressures in many economies around the world. But the extent of inflation should be contained so long as the recovery in demand of many economies is only filling up part of the spare capacity left during the severe recession in 2009. It is also important that central banks and governments of the major economies should uphold the transparency of their exit strategies to ensure inflation expectations be well-anchored. 2.13 However, the movements of the world commodity prices, particularly food and oil prices, could add uncertainty to the inflation outlook around the world. After the significant retreat during the latter half of 2008, food and oil prices have re-established their uptrend since early 2009, fuelled partly by better global economic outlook and partly by a weaker US dollar. Between February and December 2009, the United Nations Food and Agriculture Organization’s World Food Price Index rose by a cumulative 24%, and the Brent crude oil price by 74%, though their levels were still notably lower than the corresponding highs in 2008. The potential volatility in the prices of food, crude oil and other commodities could be a challenge to governments and central banks around the world in promoting price stability, and will also pose some upside risks to Hong Kong’s imported inflation.

31
80
100
120
140
160
180
200
220
240
260
1/05 7/05 1/06 7/06 1/07 7/07 1/08 7/08 1/09 7/09
Index (2005=100)
Diagram 2.5 : Higher food and oil prices could pose upside risks to global inflation
FoodAgricultural materials and metals
Fuel (energy)
Note : Indices as depicted refer to IMF's commodity price indices.
Major sources of risks
2.14 While the recovery is underway and recessionary forces have by now receded significantly, downside risks to the global economic outlook remain a concern. First, there is considerable concern about the shaky fundamentals of the advanced economies, which casts doubt on whether private demand can take up the role in driving the recovery when the exceptional fiscal stimulus is removed. Secondly, the timing and pace of the implementation of exit strategies by governments and central banks, and potential disruptions they may cause to fund flows across the region, are another major source of uncertainty for the financial and asset markets, as already pointed out in Paragraph 2.10. Thirdly, equally worrying are the headwinds from rising protectionist sentiments in the United States and Europe, where unemployment is still severe. This could pose a major and perhaps on-going threat to the trade-dependent Asia, including Hong Kong. Fourthly, while financial market conditions have generally improved, the Dubai World incident and the rating actions on several debt-laden European economies are timely reminders that the financial crisis may not be fully over as yet. There is risk, no matter how remote it looks at present, that the debt crisis could escalate into a sovereign credit confidence crisis, and their potential disruptions to the global financial markets cannot be taken lightly. Fifthly, for emerging economies in Asia, the flush of liquidity into these economies, driven by better economic prospect in the region and the prevailing highly accommodative monetary environment, could be sowing seeds for other problems and sources of macroeconomic vulnerabilities in the region that may disrupt the ongoing recovery process.
32
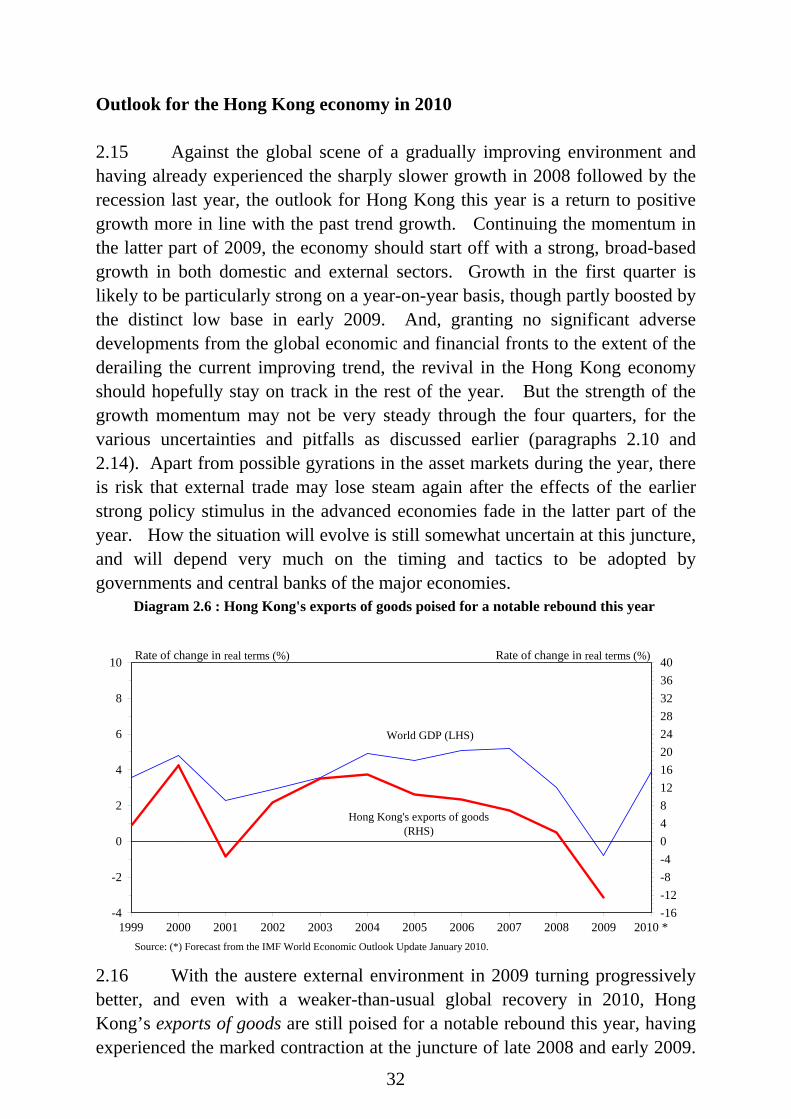
Outlook for the Hong Kong economy in 2010 2.15 Against the global scene of a gradually improving environment and having already experienced the sharply slower growth in 2008 followed by the recession last year, the outlook for Hong Kong this year is a return to positive growth more in line with the past trend growth. Continuing the momentum in the latter part of 2009, the economy should start off with a strong, broad-based growth in both domestic and external sectors. Growth in the first quarter is likely to be particularly strong on a year-on-year basis, though partly boosted by the distinct low base in early 2009. And, granting no significant adverse developments from the global economic and financial fronts to the extent of the derailing the current improving trend, the revival in the Hong Kong economy should hopefully stay on track in the rest of the year. But the strength of the growth momentum may not be very steady through the four quarters, for the various uncertainties and pitfalls as discussed earlier (paragraphs 2.10 and 2.14). Apart from possible gyrations in the asset markets during the year, there is risk that external trade may lose steam again after the effects of the earlier strong policy stimulus in the advanced economies fade in the latter part of the year. How the situation will evolve is still somewhat uncertain at this juncture, and will depend very much on the timing and tactics to be adopted by governments and central banks of the major economies.
-4
-2
0
2
4
6
8
10
1999 2000 2001 2002 2003 2004 2005 2006 2007 2008 2009 2010 *-16-12-8-40481216202428323640
Diagram 2.6 : Hong Kong's exports of goods poised for a notable rebound this year
Rate of change in real terms (%)
World GDP (LHS)
Hong Kong's exports of goods(RHS)
Rate of change in real terms (%)
Source: (*) Forecast from the IMF World Economic Outlook Update January 2010. 2.16 With the austere external environment in 2009 turning progressively better, and even with a weaker-than-usual global recovery in 2010, Hong Kong’s exports of goods are still poised for a notable rebound this year, having experienced the marked contraction at the juncture of late 2008 and early 2009.
33
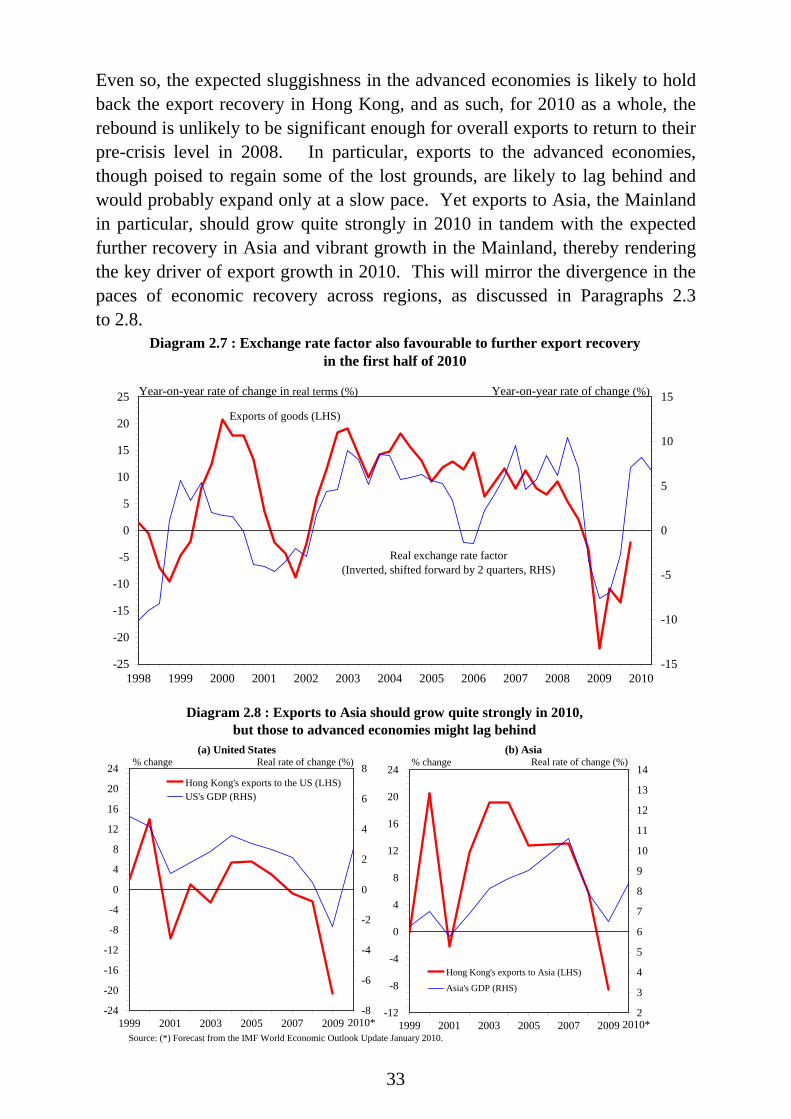
Even so, the expected sluggishness in the advanced economies is likely to hold back the export recovery in Hong Kong, and as such, for 2010 as a whole, the rebound is unlikely to be significant enough for overall exports to return to their pre-crisis level in 2008. In particular, exports to the advanced economies, though poised to regain some of the lost grounds, are likely to lag behind and would probably expand only at a slow pace. Yet exports to Asia, the Mainland in particular, should grow quite strongly in 2010 in tandem with the expected further recovery in Asia and vibrant growth in the Mainland, thereby rendering the key driver of export growth in 2010. This will mirror the divergence in the paces of economic recovery across regions, as discussed in Paragraphs 2.3 to 2.8.
-25
-20
-15
-10
-5
0
5
10
15
20
25
1998 1999 2000 2001 2002 2003 2004 2005 2006 2007 2008 2009 2010-15
-10
-5
0
5
10
15
Diagram 2.7 : Exchange rate factor also favourable to further export recoveryin the first half of 2010
Year-on-year rate of change in real terms (%)
Exports of goods (LHS)
Real exchange rate factor(Inverted, shifted forward by 2 quarters, RHS)
Year-on-year rate of change (%)
-24
-20
-16
-12
-8
-4
0
4
8
12
16
20
24
1999 2001 2003 2005 2007 2009-8
-6
-4
-2
0
2
4
6
8Hong Kong's exports to the US (LHS)US's GDP (RHS)
-12
-8
-4
0
4
8
12
16
20
24
1999 2001 2003 2005 2007 20092
3
4
5
6
7
8
9
10
11
12
13
14
Hong Kong's exports to Asia (LHS)
Asia's GDP (RHS)
Diagram 2.8 : Exports to Asia should grow quite strongly in 2010,but those to advanced economies might lag behind
(a) United States (b) Asia
Source: (*) Forecast from the IMF World Economic Outlook Update January 2010.
Real rate of change (%)
2010* 2010*
% change Real rate of change (%)% change

34
2.17 In comparison, the outlook for exports of services is even more encouraging. Exports of finance, business and other services have already shown a marked revival since the latter part of 2009, benefiting from the increase of Mainland-related IPO activities and the return of business in tandem with the regional recovery. This trend will hopefully gather further momentum in 2010. Inbound tourism, which was relatively resilient all through 2009, is likely to stay vibrant and provide a stable growth source for exports of services. Offshore trade and other services related to merchandise trade will likewise benefit from the rebound in global and regional trade flows.
0
200
400
600
800
1,000
1,200
1,400
1,600
1,800
2005 2006 2007 2008 200930
35
40
45
50
55 Hong Kong's total exports to Mainland
Hong Kong's imports from Mainland
% share of total trade with Mainland in Hong Kong's total trade
(a) Merchandise trade
HK$Bn Percent
0
10
20
30
40
50
60
70
80
90
100
2005 2006 2007 2008 200950
52
54
56
58
60
62
64
66
68
70 Visitor arrivals from Mainland
Hong Kong resident departures to Mainland
% share of visitor arrivals from Mainland intotal incoming visitors
(b) Visitor arrivals from Mainland and HongKong resident departures to Mainland
PercentNumber (million)
Diagram 2.9 : Robust growth in the Mainland economywill continue to benefit Hong Kong
0
5
10
15
20
25
2005 2006 2007 2008 200930
35
40
45
50
55
60
65
70 Total Mainland enterprises % share of Mainland enterprises
(c) Market capitalisation of Mainland enterprisesin the Hong Kong stock market
(end-year figures)
HK$Tn Percent
0
5
10
15
20
25
30
35
40
45
2005 2006 2007 2008
Hong Kong's inward direct investment from Mainland
Mainland's foreign direct investment from Hong Kong
(d) Mainland's foreign direct investment fromHong Kong and Hong Kong's inward direct
investment from Mainland
US$Bn
35
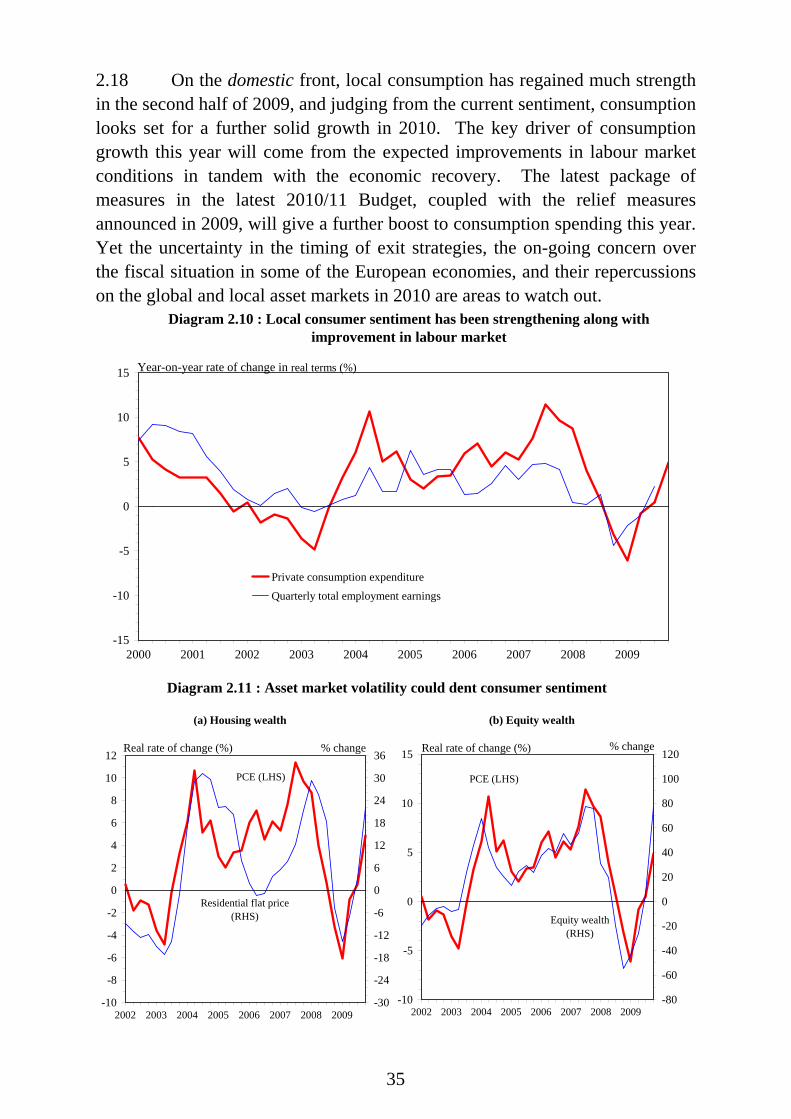
2.18 On the domestic front, local consumption has regained much strength in the second half of 2009, and judging from the current sentiment, consumption looks set for a further solid growth in 2010. The key driver of consumption growth this year will come from the expected improvements in labour market conditions in tandem with the economic recovery. The latest package of measures in the latest 2010/11 Budget, coupled with the relief measures announced in 2009, will give a further boost to consumption spending this year. Yet the uncertainty in the timing of exit strategies, the on-going concern over the fiscal situation in some of the European economies, and their repercussions on the global and local asset markets in 2010 are areas to watch out.
-15
-10
-5
0
5
10
15
2000 2001 2002 2003 2004 2005 2006 2007 2008 2009
Private consumption expenditure
Quarterly total employment earnings
Diagram 2.10 : Local consumer sentiment has been strengthening along withimprovement in labour market
Year-on-year rate of change in real terms (%)
-10
-8
-6
-4
-2
0
2
4
6
8
10
12
2002 2003 2004 2005 2006 2007 2008 2009-30
-24
-18
-12
-6
0
6
12
18
24
30
36
PCE (LHS)
Residential flat price(RHS)
-10
-5
0
5
10
15
2002 2003 2004 2005 2006 2007 2008 2009-80
-60
-40
-20
0
20
40
60
80
100
120Real rate of change (%)
Diagram 2.11 : Asset market volatility could dent consumer sentiment
(a) Housing wealth
PCE (LHS)
(b) Equity wealth
Equity wealth(RHS)
% changeReal rate of change (%) % change

36
2.19 Overall investment will similarly recover, with business confidence now much improved upon the better economic prospects. Indeed, the results of the latest Business Tendency Survey conducted by the Census and Statistics Department indicate an across-the-board uptick in business sentiments towards the year-end. Adding to the strength of overall investment is the expected pick-up in infrastructure construction, which should provide further impetus to Hong Kong’s recovery process and render a cushion against the possible renewed weakening in the external sector in the latter part of the year.
-60-50-40-30-20-10
0102030405060
2005 2006 2007 2008 2009 2010-15
-12
-9
-6
-3
0
3
6
9
12
15
Expected change inbusiness situation (LHS)
Net balance indicates the direction of expected change in business situation versus preceding quarter. It refers tothe difference in percentage points between the proprotion of establishments choosing "better" over that choosing"worse". A positive sign indicates a likely upward trend while a negative sign, a likely downward trend.
Note : (*)
Net balance* (% point)
Real GDP growth (RHS)
Year-on-year rate of change in real terms (%)
Diagram 2.12 : Business sentiment turned up distinctly since the latter part of 2009
-30
-20
-10
0
10
20
30
2006 2007 2008 2009 2010-5
-4
-3
-2
-1
0
1
2
3
4
5Business expectation
on employment (LHS)
Notes : (*)
(#)
Net balance* (% point)
Employment# growth (RHS)
Year-on-year rate of change in real terms (%)
Diagram 2.13 : Business expectation on employment also turned more positive
Net balance indicates the direction of expected change in number of persons engaged versus preceding quarter. Itrefers to the difference in percentage points between the proportion of establishments choosing "up" over thatchoosing "down". A positive sign indicates a likely upward trend while a negative sign, a likely downward trend.Employment in private sector.
37
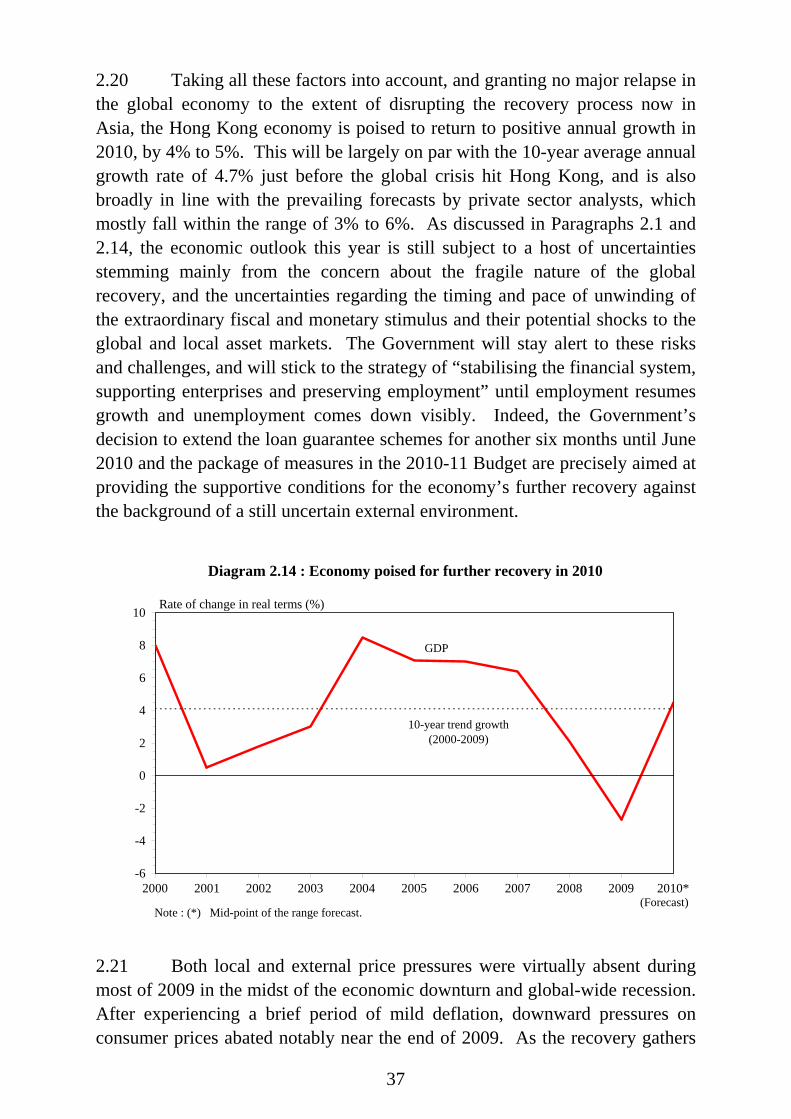
2.20 Taking all these factors into account, and granting no major relapse in the global economy to the extent of disrupting the recovery process now in Asia, the Hong Kong economy is poised to return to positive annual growth in 2010, by 4% to 5%. This will be largely on par with the 10-year average annual growth rate of 4.7% just before the global crisis hit Hong Kong, and is also broadly in line with the prevailing forecasts by private sector analysts, which mostly fall within the range of 3% to 6%. As discussed in Paragraphs 2.1 and 2.14, the economic outlook this year is still subject to a host of uncertainties stemming mainly from the concern about the fragile nature of the global recovery, and the uncertainties regarding the timing and pace of unwinding of the extraordinary fiscal and monetary stimulus and their potential shocks to the global and local asset markets. The Government will stay alert to these risks and challenges, and will stick to the strategy of “stabilising the financial system, supporting enterprises and preserving employment” until employment resumes growth and unemployment comes down visibly. Indeed, the Government’s decision to extend the loan guarantee schemes for another six months until June 2010 and the package of measures in the 2010-11 Budget are precisely aimed at providing the supportive conditions for the economy’s further recovery against the background of a still uncertain external environment.
-6
-4
-2
0
2
4
6
8
10
2000 2001 2002 2003 2004 2005 2006 2007 2008 2009 2010*
GDP
10-year trend growth(2000-2009)
Diagram 2.14 : Economy poised for further recovery in 2010
Rate of change in real terms (%)
Note : (*) Mid-point of the range forecast.(Forecast)
2.21 Both local and external price pressures were virtually absent during most of 2009 in the midst of the economic downturn and global-wide recession. After experiencing a brief period of mild deflation, downward pressures on consumer prices abated notably near the end of 2009. As the recovery gathers

38
pace going forward, some modest price pressures are likely to return, and as such, consumer price inflation is expected to climb back gradually over the course of 2010. Nevertheless, inflationary pressures should still be rather modest in most of 2010, as it takes time for the economy to reduce the spare capacity caused by two years of economic slack, and as imported inflation may remain modest in the near term given the weak global recovery. Against this backdrop, the underlying Composite CPI is forecast to increase by 1.5% in 2010 as a whole. The headline Composite CPI is forecast to be slightly higher in 2010, at 2.3%. The GDP deflator is forecast to be flat, taking into account the modest inflationary pressures at the aggregate economy level as well as the relative price change in the external sector. There may be some upside risks to the above forecasts, if rentals continue to rise back, food prices edge further higher, and if international oil prices stay at a high level. A weaker US dollar may also add to imported inflation and hence overall inflation.
-8
-6
-4
-2
0
2
4
6
8
2000 2001 2002 2003 2004 2005 2006 2007 2008 2009 2010
HeadlineComposite CPI
Diagram 2.15 : Some price pressures will return as economic recovery takes hold
Rate of change (%)
(Forecast)
GDP deflator
UnderlyingComposite CPI

39
Forecast rate of change in 2010 (%) Gross Domestic Product (GDP) Real GDP 4 to 5 Nominal GDP 4 to 5 Per capita GDP, in real terms 3.1 to 4.1 Per capita GDP at current market prices HK$240,500-242,800 (US$30,800-31,100) Composite Consumer Price Index Headline Underlying
2.3 1.5
GDP Deflator 0
Forecast on Hong Kong’s GDP growth in 2010 recently made by other selected parties
(%) International Monetary Fund 5 The University of Hong Kong 4 to 5 The Hong Kong University of Science and Technology 6.8 Average forecast by private sector analysts#
4.8
Note: (#) Forecast GDP growth by private sector analysts mostly falls between 3% and 6%.
Medium-term outlook for the Hong Kong economy 2.22 The medium-term outlook for the Hong Kong economy is bright, although there is a need to stay alert to risks and challenges posed by the constant changes in the global economic environment, particularly as the global economy has just emerged from the “Great Recession” of 2008-2009 and the risk of a relapse in the advanced economies into recession cannot be ruled out for sure. The financial crisis has radically changed the landscape of the global economy. The Mainland and, to some extent, all the other emerging Asian economies taken together, have emerged as a prominent economic powerhouse. The balance of the global economic landscape has tilted gradually towards the East. This, in turn, will present new opportunities for Hong Kong in the years to come. 2.23 Amid the keen competition in the global and regional arenas, it is important for Hong Kong to continue to enhance its competitiveness to uphold

40
its status as an international financial centre and a regional business hub. Being a relatively mature economy, Hong Kong will not compete in terms of low labour and land costs, but in terms of quality, during its on-going transformation into a high value-added, knowledge-based economy. 2.24 The strategy of integrating with the Mainland economy has served the Hong Kong economy well. Hong Kong will continue to make full use of the opportunities generated by its increasing integration with the Pearl River Delta, a national strategy endorsed by the Central Government. Hong Kong and Guangdong as well as other parts of the Mainland will also push ahead with co-operation on many fronts. In terms of hardware, the construction of major cross-boundary infrastructure projects, including the Hong Kong-Zhuhai-Macao Bridge and the Hong Kong-Guangzhou Express Rail Link, will enhance the efficient flow of people and goods and further deepen economic ties between Hong Kong and the Mainland. As to other major infrastructure projects, the construction will also add momentum to economic growth over the medium term. When completed, they will raise the quality of life as well as productivity in Hong Kong in a significant way. 2.25 The global financial crisis has also revealed the need for economic diversification. The Government has identified six promising industries where Hong Kong enjoys competitive advantages, including education services, medical services, testing and certification, environmental industries, innovation and technology, and cultural and creative industries. It will take time for these industries to mature and flourish, and the Government will offer facilitating measures to create the conditions for them to get off the ground and gather momentum. These six industries, while diversifying the economic structure of Hong Kong, will also supplement and enhance the strength of the traditional pillar industries. 2.26 Against this background, the trend GDP growth rate in real terms is forecast at 4% per annum from 2011 to 2014. This would still be slightly below the 10-year average annual growth rate of 4.7% that Hong Kong has attained just before the global crisis. With the economy going back to faster growth over the medium term, some inflationary pressures should likewise return. Granting that major central banks will pursue their exit strategies in an orderly manner, thereby anchoring global inflation expectations, the trend rate of change in the underlying Composite CPI in Hong Kong over the medium term is forecast at 3% per annum.

41
-6
-4
-2
0
2
4
6
8
10
2000 2002 2004 2006 2008 2010*
Diagram 2.16 : Economic prospects are bright over the medium term
(a) Economic recovery to take hold in 2010
Rate of change in real terms (%)
6.4
5.6
4.0
7.2
0.0
1.0
2.0
3.0
4.0
5.0
6.0
7.0
8.0
2003-2006 2004-2007 2005-2008 2011-2014
(b) Trend economic growth over the medium term stillbelow the trend growth just before the global crisis
10-year trend growth(2000-2009)
GDP
Rate of change in real terms (%)
(Forecast)(Forecast)Note : (*) Mid-point of the range forecast. 2.27 Beyond the short-term, there are various challenges facing the global and local economy over the medium term. The financial tsunami should lead to reforms in the global financial framework if the world is to avoid the recurrence of major financial crises in future, and Hong Kong will have to adjust and adapt quickly to these reforms. The exceptionally large fiscal and monetary stimulus measures implemented by the major advanced economies have weakened their longer term fiscal positions, which could eventually lead to higher volatility in the financial and exchange rate markets. Also, the political implications of higher unemployment in the advanced economies, coupled with the lingering global trade imbalances, could result in stronger protectionist sentiment from the US and EU against Mainland products, increasing the risk to Hong Kong’s trade. Domestically, the structural shift of the Hong Kong economy to high value-added and knowledge-based activities would lead to greater variability in income and wealth distribution. The training and re-training needs of Hong Kong’s workforce are bound to increase over time if it is to reduce the extent of mismatch between jobs and skills. Also, the ageing population will have profound implications on our health care and social welfare systems, as well as on public finance, over the medium and longer run. In view of these possible challenges, it is important to stick to a prudent fiscal policy.