chapter- 2 demographic profile of narnaul...
TRANSCRIPT

Error!
Chapter- 2Demographic Profile of Narnaul Town

Chapter-2
DEMOGRAPHIC PROFILE OF NARNAUL TOWN
2.1 Historical background
Narnaul is a place of considerable distinguishes. According to some folk legends, it was
found in Pandvas time. At that time it was known as ‘Nandigram’. The Punjab gazetteers of
Philician states describes that it was found some 900 years ago near the Doshi hill in the very heart
of very vast forest called ‘Nahar Haul’ or the Lion’s dread. It is also said that it was founded by
Raja Laun Karan after his wife more called ‘Nar Laun’. It is said that when the town was founded
a Sernam and Mengoose were seen fighting this does not indicate of that time of origin. After Laun
Karan’s time it was controlled by the Muslims rules.
2.1.1 Narnaul under Mughals
Some muslim historian put up their the view that the town was offered by Altmash to his
mate Saif-ud-din Amir Khusro who pointed out in his book ‘Ghurrat-al Kamal’, that it was under
Malik Kultaghtain Azam, Mubark, Amir of Narnaul under Firoz Shah Khilji. Ibrahim Khan who
was the grand father of Sher Shah was granted several villages in the ‘Paragana’ of Narnaul by
Jamal Khan Saranskhami of Hissar, Narnaul was the centre of Abu Maalik, revolt under Akbar
during the break of Mughal dynasty Narnaul became an appendage of Jaipur, 1793-97. This town
was taken by De Boigna in 1793-97 who handed over to Murtaza Khan. Then it was granted to
Maharaja Narender Singh as a reward for valuable services offered by him to the British during the
period of Muting in 1857. He established a grain market in 1858.
2.1.2 Narnaul before and after independence
A battle between the freedom fighter and the Royal English Army was fought near
Nasibpur village 3 km north of Narnaul. Before independence it was under Pepsu, with
independence Patiala, Nabha find Tehsil became Mahendergarh. Mahendergarh was a part of
Punjab at that time. On November 1, 1966 Haryana was separated from Punjab and Mahendergarh
remained one of its seventh districts, Head quarter of district is located at Narnaul.
2.1.3 From ancient period up to 17th century
Narnaul according to the legends the town was founded 900 years ago near the Dhosi hill in
the midst of vast forests. Dhosi is a flat topped hill on was it lies and is known as “Chander Kup”

sacred to Cham Rishi which was the Hindus worship and when the tith Amavashya happens upon
a Friday, the water over at sun rise at which the people bath there.In 1441 Narnaul was held by
Akalim Khan. After that several Muslim rulers like Sher Shah Quali etc ruled over it. In 1472
Satnam is captured it and wiped out old structures of Mughal dominance.
2.1.4 17th to End of 19th century
During this period major development occurred particularly in the later half of the 19 th
monuments as described earlier are the oldest living buildings in Narnaul. Important lanes in
Narnaul before the end of 19th century were Mandi, Adina Masjid Koyathwara, Sarai, Kharkhri
Chanduwara, Franskhana, Mishwra with the Naya and Purana Bazar.
2.1.5 First Half of the 20th century
Before analysis the development of town in the first half of the 20th century we should take
two things into mind. One is that Narnaul has suffered many historical changes which affected
landscape to large extent and secondly the population of the town has been fluctuating 20 to 21
thousand in average up to 1951. Decidedly the settlement pattern was affected by two factors. On
the one hand due to balance in population, people felt no need of development new buildings and
on the other hand if there were any need of additional settlements, they may either the modification
of pervious ones or addition of some buildings in the periphery of old settlement, old building till
predominate in the interior portion of the town and it was difficult to define the age of building.
2.1.6 1950 to present time
It is new constructed area which is developed in recent decades mainly along the roads.
Industrial estate has been developed in plain areas along Nizampur road and Rewari road of the
town. That is why high class residences have been constructed on the Mehendergarh road. At
present a municipal committee is working for the development of the town. The total area within
municipal is 9.67 km2 with 62,077 populations (2001)
2.2 Demographic ProfileNarnaul town is a medium class town and headquarter of district Mahendergarh
located in the southern part of Haryana state (fig. 1.1). More than 57% of district population is
inhabited in Narnaul town. It is a second class town constituting 21 wards spread over an area of
about 9.67 km2 with municipal council as it local governing body.

Table 2.1 Demographic Profile of Narnaul Town (2001)
S. No. Parameters 2001
1 Population 62,077
2 Household 10588
3 SC Population 7931
4 Slum Population 11279
5 Literacy Rate 78.56%
6 Sex Ratio 878
7 Main Working Population 16373
8 Marginal Working Population 2760
9 Area 9.67 km2
Source: Census of India, 2001, Office of the Registrar General, India 2A, Mansingh Road, New
Delhi- 110011, India
Table 2.1 shows the demographic profile of Narnaul town. Narnaul town has a population of
62,077 persons lived in 10,588 households 2001. The town has 21 wards spread over an area of
9.67 km2. The literacy rate is 78.56 per cent and its sex ratio was 878. Out of the total population,
7931 (12.78%) people belong to Scheduled Caste and 11,279 (19.15%) persons belong to slum
population. These two categories share more 31.93 per cent population. The working population of
the town is 16,373 which is 26.37 per cent of the total population, while the marginal working
population is 2760 (4.45%) of total population. Which share more then 30.82 per cent working
population out of total population of the town and 69.12 per cent are dependent population.
Table 2.2: Distribution of Sex wise Population and household, Narnaul Town, 2001
Sr. No. No. of Household Population Male Female Sex ratio
1 662 3707 1969 1738 883
2 443 2699 1426 1273 893
3 438 2808 1479 1329 899

4 648 3927 2168 1759 811
5 455 2875 1558 1317 845
6 499 3257 1722 1535 891
7 458 2708 1442 1266 878
8 645 3966 2103 1868 886
9 434 2343 1230 1113 905
10 655 3740 1994 1746 876
11 490 2997 1618 1379 852
12 522 3203 1709 1494 874
13 530 3048 1638 1410 861
14 404 2427 1258 1169 929
15 413 2373 1282 1091 851
16 477 2631 1399 1232 881
17 383 2333 1230 1098 889
18 417 2328 1205 1123 932
19 428 2176 1126 1050 933
20 447 2473 1348 1125 835
21 740 4058 2141 1917 895
Total 10588 62077 33050 29027 878
Source: Census of India, 2001, Office of the Registrar General, India 2A, Mansingh Road, New
Delhi -110011, India

Ward Wise Distribution of Total Population, Narnaul Town, 2001
0500
10001500200025003000350040004500
1 2 3 4 5 6 7 8 9 10 11 12 13 14 15 16 17 18 19 20 21
Wards
PopulationMale
FemalePopu
latio
n
Figure 2.1
Table 2.2 and figure 2.1 shows the ward wise population distribution with their
households and its sex ratio. The total population of the town is 62,077 in which 33,050 (53.24%)
males and 29,027 (46.76%) female. The maximum number of population 4058 (6.54%) has been
recorded in ward 21. The main reason of the highest population is that it is a residential and newly
constructed ward. In wards 10, 11, 12 and 13 have also much population than the other wards
because these wards are basically belong to scheduled caste population. Another side the wards 16,
17, 18 and 19 have very low population because of main market area of the town. So there are very
small portion of space is available for residential purpose in these wards. People of these wards
have migrated in open residential area of different wards of the town.
2.2.1 Sex Ratio
The sex composition plays a vital role in the population study of characteristics. The sex
composition of the population is affected by the differentials in the mortality condition of male and
female. In India it has generally been adverse to women. The ratio has also declined over the years
except in 1981, when it is slightly improved to 934 from 927. It has been a fall by seven points to
927 per thousand males. But Kerala represented a different spectrum. The state has higher number
of female than males i.e. 1036 females per thousand males.
Demographic measure of sex distribution or balance of sexes in a population is different
from one country to another. In the country like U.S.A., the sex ratio is expressed in terms of
number of males per 100 females and it is calculated as under:-
SR = Pm/Pf x 100
In the other countries, the sex ratio is generally calculated in terms of the number of
females per 100 males that can be expressed under:
SR = Pp/Pm x 100
But in India sex ratio is defined as the number of females per 1000 males and represented
as below
SR = Pf/Pm x 1000
or
SR = Pm/Pf x 1000
Here is
SR = Sex ratio
Pm = Per male
Pf = Per female
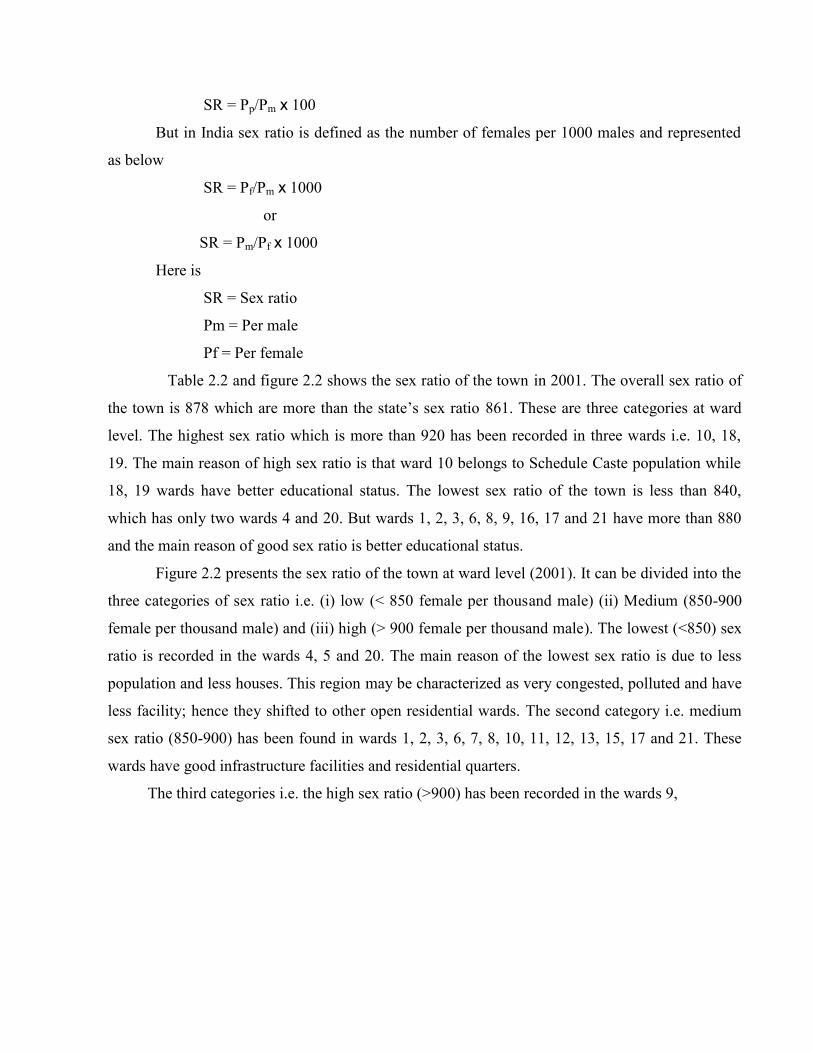
Table 2.2 and figure 2.2 shows the sex ratio of the town in 2001. The overall sex ratio of
the town is 878 which are more than the state’s sex ratio 861. These are three categories at ward
level. The highest sex ratio which is more than 920 has been recorded in three wards i.e. 10, 18,
19. The main reason of high sex ratio is that ward 10 belongs to Schedule Caste population while
18, 19 wards have better educational status. The lowest sex ratio of the town is less than 840,
which has only two wards 4 and 20. But wards 1, 2, 3, 6, 8, 9, 16, 17 and 21 have more than 880
and the main reason of good sex ratio is better educational status.
Figure 2.2 presents the sex ratio of the town at ward level (2001). It can be divided into the
three categories of sex ratio i.e. (i) low (< 850 female per thousand male) (ii) Medium (850-900
female per thousand male) and (iii) high (> 900 female per thousand male). The lowest (<850) sex
ratio is recorded in the wards 4, 5 and 20. The main reason of the lowest sex ratio is due to less
population and less houses. This region may be characterized as very congested, polluted and have
less facility; hence they shifted to other open residential wards. The second category i.e. medium
sex ratio (850-900) has been found in wards 1, 2, 3, 6, 7, 8, 10, 11, 12, 13, 15, 17 and 21. These
wards have good infrastructure facilities and residential quarters.
The third categories i.e. the high sex ratio (>900) has been recorded in the wards 9,

NARNAUL TOWN
2001SEX RATIO
Fig. - 2.2
N
KILOMETRES4202
Low (< 850)
Medium (850 - 900)
High (> 900)
Female/1000 Male
14, 18 19.
In which wards 18 and 19 have much more sex ratio than other wards. The main reason is that
these wards are located in the central part or market area of the town. They have good educational
and basic infrastructure and facilities while in the case of wards 9 and 14 they have also good
number of educational institutes and health facilities.
2.2.2 Growth Rate
Growth rate of any town will be represented the population of the any place will be increased
or decreased of within 10 years. When the population of any town increases within ten year, it may
be positive and when it is decreasing then it may be negative growth of the town or village.
Growth rate of population is representing the changes of population in two points of time which
represents in per centage as follows:
g = 100P
PP
2
12
Here is:
P1 = Population of base year
P2 = Population of current year
g = growth rate
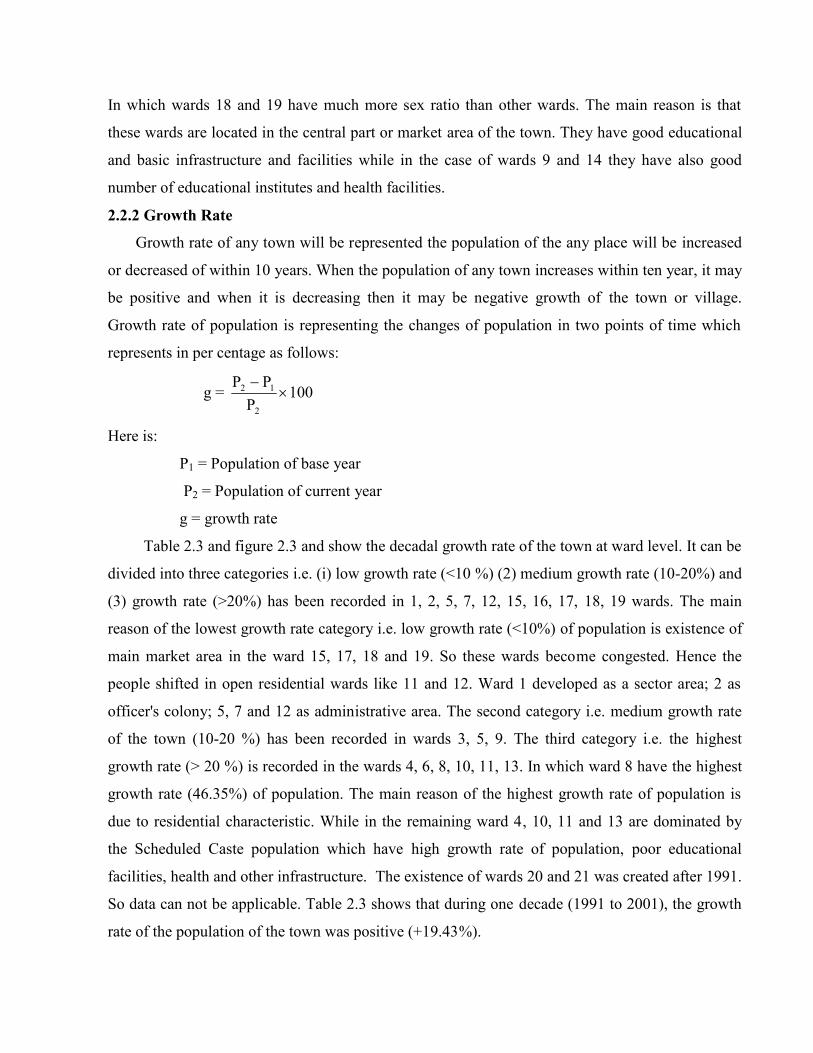
Table 2.3 and figure 2.3 and show the decadal growth rate of the town at ward level. It can be
divided into three categories i.e. (i) low growth rate (<10 %) (2) medium growth rate (10-20%) and
(3) growth rate (>20%) has been recorded in 1, 2, 5, 7, 12, 15, 16, 17, 18, 19 wards. The main
reason of the lowest growth rate category i.e. low growth rate (<10%) of population is existence of
main market area in the ward 15, 17, 18 and 19. So these wards become congested. Hence the
people shifted in open residential wards like 11 and 12. Ward 1 developed as a sector area; 2 as
officer's colony; 5, 7 and 12 as administrative area. The second category i.e. medium growth rate
of the town (10-20 %) has been recorded in wards 3, 5, 9. The third category i.e. the highest
growth rate (> 20 %) is recorded in the wards 4, 6, 8, 10, 11, 13. In which ward 8 have the highest
growth rate (46.35%) of population. The main reason of the highest growth rate of population is
due to residential characteristic. While in the remaining ward 4, 10, 11 and 13 are dominated by
the Scheduled Caste population which have high growth rate of population, poor educational
facilities, health and other infrastructure. The existence of wards 20 and 21 was created after 1991.
So data can not be applicable. Table 2.3 shows that during one decade (1991 to 2001), the growth
rate of the population of the town was positive (+19.43%).

Table 2.3 Population Decadal Growth rates, Narnaul Town, 1991 and 2001
Wards Total Population Decadal Growth 1991 and
20011991 2001
1 4115 3707 -9.91
2 2563 2699 +5.31
3 2507 2808 +12.01
4 2733 3927 +43.69
5 2576 2875 +11.61
6 2710 3257 +20.15
7 2756 2708 -1.74
8 2710 3966 +46.35
9 2082 2343 +12.54
10 3084 3740 +21.27
11 2264 2997 +32.38
12 3734 3203 -14.22
13 2275 3048 +33.98
14 2589 2427 -6.26
15 2490 2373 -4.70
16 26 2631 0
17 2563 2333 -8.97
18 2353 2328 -1.06
19 3241 2176 -32.86
20 - 2473 NA
21 - 4058 NA
Total 51976 62077 +19.43
Source: Census of India, 2001, Office of the Registrar General, India 2A, Mansingh Road, New
Delhi -110011, India
NARNAUL TOWN
1991-2001DECADAL GROWTH RATE
Fig. - 2.3
N
KILOMETRES4202
Low (< 10)
Medium (10 - 20)
High (> 20)
Growth Rate inPercentage
Table 2.4:

Distribution of Population (Age Group 0-6 year), Narnaul Town, 2001
Ward No. Person Male Female Sex Ratio Proportion of 0-6 to
total population1 551 299 252 843 14.86
2 413 255 158 620 15.30
3 416 239 177 741 14.81
4 524 315 209 663 13.34
5 381 207 174 841 13.25
6 514 302 212 702 15.78
7 409 231 178 771 15.10
8 615 330 285 864 15.51
9 292 170 122 718 12.46
10 672 373 299 802 17.97
11 453 238 215 903 15.12
12 469 255 214 839 14.64
13 439 235 204 868 14.40
14 308 166 142 855 12.69
15 311 195 116 595 13.11
16 382 213 169 793 14.52
17 286 157 129 822 12.26
18 334 179 155 866 14.25
19 310 172 138 802 14.25
20 381 209 172 823 15.41
21 529 289 240 830 13.04
Total 8989 5029 3960 787 14.48
Source: Census of India, 2001, Office of the Registrar General, India 2A, Mansingh Road, New
Delhi -110011, India

Ward Wise Distribution of Population (0-6 Age Group) inNarnaul Town, 2001
0100200300400500600700800
1 2 3 4 5 6 7 8 9 10 11 12 13 14 15 16 17 18 19 20 21
Wards
Popu
latio
n PersonMaleFemale
Figure 2.4
Table 2.4 and figure 2.4 show the 0-6 age group proportion of the children in the town.
This table also represents the sex ratio of 0-6 age group of children in different wards. The
maximum number of children in age group 0-6 is in wards 1, 4, 6, 8, 10, 21 which are more than
500. The main reason of highest proportion of sex ratio is residential character. Because people
comes from the congested wards and near by village, so children population has been increased.
It also shows the structure of the male and female children of 0-6 age group. The highest number
of male and female child is recorded in ward 10 and the lowest; number of male child of this age
group is recorded in the ward 17 and female in the ward 15.
Table 2.4 and figure 2.5 also represent the sex ratio of the children of 0-6 age group in the
town at ward level. The highest sex ratio (903) of the town is in ward number 11. It shows very
good condition but another ward has less than 900. The very low sex ratio (595) is recorded in
ward number 15. Table 2.4 and figure 2.4 also show the male and female children of 0-6 age group
of the town at ward level. The highest number of the children of this age group has been recorded
in ward 10. The main reason is that, this ward is belongs to Scheduled Caste population where total
population is also more then other wards. The educational status and economic condition is also
poor. The lowest number of children of 0-6 age group has also been recorded in the ward 17. The
main reason of lowest number of children of this group age group is that, this ward is basically
main market of the town. So the proportion of total population is also lowest than other

NARNAUL TOWNSEX RATIO
(0-6 Age Group)2001
Fig. - 2.5
N
KILOMETRES4202
< 800800 - 850850 - 900> 900

wards. The highest proportion of children of this age group is 17.97% in ward 10 and lowest
proportion is 12.26% in ward 17.
Figure 2.5 shows the sex ratio of the children of 0-6 age group of the town. The lowest sex
ratio (< 750) has been recorded in wards 2, 3, 4, 6, 9, 15. The main reason of lowest 0-6 age group
sex ratio is low education status and poor residential facilities in wards 3 and 4 the remaining
wards 6, 9 wards have very small area. Due to congestion of population, people shifted in open
residential part. Most of the wards of the town's have medium sex ratio (740-850) in wards 1, 5, 7,
10, 12, 16, 17, 19, 20 and 21. But wards 8, 11, 13, 14 and 18 have highest sex ratio (>850) except
18 due to residential area and better infrastructure facilities. The ward 18 is dominated by market
and good number of educational facilities.
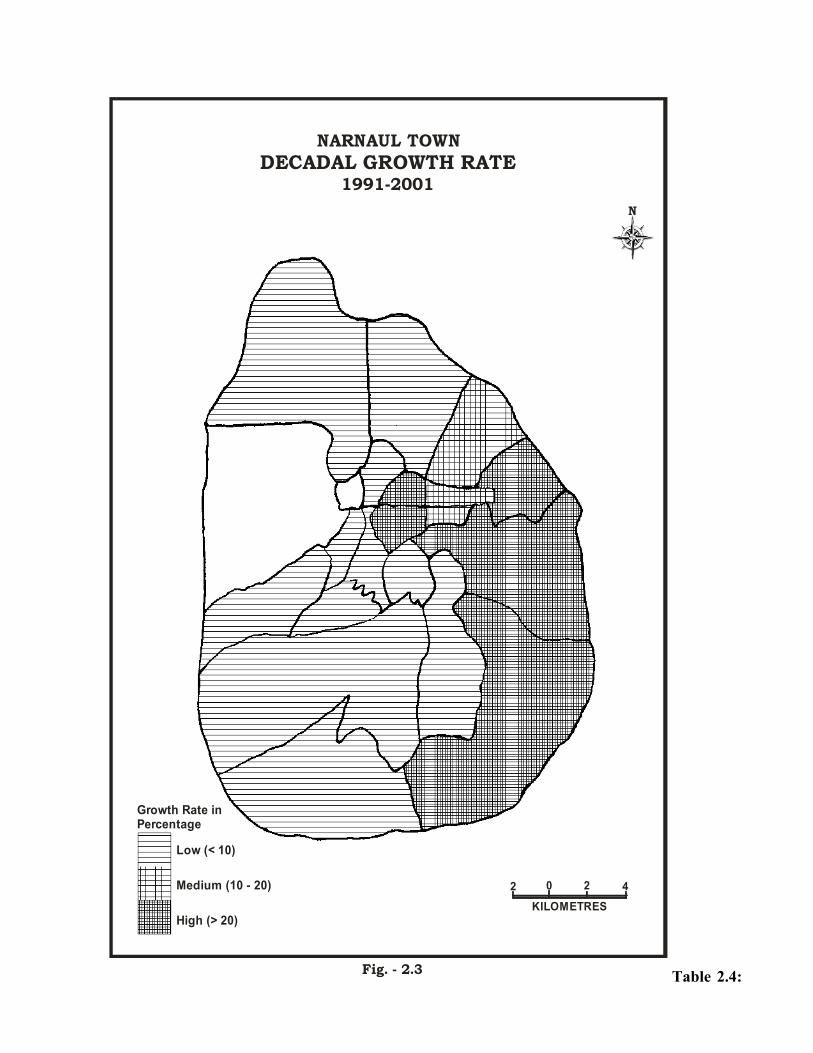
Table 2.5 and figure 2.6 shows the distribution of scheduled caste population at ward level of
the town. There are 12.78% of SC populations from the total population of town. Out of which the
highest proportion of SC population 46.23% inhabited in the ward 10 followed by 25.70% and
28.21% in ward 7 and 9 respectively. The remaining wards have below 15% scheduled caste
population of there total population in wards 1, 2, 3, 4, 5, 6, 8, 12, 13, 14, 15, 16, 17, 18, 20, 21.
The very low proportion of this caste 0.78% is recorded in the ward 2 where high proportion of the
high society and the first class officers lived. It also shows the ward wise distribution of male and
female structure of SC population. The highest male and female SC recorded in ward 10 because
this ward has highest proportion of SC population. The lowest male (0.24%) of SC population has
ward 2 and female (0.19%) has ward 17.
Table 2.5 and figure 2.6 show the proportion of SC population in the town at ward level
(2001). There are (<10 %) population lived in the wards 1, 2, 3, 5, 6, 12, 13, 17 and 18. These
wards basically belong to general and OBC categories except 17 and 18 wards which have main
market of the town so the residential proportion is very small which belongs to general category.
Those wards which have medium (10-20 %) proportion of SC population are resided in wards 4, 8,
11, 14, 15, 16, 21 and 9. Ward 19 have 20-30 % SC population, while ward 10 has maximum
proportion of Scheduled Caste population (>30%) of total SC population. So ward 10 has
dominancy of total Scheduled Caste population of the town
Table 2.5: Distribution of Scheduled Caste Population, Narnaul Town, 2001.
Ward No. Person Male Female Proportion of SC
population

1 361 194 167 9.74
2 21 10 11 0.78
3 141 74 67 5.02
4 461 242 219 11.74
5 136 76 60 4.73
6 317 160 157 9.73
7 696 356 340 25.70
8 444 232 212 11.20
9 661 351 310 28.21
10 1729 935 794 46.23
11 419 225 194 13.98
12 83 35 28 1.97
13 290 160 130 9.51
14 269 149 120 11.08
15 262 146 116 11.04
16 365 186 179 13.87
17 19 12 7 0.81
18 199 104 95 8.55
19 567 277 290 26.06
20 66 41 25 2.67
21 445 236 209 11.97
Total 7931 4201 3730 12.78
Source: Census of India, 2001, Office of the Registrar General, India 2A, Mansingh Road, New
Delhi -110011, India
Ward Wise Distribution of Scheduled Caste Population in Narnaul Town, 2001
0
200
400
600
800
1000
1200
1400
1600
1800
2000
1 2 3 4 5 6 7 8 9 10 11 12 13 14 15 16 17 18 19 20 21
Wards
Popu
lation Person
MaleFemale
Figure 2.6
2.2.3 Literacy
Bhattacharya (1974) defines illiterate as “A person who can neither read nor write or can
merely read but cannot write in any language.” While in some countries the efficiency of reading,
writing and counting has been considered as a criterion on literacy. According to census of India
(2001) “a person who can both read and write with understanding in any language is taken as
literate.” But it is not necessary that a person who is literate should have received any formal
education or should have passed any minimum educational standard. In Indian context, it is
essential for getting education that children must be above 5 years of age. So the boys and girls of
0-5 group can't be considered as literate.
We are living in the age of knowledge and science. One of the modern vehicles this
knowledge can be acquired and stored is the intimate relationship with the advancement of human
history (Bhattacharyya, 1974). Beside, education determines the structure of household and
relationship with family and equally important for the vertical and horizontal mobility of man.
Literacy is essential for eradicating poverty and mental isolation, for cultivating peaceful and
friendly relations and for permitting the free play of demographic process. Above all mortality,
marriage age, migration, occupation and economic patterns are also influenced by literacy.

NARNAUL TOWN
(0-6 Age Group)2001
SCHEDULED CASTE POPULATION
Fig. - 2.7
N
KILOMETRES4202
< 1010 - 2020 - 30> 30

Table 2.6 Ward Wise Distribution of Literates ad Literacy Rate of the Narnaul Town, 2001
Ward No. Number of Literates Literacy Rate
Person Male Female Person Male Female
1 2258 1326 932 60.91 67.34 62.72
2 1798 1055 743 66.62 73.98 66.64
3 1963 1121 842 69.91 90.40 73.09
4 2625 1570 1055 68.84 84.73 68.06
5 1967 1189 778 68.42 88.01 68.07
6 2061 1278 773 63.28 90.00 68.43
7 1695 1064 631 62.59 87.86 58.00
8 2394 1492 902 60.36 84.15 57.16
9 1719 985 734 73.37 92.92 74.07
10 2017 1295 722 53.93 79.89 49.90
11 1995 1270 725 66.57 92.03 62.29
12 2115 1284 831 66.03 88.31 64.92
13 1939 1209 730 63.61 86.17 60.53
14 1809 1016 793 74.54 93.04 77.22
15 1845 1051 794 79.25 96.69 81.44
16 1929 1116 813 73.32 94.10 76.48
17 1845 1033 812 79.08 95.83 83.80
18 1683 947 738 72.29 92.30 76.03
19 1526 858 668 70.13 89.94 73.25
20 1634 1025 609 66.07 89.99 63.90
21 2894 1721 1173 71.31 92.93 69.95
Total 41701 24905 16796 67.18 88.88 67.00
Source: Census of India, 2001, Office of the Registrar General, India 2A, Mansingh Road, New
Delhi - 110011, India

Ward Wise Distribution of Literate Population in Narnaul Town, 2001
0500
10001500
20002500
30003500
1 2 3 4 5 6 7 8 9 10 11 12 13 14 15 16 17 18 19 20 21
Wards
Num
ber
of L
itera
tes
PersonMaleFemale
Figure 2.8
Table 2.6 and figure 2.8 represent the educational status of the town in 2001. The lowest
literacy rate is (<60) in the ward 10. The main reason is that this ward belongs to scheduled cast
population who has not good economic condition and poor infrastructure facilities. Those wards
who have (60-65%) of literacy rate are 1, 6, 7, 8 and 13. They have also literacy then other wards
the main reason is lack of infrastructure facilities in wards 2, 3, 4, 11, 12, 18, 19 have (>65%)
literacy rate. Reaming wards 9,14,15,16,17,18,19 and 21 have above 70 per cent literacy rate. The
main reason of good literacy is that these wards are old, well developed and center part basically
main market of the town. Ward 14 has highest 79.25 per cent. The main reason of good literacy in
this ward is that most of the educational institute of the town is situated in this ward. Table 2.6 and
figure 2.8 also shows the male female literacy rate at ward level. The highest male literacy rate
have ward 15 which is 96.69 per cent while ward 1 have lowest male literacy rate 67.34 per cent.
The highest female literacy rate have ward 17 which is 83.30% and lowest female literacy rate
49.90 per cent have ward 10.
Table 2.6 is also displaying the literacy rate of the town. It shows there is 78.85 per cent
literate (including 88.8 % male and 67 % female). But when we study about literacy at ward level
we found that ward 17 has the highest literacy rate (including 95.83 % male and 83.80 % females).
The main reason of lowest literates in this ward is that this ward is belonging to scheduled caste
population.

NARNAUL TOWN
2001LITERACY RATE
Fig. - 2.9
N
KILOMETRES4202
Low (< 65)
Medium (60 - 70)
High (> 70)
Literacy Rate inPercentage
The lowest literacy rate is 65.74 per cent in which 79.84 per cent males and 50 per cent females are
literates in the ward number 10. The main reason of lowest literacy rate in this ward is that
maximum Scheduled Caste peoples lived here. They could not get good education because of lack
of economic facilities. Figure 2.9 show the literacy rate of the town, 2001. The status of literacy
rate in the town is divided into three categories. The first category i.e. lowest literacy rate (< 65%)
has recorded in wards 1, 7, 8, 10, 11, 12, 13 and20. The main reason of lowest literacy rate except
wards 1, 7 and 20 are dominated by Scheduled Caste population. The second category i.e. medium
literacy rate (60-70%) has been recorded in wards 1, 7 and 20 have very small area where more
population lived, in wards viz. 2, 4, 5 and 21. The third category i.e. the highest literacy rate
(>70%) are found in the wards 3, 9, 14, 15, 17, 18, 19. The main reason is that all educational
institutes are located in the ward 14. It is followed by wards 15, 16, 17, 18, 19, which have also
high literacy rate. The main reason is these are in old part of the town and main market area of the
town. So these wards have good educational status.
2.2.4 Occupational Structure of the Town
Any economically productive activity for livelihood is called occupation. Occupational
structure of a population reveals her economic characteristics. Thus it is a clear indication of
economy and economic development of a nation or a society. Among the various attributes of
population the livelihood pattern of the people is significant showing man land relationship in the
area. The composition of working force of an area varies by sex, age and residence (Chandna,
1998).
According to 1991 census of India a worker is defined as “a person whose main activity is
participation in any economically productive activity.” Such participation may be physical or
mental in nature work involved not only actual work but also effective supervision and direction of
work. One should have worked at least 183 days in one or more than one activity for classifying as
a worker. Census hand book of Haryana, 1991 classified workers into nine industrial categories:
1. Cultivator
2. Agricultural labour
3. Live stock, forestry, fishing, hunting and plantation, orchards and allied activities.
4. Mining and quarrying
Table 2.7: Total Working and Non-Working Population of the Town, 2001
Ward Total Workers (Main + Marginal) Non Workers

No
.
Person Male Female Person Male Female
1 1228 (6.42) 948 (6.02) 280 (8.27) 2479 (5.77) 1021 (5.89) 1458 (5.62)
2 785 (4.10) 656 (4.16) 129 (3.21) 1914 (4.46) 770 (4.44) 1444 (5.56)
3 950 (4.96) 715 (4.54) 235 (6.94) 1858 (4.33) 764 (4.41) 1094 (4.21)
4 1306 (6.82) 1050(6.67) 256 (1.62) 2621 (6.10) 1118 (6.45) 1503 (5.79)
5 896 (4.68) 747 (4.74) 149 (4.40) 1979 (4.60) 811 (4.68) 1168 (4.50)
6 933 (4.88) 815 (5.17) 118 (3.49) 2324 (5.41) 907 (5.23) 1417 (5.46)
7 694 (3.63) 630 (4.00) 64 (1.89) 2014 (4.69) 812 (4.69) 1202 (4.63)
8 1093 (5.71) 967 (6.14) 126 (3.72) 2873 (6.69) 1136 (6.56) 1737 (6.69)
9 688 (3.59) 606 (3.85) 82 (2.42) 1655 (3.85) 624 (3.60) 1031 (3.97)
10 1136 (5.94) 939 (5.96) 197 (5.82) 2604 (6.06) 1055 (6.09) 1549 (5.97)
11 967 (5.05) 779 (4.95) 188 (5.55) 2030 (4.73) 839 (4.84) 1191 (4.59)
12 1151 (6.01) 787 (5.00) 364(10.76) 2052 (4.78) 922 (5.32) 1130 (4.35)
13 1068 (5.58) 833 (5.29) 235 (6.94) 1980 (4.61) 805 (4.65) 1175 (4.53)
14 679 (3.55) 632 (4.01) 47 (1.39) 1748 (4.07) 628 (3.62) 1122 (4.32)
15 742 (3.88) 649 (4.12) 93 (2.75) 1631 (3.80) 633 (3.65) 998 (3.84)
16 887 (4.63) 706 (4.48) 181 (5.35) 1744 (4.06) 693 (4.00) 1051 (4.05)
17 700 (3.65) 621 (3.94) 79 (2.33) 1633 (3.80) 614 (3.54) 1019 (3.93)
18 813 (4.24) 643 (4.08) 170 (5.02) 1515 (1.20) 582 (3.36) 963 (3.71)
19 618 (3.23) 538 (3.42) 82 (2.42) 1558 (3.63) 590 (3.40) 968 (3.73)
20 700 (3.66) 565 (3.59) 135 (3.99) 1773 (4.13) 783 (4.52) 990 (3.81)
21 1099 (5.74) 925 (5.88) 174 (5.14) 2959 (6.89) 1216 (7.02) 1743 (6.71)
Total 19133 (100) 15749(100
)
3384 (100) 42944(100) 17323 (100) 25621 (100)
Source–Census of India, 2001, Office of the Registrar General, India 2A,Mansingh Road New
Delhi - 110011, India
5. (a) Manufacturing, processing, servicing and repairs in household industries.
(b) Manufacturing, processing, servicing and repairs in other than household industries
6. Construction
7. Trade and commerce
8. Transport, storage and communication
9. Other services
Figure 2.10
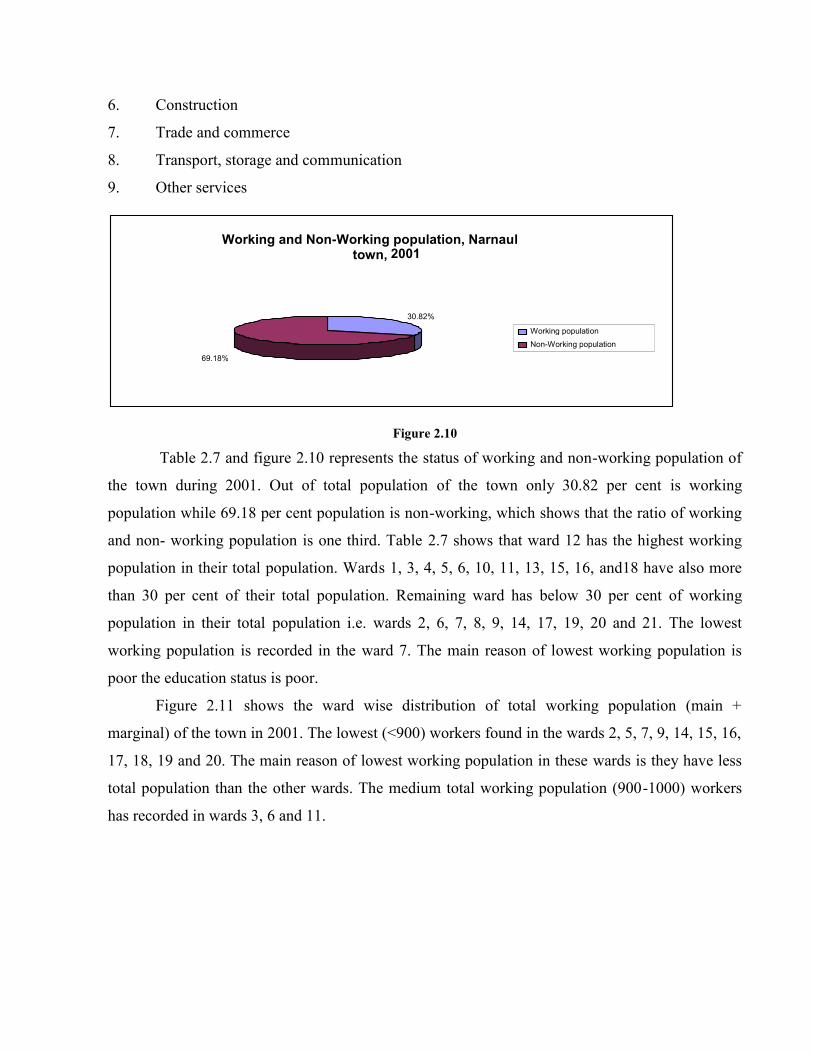
Table 2.7 and figure 2.10 represents the status of working and non-working population of
the town during 2001. Out of total population of the town only 30.82 per cent is working
population while 69.18 per cent population is non-working, which shows that the ratio of working
and non- working population is one third. Table 2.7 shows that ward 12 has the highest working
population in their total population. Wards 1, 3, 4, 5, 6, 10, 11, 13, 15, 16, and18 have also more
than 30 per cent of their total population. Remaining ward has below 30 per cent of working
population in their total population i.e. wards 2, 6, 7, 8, 9, 14, 17, 19, 20 and 21. The lowest
working population is recorded in the ward 7. The main reason of lowest working population is
poor the education status is poor.
Figure 2.11 shows the ward wise distribution of total working population (main +
marginal) of the town in 2001. The lowest (<900) workers found in the wards 2, 5, 7, 9, 14, 15, 16,
17, 18, 19 and 20. The main reason of lowest working population in these wards is they have less
total population than the other wards. The medium total working population (900-1000) workers
has recorded in wards 3, 6 and 11.
Working and Non-Working population, Narnaultown, 2001
30.82%
69.18%
Working populationNon-Working population

NARNAUL TOWNDISTRIBUTION OF TOTALWORKING POPULATION
2001
Fig. - 2.11
N
KILOMETRES4202
< 900
900 - 1000
> 1000
Total Workers
The highest working population (>1000) have been recorded in the wards 1, 4, 8, 10, 12, 13 and 21
because of the more total population as well as the educational status is also better than other
wards.

Table 2.8 Distribution of Total Workers in Different, Working category, Narnaul Town,
2001
Sr.
No.
Total Cultivator Agricultural
Worker
Household
industries
Others
1 1228 (6.42) 54 (3.98) 25 (5.52) 38 (4.62) 1113 (6.75)
2 785 (4.10) 39 (2.87) 13 (2.87) 83 (10.10) 650 (3.94)
3 950 (4.97) 16 (1.18) 21 (4.64) 112 (13.62) 801 (4.85)
4 1306 (6.83) 60 (4.50) 33 (7.28) 18 (2.19) 1195 (7.24)
5 896 (4.68) 143 (10.54) 2 (.44) 48 (5.84) 703 (4.26)
6 833 (4.35) 50 (3.68) 27 (5.96) 45 (5.47) 811 (4.91)
7 894 (4.67) 15 (1.11) 3 (.66) 20 (2.43) 656 (3.98)
8 1093 (5.71) 18 (1.33) 9 (1.99) 13 (1.58) 1053 (6.38)
9 688 (3.60) 5 (0.37) 4 (.88) 31 (3.77) 648 (3.93)
10 1136 (5.94) 38 (2.80) 31 (6.84) 81 (9.85) 986 (5.98)
11 967 (5.05) 187 (13.78) 26 (5.74) 11 (1.34) 743 (4.50)
12 1151 (6.01) 154 (11.35) 88 (19.43) 3 (.36) 906 (5.49)
13 1068 (5.58) 218 (16.06) 103 (22.74) 77 (9.37) 670 (4.06)
14 679 (3.55) 8 (.59) 0 (0) 20 (2.43) 651 (3.95)
15 742 (3.88) 11 (.81) 6 (1.32) 18 (2.19) 707 (4.28)
16 887 (4.64) 30 (2.21) 2 (.44) 51 (6.20) 804 (4.67)
17 700 (3.66) 13 (.96) 2 (.44) 38 (4.62) 647 (3.92)
18 813 (4.25) 66 (4.86) 8 (1.77) 16 (1.95) 723 (4.38)
19 618 (3.23) 10 (.74) 20 (4.42) 4 (.49) 584 (3.54)
20 700 (3.66) 149 (10.98) 14 (3.09) 42 (5.11) 495 (3.00)
21 1099 (5.74) 73 (5.38) 16 (3.53) 53 (6.45) 957 (5.80)
Total 19133 (100) 1357 (100) 453 (100) 822 (100) 16501 (100)
Source–Census of India, 2001, Office of the Registrar General, India 2A, Mansingh Road, New
Delhi -110011, India
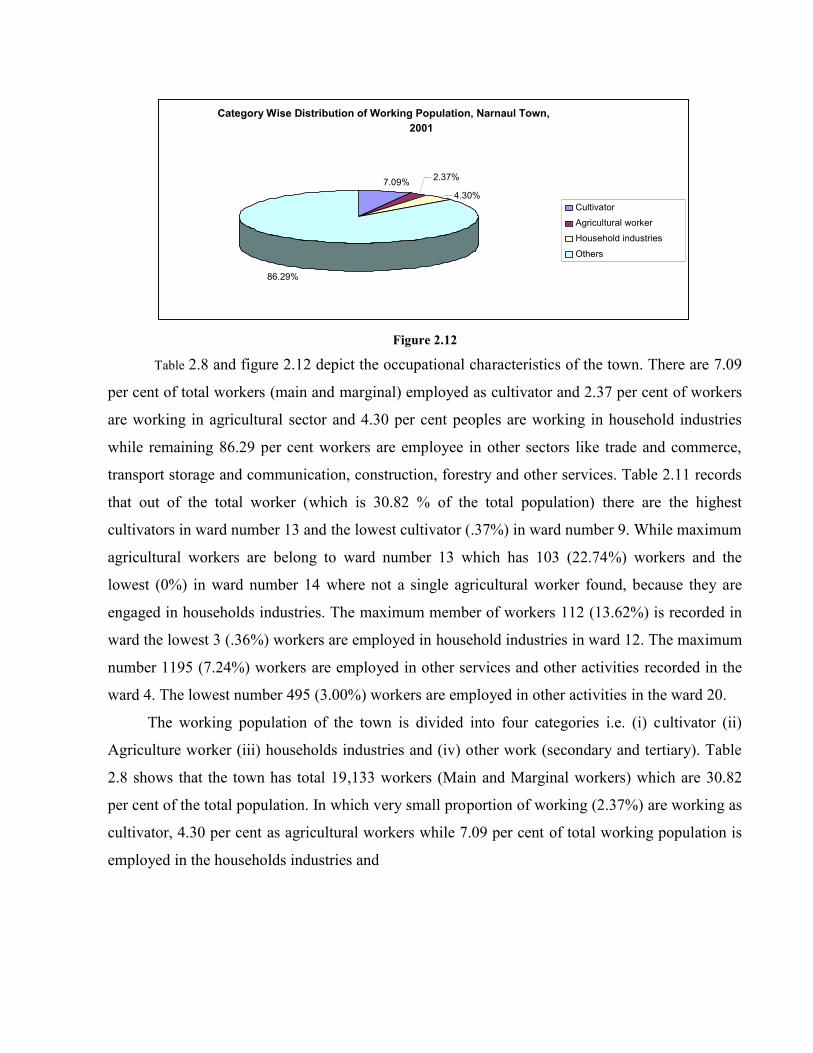
Figure 2.12
Table 2.8 and figure 2.12 depict the occupational characteristics of the town. There are 7.09
per cent of total workers (main and marginal) employed as cultivator and 2.37 per cent of workers
are working in agricultural sector and 4.30 per cent peoples are working in household industries
while remaining 86.29 per cent workers are employee in other sectors like trade and commerce,
transport storage and communication, construction, forestry and other services. Table 2.11 records
that out of the total worker (which is 30.82 % of the total population) there are the highest
cultivators in ward number 13 and the lowest cultivator (.37%) in ward number 9. While maximum
agricultural workers are belong to ward number 13 which has 103 (22.74%) workers and the
lowest (0%) in ward number 14 where not a single agricultural worker found, because they are
engaged in households industries. The maximum member of workers 112 (13.62%) is recorded in
ward the lowest 3 (.36%) workers are employed in household industries in ward 12. The maximum
number 1195 (7.24%) workers are employed in other services and other activities recorded in the
ward 4. The lowest number 495 (3.00%) workers are employed in other activities in the ward 20.
The working population of the town is divided into four categories i.e. (i) cultivator (ii)
Agriculture worker (iii) households industries and (iv) other work (secondary and tertiary). Table
2.8 shows that the town has total 19,133 workers (Main and Marginal workers) which are 30.82
per cent of the total population. In which very small proportion of working (2.37%) are working as
cultivator, 4.30 per cent as agricultural workers while 7.09 per cent of total working population is
employed in the households industries and
Category Wise Distribution of Working Population, Narnaul Town,2001
7.09% 2.37%
4.30%
86.29%
Cultivator
Agricultural worker
Household industries
Others

NARNAUL TOWN
2001DISTRIBUTION OF TOTAL WORKING POPULATION
< 50
50 - 100
> 100
< 40
40 - 80
> 80
< 30
30 - 60
> 60
< 700
700 - 800
> 800
Workers
Workers
Workers
Workers
Cultivator Workers
Household Industries Workers
Agricultural Workers
Other Workers
(a)
(c)
(b)
(d)
Fig. - 2.13
N
KILOMETRES4202
KILOMETRES4202
KILOMETRES4202
KILOMETRES4202

the remaining 86.24 per cent working population is employed other activities like trade, 2001
commerce, transport and tertiary activities. Figure 2.13 shows the categories wise distribution of
total working population at ward level.
Figure 2.13(a) shows the ward wise distribution of cultivator workers in the town. The
lowest cultivator (<50) have been recorded in the wards 2, 3, 7, 8, 9, 10, 14, 15, 16, 17 and 19. The
main reason is that most of the workers are engaged in secondary or tertiary activities because of
the better educational status. The medium (50-100) main cultivator workers are recorded in the
wards 1, 4, 6, 18 and 21 of the town. The remaining wards i.e. 5, 11, 12, 13 and 20 have the
highest (>100) cultivator workers have the main reason of the highest cultivators is that these
wards have very poor educational status wards 5, 11, and 20.
Figure 2.13 (b) shows the distribution of agricultural workers of the town. The lowest (<30)
agricultural workers found in the wards 1, 2, 3, 5, 6, 7, 8, 9, 11, 14, 15, 16, 17, 18, 19, 20 and 21.
The main reason of lowest agricultural working population in these wards is that most of them
engaged in secondary or tertiary activities. The medium category (30-60) agricultural workers
found in the ward 4 and 10. The highest (>60) agricultural workers belong to wards 12 and 13. The
main reason of highest worker in these wards is that both wards are situated in the outer part of the
town and nearer to the agricultural area.
Figure 2.13 (c) shows the distribution of total worker who engaged in household
industries. The lowest worker (<40) belongs to the wards1, 4, 7, 8, 9, 11, 12, 14, 15, 17, 18 and 19.
The main reason of fewer workers in these wards is that most of them are engaged in other
activities. The medium category of the workers (40-80) of house holds industries belong to wards
to wards 5, 6, 13, 16, 20 and 21. The highest category of worker engaged in households industries
(>80) belong 2, 3 and 10. The main reason is to be more total population than the other wards.
Figure 2.13 (d) shows the distribution of total working population which engaged in other
activities. The lowest workers (<700) of total working population engaged in other activities
belong to the wards 2, 7, 9, 13, 14, 17, 19 and 20. The main reason is that most of these wards have
less total population than other wards. The medium (700-800) workers of other activities have
recorded in the wards 3, 5, 11, 15 and 18 followed by the
Table 2.9 Distribution of Total Workers (main and marginal), Narnaul Town, 2001
Ward Main Workers Marginal workers

No. Person Male Female Person Male Female
1 1109 (6.77) 911 (6.26) 198(10.95) 119 (4.31) 37 (3.13) 82 (5.20)
2 703 (4.29) 626 (4.30) 77 (4.26) 82 (2.97) 30 (2.53) 52 (3.30)
3 815 (4.98) 677 (4.65) 138 (7.63) 135 (4.89) 38 (3.21) 97 (6.16)
4 1052 (6.43) 945 (6.49) 107 (5.92) 254 (9.20) 105 (8.87) 149 (9.45)
5 804 (4.91) 720 (4.94) 84 (4.65) 92 (3.33) 27 (2.28) 65 (4.12)
6 798 (4.87) 766 (5.26) 32 (1.77) 135 (4.89) 49 (4.14) 86 (5.46)
7 619 (3.78) 577 (3.96) 42 (2.32) 75 (2.72) 53 (4.48) 22 (1.40)
8 874 (5.34) 822 (5.64) 52 (2.88) 219 (7.93) 145 (12.25) 74 (4.70)
9 642 (3.92) 589 (4.04) 53 (2.93) 46 (1.67) 17 (1.44) 29 (1.84)
10 976 (5.96) 858 (5.80) 118 (6.53) 160 (5.80) 81 (6.84) 79 (5.01)
11 772 (4.72) 628 (4.31) 144 (7.97) 195 (7.07) 151 (12.75) 44 (2.79)
12 864 (5.28) 772 (5.30) 92 (5.09) 287 (10.40) 15 (1.27) 272
(17.26)13 865 (5.28) 779 (5.35) 86 (4.76) 203 (7.36) 54 (4.56) 149 (9.45)
14 662 (4.04) 623 (4.28) 39 (2.16) 17 (.62) 09 (.76) 08 (.51)
15 615 (3.76) 572 (3.93) 43 (2.38) 127 (4.60) 77 (6.50) 50 (3.17)
16 798 (4.87) 684 (4.70) 114 (6.31) 89 (3.22) 22 (1.86) 67 (4.25)
17 660 (4.03) 612 (4.20) 48 (2.66) 40 (1.45) 09 (.76) 31 (1.97)
18 543 (3.32) 500 (3.43) 43 (2.38) 270 (9.78) 143 (12.08) 127 (8.06)
19 530 (3.24) 485 (3.33) 45 (2.49) 88 (3.19) 51 (4.30) 37 (2.35)
20 619 (3.78) 525 (3.60) 94 (5.20) 81 (2.93) 40 (3.38) 41 (2.60)
21 1053 (6.43) 894 (5.83) 159 (8.79) 46 (1.67) 31 (2.62) 15 (.95)
Total 16373 (100) 14565 (100) 1808 (100) 2760 (100) 1184 (100) 1576 (100)
Source–Census of India, 2001, Office of the Registrar General, India 2A, Mansingh Road, New
Delhi -110011, India
highest workers (>800) of other activities in the wards 8, 10, 16 and 21 because of good
educational status than other wards. The main working population has unevenly distributed at ward
level. For example wards 1, 4, and 21 have more than 1000 main workers. The main reason is that

these wards have more population as well as good educational status is also good than that of the
other wards while, ward 18 has less female 43 (2.38%) main worker than other wards. The male
working population of main workers is also highest in ward 1 which has 1109 (6.77%) workers
and the lowest 530 (3.24%) in ward 19. Another side very few female 43 (2.38%) of main
working population is recorded in the ward 14.
Figure 2.14
Table 2.9 shows the distribution of marginal workers at ward level. Out of the 21 wards,
ward 12 has the highest 287 (10.40%) marginal workers and ward 14 has the lowest 17 (.6%)
marginal workers. Ward 11 has maximum male marginal 151 (12.75%) workers and 17 have
lowest 9 (.76%) marginal male workers. Ward 12 has maximum number of female 272 (17.26%)
marginal workers and 14 have lowest female 8 (.51%) marginal workers.
There are 30.82 per cent working population (main + marginal) of the total population, who are
working in different categories like cultivated, agriculture, household industries and other field.
Out of which the total working population 85.57 per cent people are main worker while only 14.43
per cent are marginal worker which reveals the same picture in figure 2.14. Table 2.9 shows,
16,373 total main + marginal workers. Out of which 14,565 males (88.96%), and 1808 (11.04%)
female, who are engaged in different activities,
Distribution of Total Workers (Main and Marginal), Narnaul Town, 2001
85.57%
14.43%
Main WorkersMarginal workers

NARNAUL TOWN
2001
DISTRIBUTION OF MAIN & MARGINALWORKING POPULATION
Fig. - 2.15
N
< 700
700 - 800
> 800
Main Workers
< 100
100 - 200
> 200
Marginal Workers
KILOMETRES4202
KILOMETRES4202
(a)
(b)
Main Workers
Marginal Workers

while, there are 2760 marginal workers including 1184 males (42.90%) and 1576 females
(57.60%), which clears that female marginal workers are more than that marginal of male workers.
Table 2.10 Distribution of Main Workers in Different Categories in Narnaul Town,
2001Sr.
No.
No. of main
workers
Cultivator Agricultural Household
industries
Others
1 1109 (6.77) 43 (4.62) 24 (12.70) 31 (5.21) 1001 (6.38)
2 703 (4.30) 24 (2.58) 7 (3.70) 70 (1.18) 602 (4.11)
3 815 (4.98) 10 (1.08) 6 (3.18) 92 (15.46) 707 (4.82)
4 1052 (6.43) 36 (3.87) 5 (2.65) 10 (1.68) 1001 (6.83)
5 804 (4.91) 136 (14.62) 1 (.53) 24 (4.03) 643 (4.39)
6 798 (4.87) 29 (3.12) 1 (.53) 33 (5.55) 735 (5.01)
7 619 (3.78) 8 (.86) 1 (.53) 13 (2.19) 597 (4.07)
8 874 (5.34) 10 (1.08) 8 (4.23) 6 (1.01) 850 (5.80)
9 642 (3.92) 5 (.54) 1 (.53) 12 (2.02) 624 (4.26)
10 976 (5.96) 35 (3.76) 16 (8.47) 54 (9.08) 871 (5.94)
11 772 (4.71) 167 (17.96) 7 (3.70) 5 (.84) 593 (4.05)
12 864 (5.28) 29 (3.12) 3 (1.59) 2 (.34) 830 (5.66)
13 865 (5.28) 99 (10.62) 87 (46.03) 70 (11.77) 609 (4.15)
14 662 (4.04) 7 (.75) 0 (0) 16 (2.69) 639 (4.36)
15 615 (3.76) 9 (.97) 1 (.53) 18 (3.03) 587 (4.00)
16 798 (4.87) 26 (2.80) 2 (1.06) 20 (3.36) 750 (5.12)
17 660 (4.03) 13 (1.40) 2 (1.06) 32 (5.38) 613 (4.18)
18 543 (3.31) 28 (3.01) 0 (0) 8 (1.35) 507 (3.46)
19 530 (3.24) 6 (.65) 5 (2.65) 4 (.67) 515 (3.51)
20 619 (3.78) 140 (15.05) 2 (1.06) 29 (4.87) 448 (3.06)
21 1053 (6.43) 70 (60.56) 10 (5.29) 46 (7.73) 927 (6.32)
Total 16373 (100) 930 (100) 189 (100) 595 (100) 14659 (100)
Source–Census of India, 2001, Office of the Registrar General, India 2A, Mansingh Road, New Delhi -
110011, India

Fig. 2.15 (a) shows the main working population of the town. The lowest main working
population (<700) have wards 7, 9, 15, 18, 19 and 20.The main reason is that wards 15, 18, 19 and
20 have main market area hence these are less population in the less residential hence in this part.
This is followed by medium (700-800) main workers in the wards 2, 11 and 16. The highest main
workers (>800) belong to the wards 1, 3, 4, 5, 8, 10, 12, 13 and 21.The main reason of the highest
main workers is that the total population is also more than other wards.
Figure 2.15(b) shows the marginal working population of the town. The lowest working
population (<100) are belongs to wards 2, 5, 7, 9, 14, 16, 17, 19, 20 and 21 because most of the
wards have main working population than the marginal working population. Wards 1, 3, 6, 10, 11
and 15 have medium (100-200) marginal employees. The highest (>200) marginal employees
belong to the wards 4, 8, 13 and 18. The main reason is that total population of these wards is also
more than other wards
Category Wise Distribution of Main Workers in Narnaul Town,2001
5.68%
1.55%
3.63%
89.53%
CultivatorAgriculturalHousehold industriesOthers
Figure 2.16
Table 2.10 and Figure 2.16 show that there is 85.57 per cent main working population.
Out of which maximum proportion is noted as cultivators (5.68%) followed by household industry
3.63 per cent and the lowest 1.55 per cent in agricultural activities. Table 2.10 shows distribution
of the main workers at ward level. The highest main workers 1109 (6.77%) is recorded in the ward
1 because this ward basically belongs to well educate and all kind of better infrastructure facilities
than the other. The lowest main workers 530 (3.24%) is recorded in the ward 19, because they are
lowest in member than other wards. There are highest cultivators 167(17.96%) in wards 11because
this ward is situated outer part of the town which has agricultural land while ward 9 has lowest 5

NARNAUL TOWN
2001DISTRIBUTION OF MAIN WORKING POPULATION N
< 50
50 - 100
> 100
< 30
30 - 60
> 60
< 20
20 - 40
> 40
< 600
600 - 700
> 700
Workers
Workers
Workers
Workers
Cultivator Workers
Household Industries Workers
Agricultural Workers
Other Workers
(a)
(c)
(b)
(d)
Fig. - 2.17
KILOMETRES4202
KILOMETRES4202
KILOMETRES4202
KILOMETRES4202
(.54%) cultivators because of them engaged in other activities. The highest working population
87 (46.03%) is engaged in agricultural activities in ward 13 while the lowest 0 (0%) is in ward 14
and 18. But, the highest workers 70 (11.77%) is engaged household industries has ward 13 and the
lowest workers 2 (.34%) in ward 12. While the ward 1 has highest employee 1001 (6.83%) who
are engaged in the secondary and the tertiary activities because of good educational status. They
are followed by the lowest 448 (3.06%) employee in the ward 20, who are engaged in the
secondary and the tertiary activities. The main reason is that this is newly constructed ward of the
town.
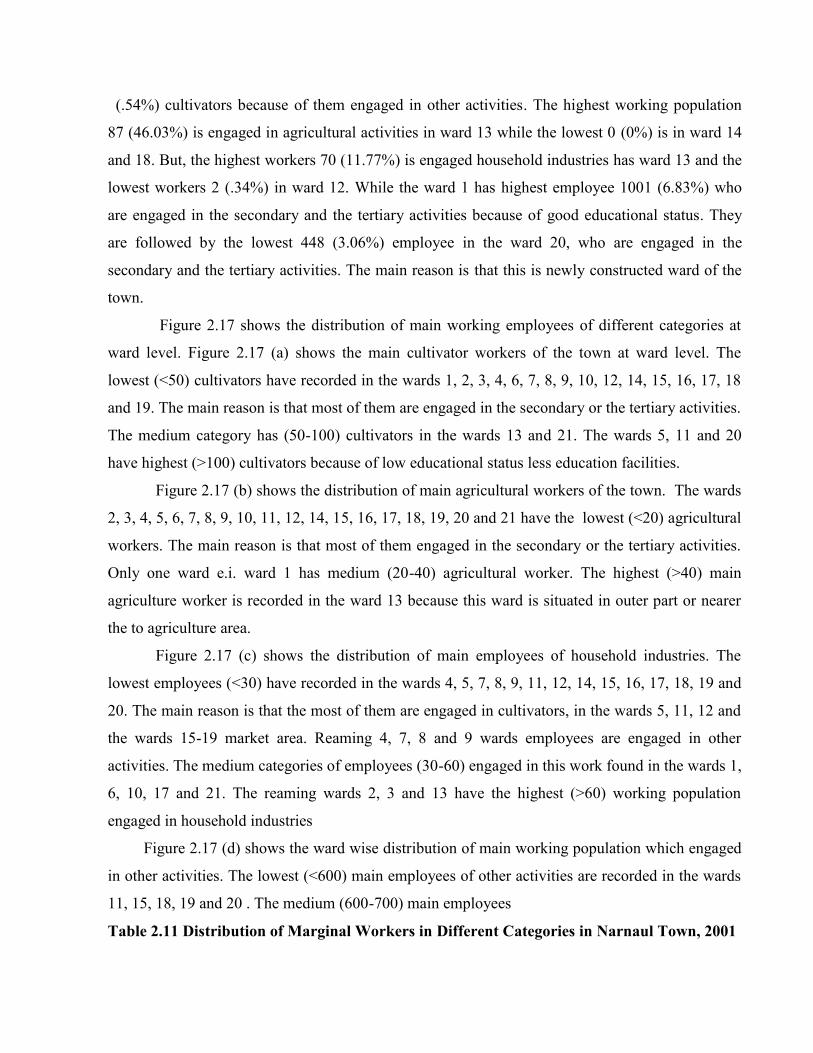
Figure 2.17 shows the distribution of main working employees of different categories at
ward level. Figure 2.17 (a) shows the main cultivator workers of the town at ward level. The
lowest (<50) cultivators have recorded in the wards 1, 2, 3, 4, 6, 7, 8, 9, 10, 12, 14, 15, 16, 17, 18
and 19. The main reason is that most of them are engaged in the secondary or the tertiary activities.
The medium category has (50-100) cultivators in the wards 13 and 21. The wards 5, 11 and 20
have highest (>100) cultivators because of low educational status less education facilities.
Figure 2.17 (b) shows the distribution of main agricultural workers of the town. The wards
2, 3, 4, 5, 6, 7, 8, 9, 10, 11, 12, 14, 15, 16, 17, 18, 19, 20 and 21 have the lowest (<20) agricultural
workers. The main reason is that most of them engaged in the secondary or the tertiary activities.
Only one ward e.i. ward 1 has medium (20-40) agricultural worker. The highest (>40) main
agriculture worker is recorded in the ward 13 because this ward is situated in outer part or nearer
the to agriculture area.
Figure 2.17 (c) shows the distribution of main employees of household industries. The
lowest employees (<30) have recorded in the wards 4, 5, 7, 8, 9, 11, 12, 14, 15, 16, 17, 18, 19 and
20. The main reason is that the most of them are engaged in cultivators, in the wards 5, 11, 12 and
the wards 15-19 market area. Reaming 4, 7, 8 and 9 wards employees are engaged in other
activities. The medium categories of employees (30-60) engaged in this work found in the wards 1,
6, 10, 17 and 21. The reaming wards 2, 3 and 13 have the highest (>60) working population
engaged in household industries
Figure 2.17 (d) shows the ward wise distribution of main working population which engaged
in other activities. The lowest (<600) main employees of other activities are recorded in the wards
11, 15, 18, 19 and 20 . The medium (600-700) main employees
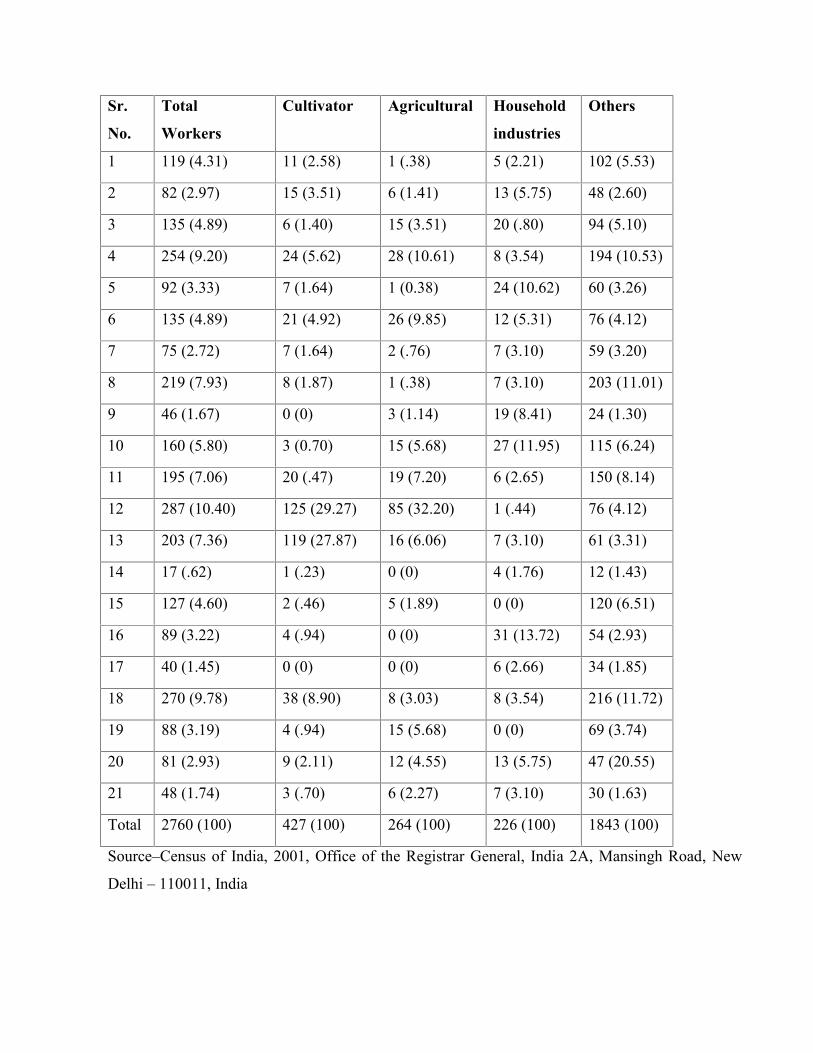
Table 2.11 Distribution of Marginal Workers in Different Categories in Narnaul Town, 2001
Sr.
No.
Total
Workers
Cultivator Agricultural Household
industries
Others
1 119 (4.31) 11 (2.58) 1 (.38) 5 (2.21) 102 (5.53)
2 82 (2.97) 15 (3.51) 6 (1.41) 13 (5.75) 48 (2.60)
3 135 (4.89) 6 (1.40) 15 (3.51) 20 (.80) 94 (5.10)
4 254 (9.20) 24 (5.62) 28 (10.61) 8 (3.54) 194 (10.53)
5 92 (3.33) 7 (1.64) 1 (0.38) 24 (10.62) 60 (3.26)
6 135 (4.89) 21 (4.92) 26 (9.85) 12 (5.31) 76 (4.12)
7 75 (2.72) 7 (1.64) 2 (.76) 7 (3.10) 59 (3.20)
8 219 (7.93) 8 (1.87) 1 (.38) 7 (3.10) 203 (11.01)
9 46 (1.67) 0 (0) 3 (1.14) 19 (8.41) 24 (1.30)
10 160 (5.80) 3 (0.70) 15 (5.68) 27 (11.95) 115 (6.24)
11 195 (7.06) 20 (.47) 19 (7.20) 6 (2.65) 150 (8.14)
12 287 (10.40) 125 (29.27) 85 (32.20) 1 (.44) 76 (4.12)
13 203 (7.36) 119 (27.87) 16 (6.06) 7 (3.10) 61 (3.31)
14 17 (.62) 1 (.23) 0 (0) 4 (1.76) 12 (1.43)
15 127 (4.60) 2 (.46) 5 (1.89) 0 (0) 120 (6.51)
16 89 (3.22) 4 (.94) 0 (0) 31 (13.72) 54 (2.93)
17 40 (1.45) 0 (0) 0 (0) 6 (2.66) 34 (1.85)
18 270 (9.78) 38 (8.90) 8 (3.03) 8 (3.54) 216 (11.72)
19 88 (3.19) 4 (.94) 15 (5.68) 0 (0) 69 (3.74)
20 81 (2.93) 9 (2.11) 12 (4.55) 13 (5.75) 47 (20.55)
21 48 (1.74) 3 (.70) 6 (2.27) 7 (3.10) 30 (1.63)
Total 2760 (100) 427 (100) 264 (100) 226 (100) 1843 (100)
Source–Census of India, 2001, Office of the Registrar General, India 2A, Mansingh Road, New
Delhi – 110011, India

who work in other activities are recorded in the wards 2, 5, 9, 13, 14 and 17. The highest (>700)
employees of main working population have been noticed in the wards 1, 3, 4, 6, 8, 10, 12, 16 and
21 because of good educational status.
Category Wise Distribution of Marginal Workers in NarnaulTown, 2001
15.47%
9.56%
8.19%66.78%
CultivatorsAgricultural WorkersHousehold IndutriesOthers
Figure
2.18
Table 2.11 and figure 2.18 shows the distribution of marginal working population
in different occupation. Out of the total marginal workers, 427 (15.47%) are employed in
cultivator, 264 (9.56%) in agricultural activity, 226 (8.19%) employees in household industries,
while 1843 (66.78%) employees are engaged in other sectors. While in the case of ward level it has
different characteristics. The highest 287 (10.40%) marginal employee founded ward 12 because
total population is more than the other wards. The lowest 17 (0.62%) marginal workers are found
in the ward 14. The highest marginal cultivator is recorded 125 (29.27%) in ward 12 and the
lowest marginal cultivators are 0 (0%) in ward 9 and 17 because these wards have low population
than others. The highest agricultural marginal workers are 85 (32.20%) in the ward 12 and the
lowest 0 (0%) marginal agricultural employee in the wards 14, 16 and 17 because these wards are
situated in main the market of the town. So people of these wards are engaged in market area. The
highest marginal workers 31 (13.72%) of household industries are recorded in the ward 16 while
the lowest 0 (0%) marginal workers in the wards 15 and 19. The highest marginal employees are
216 (11.72%) engaged in the other activity in the ward 18 while the lowest marginal employees 24
(1.30%) in the ward 9.
Figure 2.19 shows the ward wise distribution of marginal workers of Narnaul town. Figure
2.19 (a) reveals that the marginal cultivators is the lowest (<30) is the wards 1, 2, 3, 4, 5, 6, 7, 8, 9,
10, 11, 14, 15, 16, 17, 18, 19, 20 and 20. The main reason is that most of them are engaged in other
activities. The medium category of cultivators (30-60)

NARNAUL TOWN
2001DISTRIBUTION OF MARGINAL WORKING POPULATION
N
<350
30 - 60
> 60
< 10
10 - 20
> 20
< 20
20 -460
> 40
< 50
50 -100
> 100
Workers
Workers
Workers
Workers
Cultivator Workers
Household Industries Workers
Agricultural Workers
Other Workers
(a)
(c)
(b)
(d)
Fig. - 2.19
KILOMETRES4202
KILOMETRES4202
KILOMETRES4202
KILOMETRES4202
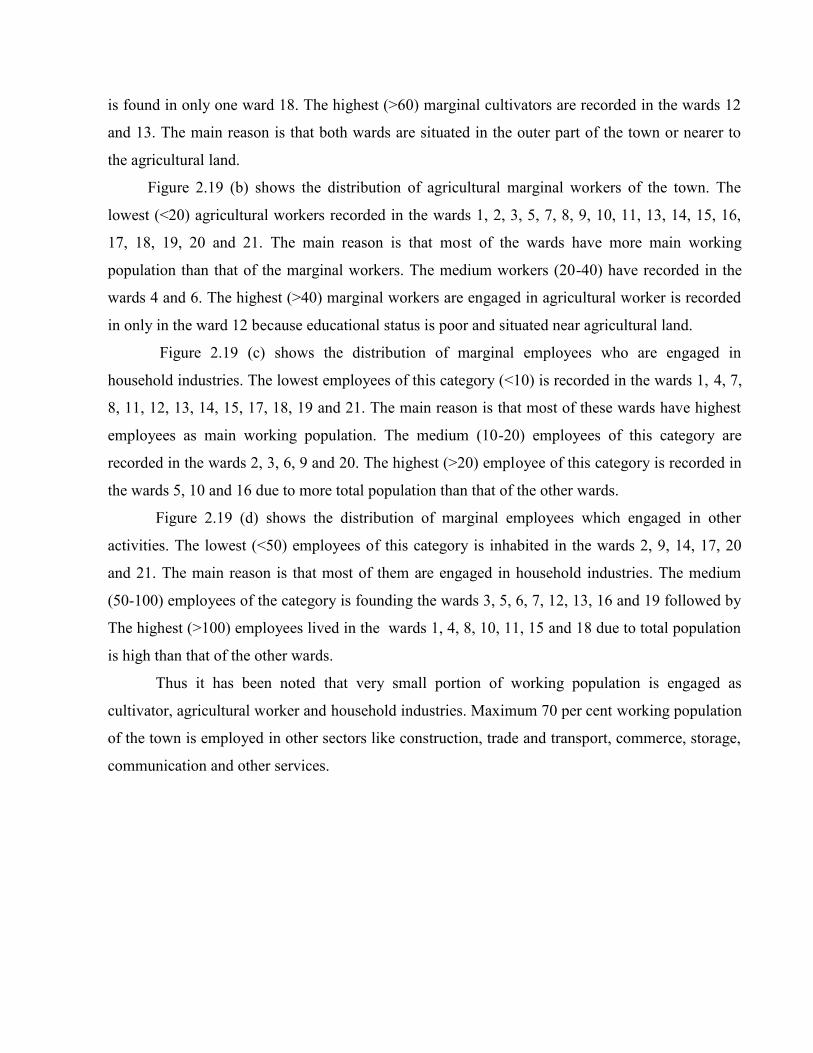
is found in only one ward 18. The highest (>60) marginal cultivators are recorded in the wards 12
and 13. The main reason is that both wards are situated in the outer part of the town or nearer to
the agricultural land.
Figure 2.19 (b) shows the distribution of agricultural marginal workers of the town. The
lowest (<20) agricultural workers recorded in the wards 1, 2, 3, 5, 7, 8, 9, 10, 11, 13, 14, 15, 16,
17, 18, 19, 20 and 21. The main reason is that most of the wards have more main working
population than that of the marginal workers. The medium workers (20-40) have recorded in the
wards 4 and 6. The highest (>40) marginal workers are engaged in agricultural worker is recorded
in only in the ward 12 because educational status is poor and situated near agricultural land.
Figure 2.19 (c) shows the distribution of marginal employees who are engaged in
household industries. The lowest employees of this category (<10) is recorded in the wards 1, 4, 7,
8, 11, 12, 13, 14, 15, 17, 18, 19 and 21. The main reason is that most of these wards have highest
employees as main working population. The medium (10-20) employees of this category are
recorded in the wards 2, 3, 6, 9 and 20. The highest (>20) employee of this category is recorded in
the wards 5, 10 and 16 due to more total population than that of the other wards.
Figure 2.19 (d) shows the distribution of marginal employees which engaged in other
activities. The lowest (<50) employees of this category is inhabited in the wards 2, 9, 14, 17, 20
and 21. The main reason is that most of them are engaged in household industries. The medium
(50-100) employees of the category is founding the wards 3, 5, 6, 7, 12, 13, 16 and 19 followed by
The highest (>100) employees lived in the wards 1, 4, 8, 10, 11, 15 and 18 due to total population
is high than that of the other wards.
Thus it has been noted that very small portion of working population is engaged as
cultivator, agricultural worker and household industries. Maximum 70 per cent working population
of the town is employed in other sectors like construction, trade and transport, commerce, storage,
communication and other services.