chapter - 2 characterization of untreated wastewater...
TRANSCRIPT

Chapter - 2
Characterization of Untreated
Wastewater Generated from Dyes
and Dye Intermediates
Manufacturing Industries of
Sachin Industrial Area
55
2.1 Introduction
City of Surat is known for Diamonds and Textiles. Surat is surrounded by various
industrial clusters namely Udhana, Pandesara, Sachin etc. The notified industrial area of
Sachin is known as GIDC Sachin.
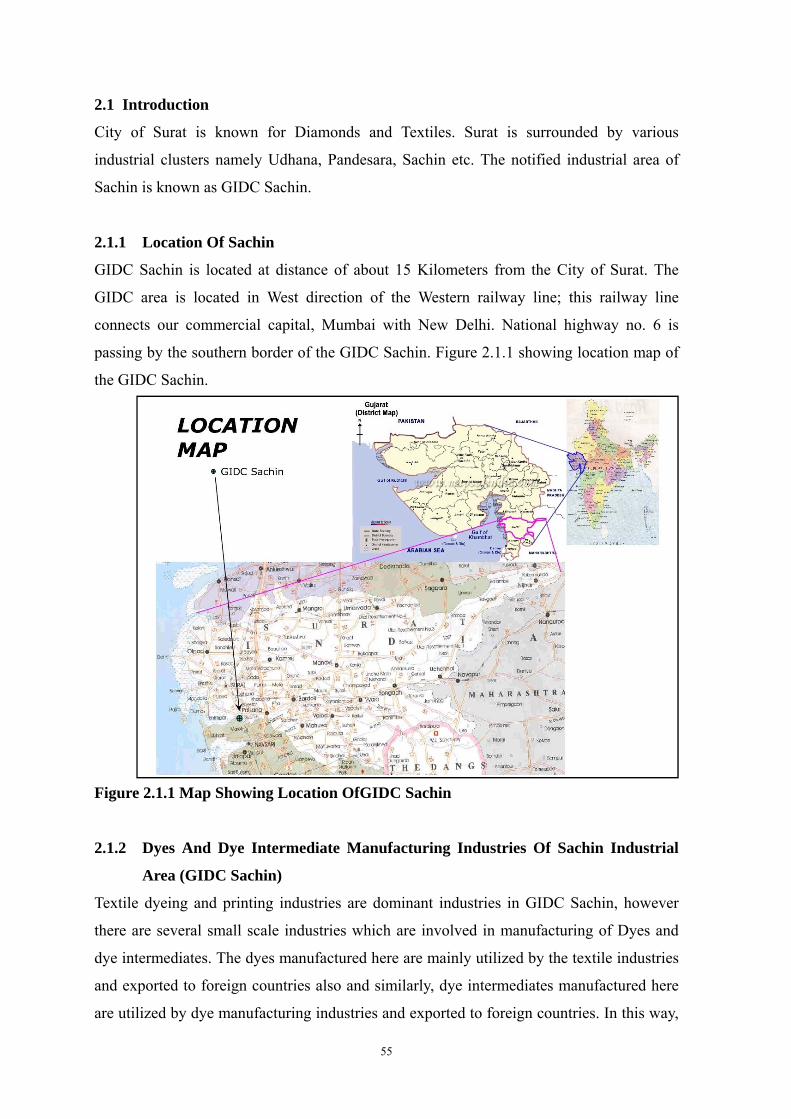
2.1.1 Location Of Sachin
GIDC Sachin is located at distance of about 15 Kilometers from the City of Surat. The
GIDC area is located in West direction of the Western railway line; this railway line
connects our commercial capital, Mumbai with New Delhi. National highway no. 6 is
passing by the southern border of the GIDC Sachin. Figure 2.1.1 showing location map of
the GIDC Sachin.
Figure 2.1.1 Map Showing Location OfGIDC Sachin
2.1.2 Dyes And Dye Intermediate Manufacturing Industries Of Sachin Industrial
Area (GIDC Sachin)
Textile dyeing and printing industries are dominant industries in GIDC Sachin, however
there are several small scale industries which are involved in manufacturing of Dyes and
dye intermediates. The dyes manufactured here are mainly utilized by the textile industries
and exported to foreign countries also and similarly, dye intermediates manufactured here
are utilized by dye manufacturing industries and exported to foreign countries. In this way,
56
dyes and dye intermediate industries, although they are small scale industries, contributing
to earn foreign revenue for our country. For the present study 10 numbers of small scale
industries were selected. Out of them 6 industries are manufacturing dye intermediates and
remaining 4 industries are manufacturing dyes of various types. The manufacturing process
of selected dyes and dye intermediates manufacturing industries was studied in detail.
2.1.3 Study Of Manufacturing Process Of Dyes Manufacturing Industries
Unlike most organic compounds, dyes possess colour, because they absorb light in the
visible spectrum (400–700 nm), they have at least one chromophore (i.e. colour-bearing
group), they have a conjugated system, i.e. a structure with alternating double and single
bonds, and they exhibit resonance of electrons, which is a stabilizing force in organic
compounds1.
When any one of these features is lacking from the molecular structure the colour is lost. In
addition to chromophores, most dyes also contain groups known as auxochromes (colour
helpers) such as carboxylic acid, sulfonic acid, amino, and hydroxyl groups. These groups
are not responsible for colour but their presence can shift the colour of a colourant and they
are most often used to influence dye solubility.
With regard to their solubility, organic colourants fall into two classes, viz. dyes and
pigments2. The main difference between dyes and pigments is that dyes are soluble in
water and/or an organic solvent, while pigments are insoluble in both types of liquid media.
Dyes are used to colour substrates to which they have affinity. Pigments can be used to
colour any polymeric substrate but by a mechanism quite different from that of dyes, in
that surface only colouration is involved unless the pigment is mixed with the polymer
before fibre or moulded article formation.
Dyes containing azo groups (i.e. azo dyes) comprise the largest family of organic dyes,
which may contain one or more diazo groups.
Major types of azo dyes are –
1) Acid Dyes: Anionic dyes for polyamide and protein substrates are known as acid dyes.
They derive their name from the fact that they are typically applied to suitable substrates
from a medium containing acid. In this case dyes are bearing a negative (anionic) charge,
57
which are used to impart colour on polyamides such as nylon; and proteins such as wool,
silk, and leather. These polyamides carry a positive (cationic) charge – especially during
the dyeing process. These dyes have little to no affinity for polyester, cellulosic, or cationic
polymers, since such substrates cannot form an ionic bond with them. Figure 2.1.2 is
showing dye-polymer binding via ionic bonding on nylon.
Dye-SO-
3 Na+ + Nylon-NH+3Cl- Dye-SO3
-+H3N-Nylon Figure 2.1.2 Schematic Representation Of Dye–Polymer Binding Via Ionic Bonding On Nylon 2) Disperse Dyes: Dyes developed for polyesters are known as disperse dyes. In this case,
the mechanism of coloration involves “dissolving” the dye in the polymer matrix to form a
solid–solid solution. Taking advantage of the well-known principle that “like dissolves
like”, disperse dyes are designed that are hydrophobic in nature. Such colourants are very
sparingly soluble in water and derive their name from the fact that they are dispersed rather
than fully dissolved in water to carry out the dyeing process. Disperse dyes have no affinity
for hydrophilic polymers such as cellulose, which makes them unsuitable for colouring
cotton, cellophane, and paper, but quite suitable for polyethylene terephthalate and
cellulose acetate.
3) Direct and Reactive dyes: Dyes designed for cellulosic polymers are direct, azoic, vat,
sulfur, and reactive dyes.
Direct dyes are so named because they were the first colourants that had affinity for cotton
in the absence of a binding agent known as a mordant. Because these dyes are
water-soluble, many have low wet fastness. The two key properties of direct dyes are that
they tend to be linear molecules, and they are able to gain close proximity to the cellulose
chain, to maximize the effects of intermolecular interactions such as H-bonding.
To enhance wet fastness on cellulosic fibres, methods were developed to apply water
insoluble dyes to cotton. Such dyes include those that are either water insoluble in their
natural form or synthesized inside the polymer matrix as a water-insoluble dye. The idea is
that placing a water-insoluble dye within the polymer matrix would prevent colour removal
upon exposure of the substrate to water. In turn, this led to the development of vat dyes and
sulfur dyes. Vat dyes owe their name to the vatting process associated with their

58
application, while sulfur dyes are so named because of the essential use of sulfur in their
synthesis.
The final class of suitable colourants for cellulosic fibres is known as reactive dyes. They
derive their name from the fact that they undergo a chemical reaction with cellulose to
form a covalent bond. Reactive dyes opened the door to bright wet-fast shades on
cellulosic fibres that were not previously attainable.
Generally, the synthesis of azo dyes involves two steps.
Step 1 is the conversion of an aromatic amine to a diazo compound (i.e. Ar-NH2 →ArN2+),
a process known as diazotization, and step 2 is the reaction of the diazo compound with a
phenol, naphthol, aromatic amine, or a compound that has an active methylene group, to
produce the corresponding azo dye, a process known as diazo coupling (e.g. Ar- N2+ +
Ar’-OH → Ar-N=N-Ar’-OH).
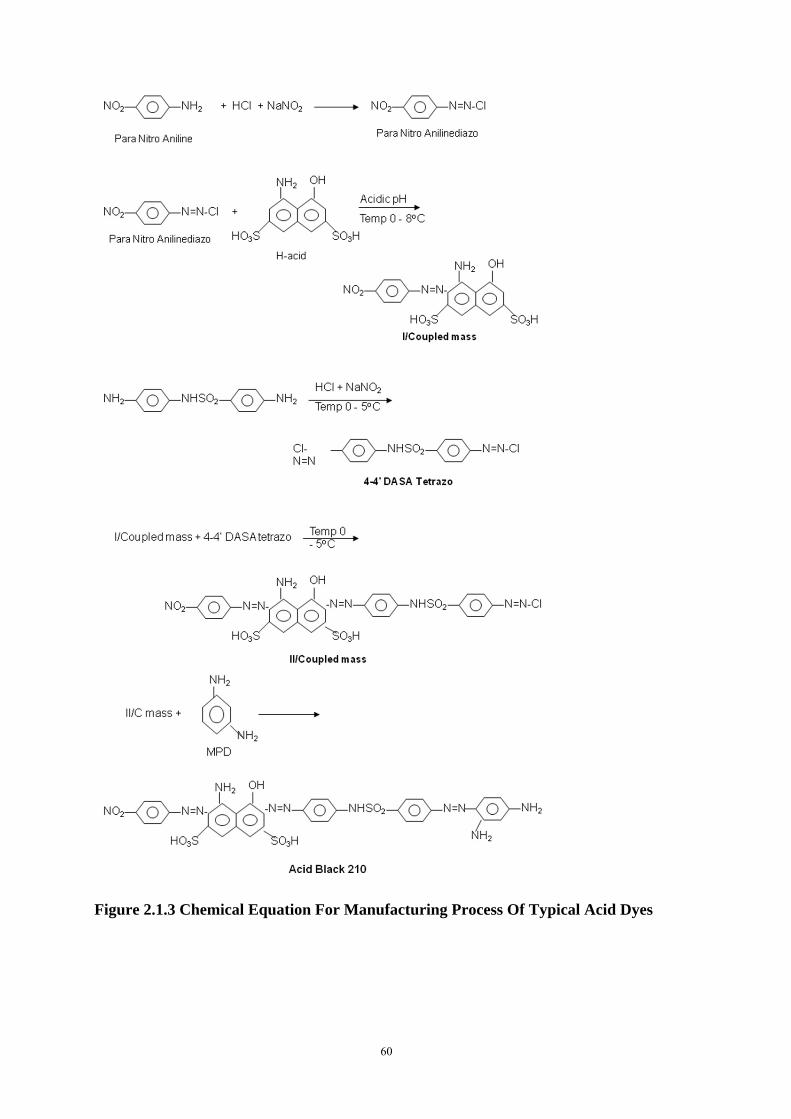
2.1.3.1 Product- Acid Dyes
The manufacturing process of all acid dyes is basically same therefore given here is the
manufacturing process of typical acid dye i.e. Acid Black 210. The manufacturing process
as provided by the industry is given herewith.
Stage – 1 Para Nitro Aniline Diazo (D1): Para Nitro Aniline is charged to water and
hydrochloric acid to get solution, which is cooled to 0 C stirred for one hour and then add
sodium nitrite to complete diazotization.
Stage -2 H Acid Solution (S1): H Acid is charged into water and stirred to get slurry. pH is
raised to 7.0 with caustic soda and ice is added to bring temperature to 0 C giving a clear
solution.
Stage -3 First Coupling (C1): In coupling tub, drop H acid solution then add para nitro
aniline diazo while keeping temperature between 0 – 5 C with ice. It is stirred and pH is
raised to 4.5 using sodium acetate. It is stirred further to completion of coupling.
59
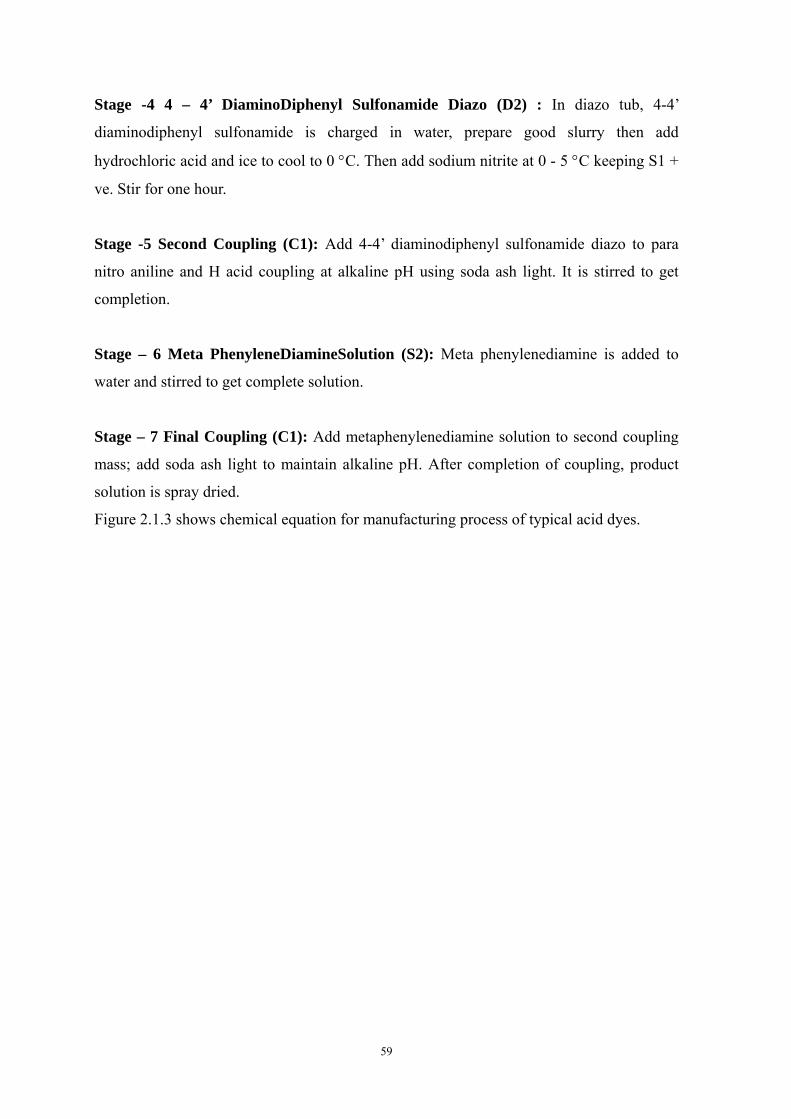
Stage -4 4 – 4’ DiaminoDiphenyl Sulfonamide Diazo (D2) : In diazo tub, 4-4’
diaminodiphenyl sulfonamide is charged in water, prepare good slurry then add
hydrochloric acid and ice to cool to 0 C. Then add sodium nitrite at 0 - 5 C keeping S1 +
ve. Stir for one hour.
Stage -5 Second Coupling (C1): Add 4-4’ diaminodiphenyl sulfonamide diazo to para
nitro aniline and H acid coupling at alkaline pH using soda ash light. It is stirred to get
completion.
Stage – 6 Meta PhenyleneDiamineSolution (S2): Meta phenylenediamine is added to
water and stirred to get complete solution.
Stage – 7 Final Coupling (C1): Add metaphenylenediamine solution to second coupling
mass; add soda ash light to maintain alkaline pH. After completion of coupling, product
solution is spray dried.
Figure 2.1.3 shows chemical equation for manufacturing process of typical acid dyes.
60
Figure 2.1.3 Chemical Equation For Manufacturing Process Of Typical Acid Dyes
61
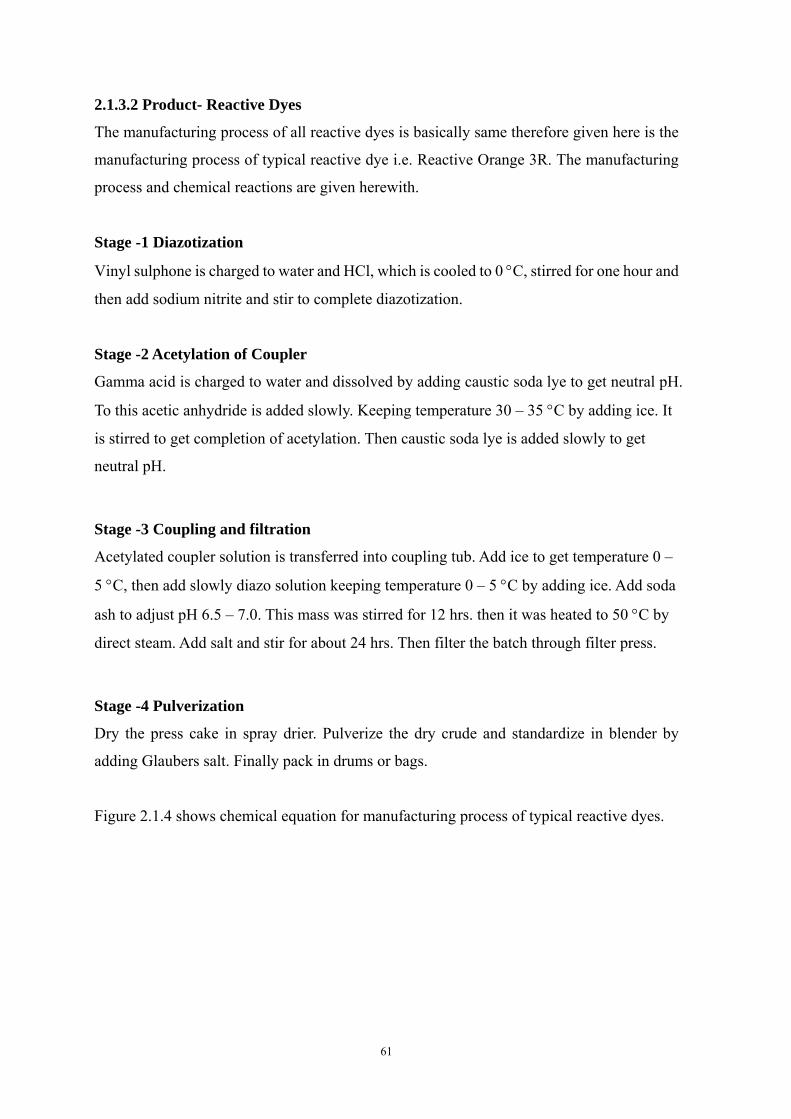
2.1.3.2 Product- Reactive Dyes
The manufacturing process of all reactive dyes is basically same therefore given here is the
manufacturing process of typical reactive dye i.e. Reactive Orange 3R. The manufacturing
process and chemical reactions are given herewith.
Stage -1 Diazotization
Vinyl sulphone is charged to water and HCl, which is cooled to 0 C, stirred for one hour and
then add sodium nitrite and stir to complete diazotization.
Stage -2 Acetylation of Coupler
Gamma acid is charged to water and dissolved by adding caustic soda lye to get neutral pH.
To this acetic anhydride is added slowly. Keeping temperature 30 – 35 C by adding ice. It
is stirred to get completion of acetylation. Then caustic soda lye is added slowly to get
neutral pH.
Stage -3 Coupling and filtration
Acetylated coupler solution is transferred into coupling tub. Add ice to get temperature 0 –
5 C, then add slowly diazo solution keeping temperature 0 – 5 C by adding ice. Add soda
ash to adjust pH 6.5 – 7.0. This mass was stirred for 12 hrs. then it was heated to 50 C by
direct steam. Add salt and stir for about 24 hrs. Then filter the batch through filter press.
Stage -4 Pulverization
Dry the press cake in spray drier. Pulverize the dry crude and standardize in blender by
adding Glaubers salt. Finally pack in drums or bags.
Figure 2.1.4 shows chemical equation for manufacturing process of typical reactive dyes.
62
Figure 2.1.4 Chemical Equation For Manufacturing Process Of Typical Reactive Dyes
63
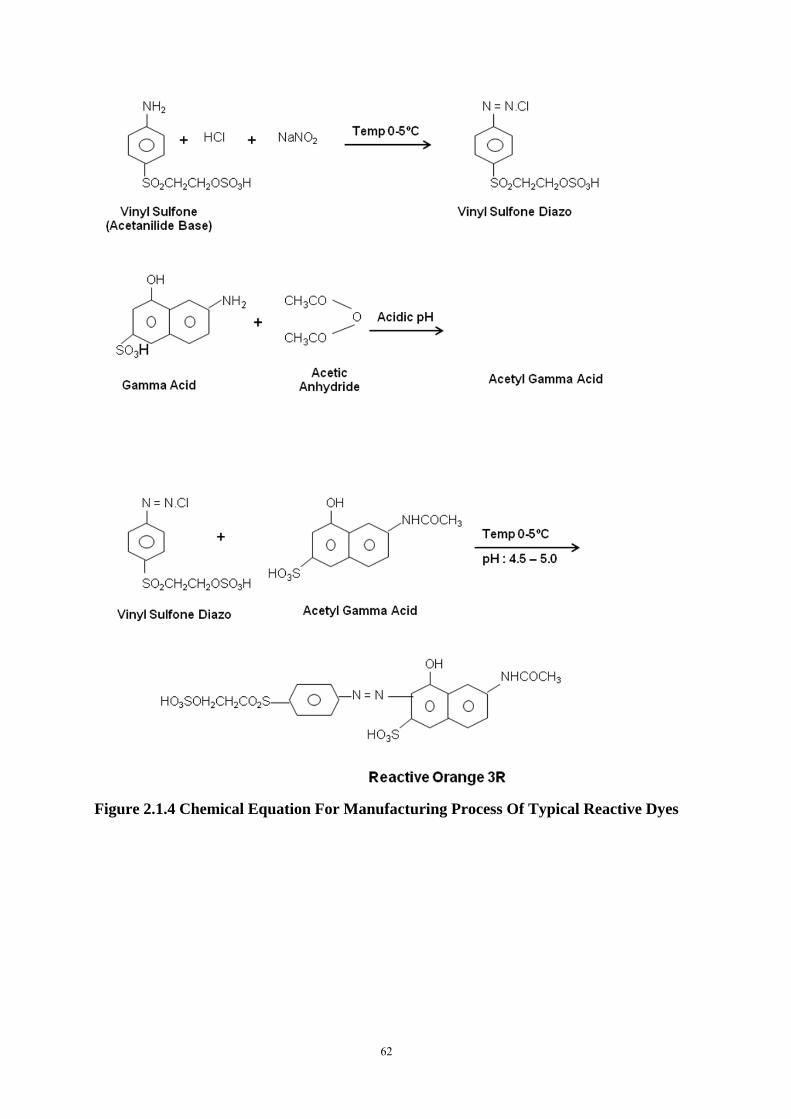
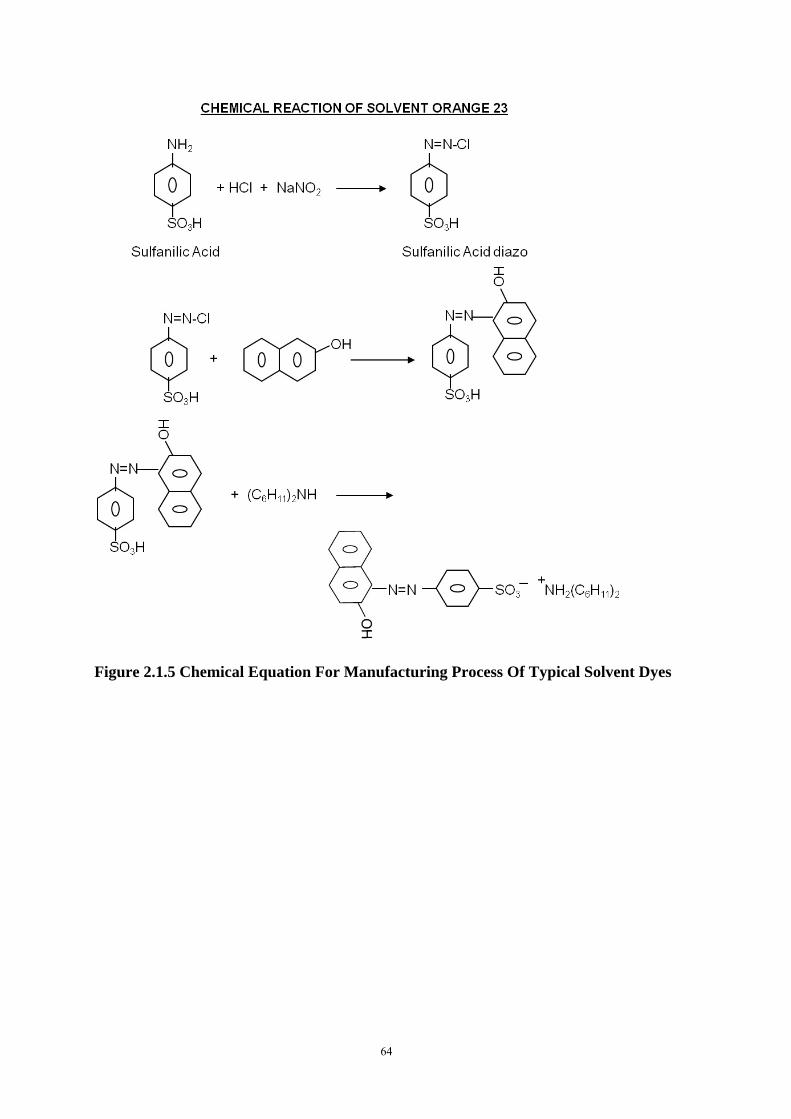
2.1.3.3 Product- Solvent Dyes
The manufacturing process of all solvent dyes is basically same therefore given here is the
manufacturing process of typical solvent dye i.e. Solvent Orange 23. The manufacturing
process and chemical reactions are given herewith.
Stage -1 Diazotization
Sulfanilic Acid is charged to water and HCl, which is cooled to 5 C, stirred for 1 hour. Then
add sodium nitrite and stir to get complete diazotization.
Stage – 2 Coupling Component Solutions
-Naphthol is charged to hot water at 55 – 60 C, stirred and caustic soda lye is added slowly
to get clear solution. It is then cooled to room temperature by adding ice.
Stage -3 Coupling
-Naphthol solution is transferred to coupling tub. Add ice to get temperature 0 – 5 C. Then
add slowly diazotized solution (prepared in Stage -1) maintaining temperature 0 – 5 C by
adding ice. After mixing add soda ash to adjust pH 8.0 – 8.5. This mass is stirred for 12
hours.
Next day coupled mass is heated to 35 C. Then add solution of dicyclohexylamine
dissolved in acetic acid and water for 1 hour. Stir mass for 2 – 3 hours at 35 C to completion
of reaction. It is then filtered through filter press, washed with distilled water till colorless
filtrate.
Stage – 4 Pulverizing & Blending
Dry the press cake, pulverize the dry crude and standardize in blender to get uniform
material.
Figure 2.1.5 shows chemical equation for manufacturing process of typical solvent dyes
64
Figure 2.1.5 Chemical Equation For Manufacturing Process Of Typical Solvent Dyes

65
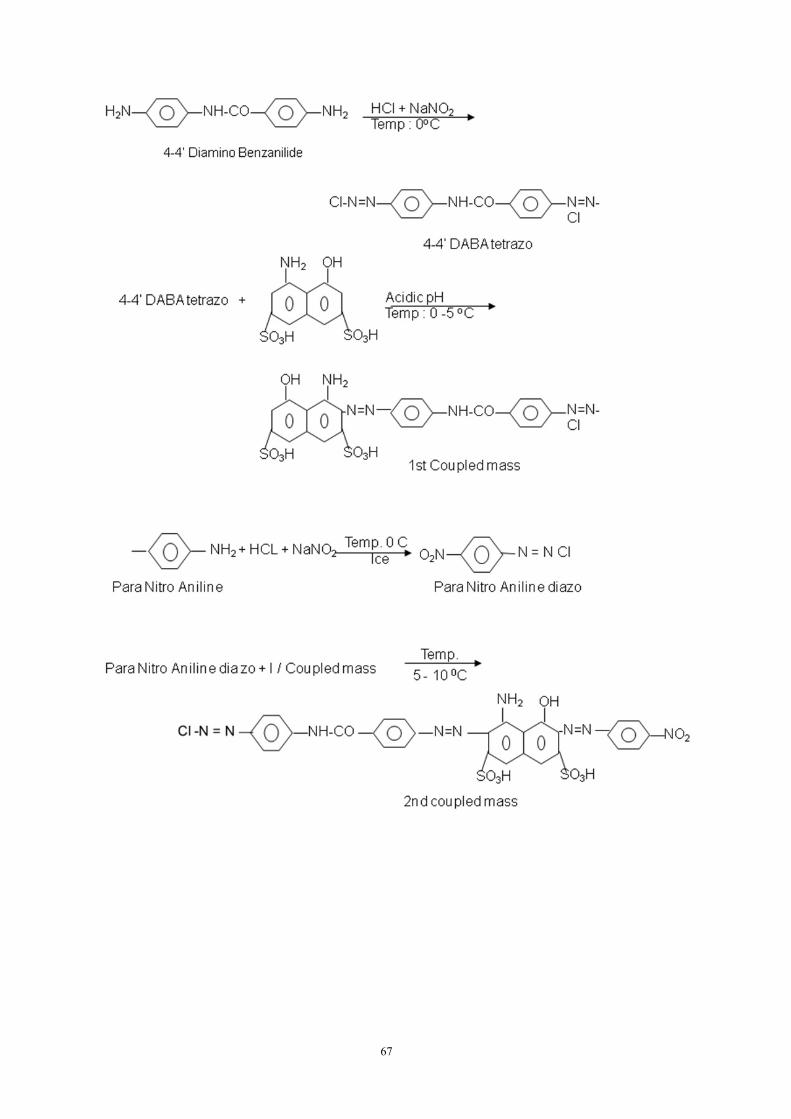
2.1.3.4 Product – Direct Dyes
The manufacturing process of all direct dyes is basically same therefore given here is the
manufacturing process of typical direct dye i.e. Direct Black 170. The manufacturing
process and chemical reactions are given herewith.
Stage – 1 4,4’-Diamino Benzanilide (DABA) Tetrazo (C1)
4,4’-DABA is charged to water and stirred for one hour. Then hydrochloric acid is charged
and cooled to 0 C with ice. Then sodium nitrite is added to complete tetrazo.
Stage – 2 H Acid Solution(S1)
H Acid is charged into water and stirred to get slurry. pH is raised to 7.0 with caustic soda
and ice is added to bring temperature to 0 C.
Stage – 3 First Coupling (C1)
In coupling tub, C1 containing DABA tetrazo, H acid solution from S1 is dropped while
keeping temperature between 0 – 5 C. The mass is stirred for completion of coupling and
then stirred overnight without temperature control.
Stage – 4 Aniline Diazo(D1)
In diazo tub water is taken. HCl is added. To this, aniline is added slowly and cooled to 0
C with ice. Then add sodium nitrite to complete diazotization.
Stage – 5 Gamma Acid Solution (S1)
In solution tank S1, Gamma acid is charged into water and stirred to get slurry. Caustic
soda is charged to get clear solution.
Stage – 6 MPD (Meta PhenyleneDiamine) Solution(S2)
In solution tank S2, MPD is charged into water and stirred to get clear solution.
Stage - 7 Second Coupling (C1)
Next day, in coupling tub C1, ice is added to bring temperature to 0 C and then aniline
diazo from D1 is dropped keeping temperature 0 – 2 C. Soda ash is added to get pH 9 to
9.5 and stirred for 3 hrs. to complete coupling reaction.

66
Stage – 8 Final Coupling (C1)
In C1, after aniline coupling, gamma acid solution from S1 is added and stirred to no test
for gamma acid. Then MPD solution from S2 is added and stirred for 2 hrs. to complete
reaction.
This coupled mass is then spray dried. The powder obtained is product Direct Black 170 is
standardized and packed in drums or bags.
Figure 2.1.6 shows chemical equation for manufacturing process of typical direct dyes.
67

68
Figure 2.1.6 Chemical Equation For Manufacturing Process Of Typical Direct Dyes
69
2.1.4 Study Of Manufacturing Process Of Dye Intermediate Manufacturing
Industries
The dye intermediates are the intermediate products which are used to prepare dyes. It was
found during industrial survey that, the dye intermediates are mainly benzene and
naphthalene derivatives, which are produces by unit processes such as sulfonation.
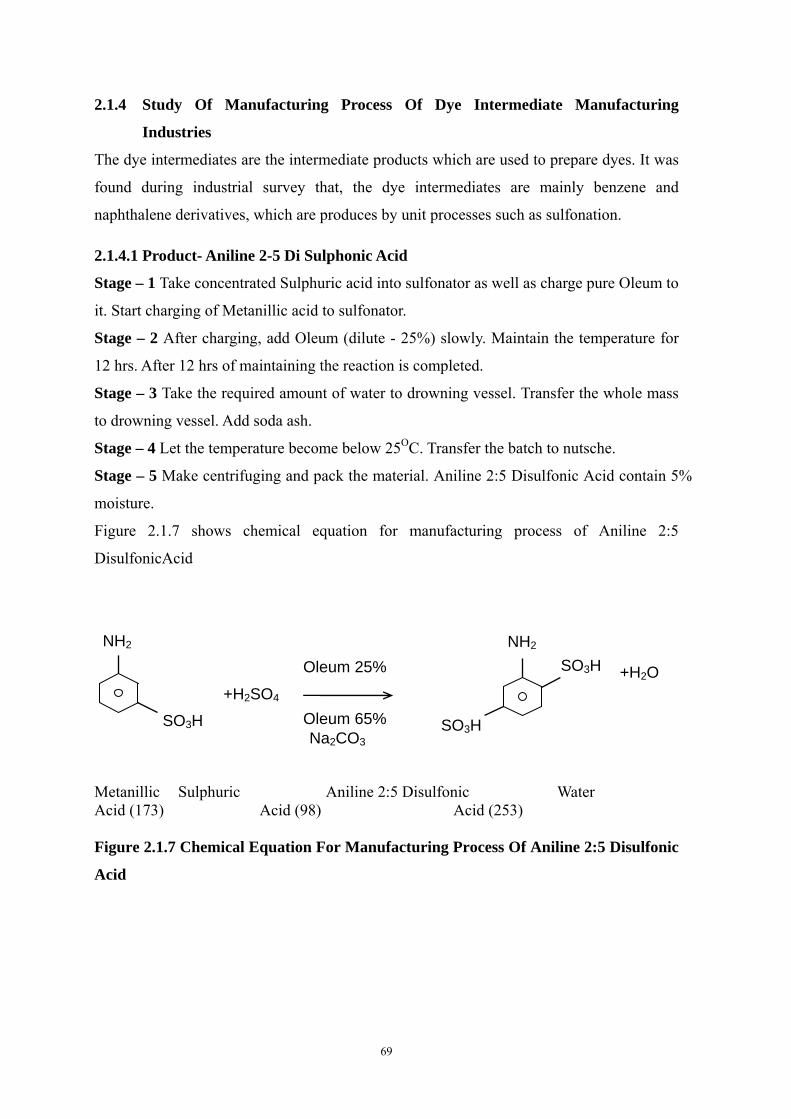
2.1.4.1 Product- Aniline 2-5 Di Sulphonic Acid
Stage – 1 Take concentrated Sulphuric acid into sulfonator as well as charge pure Oleum to
it. Start charging of Metanillic acid to sulfonator.
Stage – 2 After charging, add Oleum (dilute - 25%) slowly. Maintain the temperature for
12 hrs. After 12 hrs of maintaining the reaction is completed.
Stage – 3 Take the required amount of water to drowning vessel. Transfer the whole mass
to drowning vessel. Add soda ash.
Stage – 4 Let the temperature become below 25OC. Transfer the batch to nutsche.
Stage – 5 Make centrifuging and pack the material. Aniline 2:5 Disulfonic Acid contain 5%
moisture.
Figure 2.1.7 shows chemical equation for manufacturing process of Aniline 2:5
DisulfonicAcid
Metanillic Sulphuric Aniline 2:5 Disulfonic Water Acid (173) Acid (98) Acid (253) Figure 2.1.7 Chemical Equation For Manufacturing Process Of Aniline 2:5 Disulfonic
Acid
NH2
SO3H
+H2SO4
Oleum 25%
Oleum 65% Na2CO3
+H2O
NH2
SO3H
SO3H

70
2.1.4.2 Product- G Salt
Stage – 1 98 % Sulphuric acid is first taken to Sulphonator in which Beta-Naphthol is
slowly charged at 25 to 30 0C temperature.
Stage – 2 After one hour of stirring Oleum 23 % is charged at controlled rate so that
temperature of the reaction does not go above 40 0C.
Stage – 3 After completion of addition the mass is heated from 55 0C - 85 0C in
staggered manner and maintained at intermediate temperature for the specific time as per
the process requirement.
Stage – 4Required quantity of water is then taken in drowning vessel in which
sulfonation mass is dumped. To this mass salt is added to fall out the product.
Stage – 5After cooling this mass the product is filtered in filter press or nutsch filter. Wet
cake is then dried, crushed and packed.
Figure 2.1.8 shows chemical equation for manufacturing process of G- salt
Figure 2.1.8 Chemical Equation For Manufacturing Process Of G- Salt
OH
+ 2 H2SO4
OH
+ 2 H2O
SO3H
G - SALTBetaNaphthol
( 144 ) ( 2 x 98 = 196) ( 304 )(2 x 18 = 36)
Sulphuric Acid
SO3H
71
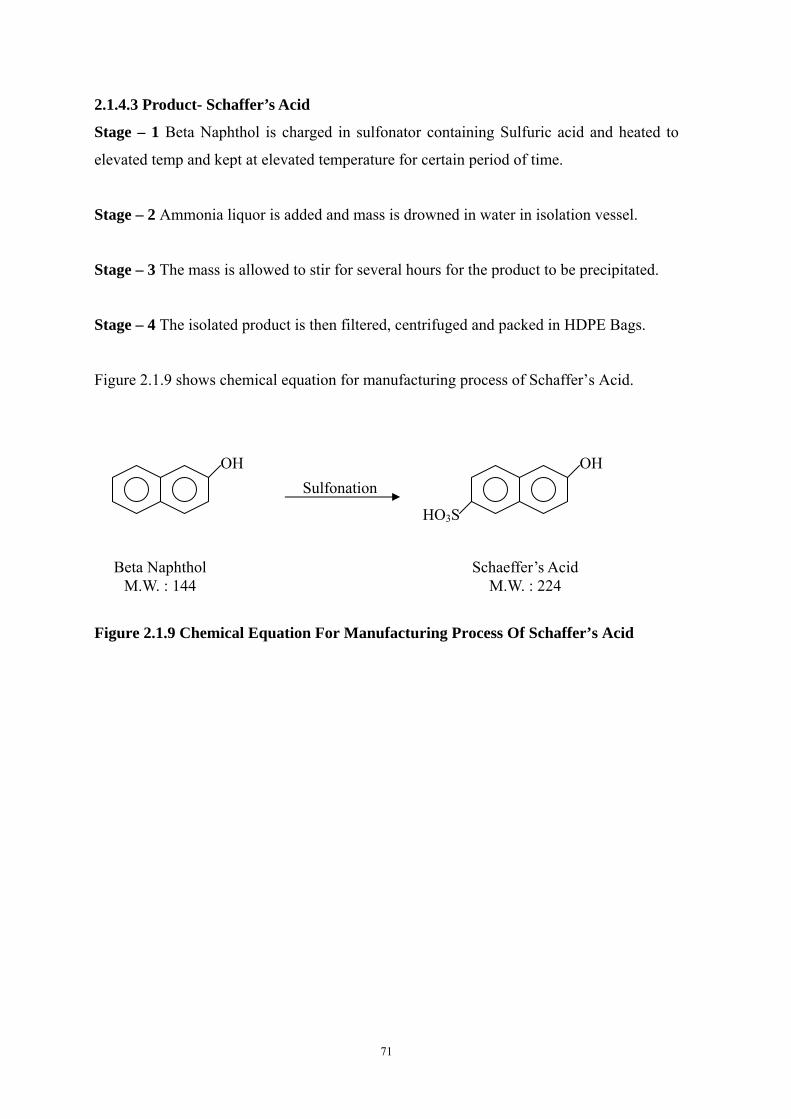
2.1.4.3 Product- Schaffer’s Acid
Stage – 1 Beta Naphthol is charged in sulfonator containing Sulfuric acid and heated to
elevated temp and kept at elevated temperature for certain period of time.
Stage – 2 Ammonia liquor is added and mass is drowned in water in isolation vessel.
Stage – 3 The mass is allowed to stir for several hours for the product to be precipitated.
Stage – 4 The isolated product is then filtered, centrifuged and packed in HDPE Bags.
Figure 2.1.9 shows chemical equation for manufacturing process of Schaffer’s Acid.
Figure 2.1.9 Chemical Equation For Manufacturing Process Of Schaffer’s Acid
OH Sulfonation
HO3S
OH
Beta Naphthol M.W. : 144
Schaeffer’s Acid M.W. : 224
72
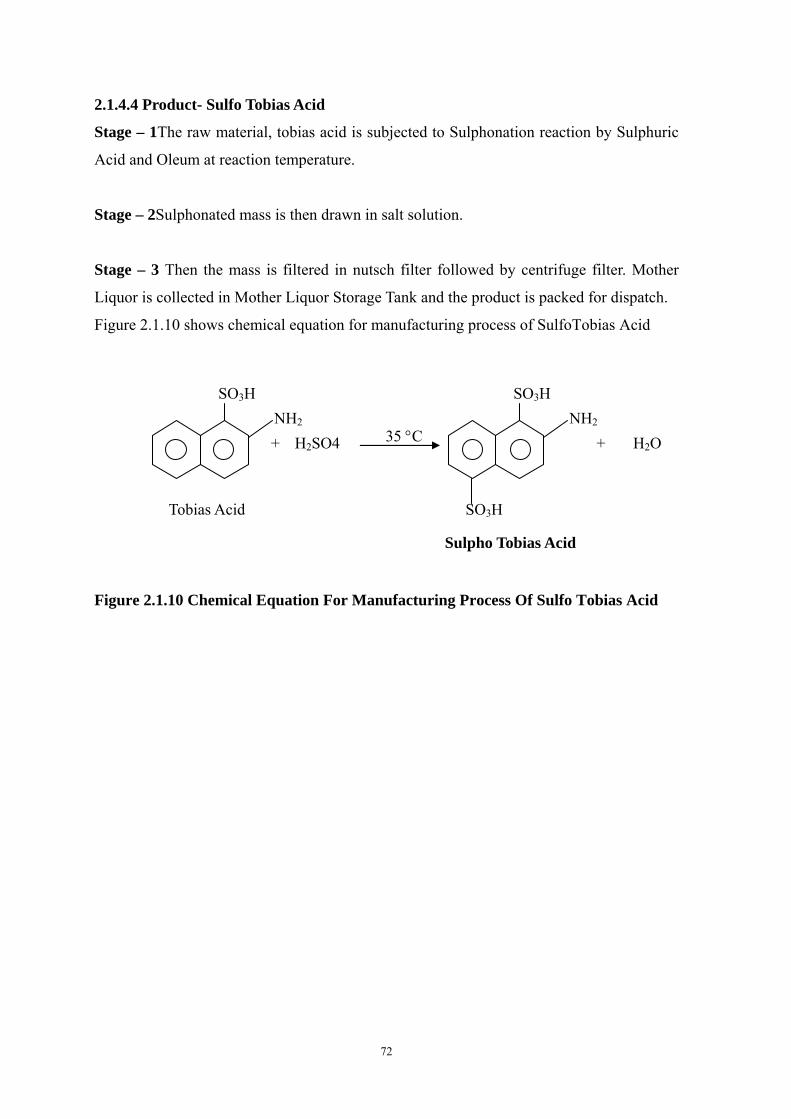
2.1.4.4 Product- Sulfo Tobias Acid
Stage – 1The raw material, tobias acid is subjected to Sulphonation reaction by Sulphuric
Acid and Oleum at reaction temperature.
Stage – 2Sulphonated mass is then drawn in salt solution.
Stage – 3 Then the mass is filtered in nutsch filter followed by centrifuge filter. Mother
Liquor is collected in Mother Liquor Storage Tank and the product is packed for dispatch.
Figure 2.1.10 shows chemical equation for manufacturing process of SulfoTobias Acid
Figure 2.1.10 Chemical Equation For Manufacturing Process Of Sulfo Tobias Acid
H2SO4 35 C +
SO3H
NH2
+
SO3H
NH2
SO3H
H2O
Sulpho Tobias Acid
Tobias Acid
73
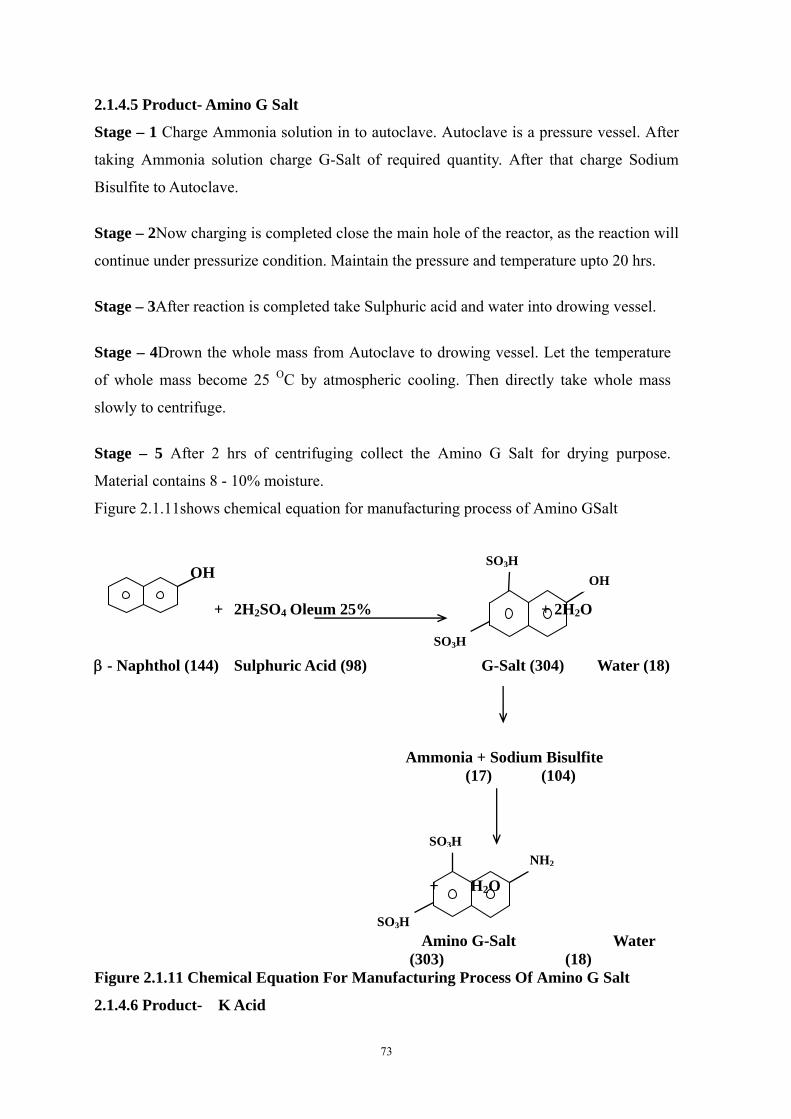
2.1.4.5 Product- Amino G Salt
Stage – 1 Charge Ammonia solution in to autoclave. Autoclave is a pressure vessel. After
taking Ammonia solution charge G-Salt of required quantity. After that charge Sodium
Bisulfite to Autoclave.
Stage – 2Now charging is completed close the main hole of the reactor, as the reaction will
continue under pressurize condition. Maintain the pressure and temperature upto 20 hrs.
Stage – 3After reaction is completed take Sulphuric acid and water into drowing vessel.
Stage – 4Drown the whole mass from Autoclave to drowing vessel. Let the temperature
of whole mass become 25 OC by atmospheric cooling. Then directly take whole mass
slowly to centrifuge.
Stage – 5 After 2 hrs of centrifuging collect the Amino G Salt for drying purpose.
Material contains 8 - 10% moisture.
Figure 2.1.11shows chemical equation for manufacturing process of Amino GSalt
OH + 2H2SO4 Oleum 25% + 2H2O - Naphthol (144) Sulphuric Acid (98) G-Salt (304) Water (18) Ammonia + Sodium Bisulfite (17) (104) + H2O Amino G-Salt Water (303) (18) Figure 2.1.11 Chemical Equation For Manufacturing Process Of Amino G Salt
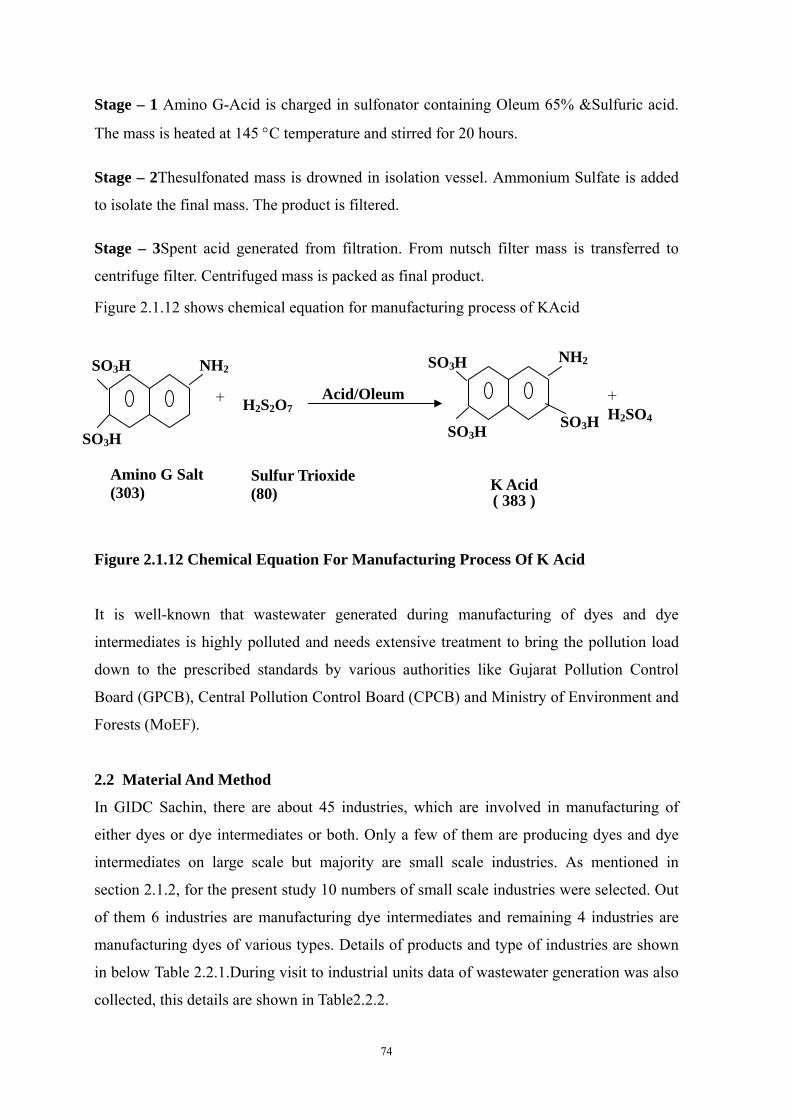
2.1.4.6 Product- K Acid
SO3H
SO3H
OH
SO3H
SO3H
NH2
74
Stage – 1 Amino G-Acid is charged in sulfonator containing Oleum 65% &Sulfuric acid.
The mass is heated at 145 C temperature and stirred for 20 hours.
Stage – 2Thesulfonated mass is drowned in isolation vessel. Ammonium Sulfate is added
to isolate the final mass. The product is filtered.
Stage – 3Spent acid generated from filtration. From nutsch filter mass is transferred to
centrifuge filter. Centrifuged mass is packed as final product.
Figure 2.1.12 shows chemical equation for manufacturing process of KAcid
Figure 2.1.12 Chemical Equation For Manufacturing Process Of K Acid
It is well-known that wastewater generated during manufacturing of dyes and dye
intermediates is highly polluted and needs extensive treatment to bring the pollution load
down to the prescribed standards by various authorities like Gujarat Pollution Control
Board (GPCB), Central Pollution Control Board (CPCB) and Ministry of Environment and
Forests (MoEF).
2.2 Material And Method
In GIDC Sachin, there are about 45 industries, which are involved in manufacturing of
either dyes or dye intermediates or both. Only a few of them are producing dyes and dye
intermediates on large scale but majority are small scale industries. As mentioned in
section 2.1.2, for the present study 10 numbers of small scale industries were selected. Out
of them 6 industries are manufacturing dye intermediates and remaining 4 industries are
manufacturing dyes of various types. Details of products and type of industries are shown
in below Table 2.2.1.During visit to industrial units data of wastewater generation was also
collected, this details are shown in Table2.2.2.
H2S2O7 Acid/Oleum
NH2
SO3H
+ H2SO4
K AcidAmino G Salt (303)
Sulfur Trioxide (80) ( 383 )
SO3HNH2
+
SO3H
SO3H
SO3H

75
Table 2.2.1 Details – Type Of Industries And Their Products
Industry Type of Industry Products
Industry – 1 Dye intermediate manufacturing Schaeffer’s Acid, K Acid,
SulfoTobias Acid
Industry – 2 Dye intermediate manufacturing G Salt,Sulfo Tobias Acid
Industry – 3 Dye intermediate manufacturing Schaeffer’s Acid, G Salt
Industry – 4 Dye intermediate manufacturing G Salt, Amino G Salt, K Acid
Industry – 5 Dye intermediate manufacturing Sulfo Tobias Acid, Schaeffer’s Acid
Industry – 6 Dye intermediate manufacturing Aniline 2:5 di sulphonic acid,Sulfo
Tobias Acid
Industry – 7 Dyes manufacturing Acid Dyes, Direct dyes
Industry – 8 Dyes manufacturing Acid Dyes, Solvent dyes
Industry – 9 Dyes manufacturing Solvent Dyes
Industry – 10 Dyes manufacturing Reactive Dyes, Direct Dyes
Table 2.2.2 Details –Industry wise wastewater generation Industry Wastewater generation
(in kL/day)
Contribution of flow of each
industry in total wastewater
generation ( in L /10 L)
Industry – 1 20.5 0.90
Industry – 2 24 1.00
Industry – 3 17 0.70
Industry – 4 35.5 1.50
Industry – 5 30 1.20
Industry – 6 32.5 1.30
Industry – 7 14.5 0.60
Industry – 8 6 0.20
Industry – 9 32 1.30
Industry – 10 32 1.30
Total 244 10
2.2.1 General Details On WaterConsumption, Source Of Raw Water, Water Balance,
Raw Materials, Wastewater Generation, Effluent Treatment Plant, Disposal Of
76
Treated Wastewater.
The dyes and dye intermediates manufacturing industries located in Sachin industrial area
is having an average production capacity of about 6 to 125 MT per month depending on
their installed capacity. For a dyes manufacturing industry the number of days during
which production activity is done ranges from 330 to 340 days in a year.
The quantity of fresh water consumed by the dyes and dye intermediates manufacturing
industry ranges from 8,000 L/day to 40,000 L/day depending on their production
capacity.The source of inlet water is GIDC water supply.The quantity of wastewater
generated from these industries ranges from6,000 L/day to 36,000 L/day.
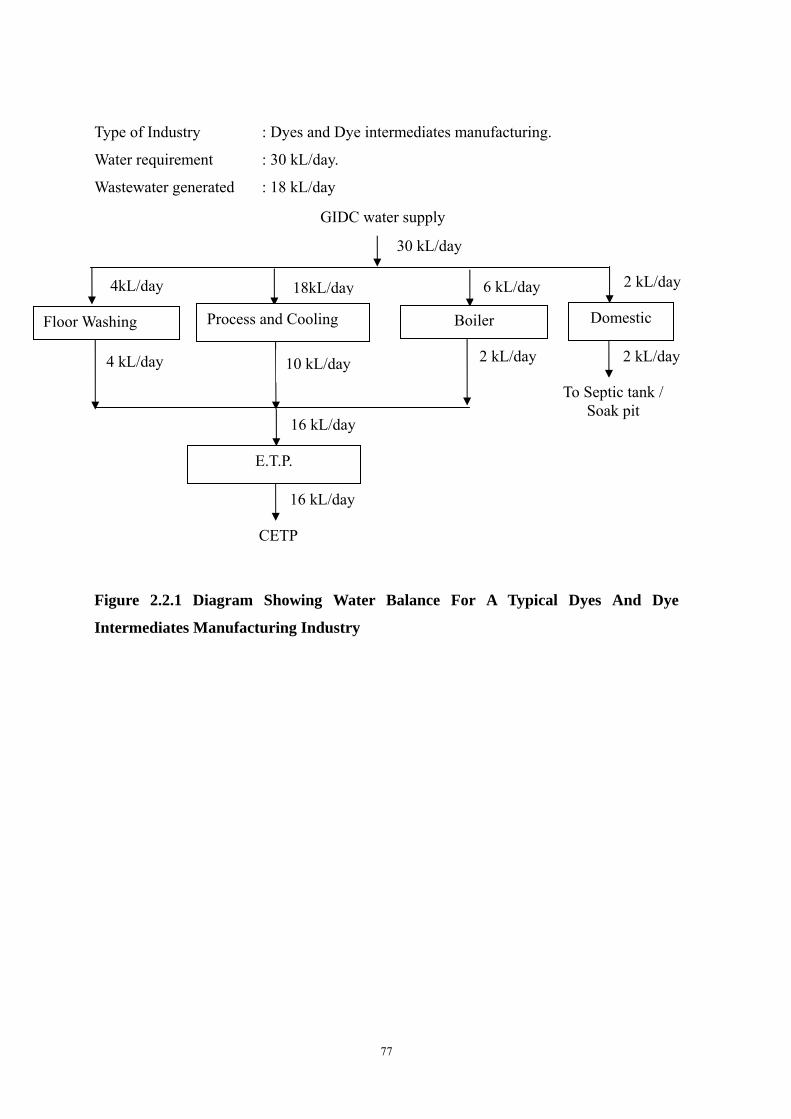
The water balance diagram for a dyes manufacturing industry that consumes 30,000 L (30
KL) of water per day is provided in below Figure 2.2.1.
77
Type of Industry : Dyes and Dye intermediates manufacturing.
Water requirement : 30 kL/day.
Wastewater generated : 18 kL/day
Figure 2.2.1 Diagram Showing Water Balance For A Typical Dyes And Dye
Intermediates Manufacturing Industry
30 kL/day
GIDC water supply
4 kL 28kL 28kL
Floor Washing Process and Cooling Boiler
4kL/day 18kL/day 6 kL/day
4 kL/day 10 kL/day 2 kL/day
E.T.P.
16 kL/day
16 kL/day
Domestic
2 kL/day
2 kL/day
To Septic tank / Soak pit
CETP
78
Raw materials used for the manufacturing of dye intermediates includes sulfuric acid,
hydrochloric acid, oleum, sodium hydroxide, sodium chloride and aryl aromatic substances
like beta naphthol, tobias acid, metanilic acid etc. while raw materials used for the
manufacturing of dyes includessodium nitrite, soda ash, sulfanilic acid, hydrochloric acid
andvarious dye intermediates.
In dye intermediates as well as dyes manufacturing industries utilizes water during various
manufacturing stages. Water is also required for various utilities like boiler, washing etc. as
mentioned in Figure 2.2.1. Wastewater is generated from the manufacturing process, boiler
and other utilities. Each industry has installed their effluent treatment plant (ETP) and the
entire wastewater generated from industrial manufacturing activities, is collected in a
designated tank of ETP, which is commonly known as effluent collection tank. The ETP is
generally having primary treatment section. The primary treatment section is consisting of
Equalization, Neutralization and filtration treatment units.
All 10 nos. of industries considered for the study are member of a Common Effluent
Treatment Plant (CETP). And all industries are sending their wastewater to this CETP for
further treatment and final disposal after treating their wastewater in the ETP installed into
their premises. They have provided a tank called CETP feed tank, in this tank the treated
wastewater is stored and from this tank, treated wastewater is sent to the CETP through
road tankers for further treatment.
2.2.2 Source Of Wastewater Sample
Untreated wastewater samples were collected three times during year 2010. The samples
were collected from the effluent collection tank of ETP of each industry.
2.2.3 Method Of Wastewater Sample Collection
Standard method for sampling3 was followed during sample collection, sample
transportation and storage. Samples were collected in containers having double stopper,
which were previously twice rinsed with sample wastewater. Samples were analyzed in the
laboratory as soon as possible.
To prepare representative combined wastewater sample, fractional ratio in total wastewater
quantity for each industry was identified and wastewater were mixed in ratio of wastewater
79
load to prepare 10 L wastewater. Then this wastewater was equalized by means of stirrer in
a tank of 15 liter capacity for 10 minutes.
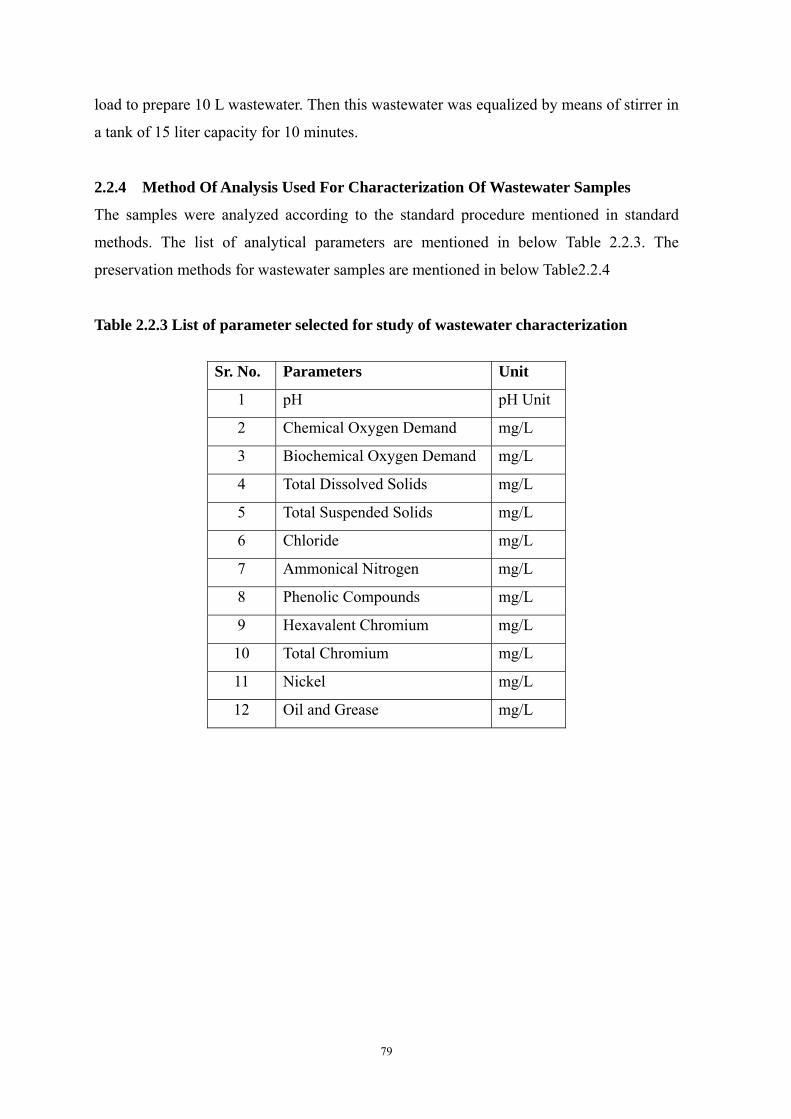
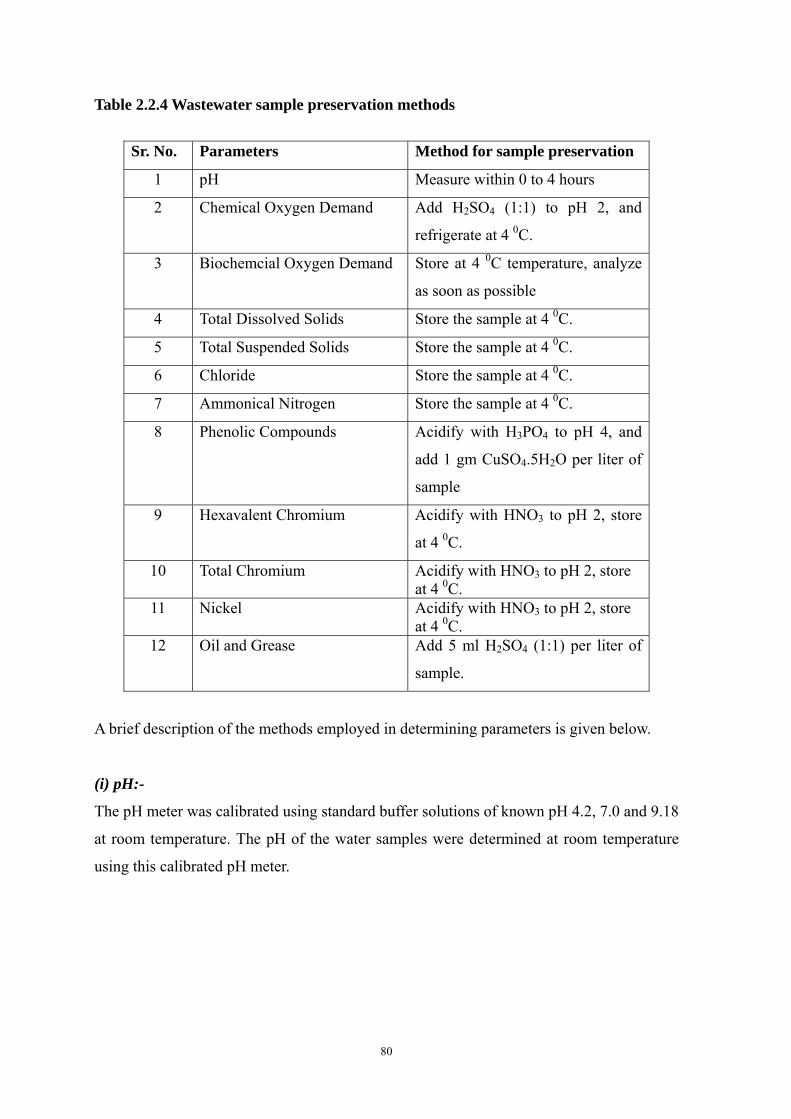
2.2.4 Method Of Analysis Used For Characterization Of Wastewater Samples
The samples were analyzed according to the standard procedure mentioned in standard
methods. The list of analytical parameters are mentioned in below Table 2.2.3. The
preservation methods for wastewater samples are mentioned in below Table2.2.4
Table 2.2.3 List of parameter selected for study of wastewater characterization
Sr. No. Parameters Unit
1 pH pH Unit
2 Chemical Oxygen Demand mg/L
3 Biochemical Oxygen Demand mg/L
4 Total Dissolved Solids mg/L
5 Total Suspended Solids mg/L
6 Chloride mg/L
7 Ammonical Nitrogen mg/L
8 Phenolic Compounds mg/L
9 Hexavalent Chromium mg/L
10 Total Chromium mg/L
11 Nickel mg/L
12 Oil and Grease mg/L
80
Table 2.2.4 Wastewater sample preservation methods
Sr. No. Parameters Method for sample preservation
1 pH Measure within 0 to 4 hours
2 Chemical Oxygen Demand Add H2SO4 (1:1) to pH 2, and
refrigerate at 4 0C.
3 Biochemcial Oxygen Demand Store at 4 0C temperature, analyze
as soon as possible
4 Total Dissolved Solids Store the sample at 4 0C.
5 Total Suspended Solids Store the sample at 4 0C.
6 Chloride Store the sample at 4 0C.
7 Ammonical Nitrogen Store the sample at 4 0C.
8 Phenolic Compounds Acidify with H3PO4 to pH 4, and
add 1 gm CuSO4.5H2O per liter of
sample
9 Hexavalent Chromium Acidify with HNO3 to pH 2, store
at 4 0C.
10 Total Chromium Acidify with HNO3 to pH 2, store at 4 0C.
11 Nickel Acidify with HNO3 to pH 2, store at 4 0C.
12 Oil and Grease Add 5 ml H2SO4 (1:1) per liter of
sample.
A brief description of the methods employed in determining parameters is given below.
(i) pH:-
The pH meter was calibrated using standard buffer solutions of known pH 4.2, 7.0 and 9.18
at room temperature. The pH of the water samples were determined at room temperature
using this calibrated pH meter.

81
(ii) Chemical Oxygen Demand (COD):-
This is a satisfactory method for determining the organic load of a water body4, which is
preferable to the biochemical oxygen demand (BOD). It is rapidly measurable parameter
for water stream, industrial waste studies and control of water treatment plants. The
method is based on the chemical oxidation of material in the presence of a catalyst by
Cr2O7-2.
3{CH2O} + 16 H+ + 2 Cr2O7-2 4 Cr+3 + 3CO2+ 11 H2O
The amount of unreacted Cr2O7-2 is then determined by titration with a standard ferrous
ammonium sulphate solution using ferroin indicator.
Ag2SO4 catalyzes the oxidation of straight chain aliphatic compounds, aromatic
hydrocarbons and pyridine. HgSO4 ties up Cl- as soluble complex and prevents its
interference.
Calculation:-
COD (mg/L) = (a-b) x N x 8000
mL sample
where,
a = mL ferrous ammonium sulphate for blank,
b = mL ferrous ammonium sulphate for sample,
N = Normality of ferrous ammonium sulphate.
Interference:-
Fatty acids, straight chain aliphatic compounds, chlorides and nitrites are the main
interfering radicals. The interferences caused by chlorides can be eliminated by the
addition of HgSO4 prior to addition of other reagents. About 0.4 gm of HgSO4 is adequate
to complex 40 mg Cl- ions in the form of poorly ionized HgCl2. Addition of Ag2SO4 to
concentrated H2SO4 as a catalyst accelerates the oxidation of straight chain aliphatic fatty
acids and aromatic compounds.
82
NO2- exerts a COD of 1.14 mg/mg NO2
-. Sulphamic acid in the amount of 10 mg/mg NO2-
may be added to K2Cr2O7 solution to avoid interference caused by NO2-.
For complete oxidation of organic matter, it is necessary to see that, equal volumes of
sulphuric acid and sample plus dichromate are taken.
(iii) Biochemical Oxygen Demand (BOD):-
This is an empirical, semi-quantitative method based on oxidation of organic matter by
suitable microorganisms during a 3-day period5. (Previously 5-day period was used).
The degree of microbially mediated O2 consumption in water is known as the
“Biochemical Oxygen Demand”. This parameter is commonly measured by the quantity of
O2 utilized by suitable aquatic microorganisms during 3-day period.
{CH2O} + O2CO2+ H2O
The selection of microorganisms (seed) is equal and the results are not reproducible. The
purpose of seeding is to introduce into the sample, a biological population capable of
oxidizing the organic matter in the wastewater. Where such microorganisms are already
present, i.e. in domestic wastewater or surface water, seeding is not necessary, but when
the sample is deficient in microorganisms, the dilution water needs seeding. The standard
seed material is settled domestic wastewater, which has been stored for 24 to 36 hours at
20 oC.
Procedure:-
(a) Preparation of dilution water:-
Take desired volume of distilled water in a suitable bottle and add 1 mL of phosphate
buffer (pH=7.2), 1 mL MgSO4solution (22.5 gm/L), 1 mL of CaCl2(27.7 gm/L) and 1 mL
of FeCl3 solution (0.25 gm/L).
(b) Dilution technique:-
The dilution depends on the nature of the sample.
0.1 to 1% - for industrial wastes,
83
1 to 5% - for raw sewage,
25 to 100% - for polluted river water and
5 to 25% - for oxidized effluents
(c) Method:-
Aerate the water samples thoroughly by bubbling air through a diffusion tube into the
sample for 5 minutes. Make a measured dilution with dilution water, if BOD is greater than
DO level. Seed with a little diluted domestic wastewater (1.2 mL/L). Measure DO on a
suitable aliquot (D1).
Fill a screw-topped incubation bottle (250-300 mL) to the brim with the remaining diluted
sample. Seal the bottle and incubate in the dark for three days at 27 oC.Measure DO on
aliquot of the sample (D2).
BOD (mg/L) = (D1-D2) – (B1-B2) f
P
Where,
D1 = DO of diluted sample,
D2 = DO of sample after incubation,
B1and B2 are DO of dilution water containing seed before and after incubation,
F= ratio of seed in sample to seed in control,
P = decimal fraction of sample unseed.
(iv) Total Suspended Solids (TSS) and Total Dissolved Solids (TDS):-
Here methods for analysis of Total Suspended Solids6 and Total Dissolved Solids7 are
mentioned. Filtering crucibles are of two types8. In one type, the filtering medium is an
integral part of crucible; in the other, a perforated bottom supports a glass or asbestos filter
mat that is not a part of the crucible. The latter is called a “Gooch crucible”.
Gooch crucibles employing a mat of asbestos fiber were of considerable historical
importance because they could be ignited at high temperatures. Now a days, small circles
of glass matting are available commercially and can be used instead of asbestos in a Gooch
crucible. Glass mats can tolerate temperature in excess of 500 oC and are substantially less
hygroscopic then asbestos.
84
A partial vacuum is used to draw the supernatant liquid through a filtering crucible. This
procedure frequently shortens the time needed for filtration. Connection is made between
the crucible and a heavy walled filtering flask with a rubber adaptor.
A glass matting was preheated at 550 0C and then weighed (let it be Agm). 50 mL sample
was filtered through this matting. It was dried in oven at 103 oC to 105 oC for one hour.
The matting was cooled in to room temperature and weighed (let it be B gm). The filtrate
obtained is collected into a clean and dry beaker of glass (100 mL),which has been
previously weighed (let it be C gm). The filtrate in beaker is transferred to oven at a
temperature of 103 oC to 105 oC for a minimum of 24 hours. The beaker was cooled in
desiccator to room temperature and then again weighed (let it be D gm).
Calculation:
TSS (mg/L) = (B-A) x 1000 x 1000
Volume of sample
Where,
A = weight of empty glass matting in gm
B = weight of glass matting after filtration in gm,
TDS (mg/L) = (D-C) x 1000 x 1000
Volume of sample
Where,
C = weight of empty glass beaker in gm
D = weight of glass beaker after evaporation and cooling in gm.
Total Solids,
T.S. (mg/L) = T.S.S. (mg/L) + T.D.S. (mg/L)
(v) Chloride:-
There are two methods for the estimation of chloride9
(1) Mohr method and
85
(2) Volhard method
For our study, Mohr’s method was used. The sample was acidified by adding 1 to 3 mL of
dilute HNO3 and excess acid was neutralized by A.R. grade Calcium carbonate. Slight
more calcium carbonate was added and the sample was titrated against standard silver
nitrate solution, using 4% potassium chromate (K2CrO4) as an indicator, till the appearance
of permanent reddish tinged of the solution.
NaCl + AgNO3AgCl + NaNO3
K2CrO4+ 2AgNO3Ag2CrO4 +2KNO3
Reddish colour
Calculation:-
1 mL X NAgNO3 = 0.03545 xXgm Chloride
Cl-(mg/L) = 0.03545 x Xx B.R. x 1000
mL of sample taken
Where,
B.R. = burette reading of silver nitrate solution,
X = normality of silver nitrate solution.
(vi)Ammoniacal Nitrogen (NH3-N):-
There are four methods for determination of ammoniacal nitrogen10 :
(a) Titrimetric method,
(b) Nesslerization method,
(c) Phenate method and
(d) Ammonia selective electrode method.
For our study, titrimetric method was used. Take 500 mL neutralized water sample in a
distillation flask. Add 25 mL of borate buffer and adjust pH to 9.5 with 6N sodium
hydroxide solution. Distill at the rate of 6 to 10 mL/minute with the tip of the delivery tube
below the surface of acid receiving solution. Collect distillate in a 500 mL Erlenmeyer
flask containing 50 mL indicating boric acid (containing mixed indicator). Collect at least
200 mL of distillate against standard sulfuric acid until indicator turns a pale-lavender.
Cover a blank through all steps of the procedure and apply the necessary correction factor
to the results.
86
Calculation:
Ammoniacal nitrogen (mg/L) = (A-B) x 280
V
Where,
A= volume in mL of H2SO4 used for sample,
B= volume in mL of H2SO4 used for blank,
V= volume in mL of sample taken for test.
(vii)Hexavalent Chromium (Cr VI):-
The hexavalent chromium is determined spectrophotometrically by reaction with
diphenylcarbazide in acid solution11.If the sample contains organic matter and considerable
suspended or colloidal particles are present, digest the sample with HNO3 and H2SO4 and
then take it for analysis.
Transfer a suitable volume of homogenized sample to a beaker. Add 5 ml of cone HNO3
and a few porcelain pieces or glass beads. Heat to boil the solution, and concentrate
carefully on a hot plate to a lowest possible volume. If required, cool the solution and
transfer quantitatively, into a beaker of smaller size (say 150 ml beaker). Add 5 ml of cone
HNO3 and 10 ml of conc H2S04. Heat up to the evolution of dense white fumes of SO3. If
the solution is not clear, add 5 ml of HNO3 and re-heat until a clear solution (no evolution
of brown fumes) results. Cool and transfer quantitatively into a 100 ml volumetric flask.
Dilute up to the mark with water, and mix well.
Take an aliquot of the acid digested sample and filter if necessary into 125 mL conical
flask. Then add ammonium hydroxide or dilute sulfuric acid as needed to make it neutral to
litmus paper. Add 1.0 mL of dilute sulfuric acid and 0.3 mL of concentrated phosphoric
acid. Transfer to a 100 mL volumetric flask, dilute to 100 mL and mix. Add 2 mL of
diphenylcarbazide solution, mix and allow to stand for 10 minutes for full colour
development. Measure the absorbance at 540 nm. Prepare a calibration curve using
standard chromium (VI) solution containing 10 to 100 µg of chromium. From this curve
find amount of Cr (VI) in sample.
87
Calculation:-
Cr (VI) mg/L =1000 x W
V
Where,
W= amount in mg of chromium from calibration curve,
V = volume in mL of the sample taken for the test.
(viii) Total Chromium:-
This procedure measures only hexavalent chromium (Cr+6). Therefore, to determine the
total chromium, convert all the chromium to the hexavalent state by oxidation with
potassium permanganate11. The hexavalent chromium is determined
spectrophotometrically by reaction with diphenylcarbazide in acid solution. If the sample
contains organic matter and considerable suspended or colloidal particles are present,
digest the sample with HNO3 and H2SO4 and then take it for analysis.
Transfer a suitable volume of homogenized sample to a beaker. Add 5 ml of cone HNO3
and a few porcelain pieces or glass beads. Heat to boil the solution, and concentrate
carefully on a hot plate to a lowest possible volume. If required, cool the solution and
transfer quantitatively, into a beaker of smaller size (say 150 ml beaker). Add 5 ml of cone
HNO3 and 10 ml of conc H2S04. Heat up to the evolution of dense white fumes of SO3. If
the solution is not clear, add 5 ml of HNO3 and re-heat until a clear solution (no evolution
of brown fumes) results. Cool and transfer quantitatively into a 100 ml volumetric flask.
Dilute up to the mark with water, and mix well.
Take suitable aliquot of acid digested sample in conical flask; add methyl orange indicator
and ammonium hydroxide until the solution is just basic. Add dilute sulfuric acid drop wise
until it is acidic and add 1 mL more dilute sulfuric acid. Add 5 drops of phosphoric acid.
Adjust volume about 40 mL, add boiling chips and heat to boiling. Add potassium
permanganate solution drop wise to give a dark red colour, if colour fades add more. Add 2
drops in excess, add 1 mL of sodium azide solution. Boil it for 1 minute.
Transfer and cool the solution to a 100 mL volumetric flask. Dilute to 100 mL and mix
well. Add 2 mL of diphenylcarbazidesolution, mix and allow to stand for 10 minutes and
measure absorbance at 540 nm. Calculate the concentration of chromium from calibration
curve.
88
Calculation:-
Total chromium, mg/L = 1000 x W
V
Where,
W = amount in mg of chromium from calibration curve,
V = volume of sample in mL
(ix) Nickel:-
After destruction of organic matter (after digestion with concentrate HNO3 and concentrate
H2SO4), nickel is extracted from ammoniacal solution as its dimethylglyoxide complex and
determined spectrophotometrically12.
Take 100 mL sample, add 10 mL of sodium citrate solution. Add concentrate ammonium
hydroxide solution till basic. Add 10 mL dimethylglyoxime solution and allow to stand for
1 minute. Add 3 batches of 10 mL chloroform to it and collect the chloroform extract in
other separating funnel. Add 10 mL dilute HCl to this chloroform and shake well. Collect
the acid layer in a beaker. Further add 5 mL of dilute HCl to the chloroform extract. Collect
the acid layer and combine the two acid layers. Reject chloroform layer. Take acid layer
into 50 mL volumetric flask. Add 2 mL sodium citrate solution, 2 mL bromine water and
concentrate ammonium hydroxide to destroy bromine color. Add 4 mL dimethylglyoxime
solution. Dilute to 50 mL.Measure absorbance at 480 nm. Prepare a calibration curve using
standard solution containing 50 to 250 µg of nickel. Read the amount of nickel in this
sample from calibration curve.
Calculation:-
Nickel, (mg/L) = W x 1000
V
Where,
W= amount of Nickel in mg from calibration curve
V = volume of sample in mL
89
(x) Phenolic Compounds:-
Phenol analysis is important in water pollution studies because of the objectionable taste of
chlorinated phenols resulting from the reaction of phenol with chlorine in chlorinated
drinking waters. Phenols are common pollutants in industrial wastewater. Phenols and
other phenolic compounds are first separated from wastewater by distillation. Reaction of
phenol with 4-amino antipyrine at pH 10 in the presence of potassium hexacynoferrate (III)
develops red coloured species which is extractable into chloroform. The absorbance is
measured at 460 nm13.
The method is quite sensitive with a detection limit of about 1 µg/L of phenol.
Para-substituted phenol (alkyl, aryl, nitro, benzoyl, nitroso or aldehyde substitution) do not
respond to this reaction. Aromatic primary amines, un-substituted in the para position
interfere and must be removed, if possible, by extraction with acid.
Measure 500 mL of sample into a beaker.Lower the pH to approximately 4.0 with 85%
phosphoric acid. If the sample was already preserved using phosphoric acid, omit the
addition of phosphoric acid again. Transfer to the distillation apparatus made up of glass,
consisting of a 1 L borosilicate glass distilling apparatus.
Distil 450 mL of sample and stop the distillation. When boiling ceases, add 50 mL of warm
distilled water to the distilling flask and resume distillation until 500 mL have been
collected. If the distillate is turbid, filter through a pre-washed membrane filter.
Add 2.5 mL of 0.5 N ammonium hydroxide solutions and adjust to pH 7.9 + 0.1 with
phosphate buffer. Add 1.0 mL of 4-aminoantipyrine solution, mix well, add 1 mL of
potassium ferricyanide solution and mix well. Let it stand for 15 minutes. Read absorbance
of sample and standards against the blank at 460 nm.
Prepare a standard curve by plotting the absorbance values of standards versus
corresponding phenol concentrations.
Calculation:
Phenol, mg/L = Factor as per graph x Absorbance

90
(xi) Oil and Grease:-
There are several standard methods for determination of oil and grease for industrial
wastewaters, but each method has its limitation. The partition-gravimetric method is
speedy and the most suitable for analysis14.
500 mL of water sample is taken in a separator funnel and acidified with hydrochloric acid
to a pH of about 1.0 to release the free fatty acids. The fatty acids occur principally in a
precipitated form as calcium and magnesium soaps. The reaction involved is as follows:
Ca(C17H35 COO)2+ 2 H+2C17H35COOH + Ca+2
The high-molecular-weight fatty acids released are relatively insoluble in water and are
extracted from the sample by using 25 mL of the solvent hexane. The hexane layer is then
filtered through a filter paper containing sodium sulphate, to remove moisture. The filtrate
is collected into a clean and dry beaker of 50 mL capacity, which has already been weighed.
The filtrate in beaker is evaporated to dryness on a hot-plate maintained at a temperature of
100 oC. The beaker was cooled in a desiccator at room temperature and then weighed.
Calculation:-
Oil & grease (mg/L) = (A-B) x 1000 x 1000
Volume of sample
Where,
A= weight of beaker in gm after cooling
B= weight of empty beaker in gm.
2.3 Result and Discussion
2.3.1 Quality Of Wastewater Sample
Wastewater samples were collected from equalization tanks of selected industries. Each
sample was analyzed for the parameters listed in Table 2.2.3to check its pollution load.
Initially the samples collected from each industry were analyzed separately for the
parameters mentioned in Table 2.2.3. After studying the variation in each parameter for
different industry it was decided to collect wastewater 3 times a year during year 2010 and
each time a combined wastewater sample was prepared by mixing individual wastewater
samples in a calculated ratio to prepare representative combined wastewater sample of 10
91
L. The mixing ratio was decided as mentioned in Table 2.2.2. The results of analysis for
various parameters for individual industries wastewater are tabulated in below Table 2.3.1.
The general standards for discharge of environmental pollutants enforced by the Gujarat
Pollution Control Board (GPCB) is also mentioned in Table 2.3.1, as GPCB discharge
norms.
Parameter wise graphical representations of all results are provided in Figure 2.3.1 to
2.3.12.
92
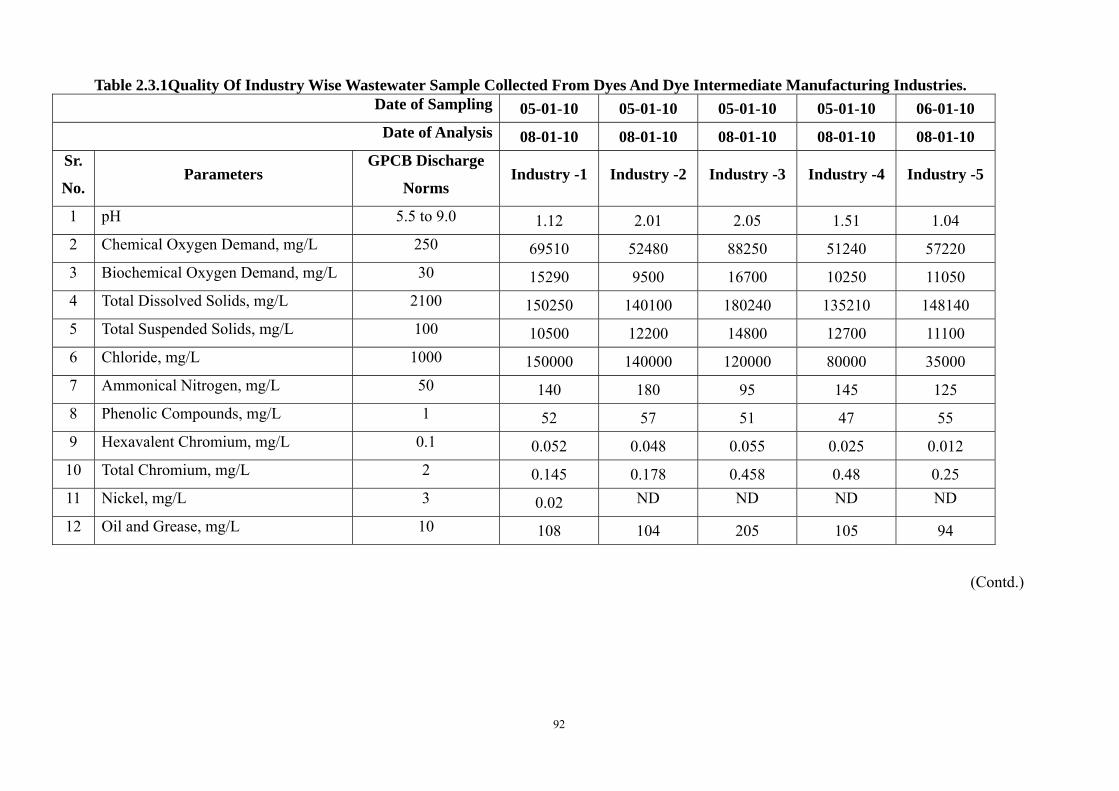
Table 2.3.1Quality Of Industry Wise Wastewater Sample Collected From Dyes And Dye Intermediate Manufacturing Industries. Date of Sampling 05-01-10 05-01-10 05-01-10 05-01-10 06-01-10
Date of Analysis 08-01-10 08-01-10 08-01-10 08-01-10 08-01-10
Sr.
No. Parameters
GPCB Discharge
Norms Industry -1 Industry -2 Industry -3 Industry -4 Industry -5
1 pH 5.5 to 9.0 1.12 2.01 2.05 1.51 1.04
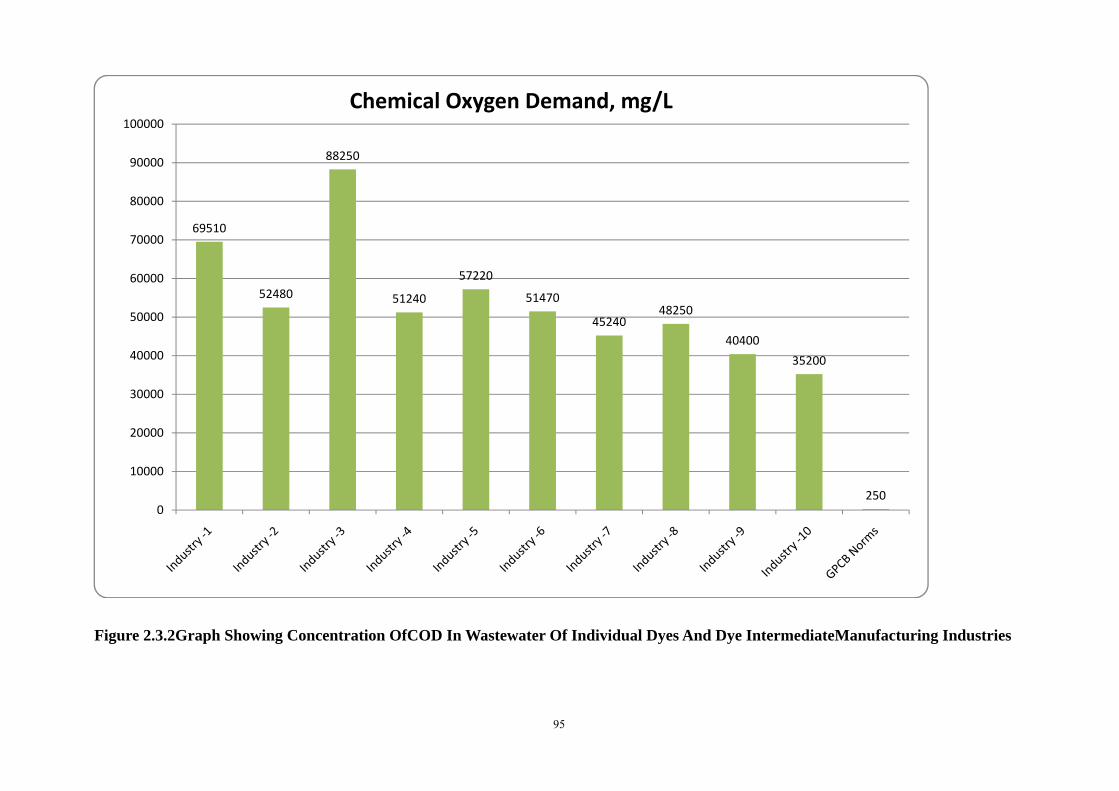
2 Chemical Oxygen Demand, mg/L 250 69510 52480 88250 51240 57220
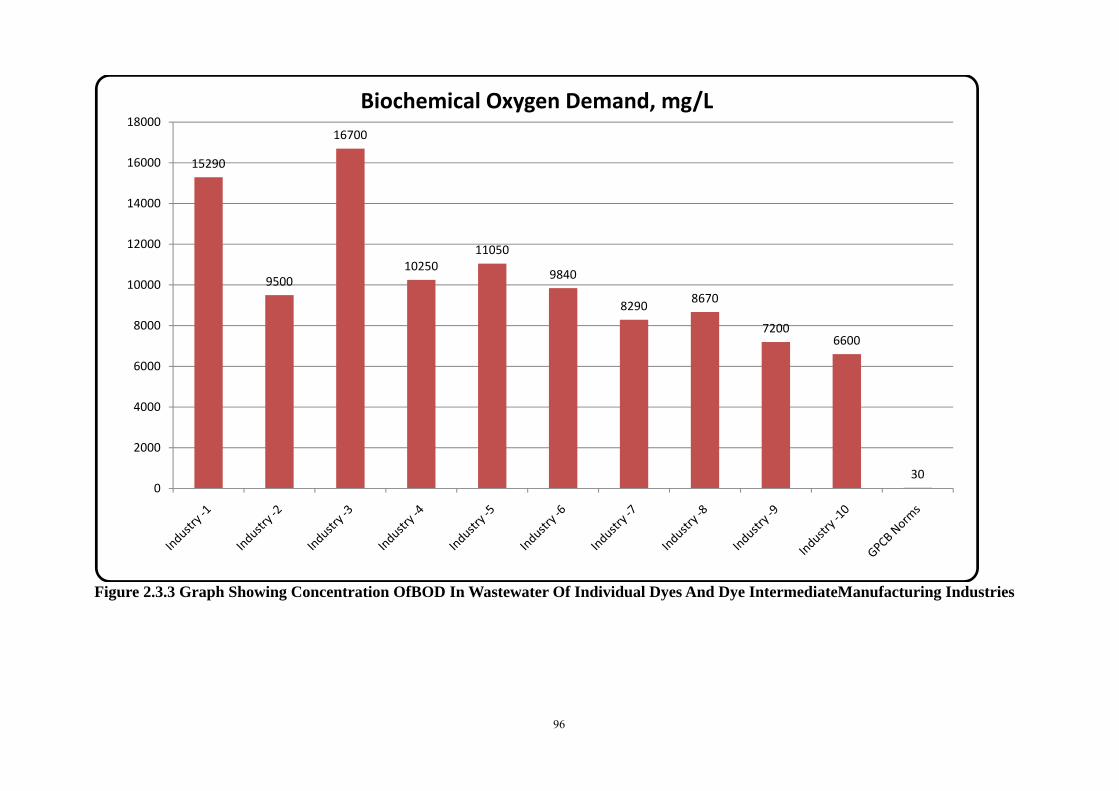
3 Biochemical Oxygen Demand, mg/L 30 15290 9500 16700 10250 11050
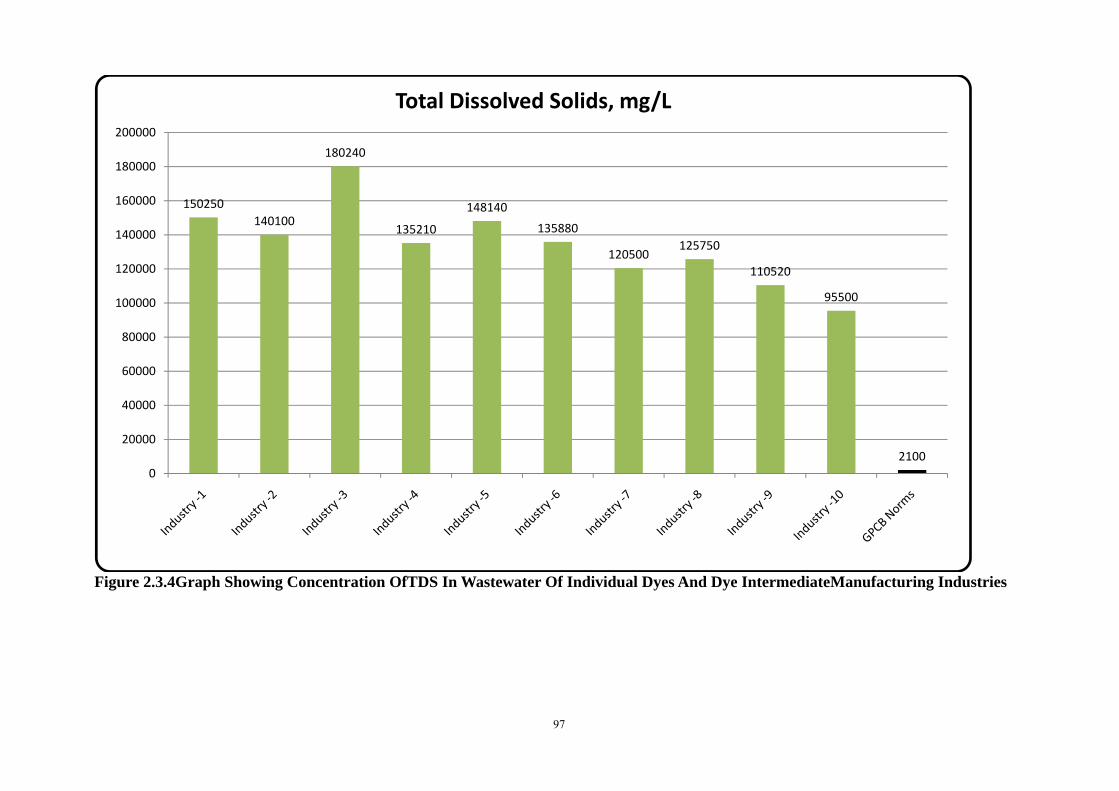
4 Total Dissolved Solids, mg/L 2100 150250 140100 180240 135210 148140
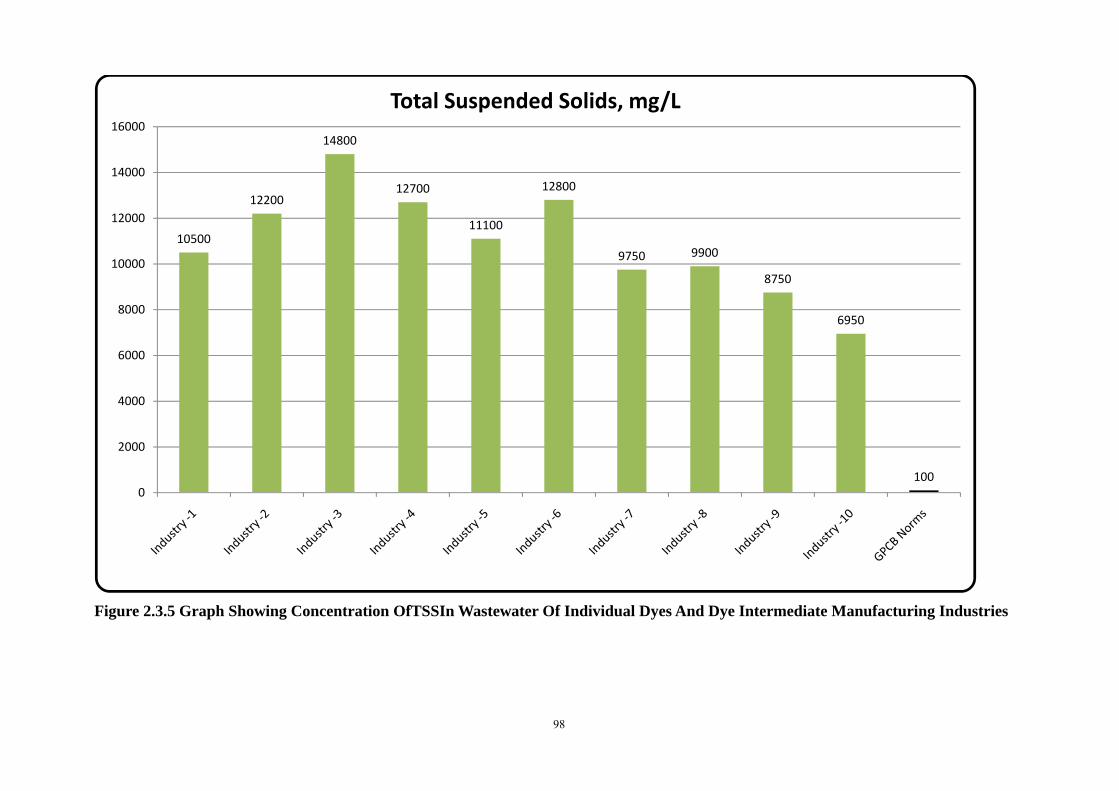
5 Total Suspended Solids, mg/L 100 10500 12200 14800 12700 11100
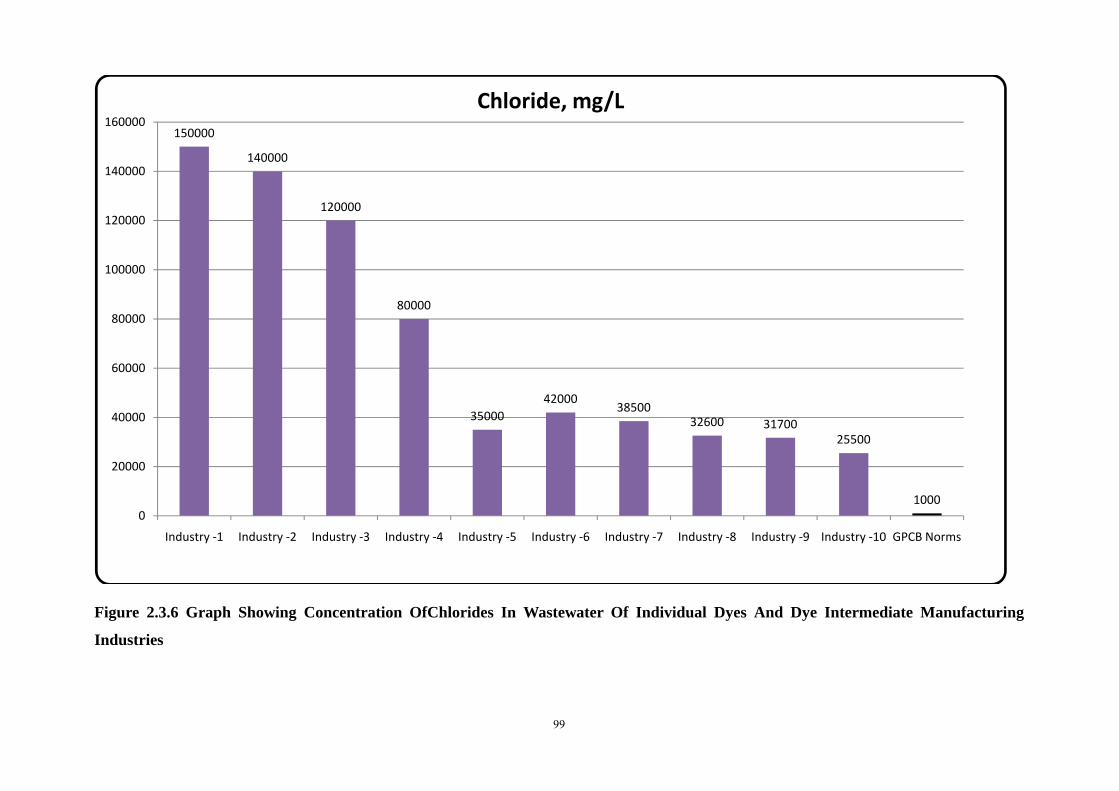
6 Chloride, mg/L 1000 150000 140000 120000 80000 35000
7 Ammonical Nitrogen, mg/L 50 140 180 95 145 125
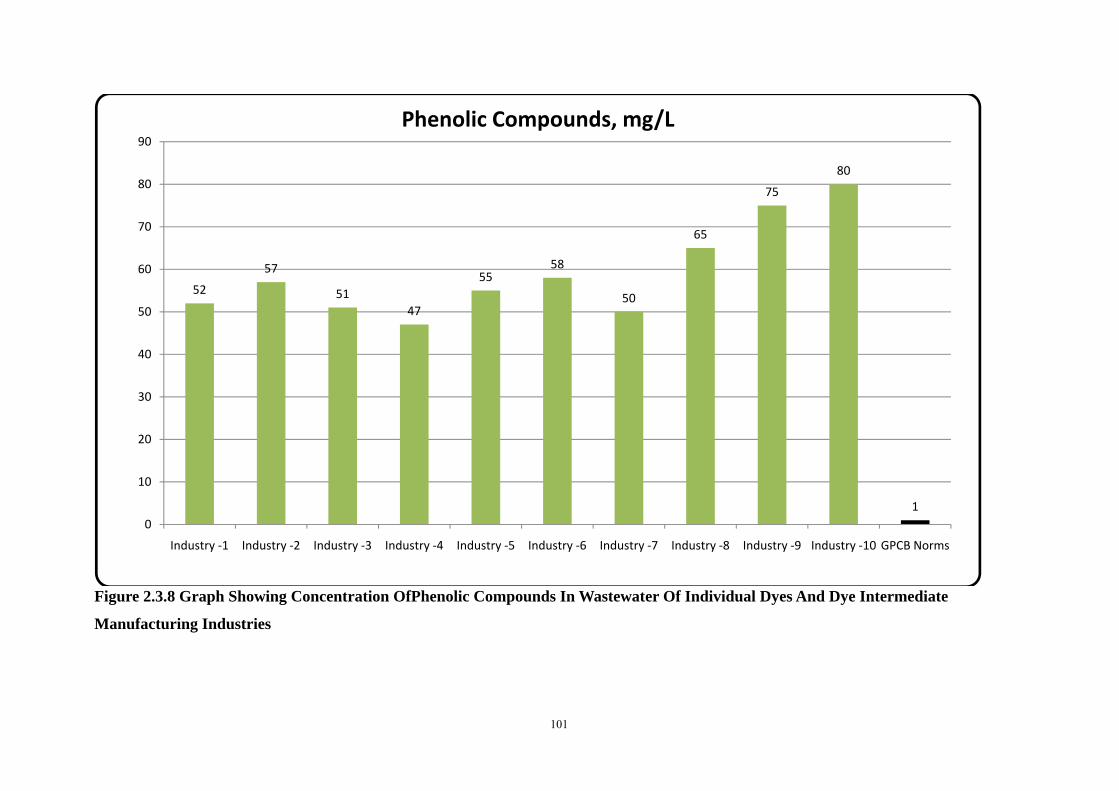
8 Phenolic Compounds, mg/L 1 52 57 51 47 55
9 Hexavalent Chromium, mg/L 0.1 0.052 0.048 0.055 0.025 0.012
10 Total Chromium, mg/L 2 0.145 0.178 0.458 0.48 0.25
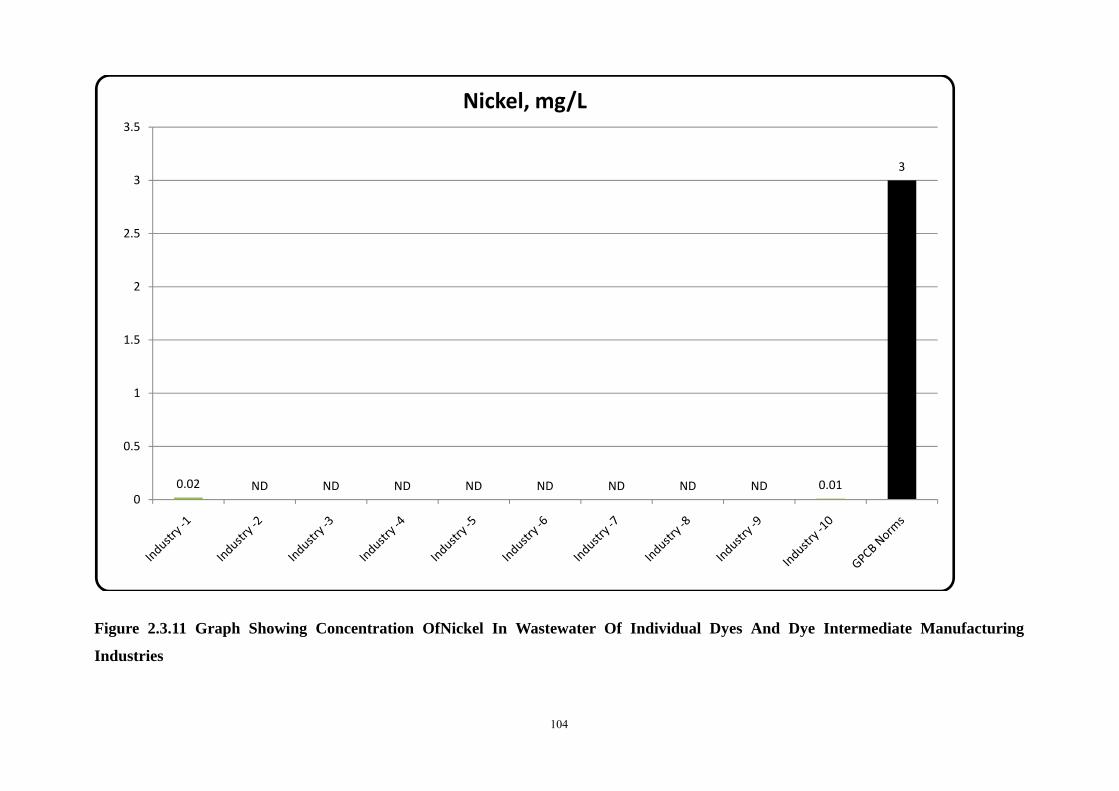
11 Nickel, mg/L 3 0.02 ND ND ND ND
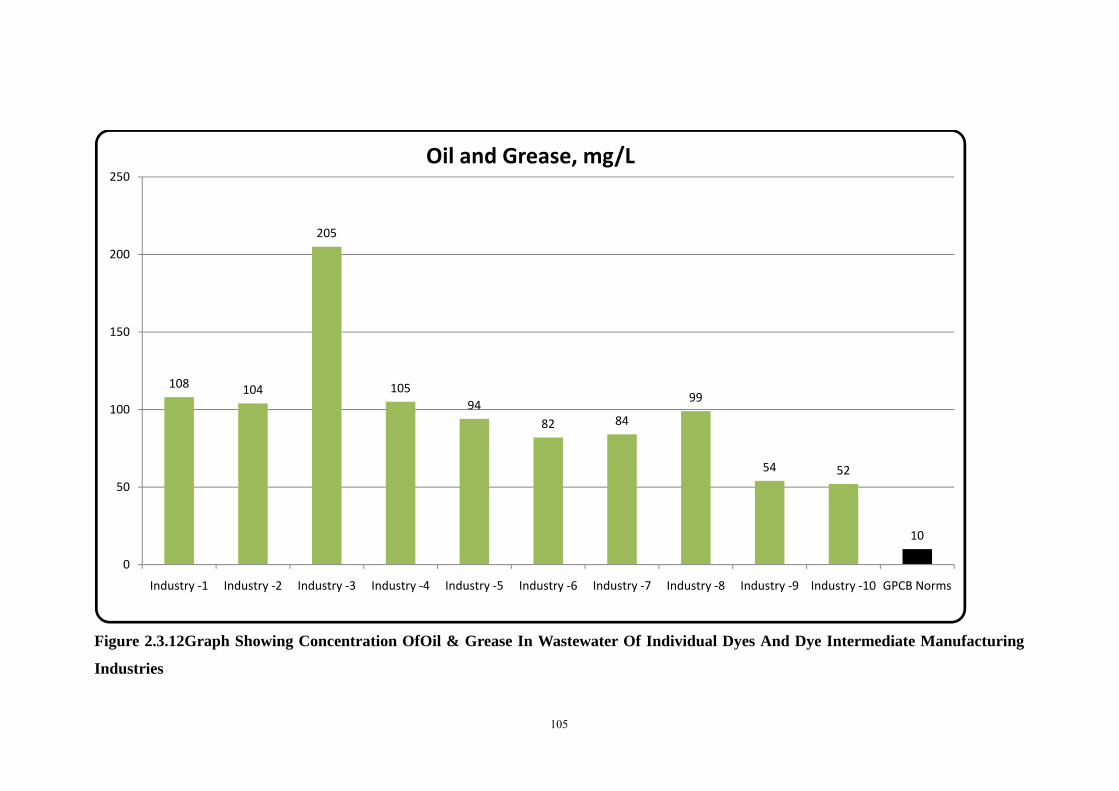
12 Oil and Grease, mg/L 10 108 104 205 105 94
(Contd.)
93
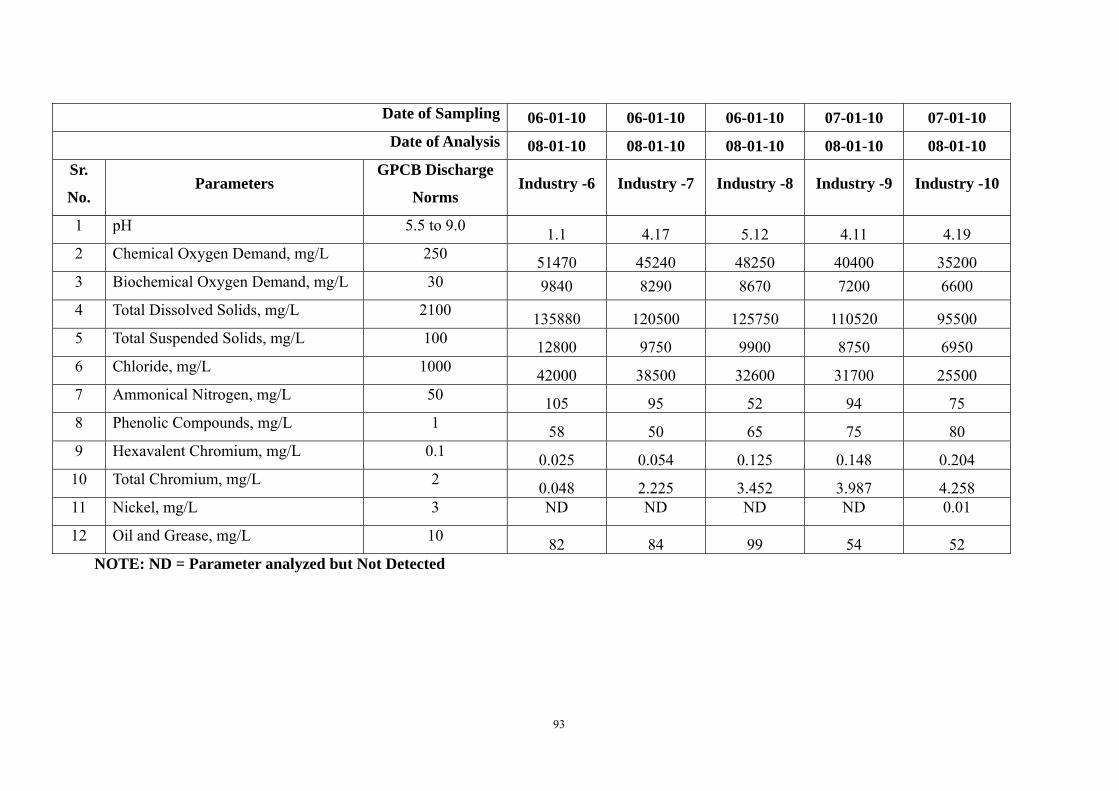
Date of Sampling 06-01-10 06-01-10 06-01-10 07-01-10 07-01-10
Date of Analysis 08-01-10 08-01-10 08-01-10 08-01-10 08-01-10
Sr.
No. Parameters
GPCB Discharge
Norms Industry -6 Industry -7 Industry -8 Industry -9 Industry -10
1 pH 5.5 to 9.0 1.1 4.17 5.12 4.11 4.19
2 Chemical Oxygen Demand, mg/L 250 51470 45240 48250 40400 35200
3 Biochemical Oxygen Demand, mg/L 30 9840 8290 8670 7200 6600
4 Total Dissolved Solids, mg/L 2100 135880 120500 125750 110520 95500
5 Total Suspended Solids, mg/L 100 12800 9750 9900 8750 6950
6 Chloride, mg/L 1000 42000 38500 32600 31700 25500
7 Ammonical Nitrogen, mg/L 50 105 95 52 94 75
8 Phenolic Compounds, mg/L 1 58 50 65 75 80
9 Hexavalent Chromium, mg/L 0.1 0.025 0.054 0.125 0.148 0.204
10 Total Chromium, mg/L 2 0.048 2.225 3.452 3.987 4.258
11 Nickel, mg/L 3 ND ND ND ND 0.01
12 Oil and Grease, mg/L 10 82 84 99 54 52
NOTE: ND = Parameter analyzed but Not Detected
94
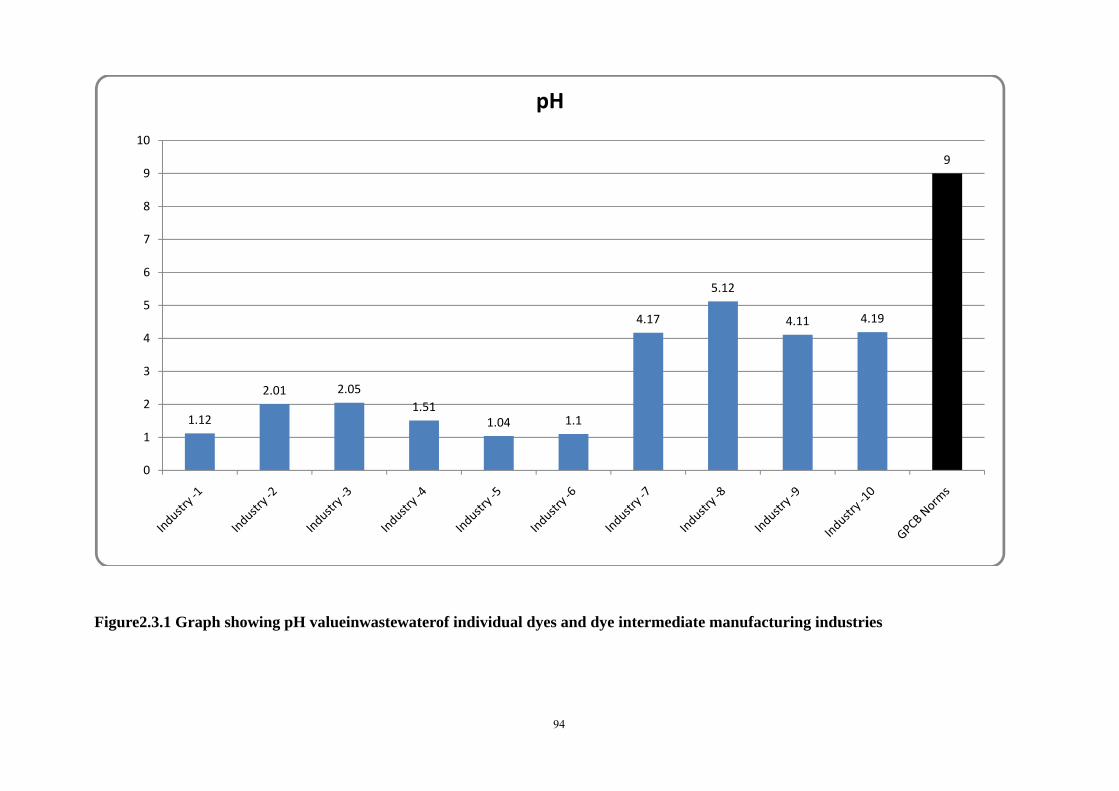
Figure2.3.1 Graph showing pH valueinwastewaterof individual dyes and dye intermediate manufacturing industries
1.12
2.01 2.051.51
1.04 1.1
4.17
5.12
4.11 4.19
9
0
1
2
3
4
5
6
7
8
9
10
pH
95
Figure 2.3.2Graph Showing Concentration OfCOD In Wastewater Of Individual Dyes And Dye IntermediateManufacturing Industries
69510
52480
88250
51240
57220
51470
4524048250
40400
35200
2500
10000
20000
30000
40000
50000
60000
70000
80000
90000
100000
Chemical Oxygen Demand, mg/L
96
Figure 2.3.3 Graph Showing Concentration OfBOD In Wastewater Of Individual Dyes And Dye IntermediateManufacturing Industries
15290
9500
16700
1025011050
9840
82908670
72006600
300
2000
4000
6000
8000
10000
12000
14000
16000
18000Biochemical Oxygen Demand, mg/L
97
Figure 2.3.4Graph Showing Concentration OfTDS In Wastewater Of Individual Dyes And Dye IntermediateManufacturing Industries
150250140100
180240
135210
148140
135880
120500125750
110520
95500
21000
20000
40000
60000
80000
100000
120000
140000
160000
180000
200000
Total Dissolved Solids, mg/L
98
Figure 2.3.5 Graph Showing Concentration OfTSSIn Wastewater Of Individual Dyes And Dye Intermediate Manufacturing Industries
10500
12200
14800
12700
11100
12800
9750 9900
8750
6950
1000
2000
4000
6000
8000
10000
12000
14000
16000
Total Suspended Solids, mg/L
99
Figure 2.3.6 Graph Showing Concentration OfChlorides In Wastewater Of Individual Dyes And Dye Intermediate Manufacturing
Industries
150000
140000
120000
80000
3500042000
3850032600 31700
25500
10000
20000
40000
60000
80000
100000
120000
140000
160000
Industry ‐1 Industry ‐2 Industry ‐3 Industry ‐4 Industry ‐5 Industry ‐6 Industry ‐7 Industry ‐8 Industry ‐9 Industry ‐10 GPCB Norms
Chloride, mg/L

100
Figure 2.3.7 Graph Showing Concentration OfAmmoniacal Nitrogen In Wastewater Of Individual Dyes And Dye Intermediate
Manufacturing Industries
140
180
95
145
125
10595
52
94
75
50
0
20
40
60
80
100
120
140
160
180
200Ammoniacal Nitrogen, mg/L
101
Figure 2.3.8 Graph Showing Concentration OfPhenolic Compounds In Wastewater Of Individual Dyes And Dye Intermediate
Manufacturing Industries
52
57
5147
5558
50
65
75
80
10
10
20
30
40
50
60
70
80
90
Industry ‐1 Industry ‐2 Industry ‐3 Industry ‐4 Industry ‐5 Industry ‐6 Industry ‐7 Industry ‐8 Industry ‐9 Industry ‐10 GPCB Norms
Phenolic Compounds, mg/L

102
Figure 2.3.9Graph Showing Concentration OfHexavalent Chromium In Wastewater Of Individual Dyes And Dye Intermediate
Manufacturing Industries
0.052 0.0480.055
0.025
0.012
0.025
0.054
0.125
0.148
0.204
0.1
0
0.05
0.1
0.15
0.2
0.25
Hexavalent Chromium, mg/L

103
Figure 2.3.10Graph Showing Concentration OfTotal Chromium In Wastewater Of Individual Dyes And Dye Intermediate
Manufacturing Industries
0.145 0.178
0.458 0.48
0.250.048
2.225
3.452
3.987
4.258
2
0
0.5
1
1.5
2
2.5
3
3.5
4
4.5
Industry ‐1 Industry ‐2 Industry ‐3 Industry ‐4 Industry ‐5 Industry ‐6 Industry ‐7 Industry ‐8 Industry ‐9 Industry ‐10 GPCB Norms
Total Chromium, mg/L
104
Figure 2.3.11 Graph Showing Concentration OfNickel In Wastewater Of Individual Dyes And Dye Intermediate Manufacturing
Industries
0.02 ND ND ND ND ND ND ND ND 0.01
3
0
0.5
1
1.5
2
2.5
3
3.5
Nickel, mg/L
105
Figure 2.3.12Graph Showing Concentration OfOil & Grease In Wastewater Of Individual Dyes And Dye Intermediate Manufacturing
Industries
108 104
205
10594
82 84
99
54 52
10
0
50
100
150
200
250
Industry ‐1 Industry ‐2 Industry ‐3 Industry ‐4 Industry ‐5 Industry ‐6 Industry ‐7 Industry ‐8 Industry ‐9 Industry ‐10 GPCB Norms
Oil and Grease, mg/L
106
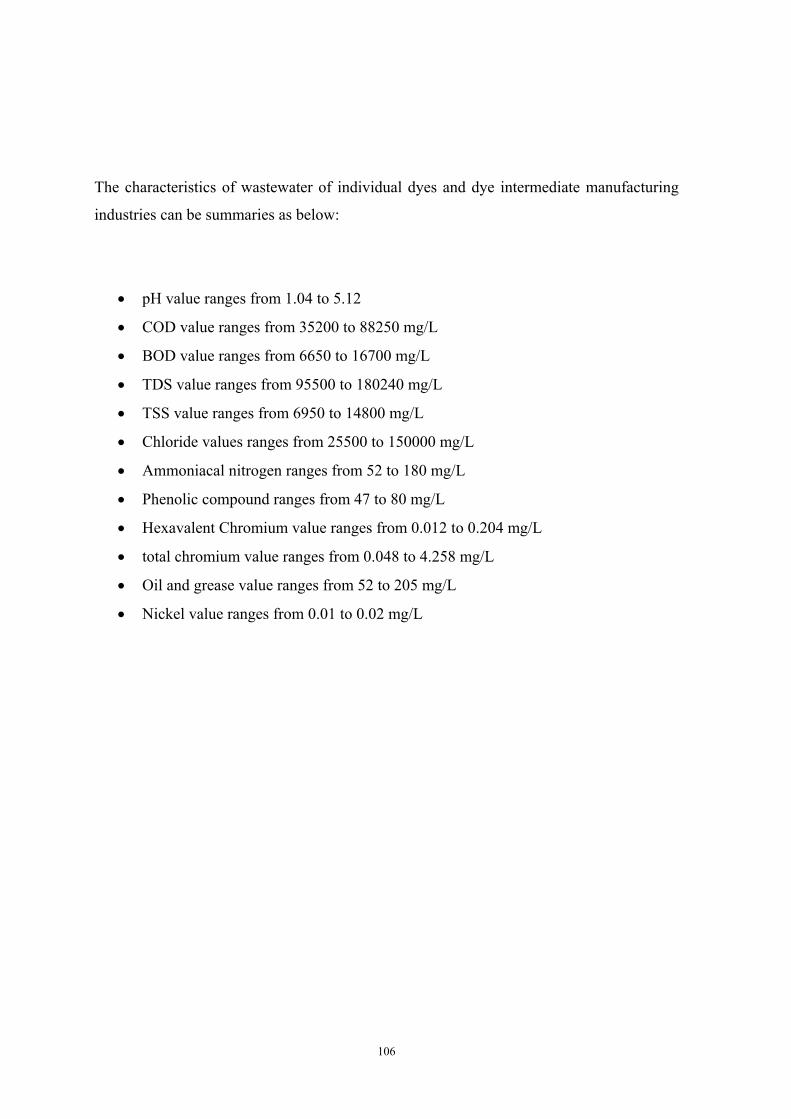
The characteristics of wastewater of individual dyes and dye intermediate manufacturing
industries can be summaries as below:
pH value ranges from 1.04 to 5.12
COD value ranges from 35200 to 88250 mg/L
BOD value ranges from 6650 to 16700 mg/L
TDS value ranges from 95500 to 180240 mg/L
TSS value ranges from 6950 to 14800 mg/L
Chloride values ranges from 25500 to 150000 mg/L
Ammoniacal nitrogen ranges from 52 to 180 mg/L
Phenolic compound ranges from 47 to 80 mg/L
Hexavalent Chromium value ranges from 0.012 to 0.204 mg/L
total chromium value ranges from 0.048 to 4.258 mg/L
Oil and grease value ranges from 52 to 205 mg/L
Nickel value ranges from 0.01 to 0.02 mg/L
107
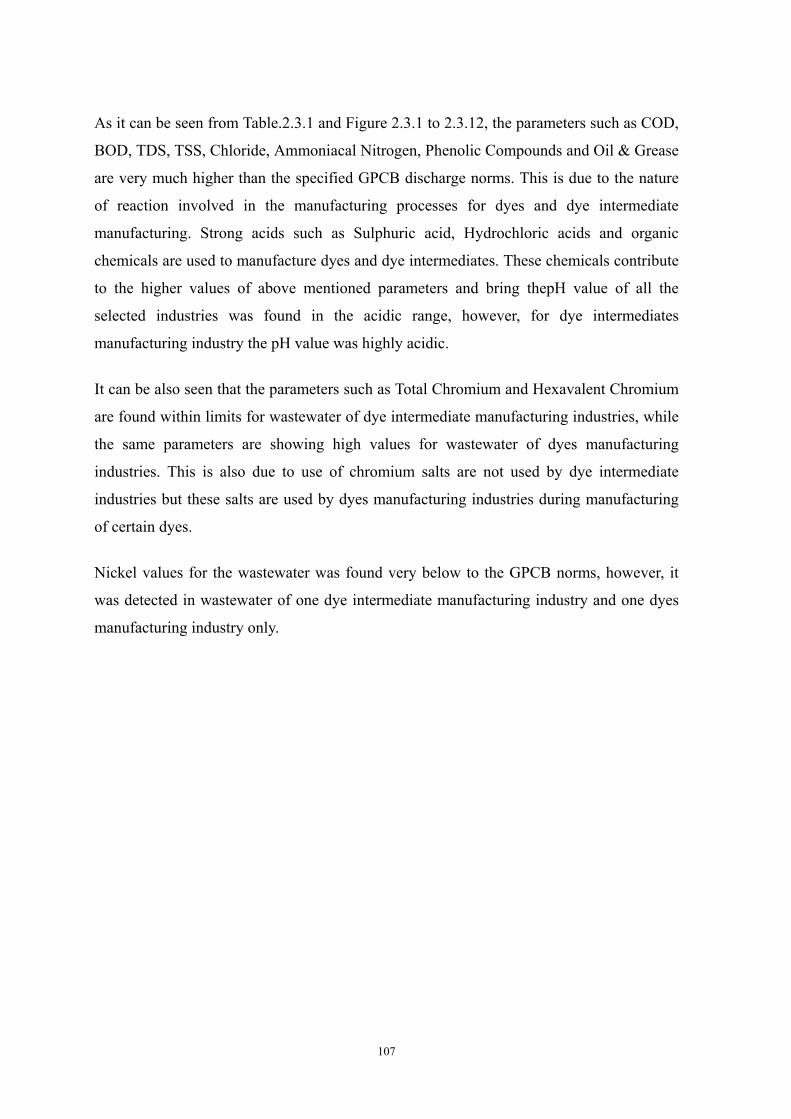
As it can be seen from Table.2.3.1 and Figure 2.3.1 to 2.3.12, the parameters such as COD,
BOD, TDS, TSS, Chloride, Ammoniacal Nitrogen, Phenolic Compounds and Oil & Grease
are very much higher than the specified GPCB discharge norms. This is due to the nature
of reaction involved in the manufacturing processes for dyes and dye intermediate
manufacturing. Strong acids such as Sulphuric acid, Hydrochloric acids and organic
chemicals are used to manufacture dyes and dye intermediates. These chemicals contribute
to the higher values of above mentioned parameters and bring thepH value of all the
selected industries was found in the acidic range, however, for dye intermediates
manufacturing industry the pH value was highly acidic.
It can be also seen that the parameters such as Total Chromium and Hexavalent Chromium
are found within limits for wastewater of dye intermediate manufacturing industries, while
the same parameters are showing high values for wastewater of dyes manufacturing
industries. This is also due to use of chromium salts are not used by dye intermediate
industries but these salts are used by dyes manufacturing industries during manufacturing
of certain dyes.
Nickel values for the wastewater was found very below to the GPCB norms, however, it
was detected in wastewater of one dye intermediate manufacturing industry and one dyes
manufacturing industry only.
108
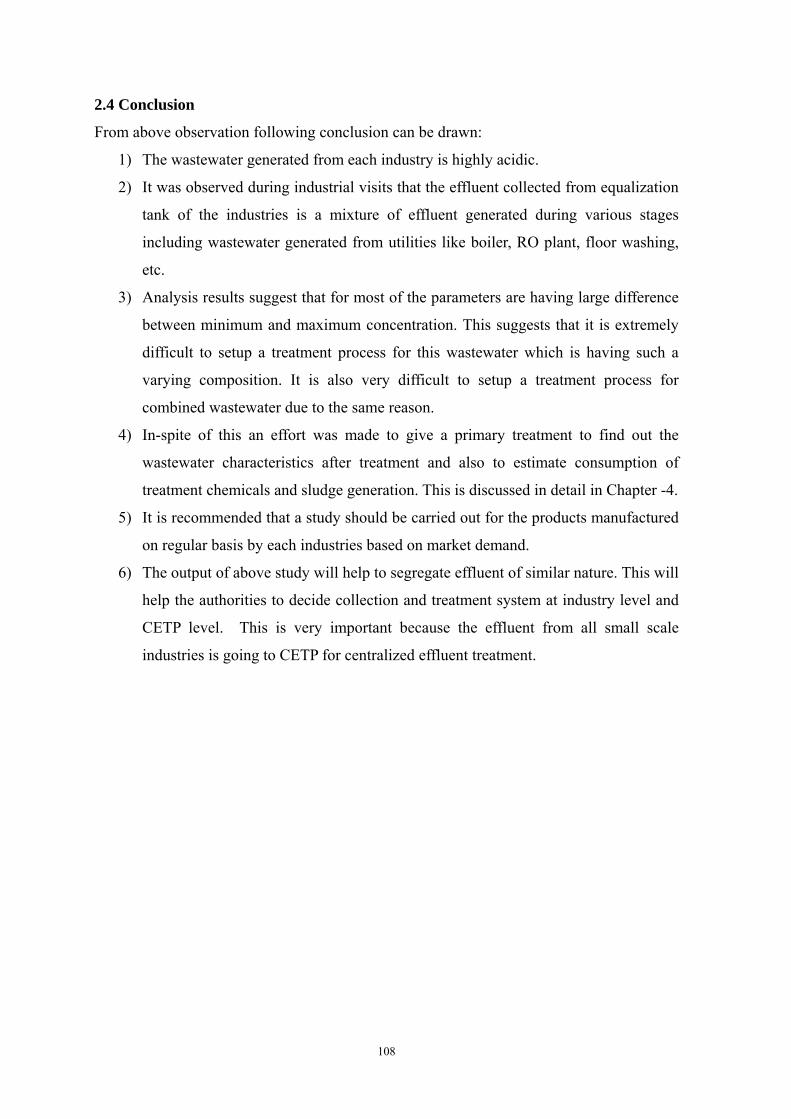
2.4 Conclusion
From above observation following conclusion can be drawn:
1) The wastewater generated from each industry is highly acidic.
2) It was observed during industrial visits that the effluent collected from equalization
tank of the industries is a mixture of effluent generated during various stages
including wastewater generated from utilities like boiler, RO plant, floor washing,
etc.
3) Analysis results suggest that for most of the parameters are having large difference
between minimum and maximum concentration. This suggests that it is extremely
difficult to setup a treatment process for this wastewater which is having such a
varying composition. It is also very difficult to setup a treatment process for
combined wastewater due to the same reason.
4) In-spite of this an effort was made to give a primary treatment to find out the
wastewater characteristics after treatment and also to estimate consumption of
treatment chemicals and sludge generation. This is discussed in detail in Chapter -4.
5) It is recommended that a study should be carried out for the products manufactured
on regular basis by each industries based on market demand.
6) The output of above study will help to segregate effluent of similar nature. This will
help the authorities to decide collection and treatment system at industry level and
CETP level. This is very important because the effluent from all small scale
industries is going to CETP for centralized effluent treatment.

109
References
1. E.N.Abrahart. Dyes and their Intermediates. New York: Chemical Publishing. 1–12
(1977).
2. R.L.M. Allen, Colour Chemistry. London: Thomas Nelson and Sons Ltd. 11–13
(1971).
3. Indian Standard, Methods Of Sampling And Test (Physical And Chemical) For Water
And Wastewater, IS-3025, Part-1 Sampling (1987).
4. Indian Standard, Methods Of Sampling And Test (Physical And Chemical) For Water
And Wastewater, IS-3025, Part-58 Chemical Oxygen Demand (COD) (2006).
5. Indian Standard, Methods Of Sampling And Test (Physical And Chemical) For Water
And Wastewater, IS-3025, Part-44 Biochemical Oxygen Demand (BOD) (1993).
6. Indian Standard, Methods Of Sampling And Test (Physical And Chemical) For Water
And Wastewater, IS-3025, Part-17 Non-Filterable Residue (Total Suspended Solids),
(2002).
7. Indian Standard, Methods Of Sampling And Test (Physical And Chemical) For Water
And Wastewater, IS-3025, Part-16 Filterable Residue (Total Dissolved Solids)
(2002).
8. D.A. Skoog, D.M. West, Fundamental of Analytical Chemistry, CBS College
Publishing, Japan, 4th Edition (1982)
9. S.L Chopra, J.S. Kanwar, Analytical Agricultural Chemistry, Kalyani Publishers,
New Delhi (1982)
10. Indian Standard, Methods Of Sampling And Test (Physical And Chemical) For
Water And Wastewater, IS-3025, Part-34 Nitrogen, (2003).
11. Indian Standard, Methods Of Sampling And Test (Physical And Chemical) For
Water And Wastewater, IS-3025, Part-52 Chromium (2003).
12. Indian Standard, Methods Of Sampling And Test (Physical And Chemical) For
Water And Wastewater, IS-3025, Part-54 Nickel (2003).
13. Indian Standard, Methods Of Sampling And Test (Physical And Chemical) For
Water And Wastewater, IS-3025, Part-43 Phenols (1992).
14. Indian Standard, Methods Of Sampling And Test (Physical And Chemical) For
Water And Wastewater, IS-3025, Part-39 Oil & Grease (2003).