chapter 131 chapter 13: weaving, merging, and diverging movements on freeways and multilane highways...
TRANSCRIPT

Chapter 13 1
Chapter 13: Weaving, Merging, and Diverging Movements on Freeways and
Multilane Highways
Describe the three weaving area configurations Describe the merge and diverge influence areas Become familiar with the steps of conducting weaving area
analysis Become familiar with the steps of conducting merge/diverge
area analysis Conduct these analyses manually and by HCS+ Know the limitations of these models
Chapter objectives: By the end of these chapters the student will be able to:

Chapter 13 2
I-215 and 21st South, SLC

Chapter 13 3
13.1 Turbulence areas on freeways and multilane highways
Turbulence as characterized by the additional lane-changing these maneuvers cause: i.e. you must make at least one lane change.
Other elements: the need for greater vigilance on the part of the driver, more frequent changes in speed, and average speeds that may be somewhat lower than on similar basic sections.
The maximum length over which weaving movements are defined is 2,500 ft. Beyond that, analyze as separate ramps.
The maximum length over which merging and diverging movements are defined is 1,500 ft.

Chapter 13 4
13.2 Level-of-service criteria
Just like the basic section, density is used as MOE.
For weaving areas, the density reflects an average for all vehicles across all lanes of the segment between the entry and exit points of the segment.
For merge and diverge areas, densities reflect the “merge/diverge influence area which consists of lanes 1 and 2 (right & next-to-right lane) and the acceleration or deceleration lane 1,500 ft upstream of a diverge or downstream of a merge.

Chapter 13 5LOS Basic Fwy Segment
Compare the upper boundaries of the LOSs between Basic Freeway Segments and Weaving/Merging/Diverging Segments.

Chapter 13 6
13.3 A common point: converting demand volumes to flow rates
Both procedures rely on algorithms stated in terms of demand flow rates in passenger car units for base conditions.
pHV
ii ffPHF
Vv
**
We have seen the definitions of these terms in Chapter 12.
Heavy vehicle and driver population factors are the same ones used for basic freeway and multilane highway segments in Chapter 12.
Make sure you read the introductory section of 13.4 for the history of the weaving analysis method.

Chapter 13 7
13.4 Analysis of weaving areas
13.4.1 Flows in a weaving area
Weaving flows (pc/hr) vs. Non-weaving flows (pc/hr)
ww
w
nww
oonw
www
vvR
vvVR
vvv
vvv
vvv
2
21
21
VR = Volume Ratio
R = Weaving Ratio
Subscript 1 means the larger flow; subscript 2 means the smaller flow of the two. w is weaving flow, o is outer non-weaving flow.

Chapter 13 8
13.4.2 Critical geometric variables
Three influential variablesLane configuration
Length of the weaving area, ft
Width (number of lanes) in the weaving area
Configuration
No. of required lane-changes for:
Primary weaving movement
Secondary weaving movement
Type A
Type B
Type C
1
0
0
1
1
>= 2
The HCM models for these were calibrated. The others are approximate.
Read the top paragraph of the left column of p.343 about the number of lane changes that must be made..
Lane balance: entry lanes n, exit lanes n+1

Chapter 13 9
Length of the weaving area & Width of a weaving area and type of operation
The intensity of lane change is affected by the length of the weaving area. Shorter length – more lane changes occur in a more crammed situation.
Nw = number of lanes weaving vehicles must occupy to achieve balanced equilibrium operation with non-weaving vehicles
Nw(max) = Max number of lanes that can be occupied by weaving vehicles in a given configuration
Unconstrained operation when Nw <= Nw(max)
Constrained operation when Nw > Nw(max)

Chapter 13 10
13.4.3 Computational procedures for weaving area analysis
1. Specify all traffic and geometric conditions for the site
2. Convert all component demand volumes to peak flow rates in pc/h under equivalent base conditions (eq. 13-1)
3. Assume that operations are unconstrained, and estimate the resulting speed of weaving and non-weaving vehicles in the weaving area (eq. 13-2 and 13-3)
4. Using the results of Step 3, determine whether actual operations are unconstrained or constrained. If they are constrained, re-estimate the speed of weaving and non-weaving vehicles assuming the constrained result. (see Table 13.4)
5. Compute the weighted average speed and density for all vehicles in the weaving area (eq. 13-5)
6. Determine level of service from the estimated density in the weaving area (eq. 13-6)
7. Check input variables against limitations of the methodology (Table 13.5)
8. Determine the capacity of the weaving section (Appendix I)
See Fig 13.7.

Chapter 13 11
Equations
SN
vD
S
v
S
v
S
vv
S
v
S
v
vvS
LN
vVRaW
W
FFS
W
SSSS
ffPHF
Vv
w
w
nw
nwwnw
w
w
nw
nw
wnw
d
cb
i
iii
pHV
ii
1
1
1015
1minmax
min
Eq. 13-1
Eq. 13-2 &13-3
Eq. 13-4, read about the logic of the model, p.346 right column.
Eq. 13-5
Eq. 13-6
This is how Eq. 13-5 is derived; all terms show densities. Total density is a sum total of density of non-weaving and weaving vehicles.

Chapter 13 12
Example 13.1 Analysis of a ramp-weave area
We will walk through this example to learn how the weaving analysis is done. (13.4.3)

Chapter 13 13
13.5 Analysis of merge and diverge areas
The analysis procedures focus on the merge or diverge influence area that encompasses lanes 1 and 2 (shoulder and adjacent) freeway lanes and the acceleration lane for a distance of 1,500 ft upstream of a diverge or 1,500 downstream of a merge area.
Merge area:
Diverge area:
FMF Pvv 12
FDRFR Pvvvv 12

Chapter 13 14
Measuring the Length of Acceleration and Deceleration Lanes
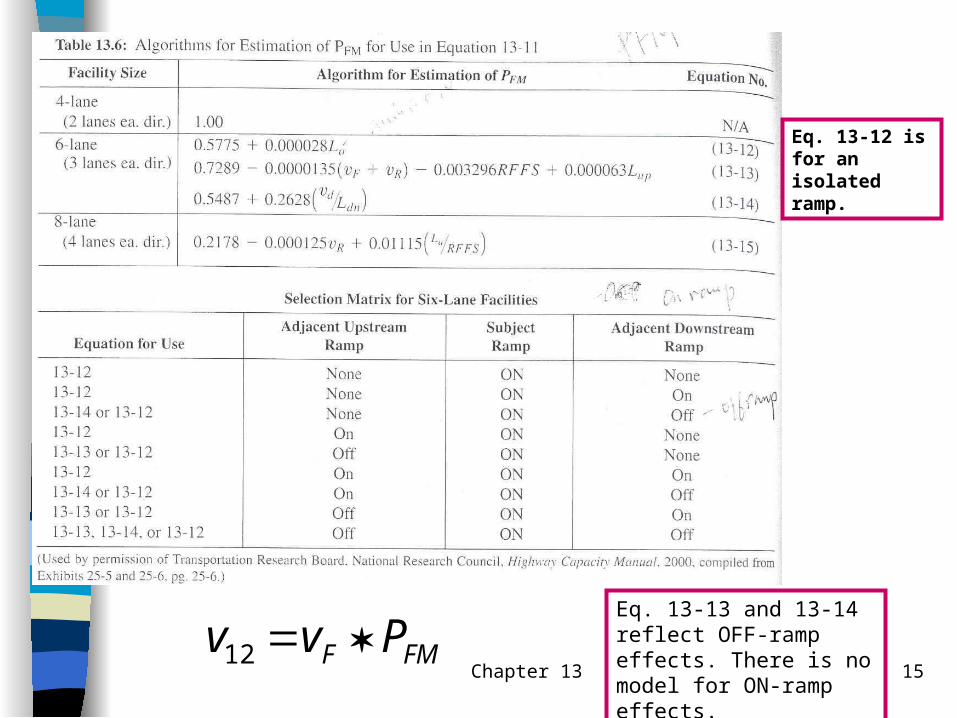
Chapter 13 15FMF Pvv 12
Eq. 13-13 and 13-14 reflect OFF-ramp effects. There is no model for ON-ramp effects.
Eq. 13-12 is for an isolated ramp.

Chapter 13 16
Isolated ramp or not?
403,232.52444.0214.0 RFFSLvvL aRFEQ
for upstream off ramp
for downstream off ramp
a
dEQ L
vL
000107.01096.0
If Lup ≥ LEQ, the subject ramp may be considered to be isolated. Use eq. 13-12. Otherwise, use eq. 13-13.
If Ldn ≥ LEQ, the subject ramp may be considered to be isolated. Use eq. 13-112. Otherwise, use eq. 13-14.

Chapter 13 17 FDRFR Pvvvv 12
Eq. 13-20 reflects on-ramp effects and 13-21 reflects off-ramp effects. There is no algorithms for the effects of adjacent upstream off-ramps or adjacent downstream on-ramps on six-lane facilities.
Eq. 13-19 is for an isolated ramp.

Chapter 13 18
Isolated ramp or not?
RF
uEQ vv
vL
000076.0000023.0071.0
for upstream on ramp
for downstream off ramp
RF
dEQ vv
vL
000369.0000032.015.1
If Lup ≥ LEQ, the subject ramp may be considered to be isolated. Use eq. 13-19. Otherwise, use eq. 13-20.
If Ldn ≥ LEQ, the subject ramp may be considered to be isolated. Use eq. 13-19. Otherwise, use eq. 13-21.

Chapter 13 19
13.5.1 Structure of the methodology for analysis of merge and diverge areas (See Figure 13.10)
1. Specify all traffic and roadway data for the junction to be analyzed: peak-hour demands, PHF, traffic composition, driver population, and geometric details of the site, including the free-flow speed for the facility and for the ramp.
2. Convert all demand volumes to flow rates in pc/h under equivalent base conditions. (Determine whether the equation for isolated analysis can be used.) i.e., compute vF, vR, and v12.
3. Determine the demand flow in lanes 1 and 2 of the facility immediately upstream of the merge (V12) or diverge junction (V12) using the appropriate algorithm as specified. Table 13.6 (PFM) & Table 13.7 (PFD). Need to check whether the subject ramp is isolated or not first.
4. Determine whether the demand flow exceeds the capacity of any critical element of the junction. (Table 13.8) Where demand exceeds capacity, level of service F is assigned and the analysis is complete. (See the right column of page 358.)
5. If operation is determined to be stable, determine the density (eq. 13-24 for merge and eq. 13-25 for diverge areas) and speed of all vehicles within the ramp influence area. Table 13.9 and 13.10

Chapter 13 20
13.5.4 Determining Density and LOS in the Ramp Influence Area
dR
aRR
LvD
LvvD
009.00086.0252.4
00627.00078.000734.0475.5
12
12
Merge influence area
Diverge influence area
Once Density is calculated, average speeds on ramp influence area, outer lanes, and all lanes will be estimated (section 13.5.5).
Once Density is calculated, average speeds on ramp influence area, outer lanes, and all lanes will be estimated (section 13.5.5).

Chapter 13 21
Example 13.3 Analysis of an isolated on-ramp
We will walk through this example to learn how the merging analysis is done. (13.5.2 – 13.5.5)

Chapter 13 22
Example 13.4 Analysis of a sequence of freeway ramps
We will walk through this example to learn how a sequence of freeway ramps (mix of merging and diverging areas). (13.5.2 – 13.5.5)
Read Appendix II for Special Cases in Merge and diverge Analysis. We do not cover this in this class but keep in mind this topic is discussed in this book as well as in HCM so that you know what to do when you encounter these cases.