chapter 13 monitoring and adaptive management monitoring and adaptive management 13.1 introduction...
TRANSCRIPT
Chapter 13
Monitoring and Adaptive Management


i
Contents
13 MONITORING AND ADAPTIVE MANAGEMENT 13-1
13.1 Introduction 13-1
13.2 Types of Monitoring 13-1 13.2.1 Compliance monitoring 13-1
13.2.1.1 Compliance under the Programmatic Timber Harvest Plan (PTHP) 13-2 13.2.1.2 Non-PTHP compliance monitoring 13-4
13.2.2 Effectiveness and validation monitoring 13-4 13.2.2.1 Conservation measures, contingencies, and definitions subject to change 13-6 13.2.2.2 Objectives and hypotheses 13-9 13.2.2.3 Testing assumptions 13-9 13.2.2.4 Use of statistics in monitoring programs 13-10 13.2.2.5 Spatial scales for monitoring 13-11 13.2.2.6 Elements of a monitoring plan 13-15 13.2.2.7 Monitoring programs subject to harvest levels 13-16
13.3 Adaptive Management 13-20 13.3.1 Inherent uncertainty in conservation effort 13-21 13.3.2 Definitions of adaptive management 13-21 13.3.3 Adaptive approach 13-22 13.3.4 Integration of monitoring and adaptive management 13-23 13.3.5 Conceptual models 13-24 13.3.6 Limits of allowable change 13-25
13.3.6.1 Conservation measures 13-25 13.3.6.2 Contingencies 13-28
13.4 Overview of Aquatic Monitoring 13-28 13.4.1 Watershed analysis within aquatic monitoring 13-31 13.4.2 Focus watershed studies 13-33 13.4.3 Additions and deletions of land 13-34 13.4.4 Long term channel monitoring 13-34 13.4.5 Timeline for aquatic monitoring 13-35
13.5 Monitoring aquatic habitat 13-35 13.5.1 Riparian function 13-38
13.5.1.1 Effectiveness monitoring 13-38 13.5.1.2 Validation monitoring 13-42
13.5.2 Mass wasting 13-46 13.5.2.1 Effectiveness monitoring 13-46 13.5.2.2 Validation monitoring 13-48
13.5.3 Surface erosion 13-48 13.5.3.1 Effectiveness monitoring 13-49 13.5.3.2 Validation monitoring 13-50
13.5.4 Instream sediment 13-50 13.5.4.1 Validation monitoring 13-51
13.5.5 Water drafting 13-55 13.5.5.1 Effectiveness monitoring 13-55 13.5.5.2 Validation monitoring 13-56
13.6 Monitoring covered aquatic species 13-56 13.6.1 Anadromous salmonid monitoring 13-56
13.6.1.1 Effectiveness monitoring 13-57

ii
13.6.1.2 Validation monitoring 13-61 13.6.2 Red-legged frog monitoring (California and northern) 13-63
13.6.2.1 Effectiveness monitoring 13-63 13.6.3 Coastal tailed frog monitoring 13-65
13.6.3.1 Effectiveness monitoring 13-65
13.7 Overview of Terrestrial Monitoring 13-67 13.7.1 Timeline for terrestrial monitoring 13-70
13.8 Monitoring Terrestrial Habitat 13-75 13.8.1 Effectiveness monitoring 13-75 13.8.2 Natural communities 13-81 13.8.3 Invasive species control 13-85
13.9 Monitoring terrestrial species 13-86 13.9.1 Northern spotted owls 13-86
13.9.1.1 Productive and strategic territories 13-86 13.9.1.2 Banding program 13-86 13.9.1.3 Effectiveness monitoring 13-86 13.9.1.4 Validation monitoring 13-88
13.9.2 Marbled murrelet 13-95 13.9.2.1 Effectiveness monitoring 13-95 13.9.2.2 Validation monitoring 13-98
13.9.3 Point arena mountain beaver 13-101 13.9.3.1 Effectiveness monitoring 13-101 13.9.3.2 Validation monitoring 13-104
13.10 Monitoring Rare Plants 13-106 13.10.1 Elements of rare plant strategy 13-106 13.10.2 Implementation of rare plant monitoring 13-107
13.10.2.1 Evaluation of trend 13-108 13.10.2.2 Targeted studies 13-109
13.10.3 Effectiveness monitoring 13-112 13.10.4 Adaptive management 13-119
13.11 Program Structure for Adaptive Management and Monitoring 13-120 13.11.1 Partnerships 13-121
13.12 Reporting Requirements 13-121 13.12.1 Compliance Reporting 13-121 13.12.2 Website and workshops 13-122

iii
List of Tables
Table 13-1 HCP/NCCP Monitoring Programs 13-5 Table 13-2 General Conservation Measures Subject to Change 13-7 Table 13-3 Contingency Subject to Change 13-8 Table 13-4 Definitions Subject to Change 13-8 Table 13-5 Validation Monitoring Programs for Physical Processes 13-9 Table 13-6 Spatial Scales of Effectiveness and Validation Monitoring 13-12 Table 13-7 Monitoring Programs Subject to Harvest Levels 13-17 Table 13-8 Harvest Triggers to Reduce Monitoring 13-20 Table 13-9 Riparian Conservation Measures Subject to Change 13-25 Table 13-10 Terrestrial Conservation Measures Subject to Change 13-27 Table 13-11 Rare Plant Conservation Measures Subject to Change 13-28 Table 13-12 Contingency Measures Subject to Change 13-28 Table 13-13 Aquatic Effectiveness and Validation Monitoring Programs 13-29 Table 13-14 Focus Areas for Aquatic Monitoring 13-34 Table 13-15 Estimated Timeline for Aquatic Monitoring 13-36 Table 13-16 Terrestrial Effectiveness and Validation Monitoring Programs 13-67 Table 13-17 Estimated Timeline for Terrestrial Monitoring 13-71 Table 13-18 Example of a Trend Evaluation 13-108 List of Figures
Figure 13-1 Adaptive Management Process 13-21 Figure 13-2 Continuum of Experimental Management 13-23 Figure 13-3 Adaptive Management Feedback Loop 13-24 Figure 13-4 Programs Contributing Data to Watershed Analysis 13-32 Figure 13-5 Measuring Spatial Extent of Burrow System 13-103


Mendocino Redwood Company HCP/NCCP
13-1
13 MONITORING AND ADAPTIVE MANAGEMENT
13.1 Introduction
Chapter 13 describes how our monitoring and adaptive management program will
Ensure compliance to HCP/NCCP prescriptions.
Assess the status of species and natural communities on MRC covered lands.
Evaluate the effectiveness of our conservation measures in meeting HCP/NCCP
goals and objectives.
Determine if conservation measures need to be changed.
The adaptive management component of the program will determine how MRC collects,
analyzes, and uses information to improve the environmental conditions for covered species and
natural communities within our forestlands. The monitoring component of the program will
evaluate whether our management actions comply with our HCP/NCCP and yield the expected
benefits. Both management and monitoring must adapt to change—in the environment, in
scientific research, and in technological advances—as MRC learns to improve our conservation
efforts and the relevance of our data collection.
13.2 Types of Monitoring
Recent guidelines for regional conservation planning define monitoring as the ―systematic and
usually repetitive collection of information typically used to track the status of a variable or
system‖ (Atkinson et al. 2007). In accordance with these guidelines, MRC implements 3 types of
monitoring: compliance monitoring, effectiveness monitoring, and validation monitoring.1
DEFINITION
Compliance monitoring determines whether MRC is
conforming to the regulatory provisions of our HCP/NCCP.
Effectiveness monitoring tests whether MRC conservation
measures, individually or in sum, meet the stated goals and
objectives of our HCP/NCCP.
Validation monitoring examines the validity of the
assumptions upon which the MRC conservation measures are
built.
While our definitions emphasize distinct differences, in reality, these 3 types of monitoring may
overlap and interact. If MRC determines through effectiveness monitoring, for example, that we
are not meeting our objectives for covered species, we may change our conservation measures.
Changing our conservation measures would, in turn, impact compliance monitoring.
13.2.1 Compliance monitoring
By tracking the status of plan implementation, compliance monitoring establishes whether MRC
is meeting our regulatory commitments under our HCP/NCCP. In effect, compliance monitoring
is implementation monitoring. In addition, there is a correlation between compliance monitoring
and effectiveness monitoring. Without compliance monitoring, our ability to interpret results
from effectiveness monitoring becomes very limited.
1 Section 13-10, Monitoring Rare Plants, uses ―focused studies‖ synonymously with validation studies.

Mendocino Redwood Company HCP/NCCP
13-2
13.2.1.1 Compliance under the Programmatic Timber Harvest Plan (PTHP)
At a minimum, the PTHP process will consists of the following:
1. An MRC RPF will prepare a PTHP in accordance with our HCP/NCCP.
2. The MRC operations coordinator will review the plan and ensure that it complies with
our HCP/NCCP.
3. The MRC operations coordinator, if necessary, will consult with the wildlife agencies
prior to submitting the PTHP.
4. The MRC operations coordinator will include any results from consultations with the
wildlife agencies in the PTHP.
5. The PTHP will include maps and the following information, where relevant, as
enforceable language in section 2 of the PTHP:
Northern spotted owl
Previous 3 activity centers per territory within 0.7 mi. of the PTHP area and
within 0.5 mi. of appurtenant roads.
Protection level of each activity center.
Pre- and post-harvest habitat maps and acreages for territories within 0.7 miles
the THP area.
Marbled murrelet
Indication if the PTHP is in the Lower Alder Creek Management Area
(LACMA).
Outcome of any assessment for marbled murrelet habitat and designation of
the Murrelet Habitat Zone (MHZ) of the PTHP (section 10.3.2.3.3).
Protection levels provided for marbled murrelet habitat or a survey plan for
murrelet habitat.
Indication if (a) MRC has completed ongoing radar monitoring in additional
drainages (13.9.2.2-3); (b) trees will be assessed as primary and secondary
murrelet trees; and (c) MRC will harvest secondary murrelet trees which our
surveys indicate are not occupied.
Point Arena mountain beaver
Indication if the PTHP is within the Point Arena mountain beaver assessment
area.
Potential habitat of the Point Arena mountain beaver in or adjacent to the
PTHP area.
Occupied habitat of the Point Arena mountain beaver in or adjacent to the
PTHP area.
Coastal tailed frog
Indication if there are watercourses occupied by coastal tailed frogs in the
PTHP area and confirmation that MRC is treating occupied watercourses as
Large Class II streams.
Indication if MRC proposes heavy equipment in a buffered area around any
wet features (seeps, springs, wet areas, wet meadows, or wetlands) and if pre-
project surveys are required.
Red-legged frog
Indication if there are potential or documented breeding sites in the PTHP area
and confirmation or descriptions of pertinent conservation measures.
Indication if MRC proposes heavy equipment in a buffered area around any
wet features (seeps, springs, wet areas, wet meadows, or wetlands) and if pre-
project surveys are required.
Mass wasting
Field observations and mapping of TSUs.

Mendocino Redwood Company HCP/NCCP
13-3
Aquatic management zones (AMZs)
Proposed AMZ restoration.
Alternatives for restoration treatments in AMZ (AC§8.2.3.4-1 to AC§8.2.3.4-
22).
Proposed harvest within the AMZ.
Water drafting guidelines (Appendix E, section E.7, Standards for Water
Drafting; Appendix T, Master Agreement for Timber Operations).
Snags, wildlife trees, recruitment trees, and LWD
Process for marking, tracking, and mapping silvicultural units to ensure
compliance to our HCP/NCCP.
Report on number of snags, wildlife trees, and recruitment trees in sample
area.
Hardwoods
Indication if the basal area of hardwoods in silvicultural units prior to harvest
is ≥ 15 ft2/ac or, if not, statement included of the actual basal area.
Indication if the stands covered in the harvest plan are Type I, Type II, or
Type III hardwoods stands or are hardwood representative sample areas.
Plants
Survey compliance
Date of survey effort; size and location of areas surveyed; communities
and habitats covered by the survey; number of person-hours to complete
the survey. NOTE
A survey may not be completed at the time the PTHP is submitted for
approval. MRC may amend a survey to an already approved PTHP.
CDFG will have 15 days to review the survey results prior to
commencement of operations.
List and map showing all occurrences of rare plant species, including an
identification code or number and specific location (USGS quadrangle,
watershed, and inventory block) for each occurrence.
Number of rare plant individuals (or alternative measure of abundance or
cover) for each occurrence detected during the survey.
Conservation compliance
Management category of each covered rare plant species known in the
PTHP area.
Approved variances to the standard conservation measures.
Description of how MRC will implement standard and alternative
conservation measures.
Additional species
Additional seasonal restrictions for any species not listed above.
Location of any habitat or disturbance buffers, retention areas, EEZs, or
ELZs.
Allowable deviations or alternatives to standard conservation measures (Chapters
8-11).
Natural communities
Indication if the PTHP occurs in uncommon natural communities.
Map showing the area covered by PTHP and the proposed activities
within the uncommon natural communities.
6. MRC will

Mendocino Redwood Company HCP/NCCP
13-4
Submit to CAF FIRE, per State law and in accordance with the CFPR, the PTHP,
and any major PTHP amendments subsequent to submission.
Notify the wildlife agencies as described within our HCP/NCCP.
7. CAL FIRE will review the PTHP as follows:
There will be an initial office review of the PTHP to determine if the plan is
within the scope of the PTEIR.
A pre-harvest inspection, if necessary, will occur in the field; the MRC
coordinator will notify the wildlife agencies of the scheduled date so that they
can attend.
There may be active inspections during conduction of the PTHP to ensure that
operations are in compliance with our HCP/NCCP.
CAL FIRE will prepare and file the inspection reports in the PTHP record.
8. The MRC operations coordinator will prepare a PTHP completion report and submit it to
CAL FIRE and the wildlife agencies.
9. CAL FIRE may request, post-harvest, a completion inspection; in that case, the MRC
coordinator will notify the wildlife agencies of the scheduled date so they can attend.
10. The wildlife agencies may request a status on operations of a PTHP and schedule a field
inspection with MRC.
11. The MRC operations coordinator will conduct field reviews, within the first 3 years of
HCP/NCCP implementation, of up to 25 PTHPs, starting with all PTHPs with active
operations in the initial year of our HCP/NCCP; this process will continue until 25
PTHPs have been reviewed or 3 years have elapsed, whichever comes first.
12. The MRC operations coordinator will submit a PTHP compliance report with compiled
information on the annually reviewed PTHPS to CDF, NMFS, USFWS, and CDFG, as requested,
prior to December 31 of the year in which MRC completed the PTHPs.
13.2.1.2 Non-PTHP compliance monitoring
MRC will submit annual reports for operations that are not directly related to a PTHP. These
reports include annual sediment control and LWD placement (see Appendix D, HCP/NCCP
Report Timelines and Samples, D.2.4).
13.2.2 Effectiveness and validation monitoring
Effectiveness monitoring assesses the biological success of our HCP/NCCP; specifically, it
evaluates whether MRC is meeting our biological goals and objectives. Validation monitoring, or
in some cases focused studies, tests hypotheses to determine whether the assumptions under
which MRC is conducting operations are correct. Table 13-1 lists all our HCP/NCCP monitoring
programs. Each monitoring program has a unique code. For example, in the code M§13.5.2.1-2,
M indicates this is a monitoring program, 13.5.2.1 indicates the section number within our
HCP/NCCP where there is a description of this specific monitoring program, and 2 indicates it is
the second monitoring program in that section.

Mendocino Redwood Company HCP/NCCP
13-5
Table 13-1 HCP/NCCP Monitoring Programs
HCP/NCCP Monitoring Programs
Monitoring Code Type Description
M§13.5.1.1-1 E Timber Inventory: Riparian Stands
M§13.5.1.1-2 E Timber Inventory: Riparian Canopy
M§13.5.1.1-3 E Watershed Analysis: LWD Conditions
M§13.5.1.1-4 E Watershed Analysis: Shade Conditions
M§13.5.1.1-5 E Stream Temperature
M§13.5.1.2-1 V Long-term Channel Monitoring: LWD
M§13.5.1.2-2 V Focus Watersheds: Riparian Function
M§13.5.1.2-3 V Watershed Size: Small Class II Watercourses
M§13.5.2.1-1 E Watershed Analysis: Mass Wasting
M§13.5.2.1-2 E Focus Watersheds: Mass Wasting
M§13.5.2.2-1 V Forensic Monitoring: Landslide Observations
M§13.5.3.1-1 E Road Inventory: Sediment Prevention
M§13.5.3.1-2 E Watershed Analysis: Sediment Prevention
M§13.5.3.2-1 V Focus Watersheds: Sediment Prevention
M§13.5.4.1-1 V Focus Watersheds: Sediment Budget
M§13.5.4.1-2 V Long Term Channel Monitoring: Stream Sediment
M§13.5.4.1-3 V Focus Watersheds: Stream Sediment
M§13.5.5.1-1 E Water Drafting
M§13.5.5.2-1 V Water Drafting
M§13.6.1.1-1 E Anadromous Salmonid Presence: Annual Salmonid Monitoring
Basins (ASMB)
M§13.6.1.1-2 E Anadromous Salmonid Distribution
M§13.6.1.1-3 E Chinook Salmon Monitoring Reaches (CSMR)
M§13.6.1.2-1 V Smolt Abundance
M§13.6.2.1-1 E Baseline Distribution and Habitat Quality of Red-legged Frog
Breeding Sites
M§13.6.2.1-2 E Occupancy of Red-Legged Frogs in Documented Breeding Sites
M§13.6.2.1-3 E Re-evaluate Habitat Quality and Species Presence within RLF
Breeding Sites
M§13.6.3.1-1 E Baseline Distribution of Coastal Tailed Frogs
M§13.6.3.1-2 E Distribution and Relative Abundance of Coastal Tailed Frogs
M§13.8.1-1 E Snags, Wildlife Trees, Recruitment Trees, and Downed Wood
M§13.8.1-2 E Basal Area of Hardwoods in Timber Stands
M§13.8.1-3 E Post-Harvest Follow-up on Hardwood Representative Sample Areas
M§13.8.1-4 E Acreage and Number of Hardwood Representative Sample Areas
M§13.8.1-5 E Acreage and Number of Old Growth Stands and Trees
M§13.8.1-6 E Distribution and Area of Rocky Outcrops
M§13.8.2-1 E Common Natural Communities
M§13.8.2-2 E Uncommon Natural Communities
M§13.8.3-1 E Invasive Species Control
M§13.9.1.3-1 E Northern Spotted Owls: Level-1 and Level-2 Territories
M§13.9.1.3-2 E Northern Spotted Owls: Distribution and Acreage of Nesting/Roosting
Habitat
M§13.9.1.4-1 V Population Trends of Northern Spotted Owls
M§13.9.1.4-2 V Identification of Nesting/Roosting Habitat for Northern Spotted Owls
M§13.9.1.4-3 V Benefits of High Protection for Northern Spotted Owls and Their
Territories

Mendocino Redwood Company HCP/NCCP
13-6
HCP/NCCP Monitoring Programs
Monitoring Code Type Description
M§13.9.1.4-4 V Effect of Harvest within 1000 ft of NSO Territories with Limited
Protection
M§13.9.1.4-5 V Effect of Habitat on Productivity of Northern Spotted Owls
M§13.9.1.4-6 V Effect of Hardwood Density on Northern Spotted Owls
M§13.9.1.4-7 V Effect of Barred Owl Control on Northern Spotted Owls
M§13.9.2.1-1 V Activity Level of Marbled Murrelets in Lower Alder Creek
M§13.9.2.1-2 V Murrelet Occupancy in Navarro, Greenwood Creek, Albion River
Watersheds
M§13.9.2.2-1 E Murrelet Habitat Distribution in LACMA
M§13.9.2.2-2 E Methods for Accelerating Growth of Murrelet Habitat
M§13.9.2.2-3 V Radar Monitoring in Additional Drainages
M§13.9.3.1-1 E Spatial Extent of Known Burrow Systems of Point Arena Mountain
Beaver
M§13.9.3.1-2 E Creating Habitat with Timber Harvest within Dispersal Distance of
Existing PAMB Burrow Systems
M§13.9.3.2-1 V Defining Habitat for Point Arena Mountain Beavers
M§13.9.3.2-2 V Creating Potential Habitat in or Adjacent to Existing PAMB Burrow
Systems
M§13.10.3-1 E Status and Trend of Covered Rare Plant Species
TABLE NOTES
E = effectiveness monitoring
V= validation monitoring
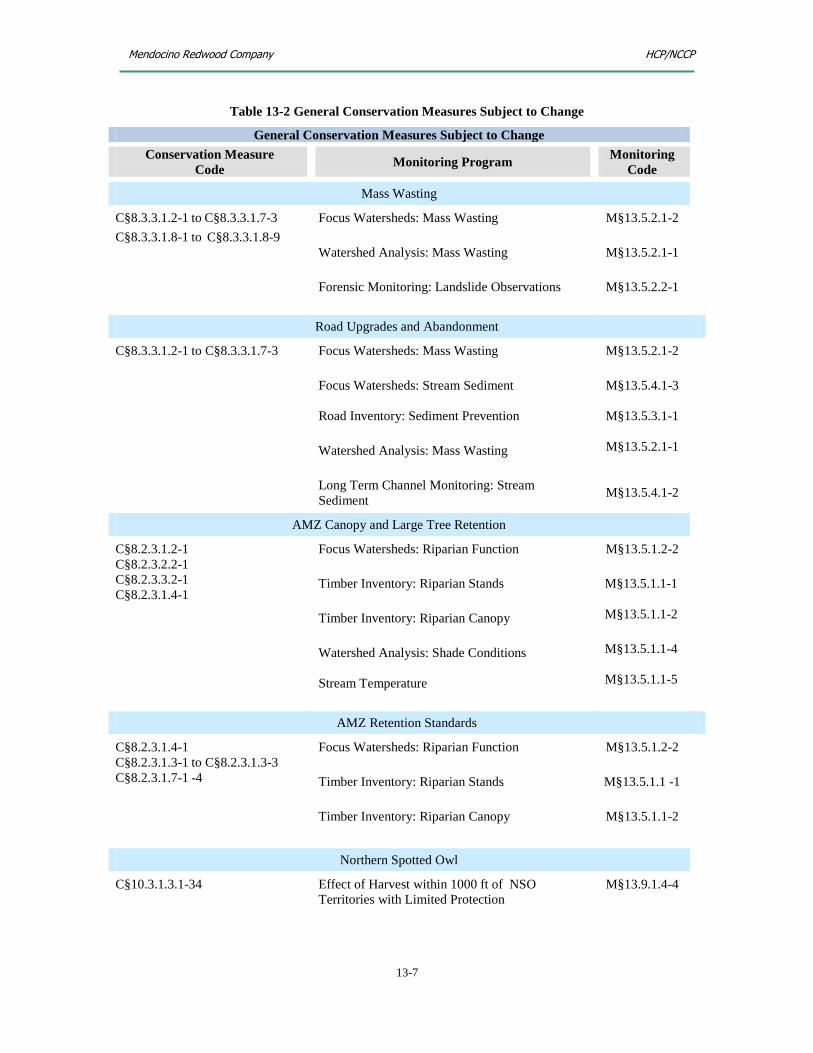
13.2.2.1 Conservation measures, contingencies, and definitions subject to change
Individual conservation measures target different biological goals and objectives. Some of these
conservation measures are static. MRC can only change them through an amendment process
outlined in the Implementing Agreement. Other conservation measures are dynamic. MRC may
change them in response to data collected under the adaptive management program. Section
13.3.6 describes the allowable limits of change for these dynamic conservation measures. When
a change is within these allowable limits, MRC can make it with approval of the wildlife
agencies; however, when a change is outside the allowable limits, MRC may need to propose an
amendment or minor modification to the HCP/NCCP, as described in section 1.13. Table 13-2
describes, in general, the conservation measures subject to change. Table 13-3 has the
contingency for barred owls that is subject to change. In addition, some of the definitions
surrounding specific conservation measures are also subject to change; Table 13-4 shows those
definitions and the monitoring programs that determine what those changes may be. Finally,
MRC will monitor the population trends of all northern spotted owls in the plan area (M§13.9.1.4-
1) to determine if their total numbers increase, decrease, or remain stable.
Mendocino Redwood Company HCP/NCCP
13-7
Table 13-2 General Conservation Measures Subject to Change
General Conservation Measures Subject to Change
Conservation Measure
Code Monitoring Program
Monitoring
Code
Mass Wasting
C§8.3.3.1.2-1 to C§8.3.3.1.7-3
C§8.3.3.1.8-1 to C§8.3.3.1.8-9
Focus Watersheds: Mass Wasting
Watershed Analysis: Mass Wasting
Forensic Monitoring: Landslide Observations
M§13.5.2.1-2
M§13.5.2.1-1
M§13.5.2.2-1
Road Upgrades and Abandonment
C§8.3.3.1.2-1 to C§8.3.3.1.7-3 Focus Watersheds: Mass Wasting
Focus Watersheds: Stream Sediment
Road Inventory: Sediment Prevention
Watershed Analysis: Mass Wasting
Long Term Channel Monitoring: Stream
Sediment
M§13.5.2.1-2
M§13.5.4.1-3
M§13.5.3.1-1
M§13.5.2.1-1
M§13.5.4.1-2
AMZ Canopy and Large Tree Retention
C§8.2.3.1.2-1
C§8.2.3.2.2-1
C§8.2.3.3.2-1
C§8.2.3.1.4-1
Focus Watersheds: Riparian Function
Timber Inventory: Riparian Stands
Timber Inventory: Riparian Canopy
Watershed Analysis: Shade Conditions
Stream Temperature
M§13.5.1.2-2
M§13.5.1.1-1
M§13.5.1.1-2
M§13.5.1.1-4
M§13.5.1.1-5
AMZ Retention Standards
C§8.2.3.1.4-1
C§8.2.3.1.3-1 to C§8.2.3.1.3-3
C§8.2.3.1.7-1 -4
Focus Watersheds: Riparian Function
Timber Inventory: Riparian Stands
Timber Inventory: Riparian Canopy
M§13.5.1.2-2
M§13.5.1.1 -1
M§13.5.1.1-2
Northern Spotted Owl
C§10.3.1.3.1-34 Effect of Harvest within 1000 ft of NSO
Territories with Limited Protection
M§13.9.1.4-4

Mendocino Redwood Company HCP/NCCP
13-8
General Conservation Measures Subject to Change
Conservation Measure
Code Monitoring Program
Monitoring
Code
C§10.3.1.3.1-5
C§10.3.1.3.1-21
Effect of Habitat on Productivity of Northern
Spotted Owls
M§13.9.1.4-5
C§9.3.3.1-1 to C§9.3.3.1-3
C§9.3.3.2-1 to C§9.3.3.2-12
C§9.3.3.3-1 to C§9.3.3.3-3
Effect of Hardwood Density on Northern Spotted
Owls
M§13.9.1.4-6
Marbled Murrelet
C§10.3.2.3.1-3
Methods for Accelerating Growth of Murrelet
Habitat
M13.9.2.2-2
C§10.3.2.3.11-9
C§10.3.2.3.12-9
Radar Monitoring in Additional Drainages M§13.9.2.2-3
Point Arena Mountain Beaver
C§10.3.3.3-1 Creating Potential Habitat in or adjacent to
Existing PAMB Burrow Systems
M§13.9.3.2-2
Rare Plants
C§11.7.1-11
C§11.7.2-8
C§11.7.3-8
Status and Trend of Covered Rare Plant Species M§13.10.3-1
Table 13-3 Contingency Subject to Change
Contingency Monitoring Program Monitoring Code
Northern Spotted Owl
Barred Owls
SECTION 10.3.1.2.5
Y§10.3.1.2.5-6
Effect of Barred Owl Control on Northern
Spotted Owls
M§13.9.1.4-7
Table 13-4 Definitions Subject to Change
Definitions Subject to Change
Definitions Monitoring Program Name Monitoring
Code
Small Class II watercourses Watershed Size: Small Class II
Watercourses
M§13.5.1.2-3
NSO nesting/roosting habitat Identification of Nesting/Roosting Habitat
for Northern Spotted Owls
M§13.9.1.4-2
Mapped boundaries of LACMA Murrelet Habitat Distribution in LACMA
M§13.9.2.2-1

Mendocino Redwood Company HCP/NCCP
13-9
Definitions Subject to Change
Definitions Monitoring Program Name Monitoring
Code
Potential habitat of Point Arena Mountain
Beaver
Defining Habitat for Point Arena Mountain
Beavers
M§13.9.3.2-1
13.2.2.2 Objectives and hypotheses
Sections 13.4 through 13.11 detail our effectiveness and validation monitoring programs. The
objectives in the effectiveness monitoring programs link directly to one or more stated objectives
in Chapters 8 through 11, where we propose our conservation measures. Except for physical
processes, the hypotheses in the validation monitoring programs link directly to ―key
uncertainties‖ stated in Chapter 4 (Covered Aquatic Species), Chapter 5 (Covered Terrestrial
Species), and Chapter 6 (Covered Plant Species).
There are 8 monitoring programs for physical processes, shown in Table 13-5, with various
parameters such as instream canopy and LWD, drainage areas of Small Class II watercourses,
mass wasting observations, road inventory, and conditions of instream channels and sediment.
MRC is already implementing most of these monitoring programs within watershed analysis. In
the future, we may (a) continue the same frequency and survey effort; or (b) alter survey
frequency and incorporate improved technologies or habitat models after HCP/NCCP
commencement. For other physical monitoring programs, such as those for Small Class II
watercourses or mass wasting forensics, MRC will need to plan new protocols prior to
HCP/NCCP implementation.
Table 13-5 Validation Monitoring Programs for Physical Processes
Validation Monitoring
Program Code Monitoring Program Description
M§13.5.1.2-2 Focus Watersheds: Riparian Function
M§13.5.1.2-3 Watershed Size: Small Class II Watercourses
M§13.5.2.2-1 Forensic Monitoring: Landslide Observations
M§13.5.3.2-1 Focus Watersheds: Sediment Prevention
M§13.5.4.1-2 Long Term Channel Monitoring: Stream Sediment
M§13.5.4.1-3 Focus Watersheds: Stream Sediment
M§13.5.4.1-1 Focus Watersheds: Sediment Budget
M§13.5.5.2 Water Drafting
13.2.2.3 Testing assumptions
Many of the assumptions behind our conservation measures were based on research in locations
different from the plan area or on information only indirectly related to a specific species or
habitat. These assumptions and scientific sources must be sorted out and examined.
Effectiveness and validation monitoring are not mutually exclusive. While validating a
hypothesis, one can evaluate the effectiveness of a conservation measure as well. Appropriate
levels of LWD in fish-bearing streams, for instance, may be the objective of a conservation
measure. Validation monitoring examines the assumption that abundance of anadromous
salmonid will increase with LWD. An actual increase in abundance of anadromous salmonid
may validate the assumption and show that LWD recruitment has been effective at meeting
conservation objectives.

Mendocino Redwood Company HCP/NCCP
13-10
MRC will use various programs to assess habitat and species populations and test the
performance of our conservation measures. We anticipate that most, if not all, of the monitoring
programs will be implemented for the full term of our HCP/NCCP.
13.2.2.4 Use of statistics in monitoring programs
DEFINITION
Mean is the arithmetic average of a set of numbers; for
example, the mean of 33 19 47 84 12 is 39
Median is the middle number in an ordered sequence of
numbers; for example, the median of 12 19 33 47 84 is 33.
If there are an even number of numbers, then the median is
the average of the two middle numbers; for example, the
median of 12 19 33 47 84 92 is 40.
The basic function of statistics is to produce knowledge from raw data and allow for informed
decisions. In applying statistics, one begins with a population. In our case, this might be, for
example, a population of northern spotted owls or red-legged frogs. MRC routinely collects data
in observational or experimental settings about various populations on our land. For practical
reasons, we study a subset of a population, called a sample. If the sample is representative of the
population, then inferences and conclusions made from the sample can be extrapolated to the
population as a whole. A major problem lies in determining the extent to which the sample is
representative. Results can be difficult to interpret and may not agree with intuition or
expectation. Statistics help us to estimate randomness or uncertainty in our sample and in our data
collection procedure.
Many of our monitoring programs compare 2 different sets of numbers, for example, the number
of murrelet detections in the Lower Alder Creek Management Area (LACMA) during 2008 and
2009. Say, for example, the mean number of detections in 2008 and 2009 were 20 and 25
respectively. Intuitively, we might conclude that these mean numbers are different. Intuition,
however, can be incorrect. To conclude with some level of certainty that there was, in fact, an
increase in the number of murrelet detections between 2008 and 2009, we must look at the
variability of our samples for both years. The difference in means may simply be due to the
variability of our samples. In 2008, our detections may have varied wildly (0, 0, 100, 0, 0) for a
mean of 20. In 2009, our detections continued to be erratic (20, 85, 0, 20, 0) for a mean of 25. In
light of this variation in our detections, there is no statistical basis for concluding that the
difference in the mean number of murrelet detections from 2008 to 2009 equates to an increase in
murrelet detections.
DEFINITION
Null hypothesis is a basic statistical hypothesis to be tested,
generally stated as 2 populations having equivalent
parameters.
Alpha level is the probability of rejecting a hypothesis
when it is, in fact, true.
Power is the probability of rejecting a hypothesis when it is,
in fact, false.
Power analysis is the ability to find a statistically
significant difference when a real difference exists.

Mendocino Redwood Company HCP/NCCP
13-11
As the above example shows, we test whether the mean number of murrelet detections from one
year to the next is different by assessing the means and the variation in the surveys that generate
those means in each year. To compare the means, we set up a null hypothesis, such as ―The mean
number of murrelet detections is equal in 2008 to 2009.‖ The alpha level is the probability that
we will reject the null hypothesis when the hypothesis is true. The power is the probability we
will reject the null hypothesis when the hypothesis is false, i.e., we will make a correct decision.
In terms of statistical tests, the higher the power, the more likely the test will detect a difference
when there is an actual difference. In designing monitoring studies to compare means or medians,
we are trying to balance power against alpha level so that we are more likely to detect a
difference when there is one and less likely to mistakenly detect a difference when none exists.
The concepts of power and alpha level also relate to the statistical concepts of Type I and Type II
error. A Type I error occurs when a researcher rejects the null hypothesis even though it is true;
therefore, a lower alpha level means a decreased chance for a Type I error. A Type II error occurs
when a researcher should have rejected a null hypothesis but instead fails to reject it. The power
is the probability that a Type II error will not occur; consequently, a higher power means a
decreased chance of a Type II error.
Because null hypotheses are usually stated as 2 equal populations, a Type I error can lead to the
mistaken conclusion that a difference exists and precipitate an unnecessary action. On the other
hand, a Type II error can overlook a difference when one occurs. A Type II error can be more
important than a Type I if the missed difference is a serious decline in a covered species
population. Power can be increased by increasing the acceptable alpha level, increasing the
minimum detectable change, increasing the number of sampling units, or reducing the standard
deviation.
We cannot, in our HCP/NCCP, lay out the statistical details of our study designs—most of which
have not yet been developed. However, our intention, going forward, is to use existing
monitoring programs or design new programs early in the plan implementation that incorporate
the necessary statistical rigor for specific applications. As MRC develops each monitoring
program, we will work with the wildlife agencies to ensure there is minimal statistical error.
MRC recognizes several principles of experimental design that are important to our monitoring
programs. Replicates in space and time can help assure that findings can be extrapolated across
the plan area. Random allocation of treatments is also important, but difficult to apply in a land
management scenario. The BACI (Before-After-Control-Impact)2 design is a powerful design
that MRC will apply whenever feasible in developing effectiveness and validation monitoring
programs (see rightmost columns of Figure 13-2).
13.2.2.5 Spatial scales for monitoring
Monitoring must evaluate effects at both small and large scales. MRC is using different spatial
scales for effectiveness and validation monitoring (see Table 13-6). Some monitoring will be at a
project or site-specific scale. Aquatic monitoring will often be at major tributary or river-reach
scale. For many cumulative effects, the large basin or watershed scale is an appropriate size.
2 BACI is a method for measuring the potential impact of an event on an ecological resource (e.g., fish distribution in a
stream after removal of a fish passage barrier). One measures conditions before a planned activity and then compares
the results to conditions after the activity. The comparison is done with a control site that remains the same before
and after the activity.

Mendocino Redwood Company HCP/NCCP
13-12
Data on spotted owls and marbled murrelets will be collected at the inventory block scale since
owls can move across basins and watersheds.
MRC has designed some of our monitoring programs to evaluate conditions at the planning
watershed scale. In consultation with the wildlife agencies, we determined the most appropriate
scale for each monitored parameter. Each objective has a monitoring program which balances the
need for a representative sample with the intensity of effort required to achieve that
representation. MRC conducts LWD monitoring, for example, at numerous watercourse
segments within a planning watershed; we can rapidly conduct this monitoring throughout an
area. In the case of long-term channel monitoring for stream morphology, however, we track
changes at a single stream reach within a planning watershed; this is a labor-intensive program.
By monitoring the most downstream reach within the planning watershed, we obtain vital
information.
!
MRC may or may not implement optional monitoring programs
during the term of our HCP/NCCP. Only validation monitoring
programs are optional.
Table 13-6 Spatial Scales of Effectiveness and Validation Monitoring
Spatial Scales of Effectiveness and Validation Monitoring
Spatial Scale Description Monitoring Program Program Code
Silvicultural unit Silvicultural unit Basal Area of Hardwoods in
Timber Stands
M§13.8.1-2
Project level Small-scale, site-
specific issues or
projects, e.g.,
individual PTHPs
and roads
Forensic Monitoring:
Landslide Observations
Post-Harvest Follow-up on
Hardwood Representative
Sample Areas
Water Drafting
Occupancy of Red-Legged
Frogs in Documented
Breeding Sites
Re-evaluate Habitat Quality
and Species Presence within
RLF Breeding Sites
M§13.5.2.2-1
M§13.8.1-3
M§13.5.5.1
M§13.6.2.1-2
M§13.6.2.1-3
Major stream or
river reach
Class I watercourse
typically with a
hydrologic
watershed smaller
than a planning
watershed
Stream Temperature
Anadromous Salmonid
Distribution
M§13.5.1.1-5
M§13.6.1.1-2

Mendocino Redwood Company HCP/NCCP
13-13
Spatial Scales of Effectiveness and Validation Monitoring
Spatial Scale Description Monitoring Program Program Code
Major stream or
segment of river
within a planning
watershed
Distribution and Relative
Abundance of Coastal
Tailed Frogs
Long-term Channel
Monitoring: LWD
M§13.6.3.1-2
M§13.5.1.2-1
Lower Alder Creek
Murrelet Area Sub-planning
watershed
management area
dedicated to
retention of murrelet
activity and habitat
Activity Level of Marbled
Murrelets in Lower Alder
Creek
Murrelet Habitat
Distribution in LACMA
Methods for Accelerating
Growth of Murrelet Habitat
M§13.9.2.1-1
M§13.9.2.2-1
M§13.9.2.2-2
CalWater planning
watersheds
Planning unit
between 5000-
10,000 ac
designated by the
State of California
Baseline Distribution and
Habitat Quality of RLF
Breeding Sites
Baseline Distribution of
Coastal Tailed Frogs
Anadromous Salmonid
Presence: ASMB
Timber Inventory: Riparian
Stands
Focus Watersheds:
Sediment Budget Stream
Distribution and Area of
Rocky Outcrops
Long Term Channel
Monitoring: Stream
Sediment
Focus Watersheds: Stream
Sediment
Water Drafting
M§13.6.2.1-1
M§13.6.3.1-1
M§13.6.1.1-1
M§13.5.1.1-1
M§13.5.4.1-1
M§13.8.1-6
M§13.5.4.1-2
M§13.5.4.1-3
M§13.5.5.2-1
Watershed analysis
unit (WAU)
Plan area within a
large basin
Watershed Analysis: Mass
Wasting
Road Inventory: Sediment
Prevention
M§13.5.2.1-1
M§13.5.3.1-1

Mendocino Redwood Company HCP/NCCP
13-14
Spatial Scales of Effectiveness and Validation Monitoring
Spatial Scale Description Monitoring Program Program Code
Murrelet Occupancy in
Navarro, Greenwood Creek,
Albion River Watersheds
Radar Monitoring in
Additional Drainages
M§13.9.2.1-2
M§13.9.2.2-3
Watershed Analysis: Shade
Conditions
M§13.5.1.1-4
Inventory block
Geographical
separation of plan
area into distinct
management units
Northern Spotted Owls:
Level-1 and Level-2
Territories
Northern Spotted Owls:
Distribution and Acreage of
Nesting/Roosting Habitat
M§13.9.1.3-1
M§13.9.1.3-2
Point Arena
mountain beaver
assessment area
Areas up to 5 miles
inland bounded by
Cliff Ridge to the
north and the
southern edge of the
Garcia inventory
block to the south
Spatial Extent of Known
Burrow Systems of Point
Arena Mountain Beaver
Creating Habitat with
Timber Harvest within
Dispersal Distance of
Existing PAMB Burrow
Systems
Defining Habitat for Point
Arena Mountain Beavers
Creating Potential Habitat
in or Adjacent to Existing
PAMB Burrow Systems
M§13.9.3.1-1
M§13.9.3.1-2
M§13.9.3.2-1
M§13.9.3.2-2
Covered lands Plan area Snags, Wildlife Trees,
Recruitment Trees, and
Downed Wood
Acreage and Number of Old
Growth Stands and Trees
Population Trends of
Northern Spotted Owls
Identification of
Nesting/Roosting Habitat
for Northern Spotted Owls
M§13.8.1-1
M§13.8.1-5
M§13.9.1.4-1
M§13.9.1.4-2
M§13.9.1.4-3

Mendocino Redwood Company HCP/NCCP
13-15
Spatial Scales of Effectiveness and Validation Monitoring
Spatial Scale Description Monitoring Program Program Code
Benefits of High Protection
for Northern Spotted Owls
and Their Territories
Effect of Harvest within
1000 ft of NSO Territories
with Limited Protection
Effect of Habitat on
Productivity of Northern
Spotted Owls
Effect of Hardwood Density
on Northern Spotted Owls
Effect of Barred Owl
Control on Northern
Spotted Owls
Acreage and Number of
Hardwood Representative
Sample Areas
M§13.9.1.4-4
M§13.9.1.4-5
M§13.9.1.4-6
M§13.9.1.4-7
M§13.8.1-4
Common Natural
Communities
M§13.8.2-1
Uncommon Natural
Communities
M§13.8.2-2
Invasive Species Control M§13.8.3-1
13.2.2.6 Elements of a monitoring plan
In developing our monitoring plans, MRC will follow guidelines from Oakley et al. (2003) and
Elzinga et al. (1998). The basic elements of a monitoring plan are as follows:
Introduction stating species, needs, and management conflicts.
Ecological model identifying sensitive attributes to be measured and describing
relationships between species biology and management activities.
Management objectives and rationale for choice of attributes and amount of change that
will be considered biologically significant.
Monitoring design.
Sampling objective and rationale for choice of precision and error rates.
Sampling design, including description of sampling unit, size, distribution, and number,
as well as proposed Quality Assessment (QA) and Quality Control (QC).
Field measurement methods, including everything that someone would need to take-over
a project and continue it.
Timing (seasonal and phenological), frequency, and duration.
Location, including maps and aerial photos to enable location of the sampling units.

Mendocino Redwood Company HCP/NCCP
13-16
Data analysis approach.
Sample data sheet(s).
Responsible parties.
Funding.
Management response to results.
MRC will work with the wildlife agencies in developing our monitoring plans and obtain their
approval before implementing them. Chapter 13 simply presents high level concepts for each
monitoring program; this is not the substantive detail that must go into the actual monitoring plan.
After commencement of our HCP/NCCP, the wildlife agencies, in addition to scheduling field
inspection, may conduct monitoring in the plan area on their own initiative and with their own
funding, as long as they adhere to MRC access rules.
13.2.2.7 Monitoring programs subject to harvest levels
The source of funding for MRC monitoring programs is primarily revenue from our timber
harvest. Over the 80-year term of our HCP/NCCP, we expect our projected harvest levels to
increase as our forests continue to recover. When this occurs, MRC will increase our milling
capacity and customer base, and, in turn, increase capital improvements in our production
facilities.
By the same token, a market downturn, as we experienced in 2009, will impact harvest levels and
programs funded by harvest revenue. MRC will curtail many of our monitoring efforts if timber
harvest drops below 37% of our allowable harvest level.3 We chose 37% as the benchmark since
levels below this number would result in possible reductions in both staff and milling capacity.
Harvest levels are set within 5-year periods. Therefore, if our average allowable harvest level for
a year was 40 mmbf, we would curtail monitoring efforts if harvests dropped below 15 mmbf. In
no case, however, will MRC curtail the monitoring programs described in Table 13-6 for more
than 10 years. If harvests remain lower than the average allowable harvest levels for a period
exceeding 10 years, our monitoring programs will kick in again.
Harvest cutbacks may not affect all monitoring programs. In some cases, however, MRC will
conduct monitoring less frequently or discontinue it altogether until harvest levels rebound. MRC
may curtail monitoring in the same year of the reduced harvest or in the year following the
reduced harvest. In either case, the HCP/NCCP monitoring coordinator will send written
correspondence to the wildlife agencies within 1 week of our decision to limit monitoring. The
coordinator will send the letter by July 1st of the year in which the curtailed harvest will occur.
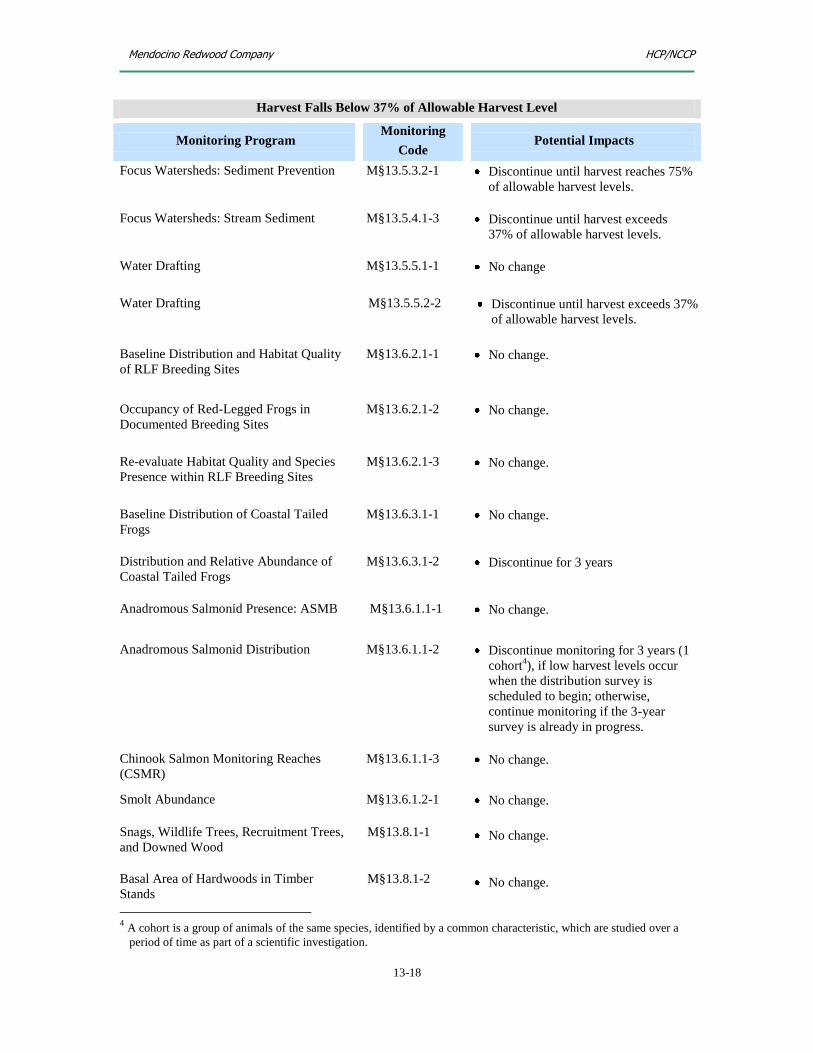
Table 13-7 outlines the potential impact of low harvest levels on proposed monitoring programs.
Table 13-8 sets the allowable harvest, as determined by the MRC growth-and-yield model. MRC
will adjust harvest volumes as land purchases or sales change the size of the plan area. Our
HCP/NCCP is for a term of 80 years. The actual date of HCP/NCCP commencement will
determine the starting and ending ―Harvest Year‖ in Table 13-8. We project that the HCP/NCCP
will commence in 2012 and conclude in 2092.
3 Rounded to the nearest whole number

Mendocino Redwood Company HCP/NCCP
13-17
Table 13-7 Monitoring Programs Subject to Harvest Levels
Harvest Falls Below 37% of Allowable Harvest Level
Monitoring Program Monitoring
Code Potential Impacts
Stream Temperature M§13.5.1.1-5 Skip no more than 3 years in a row
and leave no more than 6 data gaps.
Watershed Analysis: LWD Conditions M§13.5.1.1-3 Discontinue monitoring in non-
operational areas until harvest levels
exceed 37% of allowable harvest.
Watershed Size: Small Class II
Watercourses
M§13.5.1.2-3 No change.
Timber Inventory: Riparian Canopy M§13.5.1.1-2 Discontinue monitoring in non-
operational areas until harvest levels
exceed 37% of allowable harvest.
Focus Watersheds: Riparian Function M§13.5.1.2-2 Discontinue monitoring until harvest
reaches 75% of allowable harvest
levels.
Focus Watersheds: Mass Wasting M§13.5.2.1-2 Discontinue monitoring until harvest
reaches 75% of allowable harvest
levels.
Watershed Analysis: Sediment Prevention M§13.5.3.1-2 Discontinue monitoring in non-
operational areas until harvest levels
exceed 37% of allowable harvest.
Long Term Channel Monitoring: Stream
Sediment
M§13.5.4.1-2 No change.
Timber Inventory: Riparian Stands M§13.5.1.1-1 Discontinue monitoring in non-
operational areas until harvest levels
exceed 37% of allowable harvest.
Long-term Channel Monitoring: LWD M§13.5.1.2-1 No change.
Watershed Analysis: Mass Wasting M§13.5.2.1-1 Discontinue monitoring in non-
operational areas until harvest levels
exceed 37% of allowable harvest.
Forensic Monitoring: Landslide
Observations
M§13.5.2.2-1 No change.
Road Inventory: Sediment Prevention M§13.5.3.1-1 Discontinue monitoring in non-
operational areas until harvest levels
exceed 37% of allowable harvest.
Mendocino Redwood Company HCP/NCCP
13-18
Harvest Falls Below 37% of Allowable Harvest Level
Monitoring Program Monitoring
Code Potential Impacts
Focus Watersheds: Sediment Prevention M§13.5.3.2-1 Discontinue until harvest reaches 75%
of allowable harvest levels.
Focus Watersheds: Stream Sediment M§13.5.4.1-3 Discontinue until harvest exceeds
37% of allowable harvest levels.
Water Drafting
M§13.5.5.1-1 No change
Water Drafting
M§13.5.5.2-2 Discontinue until harvest exceeds 37%
of allowable harvest levels.
Baseline Distribution and Habitat Quality
of RLF Breeding Sites
M§13.6.2.1-1
No change.
Occupancy of Red-Legged Frogs in
Documented Breeding Sites
M§13.6.2.1-2 No change.
Re-evaluate Habitat Quality and Species
Presence within RLF Breeding Sites
M§13.6.2.1-3 No change.
Baseline Distribution of Coastal Tailed
Frogs
M§13.6.3.1-1 No change.
Distribution and Relative Abundance of
Coastal Tailed Frogs
M§13.6.3.1-2 Discontinue for 3 years
Anadromous Salmonid Presence: ASMB M§13.6.1.1-1 No change.
Anadromous Salmonid Distribution
M§13.6.1.1-2 Discontinue monitoring for 3 years (1
cohort4), if low harvest levels occur
when the distribution survey is
scheduled to begin; otherwise,
continue monitoring if the 3-year
survey is already in progress.
Chinook Salmon Monitoring Reaches
(CSMR)
M§13.6.1.1-3 No change.
Smolt Abundance M§13.6.1.2-1 No change.
Snags, Wildlife Trees, Recruitment Trees,
and Downed Wood
M§13.8.1-1
No change.
Basal Area of Hardwoods in Timber
Stands
M§13.8.1-2
No change.
4 A cohort is a group of animals of the same species, identified by a common characteristic, which are studied over a
period of time as part of a scientific investigation.

Mendocino Redwood Company HCP/NCCP
13-19
Harvest Falls Below 37% of Allowable Harvest Level
Monitoring Program Monitoring
Code Potential Impacts
Post-harvest Follow-up on Hardwood
Representative Sample Areas
M§13.8.1-3 No change.
Acreage and Number of Old Growth
Stands and Trees
M§13.8.1-5
No change.
Distribution and Area of Rocky Outcrops
M§13.8.1-6
No change.
Common Natural Communities M§13.8.2-1 No change.
Uncommon Natural Communities M§13.8.2-2 No change.
Invasive Species Control M§13.8.3-1
Discontinue until harvest exceeds 37%
of allowable harvest levels.
Northern Spotted Owls: Level-1 and
Level-2 Territories
M§13.9.1.3-1
Discontinue until harvest exceeds 37%
of allowable harvest levels.
Northern Spotted Owls: Distribution and
Acreage of Nesting/Roosting Habitat
M§13.9.1.3-2
Discontinue until harvest exceeds
37% of allowable harvest levels.
Population Trends of Northern Spotted
Owls
M§13.9.1.4-1
Discontinue until harvest exceeds
37% of allowable harvest levels.
Effect of Harvest within 1000 ft of NSO
Territories with Limited Protection
M§13.9.1.4-4
Discontinue until harvest exceeds
37% of allowable harvest levels.
Effect of Hardwood Density on Northern
Spotted Owls
M§13.9.1.4-6
Discontinue until harvest exceeds
37% of allowable harvest levels.
Effect of Barred Owl Control on Northern
Spotted Owls
M§13.9.1.4-7
Discontinue until harvest exceeds
37% of allowable harvest levels.
Activity Level of Marbled Murrelets in
Lower Alder Creek
M§13.9.2.1-1
Continue if MRC has already initiated
the study.
Murrelet Occupancy in Navarro,
Greenwood Creek, Albion River
Watersheds
M§13.9.2.1-2
Discontinue until harvest exceeds
37% of allowable harvest levels.
Spatial Extent of Known Burrow Systems
of Point Arena Mountain Beaver
M§13.9.3.1-1
No change.
Creating Habitat with Timber Harvest
within Dispersal Distance of Existing
PAMB Burrow Systems
M§13.9.3.1-2
Continue if MRC has already initiated
the study.

Mendocino Redwood Company HCP/NCCP
13-20
Harvest Falls Below 37% of Allowable Harvest Level
Monitoring Program Monitoring
Code Potential Impacts
Status and Trend of Covered Rare Plant
Species
M§13.10.3-1 Discontinue monitoring in non-
operational areas until harvest levels
exceed 37% of allowable harvest.
Table 13-8 Harvest Triggers to Reduce Monitoring
Harvest Triggers to Reduce Monitoring
Harvest Year
Allowable Harvest
Volume Per Year
(mbf)
37% of Allowable
Harvest per Year
(mbf)
75% of Allowable
Harvest per Year
(mbf)
2011-2015 57,954 21,443 43,466
2016-2020 62,669 23,188 47,002
2021-2025 64,382 23,821 48,287
2026-2030 62,008 22,943 46,506
2031-2035 62,976 23,301 47,232
2036-2040 73,552 27,214 55,164
2041-2045 87,011 32,194 65,258
2046-2050 90,201 33,374 67,651
2051-2055 90,573 33,512 67,930
2056-2060 91,780 33,959 68,835
2061-2065 95,407 35,301 71,555
2066-2070 107,037 39,604 80,278
2071-2075 106,885 39,547 80,164
2076-2080 106,484 39,399 79,863
2081-2085 109,110 40,371 81,833
2086-2090 118,427 43,818 88,820
2091-2095 119,410 44,182 89,558
13.3 Adaptive Management
―Nothing is permanent but change.‖ Heraclitus gave us that wise insight into the world over 2500
years ago. Adaptive management—a term that was coined in the 1970s and much later adopted
by the conservation community—is the process of improving management policies and practices
as things change. Our information about the natural world is never complete and too often it is
simply wrong. As Figure 13-1 shows schematically, what we ―know‖ is re-examined and tested,
knowledge is corrected and extended, and management is adjusted. In other words, we are
continually learning how to manage and we are managing in order to continually learn.

Mendocino Redwood Company HCP/NCCP
13-21
Figure 13-1 Adaptive Management Process
13.3.1 Inherent uncertainty in conservation effort
Our HCP/NCCP primarily uses a habitat-based approach to conserve covered species and natural
communities in the plan area. However, our knowledge of covered species, their habitats, and the
ecological systems that support them is incomplete. Lack of data introduces uncertainty into the
effectiveness of HCP/NCCP conservation measures. Uncertainty is also an inherent component
of ecological systems because of natural variation (e.g., rainfall, climate, species behavior, and
species response). Ecosystems are complex, which makes predicting species and habitat
responses to management actions difficult. Finally, future changes in land use outside the plan
area also introduce uncertainty. To address such uncertainties, MRC enlists principles of adaptive
management, which allow us to adjust conservation measures based on results of monitoring and
experimentation. This approach provides greater assurance that we will achieve our biological
goals and objectives for covered species and natural communities.
13.3.2 Definitions of adaptive management
DEFINITION
―Adaptive management is the process whereby management is
initiated, evaluated, and refined (Holling 1978, Walters 1986). It
differs from traditional management by recognizing and
preparing for the uncertainty that underlies resource management
decisions. Adaptive management is typically incremental in that
it uses information from monitoring and research to continually
evaluate and modify management practices. It promotes long-
term objectives for ecosystem management and recognizes that
the ability to predict results is limited by knowledge of the
system. Adaptive management uses information gained from past
management experiences to evaluate both success and failure, and
to explore new management options.‖ (Kershner 1997)
Mendocino Redwood Company HCP/NCCP
13-22
Adaptive management ―is a method for examining alternative
strategies for meeting measurable biological goals and objectives,
and then if necessary, adjusting future conservation management
actions according to what is learned.‖ (USFWS, Five-Point Policy
for HCPs, 65 FR 106, 1 June 2000)
Adaptive management uses ―the results of new information
gathered through the monitoring program of the plan and from
other sources to adjust management strategies and practices to
assist in providing for the conservation of covered species.‖
(California NCCPA of 2003, CDFG Code 2805a)
MRC has designed our adaptive management program to be consistent with the above definitions.
Our program incorporates the 4 adaptive management strategies that USFWS recommends for an
HCP (65 FR 35252):
1. Identify uncertainties and the questions that need to be addressed to resolve the
uncertainties.
2. Develop alternative strategies and determine which experimental strategies to
implement.
3. Integrate a monitoring program that is able to detect the necessary information for
strategy evaluation.
4. Incorporate feedback loops that link implementation and monitoring to a decision-
making process.
Our HCP/NCCP also incorporates the concepts of passive and active adaptive management
advocated and defined by USFWS for HCP implementation (65 FR 35250–35257). Through
passive adaptive management, MRC will learn how to attain our biological goals and objectives
based on the results of effectiveness monitoring. Through active adaptive management, we will
resolve uncertainties about the best approaches for achieving specific objectives. Specifically, we
will test hypotheses about covered species, covered natural communities, and physical processes;
in addition, we will conduct studies to validate assumptions about covered plants.
13.3.3 Adaptive approach
Monitoring the outcomes of management is the foundation of an adaptive approach; thoughtful
monitoring can both advance scientific understanding and modify management actions iteratively
(Williams et al. 2007).
Adaptive management is necessary because of the degree of uncertainty and natural variability
associated with ecosystems and their management. Based on the best scientific information
currently available, MRC expects our conservation measures to achieve our biological objectives.
However, there is uncertainty about management techniques, conditions within the permit area,
regional habitat conditions, and the status of covered species and natural communities; any of
these may change in unexpected ways during the course of HCP/NCCP implementation. Results
of validation monitoring may indicate that some of our conservation measures are less effective
Mendocino Redwood Company HCP/NCCP
13-23
than anticipated. To address these uncertainties, MRC will use an adaptive management
approach, based on validation monitoring, to inform our decisions.
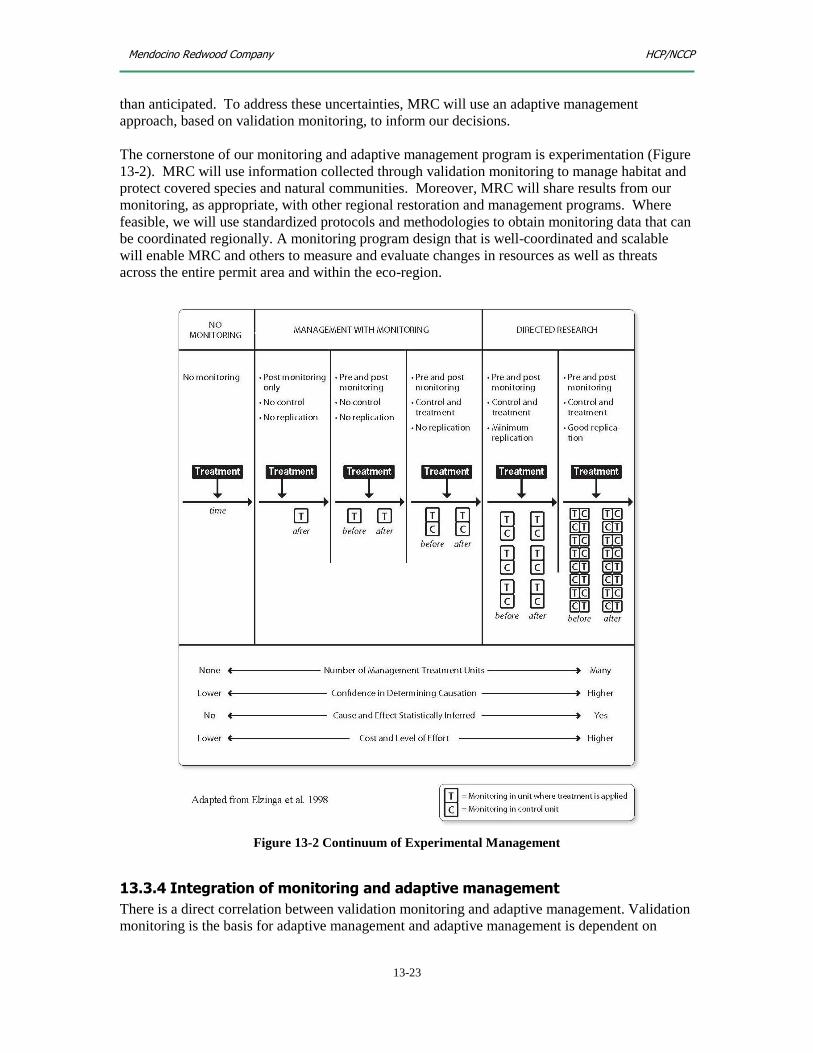
The cornerstone of our monitoring and adaptive management program is experimentation (Figure
13-2). MRC will use information collected through validation monitoring to manage habitat and
protect covered species and natural communities. Moreover, MRC will share results from our
monitoring, as appropriate, with other regional restoration and management programs. Where
feasible, we will use standardized protocols and methodologies to obtain monitoring data that can
be coordinated regionally. A monitoring program design that is well-coordinated and scalable
will enable MRC and others to measure and evaluate changes in resources as well as threats
across the entire permit area and within the eco-region.
Figure 13-2 Continuum of Experimental Management
13.3.4 Integration of monitoring and adaptive management
There is a direct correlation between validation monitoring and adaptive management. Validation
monitoring is the basis for adaptive management and adaptive management is dependent on

Mendocino Redwood Company HCP/NCCP
13-24
results from validation monitoring. Our HCP/NCCP integrates these 2 components into a single
program. Such integration is critical to the successful implementation of our conservation
strategies.
Our validation monitoring and adaptive management program will reveal the effectiveness of our
conservation measures. We will revise conservation measures which do not achieve the goals
and objectives of our HCP/NCCP. Moreover, we may revise conservation measures which exceed
those goals and objectives, dialing down their prescriptions a bit. In effect, validation monitoring
provides the impetus to change conservation measures as needed. Moreover, some conservation
measures come with their own defined limits of allowable change (Table 13-9 through Table 13-
12).
13.3.5 Conceptual models
Conceptual models are a useful tool that document HCP/NCCP assumptions about natural
communities and covered species. MRC will follow recommended steps for developing
conceptual ecological models (Atkinson et al. 2004):
1. Complete conceptual models for each covered species.
2. Identify critical uncertainties for covered species.
3. Identify pressures on natural community types including species-specific, local, regional,
and global pressures.
4. Develop conceptual models for natural communities and include their relationships to
covered species.
5. Cross-check the monitoring variables selected and described in our HCP/NCCP; monitor
species groups or indices where applicable.
Figure 13-3 Adaptive Management Feedback Loop

Mendocino Redwood Company HCP/NCCP
13-25
During plan implementation, conceptual models will guide our monitoring and adaptive
management (Figure 13-3). Using monitoring to provide information for adaptive management
will require a framework for measuring responses. The process is as follows:
1. Identify threats to the species or natural community.
2. Identify the objectives of the conservation strategy.
3. Evaluate the effectiveness of the objective in meeting a goal.
4. Evaluate the effectiveness of the conservation measure against the expected outcome.
The adaptive management program allows for the adjustment of the conservation measures if the
expected outcome fails to match the conservation objective or exceeds the conservation objective.
One then adjusts the conservation measures as needed to achieve the expected outcomes and
reduce the threats to the natural community.
13.3.6 Limits of allowable change
13.3.6.1 Conservation measures
Our conservation measures fall into categories: riparian, terrestrial species, and rare plants. In
some cases, we have also included limits of allowable change. Limits ensure the wildlife
agencies, MRC, and the public that changes to our HCP/NCCP will not be open-ended but must
be within a specified range.
The results of validation monitoring may support modification of a conservation measure within
the limits of allowable change. Generally, MRC will change only 1 conservation measure at a
time. In some cases, however, MRC and the wildlife agencies may conclude, based on validation
monitoring, to change more than one measure. MRC may adjust conservation measures within
the limits of allowable change with the concurrence of the wildlife agencies; adjustments outside
those limits require either a minor modification or major amendment to our HCP/NCCP. Table
13-9 through Table 13-11 document the limits of allowable change for conservation measures
applicable to riparian function, terrestrial species, and rare plants.
Table 13-9 Riparian Conservation Measures Subject to Change
Riparian Conservation Measures Subject to Change
Topic Habitat
Process
Monitoring
Code
Conservation
Measure and Code Limits of Allowable Change
Initial Low High
watercourse
shade Class I
AMZ
Stream
water
temperature
M§13.5.1.1-5 Inner band canopy
retention
C§8.2.3.1.2-1
85% 75% 95%
watercourse
shade Large
Class II AMZ
Stream
water
temperature
M§13.5.1.1-5 Inner band canopy
retention
C§8.2.3.1.2-1
85% 75% 95%
Class I AMZ
basal area
Instream
LWD
recruitment
M§13.5.1.1-3
M§13.5.1.2-1
M§13.5.1.2-2
Floodprone/CMZ
AMZ inner and
middle band C§8.2.3.1.3-1 (trigger for
harvest)
300 ft2 260 ft
2 350 ft
2

Mendocino Redwood Company HCP/NCCP
13-26
Riparian Conservation Measures Subject to Change
Topic Habitat
Process
Monitoring
Code
Conservation
Measure and Code Limits of Allowable Change
Initial Low High
Site 2 & 3 AMZ inner
and middle band C§8.2.3.1.3-2 (trigger for
harvest)
200 ft
2 160 ft
2 260 ft
2
Site 4 AMZ inner and
middle band C§8.2.3.1.3-3 (trigger for
harvest)
160 ft2 120 ft
2 200 ft
2
Class I AMZ
largest tree
retention
Instream
LWD
recruitment
M§13.5.1.1-3
M§13.5.1.2-1
M§13.5.1.2-2
High LWD sensitivity,
inner band C§8.2.3.1.4-1
30% 10% 50%
High LWD sensitivity,
middle band C§8.2.3.1.4-1
15% 10% 30%
Moderate LWD
sensitivity, inner band C§8.2.3.1.4-1
20% 10% 40%
Moderate LWD
sensitivity, middle
band
C§8.2.3.1.4-1
10% 5% 30%
Low LWD sensitivity,
inner band
C§8.2.3.1.4-1
10% 5% 30%
Low LWD sensitivity,
middle band C§8.2.3.1.4-1
5% 5% 20%
AMZ
restoration
harvest
Stream
water
temperature;
sediment
inputs
M§13.5.1.1-5
M§13.5.3.2-1
M§13.5.4.1-2
M§13.5.4.1-3
Percent of linear
distance of Class I and
Large Class II AMZ
within CalWater
planning watershed
per decade AC§8.2.3.4-9
0-15%
(varies
by site
specifics)
0 15%
bank stability Sediment
inputs;
stream
habitat
M§13.5.3.2-1
M§13.5.4.1-2
M§13.5.4.1-3
M§13.5.1.1-3
M§13.5.1.1-2
M§13.5.1.2-2
No harvest distance
from bankfull channel
except for 50% of
redwood clumps. AC§8.2.3.4-1
10 ft or
greater
(varies
by site
specifics)
5 ft 25 ft

Mendocino Redwood Company HCP/NCCP
13-27
Table 13-10 Terrestrial Conservation Measures Subject to Change
Terrestrial Conservation Measures Subject to Change
Monitoring
Program
Monitoring
Code
Conservation
Measure and Code
Limits of Allowable Change
Initial Low High
Benefits of High
Protection for
Northern
Spotted Owls
and Their
Territories
M§13.9.1.4-3
80 ac core area
C§10.3.1.3.1-1
80 ac
72 ac
90 ac
Effect of
Harvest within
1000 ft of NSO
Territories with
Limited
Protection
M§13.9.1.4-4
500 ft breeding season
buffer
C§10.3.1.3.1-39
500 ft
400 ft
600 ft
Effect of Habitat
on Productivity
of Northern
Spotted Owls
M§13.9.1.4-5
Amount of suitable
habitat required within
0.7 miles C§10.3.1.3.1-5
C§10.3.1.3.1-25
500 ac
450 ac
550 ac
Effect of
Hardwood
Density on
Northern
Spotted Owls
M§13.9.1.4-6
15 ft2/ac retained
C§9.3.3.2-1
15 ft2/ac 5 ft
2/ac
25 ft2/ac
Methods for
Accelerating
Growth of
Murrelet Habitat
M§13.9.2.2-2
Submit all PTHPs
within LACMA for
approval of the wildlife
agencies
C§10.3.2.3.1-4;
C§10.3.2.3.1-23
Silvicultural
prescriptions
agreed upon
by wildlife
agencies and
MRC
NA NA
Creating
Potential Habitat
in or Adjacent to
Existing PAMB
Burrow Systems
M§13.9.3.2-2
Conduct timber
operations, including
felling, yarding, and
enhancements of
downed wood, at least
100 ft (30.48 m) away
from active burrow
systems or un-surveyed
potential habitat.
C§10.3.3.3-1
100 ft No buffer 100 ft
Radar
Monitoring in
Additional
M§13.9.3.2-3
Allow harvest of
secondary murrelet
trees
Allow
harvest of
secondary
No
harvest of
secondary
Allow
ongoing
harvest of

Mendocino Redwood Company HCP/NCCP
13-28
Terrestrial Conservation Measures Subject to Change
Monitoring
Program
Monitoring
Code
Conservation
Measure and Code
Limits of Allowable Change
Initial Low High
Drainages C§10.3.2.3.11-9
C§10.3.2.3.12-9
murrelet
trees if radar
monitoring
completed
murrelet
trees
secondary
murrelet
trees
Table 13-11 Rare Plant Conservation Measures Subject to Change
Conservation
Measure
Description
Management
Category
(MC)
Conservation
Measure
Code
Limits of Allowable Change
Initial Low High
buffer area
width
MC1 Buffer width (ft)
C§11.7.1-11 Forest
a - 150
Otherb – 50
Forest - 50
Other - 25
Forest - 200
Other - 75
MC2 C§11.7.2-8 50
25 100
MC3 C§11.7.3-8 50
25 75
TABLE NOTES a
Forest = Coastal redwood/Douglas fir; mixed hardwood-conifer/hardwood/broadleaf upland; and pygmy
transition forest b
Other = Other vegetation and habitat types, including pygmy forest
13.3.6.2 Contingencies
Table 13-12 Contingency Measures Subject to Change
Monitoring
Program
Monitoring
Code
Contingency Measures
and Section #
Limits of Allowable Change
Initial Low High
Effect of Barred
Owl Control on
Northern
Spotted Owls
M§13.9.1.4-7
Barred owl
contingencies
Section 10.3.1.2.5
20%
contingency
trigger
No
change
30%
contingency
trigger
13.4 Overview of Aquatic Monitoring
MRC will implement effectiveness and validation monitoring through 10 aquatic programs,
shown in Table 13-13. Moreover, we will develop a review process to determine whether or not
we are meeting the objectives outlined in Chapter 8, Conservation Measures for Aquatic Habitat.
The schedules for this review process will depend upon the timing of the individual monitoring
programs.
MRC chose to focus a significant portion of our efforts on monitoring elements of aquatic habitat
(LWD, stream temperature, sediment, canopy cover, etc.) rather than on monitoring aquatic

Mendocino Redwood Company HCP/NCCP
13-29
species. Monitoring aquatic species across the entire plan area is time consuming, labor
intensive, and expensive. Nevertheless, we do monitor the distribution of aquatic species with
surveys for presence or absence, along with more focused efforts on species abundance.
Every aquatic monitoring program in Chapter 13 cross-references to an objective in Chapter 8.
MRC designed a monitoring program for each objective in consultation with government
agencies; our aim is to achieve the greatest amount of landscape coverage without overextending
our resources.
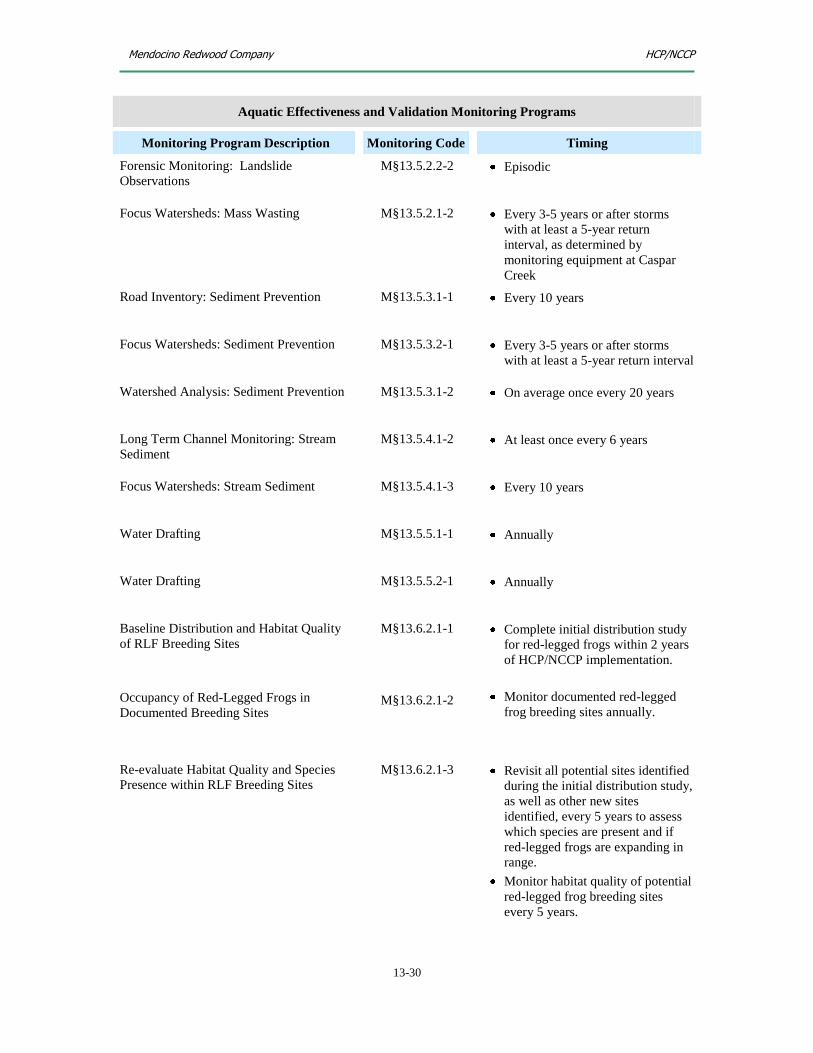
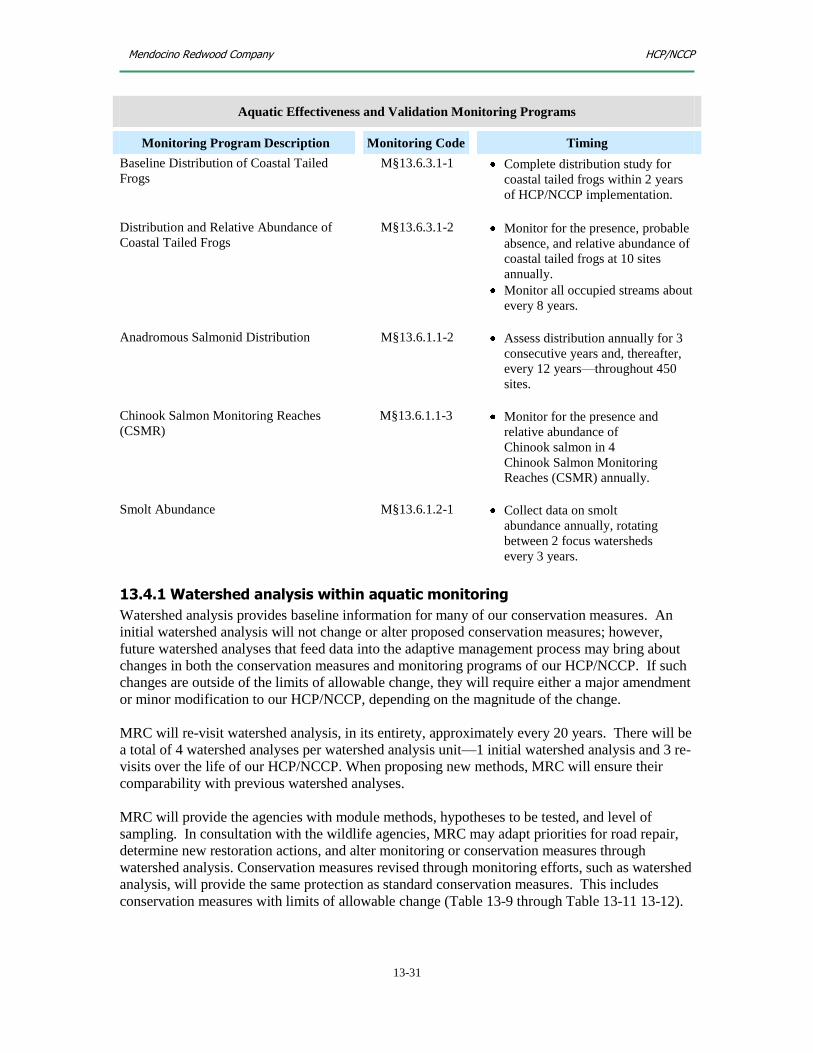
Table 13-13 outlines the timing for aquatic monitoring efforts. Each monitoring program
balances the need for a representative sample with the intensity of required effort required to
achieve that representation. Processes such as wood transport in streams or mass wasting occur
on very long (or indeterminable) time scales, typically coinciding with stochastic events. Other
processes vary annually or seasonally, such as stream temperature or species distribution. MRC
chose the sampling intervals listed below in order to monitor each objective.
Table 13-13 Aquatic Effectiveness and Validation Monitoring Programs
Aquatic Effectiveness and Validation Monitoring Programs
Monitoring Program Description Monitoring Code Timing
Timber Inventory: Riparian Stands
M§13.5.1.1-1 Every 10 years
Timber Inventory: Riparian Canopy
M§13.5.1.1-2 Every 10 years
Watershed Analysis: LWD Conditions
M§13.5.1.1-3 On average5 once every 20 years
Watershed Analysis: Shade Conditions M§13.5.1.1-4 On average once every 20 years
Long-term Channel Monitoring: LWD M§13.5.1.2-1 At least once every 6 years
Focus Watersheds: Riparian Function
M§13.5.1.2-2 Every 3 years
Stream Temperature M§13.5.1.1-5 Annually
Watershed Size: Small Class II
Watercourses
M§13.5.1.2-3 Initial examination in first 5 years
Watershed Analysis: Mass Wasting M§13.5.2.1-1 On average once every 20 years
5 In the first 4 years of our HCP/NCCP, MRC will complete our initial effort at watershed analysis. Watershed analysis
takes many years to complete. On average, we will start the process over again in 20 years, although in any given
watershed the process may occur earlier or later.
Mendocino Redwood Company HCP/NCCP
13-30
Aquatic Effectiveness and Validation Monitoring Programs
Monitoring Program Description Monitoring Code Timing
Forensic Monitoring: Landslide
Observations
M§13.5.2.2-2 Episodic
Focus Watersheds: Mass Wasting M§13.5.2.1-2 Every 3-5 years or after storms
with at least a 5-year return
interval, as determined by
monitoring equipment at Caspar
Creek
Road Inventory: Sediment Prevention M§13.5.3.1-1 Every 10 years
Focus Watersheds: Sediment Prevention M§13.5.3.2-1 Every 3-5 years or after storms
with at least a 5-year return interval
Watershed Analysis: Sediment Prevention M§13.5.3.1-2 On average once every 20 years
Long Term Channel Monitoring: Stream
Sediment
M§13.5.4.1-2 At least once every 6 years
Focus Watersheds: Stream Sediment M§13.5.4.1-3 Every 10 years
Water Drafting M§13.5.5.1-1 Annually
Water Drafting M§13.5.5.2-1 Annually
Baseline Distribution and Habitat Quality
of RLF Breeding Sites
Occupancy of Red-Legged Frogs in
Documented Breeding Sites
M§13.6.2.1-1
M§13.6.2.1-2
Complete initial distribution study
for red-legged frogs within 2 years
of HCP/NCCP implementation.
Monitor documented red-legged
frog breeding sites annually.
Re-evaluate Habitat Quality and Species
Presence within RLF Breeding Sites
M§13.6.2.1-3 Revisit all potential sites identified
during the initial distribution study,
as well as other new sites
identified, every 5 years to assess
which species are present and if
red-legged frogs are expanding in
range.
Monitor habitat quality of potential
red-legged frog breeding sites
every 5 years.
Mendocino Redwood Company HCP/NCCP
13-31
Aquatic Effectiveness and Validation Monitoring Programs
Monitoring Program Description Monitoring Code Timing
Baseline Distribution of Coastal Tailed
Frogs
M§13.6.3.1-1
Complete distribution study for
coastal tailed frogs within 2 years
of HCP/NCCP implementation.
Distribution and Relative Abundance of
Coastal Tailed Frogs
M§13.6.3.1-2 Monitor for the presence, probable
absence, and relative abundance of
coastal tailed frogs at 10 sites
annually.
Monitor all occupied streams about
every 8 years.
Anadromous Salmonid Distribution
M§13.6.1.1-2 Assess distribution annually for 3
consecutive years and, thereafter,
every 12 years—throughout 450
sites.
Chinook Salmon Monitoring Reaches
(CSMR)
M§13.6.1.1-3
Monitor for the presence and
relative abundance of
Chinook salmon in 4
Chinook Salmon Monitoring
Reaches (CSMR) annually.
Smolt Abundance M§13.6.1.2-1 Collect data on smolt
abundance annually, rotating
between 2 focus watersheds
every 3 years.
13.4.1 Watershed analysis within aquatic monitoring
Watershed analysis provides baseline information for many of our conservation measures. An
initial watershed analysis will not change or alter proposed conservation measures; however,
future watershed analyses that feed data into the adaptive management process may bring about
changes in both the conservation measures and monitoring programs of our HCP/NCCP. If such
changes are outside of the limits of allowable change, they will require either a major amendment
or minor modification to our HCP/NCCP, depending on the magnitude of the change.
MRC will re-visit watershed analysis, in its entirety, approximately every 20 years. There will be
a total of 4 watershed analyses per watershed analysis unit—1 initial watershed analysis and 3 re-
visits over the life of our HCP/NCCP. When proposing new methods, MRC will ensure their
comparability with previous watershed analyses.
MRC will provide the agencies with module methods, hypotheses to be tested, and level of
sampling. In consultation with the wildlife agencies, MRC may adapt priorities for road repair,
determine new restoration actions, and alter monitoring or conservation measures through
watershed analysis. Conservation measures revised through monitoring efforts, such as watershed
analysis, will provide the same protection as standard conservation measures. This includes
conservation measures with limits of allowable change (Table 13-9 through Table 13-11 13-12).
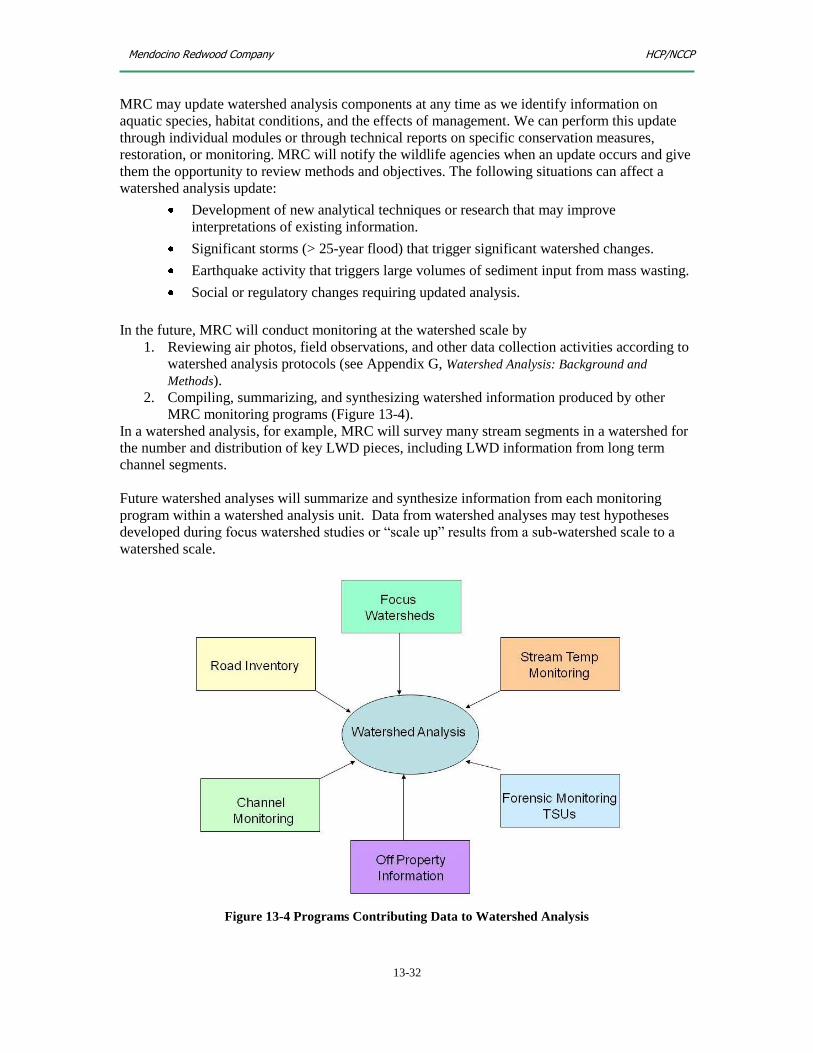
Mendocino Redwood Company HCP/NCCP
13-32
MRC may update watershed analysis components at any time as we identify information on
aquatic species, habitat conditions, and the effects of management. We can perform this update
through individual modules or through technical reports on specific conservation measures,
restoration, or monitoring. MRC will notify the wildlife agencies when an update occurs and give
them the opportunity to review methods and objectives. The following situations can affect a
watershed analysis update:
Development of new analytical techniques or research that may improve
interpretations of existing information.
Significant storms (> 25-year flood) that trigger significant watershed changes.
Earthquake activity that triggers large volumes of sediment input from mass wasting.
Social or regulatory changes requiring updated analysis.
In the future, MRC will conduct monitoring at the watershed scale by
1. Reviewing air photos, field observations, and other data collection activities according to
watershed analysis protocols (see Appendix G, Watershed Analysis: Background and
Methods).
2. Compiling, summarizing, and synthesizing watershed information produced by other
MRC monitoring programs (Figure 13-4).
In a watershed analysis, for example, MRC will survey many stream segments in a watershed for
the number and distribution of key LWD pieces, including LWD information from long term
channel segments.
Future watershed analyses will summarize and synthesize information from each monitoring
program within a watershed analysis unit. Data from watershed analyses may test hypotheses
developed during focus watershed studies or ―scale up‖ results from a sub-watershed scale to a
watershed scale.
Figure 13-4 Programs Contributing Data to Watershed Analysis

Mendocino Redwood Company HCP/NCCP
13-33
13.4.2 Focus watershed studies
By monitoring focus watersheds, MRC can evaluate water quality and species response at the site
scale and the watershed scale. After assessing management impacts in the focus watersheds, we
can apply lessons learned to other areas of our land where property-wide monitoring programs
indicate similar conditions and problems occur. Experiential knowledge will come from
watershed analysis, long term channel monitoring, suspended sediment and turbidity monitoring,
road inventory, timber inventory, distribution studies of anadromous salmonid, and stream
temperature monitoring.
At first, we will assume that our proposed conservation measures will improve water quality and
species habitat. This may not be the case; watershed conditions may remain the same or even
degrade. Controlling all the erosion from culverts in a sub-watershed, for example, may not result
in measurements of reduced fine sediment in spawning gravel. The reasons could be in our
assumptions, such as duration of lag effects, or in our implementation of the conservation
measures. Studies in the focus watersheds, such as those for suspended sediment monitoring,
need to determine (1) the relationship between land management practices and water quality
responses and (2) how we measure that relationship. MRC will create detailed protocols for the
focus watershed studies within 1 year of the signing of our HCP/NCCP so that studies are
repeatable and verifiable. The format for the protocols will follow the guidelines developed by
Oakley et al. (2003) in Guidelines for Long-term Monitoring Protocols. Of course, as new
knowledge and methods arise within the scientific community, MRC will ask new questions and
design new studies within the monitoring programs—all with the assistance of the wildlife
agencies and the North Coast Regional Water Quality Control Board.
Within 40 years of HCP/NCCP implementation, MRC will meet our commitments for all of the
controllable erosion associated with high and moderate sites based on the initial road inventory.
In addition, we will improve watershed conditions through stream and upslope restoration such as
road maintenance and reconstruction; LWD placement; riparian restoration harvests; road
decommissioning; and upslope canopy retention. Results from focus watershed studies will show
us which, if any, of these restoration activities enhances or degrades watershed conditions. Armed
with that information, we can, as we said earlier, apply these restoration activities to areas outside
of the focus watersheds based on the data collected there from watershed analysis.
MRC has designated 4 areas for focus watershed studies that represent a range of topographic,
environmental, and regulatory conditions on our land (Table 13-14). Each represents both a large
proportion of the plan area and a range of conditions; as a result, we can ensure that monitoring
evaluates the effects of our management decisions and practices. All of the focus watersheds are
also CalWater planning watersheds—Cottaneva Creek, South Fork Albion River, Little North
Fork Navarro, and Upper Elk Creek. Located within the Franciscan geologic region of the
coastal belt, these 4 areas consist of a complex mixture of terrains and rock types with no single
component dominating the landscape. From a geological perspective, therefore, the focus
watersheds are not easily distinguishable from each other and from other watersheds in the plan
area.
Two of the focus watersheds, Little North Fork Navarro and South Fork Albion, will receive
intensive monitoring. Both areas are within watersheds listed as ―sediment impaired‖ by Section
303(d) of the Clean Water Act; Little North Fork Navarro is also in a watershed that is
―temperature impaired.‖ The two watersheds provide contrasting forest and climate conditions.
South Fork Albion is closer to the Pacific Ocean, with cooler air and water temperatures; it has
forest stand conditions that would be desirable across the plan area. On the other hand, Little

Mendocino Redwood Company HCP/NCCP
13-34
North Fork Navarro has warmer air and water temperatures and is a younger forest. Little North
Fork Navarro also has a moderate amount of hardwood stands; they will require more intense
rehabilitation harvests in the short term, i.e., variable retention or transition treatments. All the
focus areas are convenient for personnel with equipment to perform studies.
Upper Elk Creek and Cottaneva Creek represent, respectively, the southern and northern portions
of the plan area. Upper Elk Creek has forest type, climate, and topographic environment of
coastal watersheds in the southern portion of the plan area. MRC completely owns Cottaneva
Creek, which has coho salmon, steelhead, and coastal tailed frogs. The forest stands in South
Fork Cottaneva Creek are a mix of young forests with conditions similar throughout much of the
plan area. This area receives, on average, much higher amounts of rainfall than the remainder of
MRC forests and contains streams with suitable water temperatures for the aquatic species
present.
Table 13-14 Focus Areas for Aquatic Monitoring
Focus Area Watershed
(ac)
Plan
Area
(ac)
% Plan
Area
Covered Aquatic
Species Present Regulatory Issues
Designated Areas
South Fork
Albion River
5830 4696 80.5% Coho salmon, steelhead,
red-legged frog
Central ESU, Sediment
TMDL
Little North
Fork Navarro
7085 6423 90.6% Coho salmon, steelhead,
red-legged frog
Central ESU, Sediment
TMDL, Temperature
TMDL
Upper Elk
Creek
9894 9136 92.3% Coho salmon, steelhead,
red-legged frog, coastal
tailed frog
Central ESU
South Fork
Cottaneva
3425 3425 100% Coho salmon, steelhead,
coastal tailed frog
Central ESU
13.4.3 Additions and deletions of land
At the commencement of the HCP/NCCP, the plan area consists of 213, 244 ac and 4 designated
focus watersheds (Table 13-14). In the ensuing years, additions and deletions of land to the plan
area may adjust both these numbers. If the plan area expands to 240,000 ac or more, MRC will
add 1 additional focus watershed. If the plan area shrinks to 186,000 ac or less, MRC will
subtract 1 focus watershed. During the entire term of our HCP/NCCP, the maximum number of
focus watersheds in the plan area will be 5; the minimum number, 3. MRC will consult with the
wildlife agencies and Water Quality if land purchases or sales necessitate the addition or deletion
of a focus watershed. The decision to locate a new focus watershed within the plan area will
weigh how well the proposed area ―fits‖ within the study profile outlined above.
13.4.4 Long term channel monitoring
The long term channel monitoring program has essentially the same protocol as the focus
watershed studies for LWD, canopy, stream channel profiles, permeability, V-star, and pebble
counts. In long term channel monitoring, however, there is a longer period between sampling and
a broader coverage across the plan area. The purpose of its data collection is to
Draw conclusions about long-term processes through the monitoring of permanent
stations.

Mendocino Redwood Company HCP/NCCP
13-35
Supplement watershed analysis data.
Track, across the plan area, the status of watershed‖ health‖ with knowledge from the
focus watershed studies.
13.4.5 Timeline for aquatic monitoring
During the first 2 years of our HCP/NCCP, MRC will determine the initial distribution of
amphibians, refining detailed protocols for the monitoring programs and completing our first
watershed analysis. MRC will then start the focus watershed studies. These will continue for
several years with interruptions for anadromous salmonid distribution, long-term channel
monitoring, and amphibian monitoring. Throughout this whole process, we will conduct pre-
project (or baseline) monitoring in areas designated for restoration harvests. After approximately
20 years, MRC will weigh the results and re-evaluate the timing of the monitoring programs in
consultation with the wildlife agencies. All of the aquatic monitoring programs require
significant resources for implementation, including personnel and equipment. Table 13-15
provides an estimated timeline for the first 20 years of the aquatic monitoring programs.
Generally, monitoring programs in subsequent years of the plan will recycle through this initial
20-year schedule.
13.5 Monitoring aquatic habitat
MRC has proposed and developed some of the study designs for monitoring aquatic habitat under
our HCP/NCCP. During the first 3 years of our HCP/NCCP, we will complete all outstanding
study designs for aquatic monitoring.
Habitat monitoring falls into 4 major categories: (1) riparian function; (2) mass wasting; (3)
surface erosion; and (4) instream sediment. Within these categories are monitoring programs or
portions of programs that measure specific goals and objectives.
The term segment appears in 3 of our aquatic monitoring programs—watershed analysis, long-
term channel monitoring, and focus watershed studies. A segment is typically 20-30 bankfull
widths in length, i.e., roughly 300-1500 ft for most streams in the plan area.
In selecting segments for field observation, the GIS and science staff at MRC first stratify the
watercourses within each planning watershed (more specifically, within each watershed analysis
unit to be analyzed) by confinement and slope. They then choose segments for field observation
based on numerous factors, including location within the watershed, potential fish habitat, stream
temperature monitoring locations, and level of effort. MRC does not select segments for field
observation that are over 20% in gradient. While we assume such segments do not provide fish
habitat, we occasionally sample them for amphibians. Each planning watershed will have
anywhere from 3 to 30 field-observed segments, depending upon how much of the planning
watershed MRC owns. Segments for long-term channel monitoring and focus watershed studies
are typically selected from the field observed segments in watershed analysis. Appendix G,
Watershed Analysis: Background and Methods, provides details on MRC sampling efforts and
intensity.
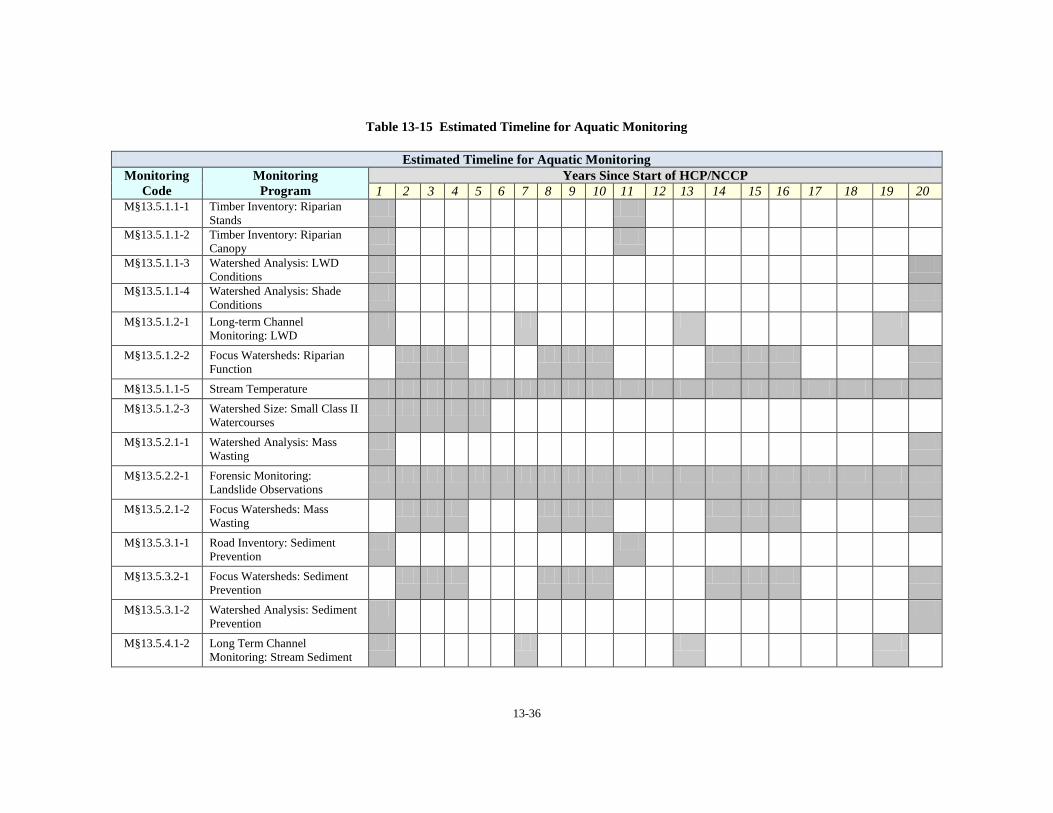
13-36
Table 13-15 Estimated Timeline for Aquatic Monitoring
Estimated Timeline for Aquatic Monitoring
Monitoring
Code
Monitoring
Program Years Since Start of HCP/NCCP
1 2 3 4 5 6 7 8 9 10 11 12 13 14 15 16 17 18 19 20 M§13.5.1.1-1 Timber Inventory: Riparian
Stands
M§13.5.1.1-2 Timber Inventory: Riparian
Canopy
M§13.5.1.1-3 Watershed Analysis: LWD
Conditions
M§13.5.1.1-4 Watershed Analysis: Shade
Conditions
M§13.5.1.2-1 Long-term Channel
Monitoring: LWD
M§13.5.1.2-2 Focus Watersheds: Riparian
Function
M§13.5.1.1-5 Stream Temperature
M§13.5.1.2-3 Watershed Size: Small Class II
Watercourses
M§13.5.2.1-1 Watershed Analysis: Mass
Wasting
M§13.5.2.2-1 Forensic Monitoring:
Landslide Observations
M§13.5.2.1-2 Focus Watersheds: Mass
Wasting
M§13.5.3.1-1 Road Inventory: Sediment
Prevention
M§13.5.3.2-1 Focus Watersheds: Sediment
Prevention
M§13.5.3.1-2 Watershed Analysis: Sediment
Prevention
M§13.5.4.1-2 Long Term Channel
Monitoring: Stream Sediment

13-37
Estimated Timeline for Aquatic Monitoring
Monitoring
Code
Monitoring
Program Years Since Start of HCP/NCCP
1 2 3 4 5 6 7 8 9 10 11 12 13 14 15 16 17 18 19 20
M§13.5.4.1-3 Focus Watersheds: Stream
Sediment
M§13.5.4.1-1 Focus Watersheds: Sediment
Budget
M§13.6.2.1-1
Baseline Distribution and
Habitat Quality of Red-legged
Frogs Breeding Sites
M§13.6.2.1-2 Occupancy of Red-Legged
Frogs in Documented Breeding Sites
M§13.6.2.1-3 Re-evaluate Habitat Quality
and Species Presence within
Red-legged Frogs Breeding
Sites
M§13.6.3.1-1
Baseline Distribution of
Coastal Tailed Frogs
M§13.5.5.1-1 Water Drafting
M§13.5.5.2-1 Water Drafting
M§13.6.3.1-2 Distribution and Relative
Abundance of Coastal Tailed
Frogs
M§13.6.1.1-1 Anadromous Salmonid
Presence: ASMB
M§13.6.1.1-3 Chinook Salmon Monitoring
Reaches (CSMR)
M§13.6.1.1-2 Anadromous Salmonid
Distribution
M§13.6.1.2-1 Smolt abundance TABLE NOTES Most monitoring programs are on-going (i.e., occurring every year), but the shaded cells indicate the years that the program will re-visit the same location.

Mendocino Redwood Company HCP/NCCP
13-38
13.5.1 Riparian function
MRC will use 7 monitoring programs to determine if our biological goals and objectives for
riparian function are being met: (1) riparian stand; (2) riparian canopy; (3) watershed analysis of
LWD conditions; (4) LWD conditions in long-term monitoring segments; (5) riparian function in
focus watershed studies; (6) stream temperature; (7) watershed size for Small Class II
watercourses.
13.5.1.1 Effectiveness monitoring
Riparian stands
Effectiveness Monitoring
Timber Inventory: Riparian Stands
PROGRAM CODE M§13.5.1.1-1
O§8.2.2-1 Develop and maintain Class I and Large Class II AMZs with large, dense
conifer trees based on targets for basal area and size distribution.
MONITORING APPROACH
MRC conducts inventory on a continuous basis. At any point in time,
MRC will sample about 10% of our forested acres. Once a sample plot is
10 years old, we archive the existing data and acquire new data. We will
incrementally sample more AMZs stands over the term of our HCP/NCCP
because of their unique vegetation strata and other monitoring
requirements. All the sample data on basal area, trees per acre, board foot
volume, and habitat conditions, we incorporate into our landscape model.
See Appendix U, Inventory Strategy, for further details.
MEASUREMENT CRITERIA
Tables 8-5 through 8-8 show the targets for basal area and tree height.
More than 45% of vegetation strata in AMZs should be conifer/hardwood
or conifer-dominated within 40 years of HCP/NCCP initiation, followed
by non-decreasing percentages.
More than 90% of vegetation strata in AMZs should be conifer/hardwood
or conifer-dominated 80 years after HCP/NCCP initiation.
ADAPTIVE MANAGEMENT
MRC will review the status of riparian stands at Years 30 and 70 of
HCP/NCCP implementation to determine if we are meeting our targets on
schedule.
MRC will examine the causes of deviation if we are not meeting our
targets for AMZ characteristics.
MRC may re-vegetate certain areas with poor AMZ conditions such as
abandoned landings or streamside roads.
MRC has defined the AMZ conservation measures subject to change
through the adaptive management process (Table 13-8).
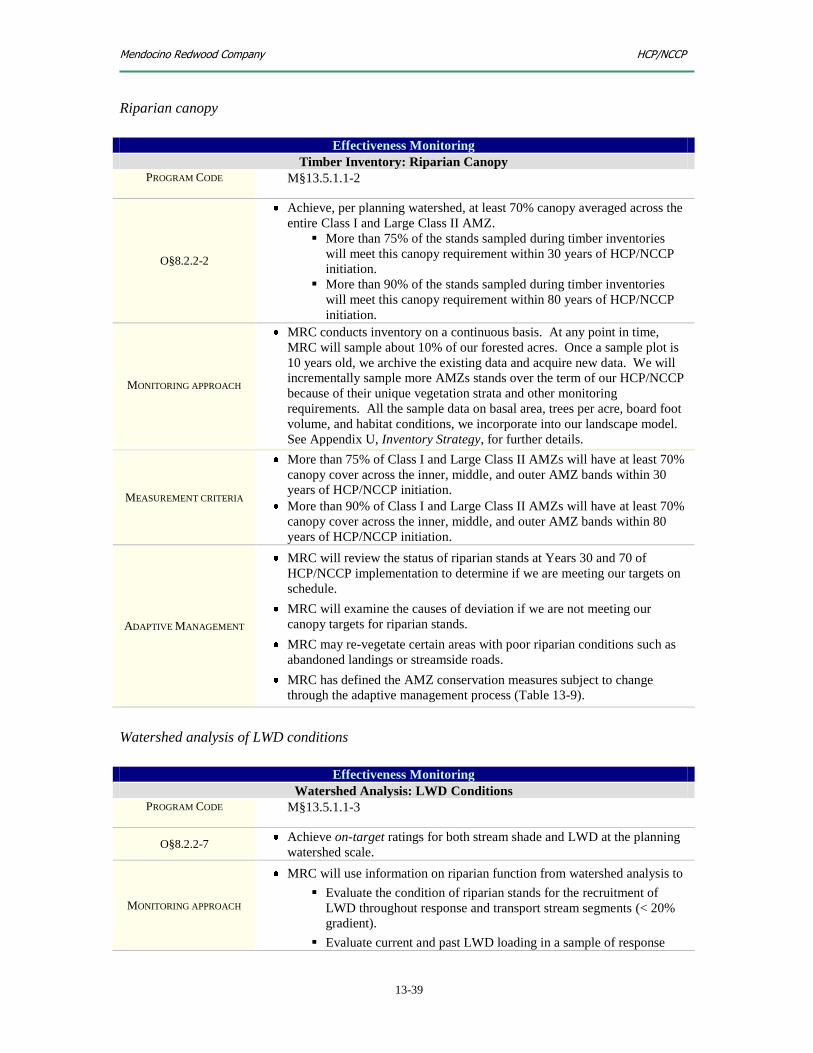
Mendocino Redwood Company HCP/NCCP
13-39
Riparian canopy
Effectiveness Monitoring
Timber Inventory: Riparian Canopy
PROGRAM CODE M§13.5.1.1-2
O§8.2.2-2
Achieve, per planning watershed, at least 70% canopy averaged across the
entire Class I and Large Class II AMZ.
More than 75% of the stands sampled during timber inventories
will meet this canopy requirement within 30 years of HCP/NCCP
initiation.
More than 90% of the stands sampled during timber inventories
will meet this canopy requirement within 80 years of HCP/NCCP
initiation.
MONITORING APPROACH
MRC conducts inventory on a continuous basis. At any point in time,
MRC will sample about 10% of our forested acres. Once a sample plot is
10 years old, we archive the existing data and acquire new data. We will
incrementally sample more AMZs stands over the term of our HCP/NCCP
because of their unique vegetation strata and other monitoring
requirements. All the sample data on basal area, trees per acre, board foot
volume, and habitat conditions, we incorporate into our landscape model.
See Appendix U, Inventory Strategy, for further details.
MEASUREMENT CRITERIA
More than 75% of Class I and Large Class II AMZs will have at least 70%
canopy cover across the inner, middle, and outer AMZ bands within 30
years of HCP/NCCP initiation.
More than 90% of Class I and Large Class II AMZs will have at least 70%
canopy cover across the inner, middle, and outer AMZ bands within 80
years of HCP/NCCP initiation.
ADAPTIVE MANAGEMENT
MRC will review the status of riparian stands at Years 30 and 70 of
HCP/NCCP implementation to determine if we are meeting our targets on
schedule.
MRC will examine the causes of deviation if we are not meeting our
canopy targets for riparian stands.
MRC may re-vegetate certain areas with poor riparian conditions such as
abandoned landings or streamside roads.
MRC has defined the AMZ conservation measures subject to change
through the adaptive management process (Table 13-9).
Watershed analysis of LWD conditions
Effectiveness Monitoring
Watershed Analysis: LWD Conditions
PROGRAM CODE M§13.5.1.1-3
O§8.2.2-7 Achieve on-target ratings for both stream shade and LWD at the planning
watershed scale.
MONITORING APPROACH
MRC will use information on riparian function from watershed analysis to
Evaluate the condition of riparian stands for the recruitment of
LWD throughout response and transport stream segments (< 20%
gradient).
Evaluate current and past LWD loading in a sample of response

Mendocino Redwood Company HCP/NCCP
13-40
Effectiveness Monitoring
Watershed Analysis: LWD Conditions
and transport stream segments.
Rate watercourse LWD quality, tracked by planning watershed.
MRC describes the methods for evaluating LWD recruitment in Appendix
G, Watershed Analysis: Background and Methods (section G.3.3.2).
MEASUREMENT CRITERIA See Appendix S, Targets for LWD and Effective Shade.
ADAPTIVE MANAGEMENT
MRC will examine the causes of deviation if we are not meeting our LWD
targets.
MRC may place LWD in streams or increase large tree retention within
AMZ and mass wasting areas, if we are not meeting our targets for LWD
recruitment rates.
MRC has defined the riparian conservation measures subject to change
through the adaptive management process (Table 13-9).
Watershed analysis of shade conditions
Effectiveness Monitoring
Watershed Analysis: Shade Conditions
PROGRAM CODE M§13.5.1.1-4
O§8.2.2-7 Achieve on-target ratings for both stream shade and LWD at the planning
watershed scale.
MONITORING APPROACH
MRC will use information on riparian function from watershed analysis to
Determine the average percent shade (measured with a solar
pathfinder) for selected streams within each planning watershed
Assess effective shade conditions at the planning watershed level
based on the number of stream segments that meet the effective
shade targets.6
MRC describes the methods for evaluating stream shade in Appendix G,
Watershed Analysis: Background and Methods (section G.3.3.3).
MEASUREMENT CRITERIA See Appendix S, Targets for LWD and Effective Shade.
ADAPTIVE MANAGEMENT
MRC will examine the causes of deviation if we are not meeting our
instream canopy targets.
MRC may re-vegetate certain areas with poor riparian conditions such as
abandoned landings or streamside roads.
MRC has defined the riparian conservation measures subject to change
through the adaptive management process (Table 13-9).
6 Effective shade is dependent upon bankfull width and includes analysis of instream water temperature.

Mendocino Redwood Company HCP/NCCP
13-41
Stream temperature
Effectiveness Monitoring
Stream Temperature
PROGRAM CODE M§13.5.1.1-5
OBJECTIVE
O§8.2.2-6 Decrease summer water temperatures, where possible, to manage for
temperatures at or below MWMT targets for covered species (see the
Water Quality Control Plan for the North Coast Region, i.e., the Basin
Plan).
MONITORING APPROACH
MRC will monitor stream temperatures, from approximately May to
October, in 139 sites (HCP/NCCP Atlas MAPS 3A-C).
MRC will monitor all watercourses on our land where coho salmon are
known to be present.
MRC will monitor at least 1 Large Class II watercourse in each CalWater
planning watershed with coastal tailed frogs present.
MRC will attempt to capture a range of Class II stream sizes and locations
across our land when selecting Large Class II monitoring sites.
MRC will monitor air temperature at 1 or more monitoring sites in every
inventory block to assist in interpretation of stream temperatures.
MRC will monitor the effects of restoration harvests on stream
temperatures in the focus watersheds using 2 sources: (1) annual stream
temperatures collected at permanent monitoring sites; and (2) stream
temperatures collected at restoration harvests.
MRC will phase in restoration harvests based on monitoring results and
consultation with the wildlife agencies.
MEASUREMENT CRITERIA
MRC will use MWMT and MWAT derived from continuous electronic
temperature recorders with measurements taken at least every 30 minutes.
We will place the stream temperature recorders in shallow pools (< 1 m in
depth) directly downstream of riffles and out of direct sunlight. Placement
of temperature recorders will be in locations where water is adequately
mixed and unlikely to evaporate during the annual monitoring period.
Each data recorder will be held in place with a piece of rebar, or concrete
reinforcing rod, driven into the substrate.
MRC will perform accuracy tests on all temperature data recorders for pre-
and post-data recording activities. We will test the accuracy of the
temperature data recorders by placing the equipment in an ice and room
temperature bath for at least 4 hours. Temperature readings recorded by
the data recorder will be compared with temperature readings from a
certified reference thermometer placed in the same medium in the bucket.
MRC will interpret results using the manufacturer’s suggested allowable
error for the instrument.
MRC will monitor stream temperatures both upstream (or nearby) and
downstream of AMZ restoration harvests, in
Streams where MRC predicts direct shade to be lower than pre-
harvest conditions by more than 10%.
Streams that do not meet stream temperature targets.
Streams that contribute flow to other streams that exceed the
targets.
MRC will make the following observations while monitoring restoration
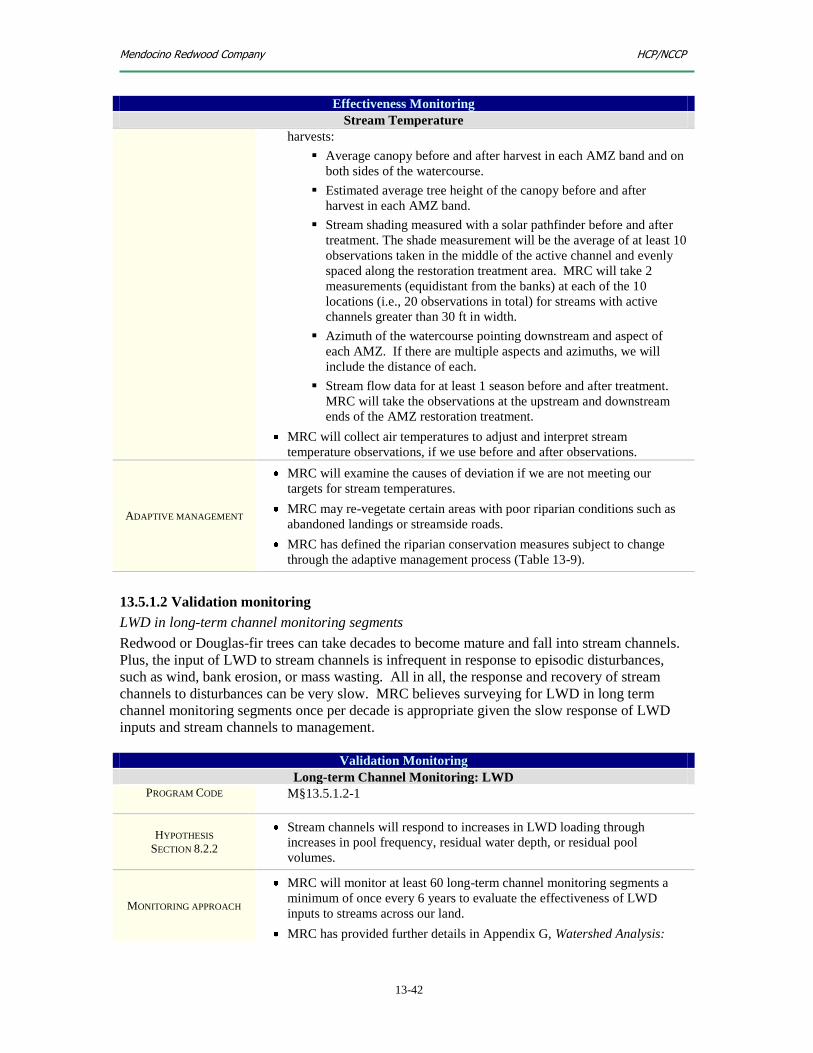
Mendocino Redwood Company HCP/NCCP
13-42
Effectiveness Monitoring
Stream Temperature
harvests:
Average canopy before and after harvest in each AMZ band and on
both sides of the watercourse.
Estimated average tree height of the canopy before and after
harvest in each AMZ band.
Stream shading measured with a solar pathfinder before and after
treatment. The shade measurement will be the average of at least 10
observations taken in the middle of the active channel and evenly
spaced along the restoration treatment area. MRC will take 2
measurements (equidistant from the banks) at each of the 10
locations (i.e., 20 observations in total) for streams with active
channels greater than 30 ft in width.
Azimuth of the watercourse pointing downstream and aspect of
each AMZ. If there are multiple aspects and azimuths, we will
include the distance of each.
Stream flow data for at least 1 season before and after treatment.
MRC will take the observations at the upstream and downstream
ends of the AMZ restoration treatment.
MRC will collect air temperatures to adjust and interpret stream
temperature observations, if we use before and after observations.
ADAPTIVE MANAGEMENT
MRC will examine the causes of deviation if we are not meeting our
targets for stream temperatures.
MRC may re-vegetate certain areas with poor riparian conditions such as
abandoned landings or streamside roads.
MRC has defined the riparian conservation measures subject to change
through the adaptive management process (Table 13-9).
13.5.1.2 Validation monitoring
LWD in long-term channel monitoring segments
Redwood or Douglas-fir trees can take decades to become mature and fall into stream channels.
Plus, the input of LWD to stream channels is infrequent in response to episodic disturbances,
such as wind, bank erosion, or mass wasting. All in all, the response and recovery of stream
channels to disturbances can be very slow. MRC believes surveying for LWD in long term
channel monitoring segments once per decade is appropriate given the slow response of LWD
inputs and stream channels to management.
Validation Monitoring
Long-term Channel Monitoring: LWD
PROGRAM CODE M§13.5.1.2-1
HYPOTHESIS
SECTION 8.2.2
Stream channels will respond to increases in LWD loading through
increases in pool frequency, residual water depth, or residual pool
volumes.
MONITORING APPROACH
MRC will monitor at least 60 long-term channel monitoring segments a
minimum of once every 6 years to evaluate the effectiveness of LWD
inputs to streams across our land.
MRC has provided further details in Appendix G, Watershed Analysis:
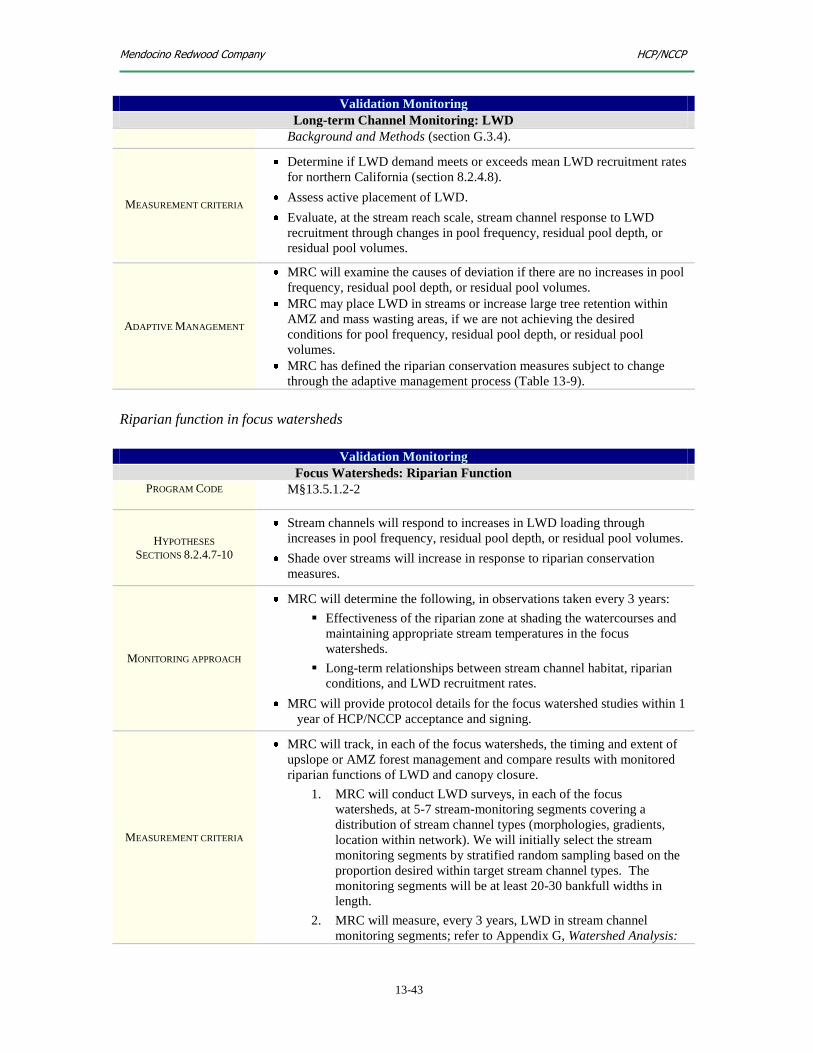
Mendocino Redwood Company HCP/NCCP
13-43
Validation Monitoring
Long-term Channel Monitoring: LWD
Background and Methods (section G.3.4).
MEASUREMENT CRITERIA
Determine if LWD demand meets or exceeds mean LWD recruitment rates
for northern California (section 8.2.4.8).
Assess active placement of LWD.
Evaluate, at the stream reach scale, stream channel response to LWD
recruitment through changes in pool frequency, residual pool depth, or
residual pool volumes.
ADAPTIVE MANAGEMENT
MRC will examine the causes of deviation if there are no increases in pool
frequency, residual pool depth, or residual pool volumes.
MRC may place LWD in streams or increase large tree retention within
AMZ and mass wasting areas, if we are not achieving the desired
conditions for pool frequency, residual pool depth, or residual pool
volumes.
MRC has defined the riparian conservation measures subject to change
through the adaptive management process (Table 13-9).
Riparian function in focus watersheds
Validation Monitoring
Focus Watersheds: Riparian Function
PROGRAM CODE M§13.5.1.2-2
HYPOTHESES
SECTIONS 8.2.4.7-10
Stream channels will respond to increases in LWD loading through
increases in pool frequency, residual pool depth, or residual pool volumes.
Shade over streams will increase in response to riparian conservation
measures.
MONITORING APPROACH
MRC will determine the following, in observations taken every 3 years:
Effectiveness of the riparian zone at shading the watercourses and
maintaining appropriate stream temperatures in the focus
watersheds.
Long-term relationships between stream channel habitat, riparian
conditions, and LWD recruitment rates.
MRC will provide protocol details for the focus watershed studies within 1
year of HCP/NCCP acceptance and signing.
MEASUREMENT CRITERIA
MRC will track, in each of the focus watersheds, the timing and extent of
upslope or AMZ forest management and compare results with monitored
riparian functions of LWD and canopy closure.
1. MRC will conduct LWD surveys, in each of the focus
watersheds, at 5-7 stream-monitoring segments covering a
distribution of stream channel types (morphologies, gradients,
location within network). We will initially select the stream
monitoring segments by stratified random sampling based on the
proportion desired within target stream channel types. The
monitoring segments will be at least 20-30 bankfull widths in
length.
2. MRC will measure, every 3 years, LWD in stream channel
monitoring segments; refer to Appendix G, Watershed Analysis:
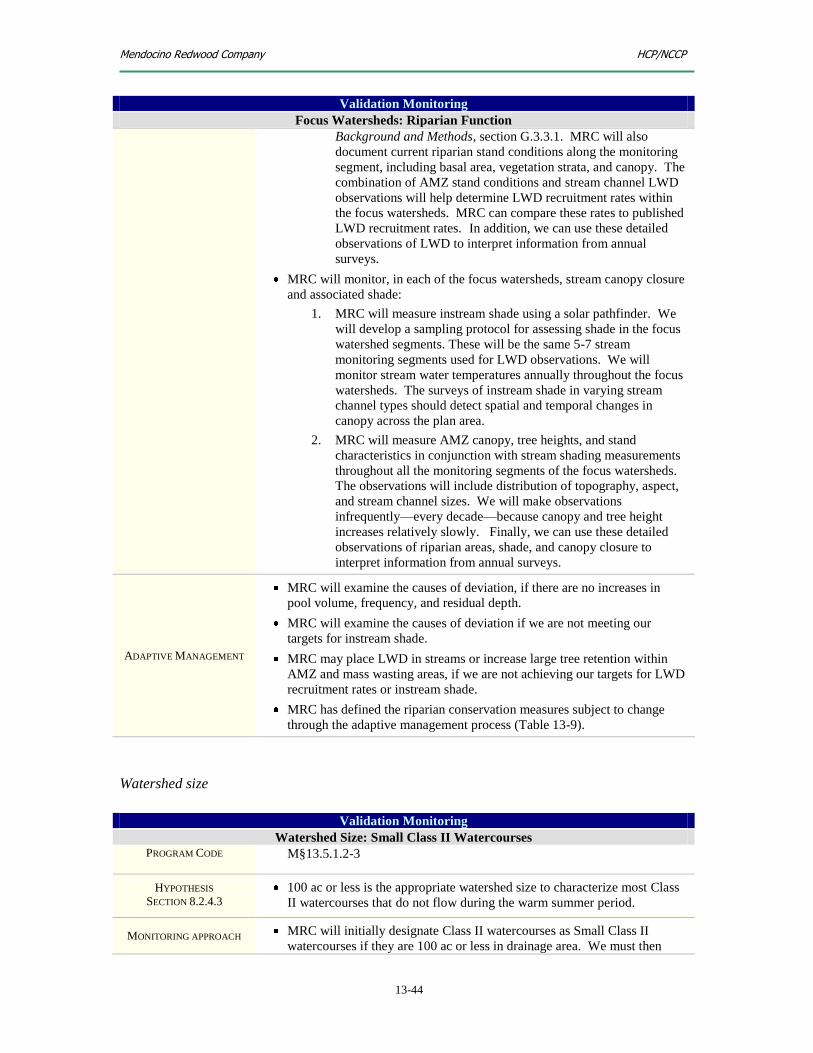
Mendocino Redwood Company HCP/NCCP
13-44
Validation Monitoring
Focus Watersheds: Riparian Function
Background and Methods, section G.3.3.1. MRC will also
document current riparian stand conditions along the monitoring
segment, including basal area, vegetation strata, and canopy. The
combination of AMZ stand conditions and stream channel LWD
observations will help determine LWD recruitment rates within
the focus watersheds. MRC can compare these rates to published
LWD recruitment rates. In addition, we can use these detailed
observations of LWD to interpret information from annual
surveys.
MRC will monitor, in each of the focus watersheds, stream canopy closure
and associated shade:
1. MRC will measure instream shade using a solar pathfinder. We
will develop a sampling protocol for assessing shade in the focus
watershed segments. These will be the same 5-7 stream
monitoring segments used for LWD observations. We will
monitor stream water temperatures annually throughout the focus
watersheds. The surveys of instream shade in varying stream
channel types should detect spatial and temporal changes in
canopy across the plan area.
2. MRC will measure AMZ canopy, tree heights, and stand
characteristics in conjunction with stream shading measurements
throughout all the monitoring segments of the focus watersheds.
The observations will include distribution of topography, aspect,
and stream channel sizes. We will make observations
infrequently—every decade—because canopy and tree height
increases relatively slowly. Finally, we can use these detailed
observations of riparian areas, shade, and canopy closure to
interpret information from annual surveys.
ADAPTIVE MANAGEMENT
MRC will examine the causes of deviation, if there are no increases in
pool volume, frequency, and residual depth.
MRC will examine the causes of deviation if we are not meeting our
targets for instream shade.
MRC may place LWD in streams or increase large tree retention within
AMZ and mass wasting areas, if we are not achieving our targets for LWD
recruitment rates or instream shade.
MRC has defined the riparian conservation measures subject to change
through the adaptive management process (Table 13-9).
Watershed size
Validation Monitoring
Watershed Size: Small Class II Watercourses
PROGRAM CODE M§13.5.1.2-3
HYPOTHESIS
SECTION 8.2.4.3
100 ac or less is the appropriate watershed size to characterize most Class
II watercourses that do not flow during the warm summer period.
MONITORING APPROACH MRC will initially designate Class II watercourses as Small Class II
watercourses if they are 100 ac or less in drainage area. We must then

Mendocino Redwood Company HCP/NCCP
13-45
Validation Monitoring
Watershed Size: Small Class II Watercourses
determine if this is the appropriate watershed size so that AMZ
management does not increase water temperature (MWMT). We will
address the watershed size at which a significant number (i.e., > 20%) of
Small Class II watercourses retain year-round surface water.
MRC will determine watershed size for Small Class II watercourses with
year-round surface water by evaluating adjacent and upslope areas post-
harvest to determine if watershed size needs to be adjusted because of
increased surface flows.
MRC will complete its initial examination of Small Class II watersheds for
significant surface water within the first 5 years of our HCP/NCCP,
depending on annual flow conditions.
MEASUREMENT CRITERIA
MRC will map all watersheds to identify the point at which Small Class II
watercourse size is ≤ 150 ac. From these maps, MRC will randomly select
20% of the watercourses that have not experienced recent upslope timber
harvest (i.e., within the last 10 years) for observation within each
CalWater planning watershed.
MRC will monitor the selected watercourses in July to determine if there
is significant surface water. Significant surface water covers at least 25%
of channel length in 100 ft sections with water depth ≥ 0.05 ft (.02m). We
will measure the extent of significant surface water when both the first and
second 100-ft section furthest upstream fails to meet this definition. This
criterion is dependent upon natural water sources and not anthropogenic
sources of flow such as ditch relief culverts.
MRC will map the extent of significant surface water within a watershed
and record the date.
MRC recognizes that observations of significant surface water flow
will likely vary based on the amount of precipitation. In very wet
years, streams that do not flow in dry years may flow all year in
small watersheds.
MRC will not attempt to map significant surface water in Small
Class II watersheds in years with high or low summer stream flow.
Low or high summer stream flow is a 33% deviation from the
average stream flow observation at the South Fork Caspar Creek
stream-flow gage on July 1. In 2005 based on observations from
1963-1995, the average stream flow for July 1 for the South Fork
Caspar Creek was 0.34 ft3 per second. Based on this average value,
in years with less than 0.23 cfs or more than 0.44 cfs of stream
flow, MRC will not conduct monitoring. If observations cannot be
made in successive years, MRC may extend the length of time
needed to complete the initial examination of Small Class II
watersheds—estimated at 5 years—by the number of years
measurements could not be taken.
MRC will re-evaluate the sites sampled in the initial 5-year effort to
determine if the extent of significant surface flow has increased; this will
take place in late summer, at approximately the same date as the pre-
project sampling and following the first winter after harvest.
If there is significant surface water, MRC will map its extent
within the Small Class II watershed and record the date.
If there is not significant surface water, MRC will note the date of
observation and watershed size.

Mendocino Redwood Company HCP/NCCP
13-46
Validation Monitoring
Watershed Size: Small Class II Watercourses
MRC will survey 20% of Small Class II watercourses to determine their
appropriate watershed size.
ADAPTIVE MANAGEMENT
MRC will increase the upper size limit for Small Class II watercourses if
significant surface water does not occur in watersheds between 100 and
150 ac.
MRC will decrease the designated watershed size for Small Class II
watercourses if data indicates that significant surface water occurs in
watersheds of an average size of less than 100 ac.
MRC has defined the riparian conservation measures subject to change
through the adaptive management process (Table 13-9).
13.5.2 Mass wasting
MRC will address sediment delivery from mass wasting through
Observations in watershed analysis.
Incidental landslide observations by MRC foresters.
Forensic monitoring by a forensic geologist after forest harvest operations.
Focus watershed studies.
13.5.2.1 Effectiveness monitoring
Mass wasting observations in watershed analysis
Effectiveness Monitoring
Watershed Analysis: Mass Wasting
PROGRAM CODE M§13.5.2.1-1
OBJECTIVES
O§8.3.2-1
O§8.3.2-2
Reduce, by year 40 of our HCP/NCCP, sediment delivery from mass
wasting unrelated to roads by at least 10% of the rate (tons/mi2/year)
determined in the initial watershed analyses or established in TMDL load
allocation reductions.
Reduce, within the 80-year timeframe of our HCP/NCCP, sediment
delivery from mass wasting unrelated to roads by at least 20% of the rate
(tons/mi2/year) determined in the initial watershed analyses or established
in TMDL load allocation reductions.
MONITORING APPROACH
MRC will establish baselines using the initial data from watershed
analysis (see Appendix G, G.2.1.10, MRC methods for estimating sediment
input from mass wasting).
MRC will update
Landslide inventory to show the magnitude and location of mass
wasting events within each watershed analysis unit.
Boundaries of terrain stability units to improve the accuracy of our
knowledge of terrain with greater risk for sediment delivery from
mass wasting.
MEASUREMENT CRITERIA MRC will view a series of aerial photographs—at least 1 set per decade.
Observations will focus on identifying the types of mass wasting processes
active in the basin, the link between mass wasting and forest management
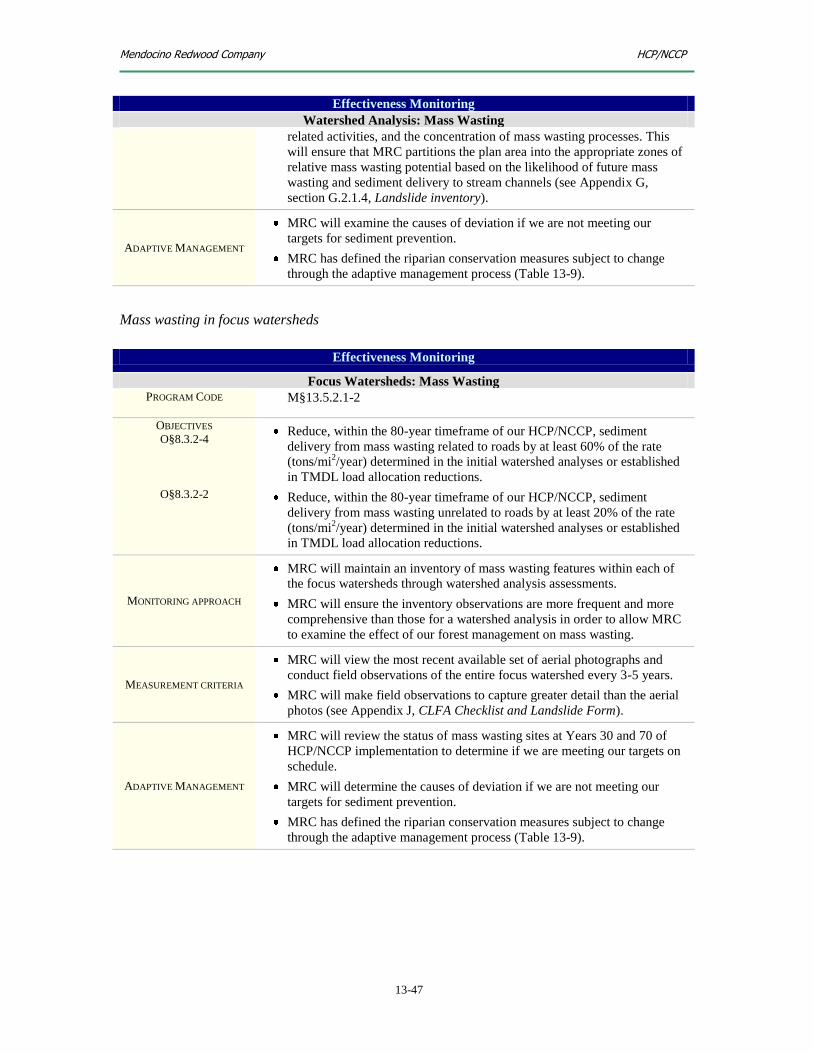
Mendocino Redwood Company HCP/NCCP
13-47
Effectiveness Monitoring
Watershed Analysis: Mass Wasting
related activities, and the concentration of mass wasting processes. This
will ensure that MRC partitions the plan area into the appropriate zones of
relative mass wasting potential based on the likelihood of future mass
wasting and sediment delivery to stream channels (see Appendix G,
section G.2.1.4, Landslide inventory).
ADAPTIVE MANAGEMENT
MRC will examine the causes of deviation if we are not meeting our
targets for sediment prevention.
MRC has defined the riparian conservation measures subject to change
through the adaptive management process (Table 13-9).
Mass wasting in focus watersheds
Effectiveness Monitoring
Focus Watersheds: Mass Wasting
PROGRAM CODE M§13.5.2.1-2
OBJECTIVES
O§8.3.2-4
O§8.3.2-2
Reduce, within the 80-year timeframe of our HCP/NCCP, sediment
delivery from mass wasting related to roads by at least 60% of the rate
(tons/mi2/year) determined in the initial watershed analyses or established
in TMDL load allocation reductions.
Reduce, within the 80-year timeframe of our HCP/NCCP, sediment
delivery from mass wasting unrelated to roads by at least 20% of the rate
(tons/mi2/year) determined in the initial watershed analyses or established
in TMDL load allocation reductions.
MONITORING APPROACH
MRC will maintain an inventory of mass wasting features within each of
the focus watersheds through watershed analysis assessments.
MRC will ensure the inventory observations are more frequent and more
comprehensive than those for a watershed analysis in order to allow MRC
to examine the effect of our forest management on mass wasting.
MEASUREMENT CRITERIA
MRC will view the most recent available set of aerial photographs and
conduct field observations of the entire focus watershed every 3-5 years.
MRC will make field observations to capture greater detail than the aerial
photos (see Appendix J, CLFA Checklist and Landslide Form).
ADAPTIVE MANAGEMENT
MRC will review the status of mass wasting sites at Years 30 and 70 of
HCP/NCCP implementation to determine if we are meeting our targets on
schedule.
MRC will determine the causes of deviation if we are not meeting our
targets for sediment prevention.
MRC has defined the riparian conservation measures subject to change
through the adaptive management process (Table 13-9).

Mendocino Redwood Company HCP/NCCP
13-48
13.5.2.2 Validation monitoring
Forensic monitoring and field observations of landslides
Validation Monitoring
Forensic Monitoring: Landslide Observations
PROGRAM CODE M§13.5.2.2-1
HYPOTHESES
SECTION 8.3.3.1 MRC conservation measures for mass wasting will decrease the incidence
of management-related landslides.
MONITORING APPROACH
MRC will use forest managers to update the watershed analysis inventory
database of mass wasting events and improve its accuracy. Our foresters
spend a significant amount of time doing pre-project planning and post-
project assessment. During these extended periods in the forest, they will
document landslides with the incidental landslide observation form and
add this information to our watershed analysis inventory database.
Increasing the sample size of this database will provide, in turn, more
accurate information for assessing the landslide incident rate.
MRC will observe mass wasting events during follow-up inspections of
forest harvest areas and roads, typically after storm events7 when the
likelihood of mass wasting is greatest.
MEASUREMENT CRITERIA
MRC will train forester managers to systematically collect data on
landslides (see Appendix J, CLFA Checklist and Landslide Form).
MRC will conduct forensic investigations of landslides each year on 10 to
20% of the PTHPs to observe site conditions and document causative
evidence.
MRC will use a professional geologist licensed in the State of California to
supervise all forensic investigations of landslides (see Appendix J, CLFA
Checklist and Landslide Form).
ADAPTIVE MANAGEMENT
MRC will determine the causes of deviation if we are not meeting our
targets for sediment prevention.
MRC has defined the conservation measures for sediment control that are
subject to change through adaptive management (Table 13-9).
13.5.3 Surface erosion
MRC will monitor surface erosion from road and skid trails by
Comprehensive road inventory.
Focus watershed studies.
Watershed analysis.
7 This will generally be every 3-5 years or after storms with at least a 5-year return interval as determined by
monitoring equipment at Caspar Creek.

Mendocino Redwood Company HCP/NCCP
13-49
13.5.3.1 Effectiveness monitoring
Sediment prevention through road inventory
Effectiveness Monitoring
Road Inventory: Sediment Prevention
PROGRAM CODE M§13.5.3.1-1
OBJECTIVE
O§8.3.2-6
Control 1,302,000 yd3 of controllable erosion within the first 30 years of
the HCP/NCCP.
MONITORING APPROACH
MRC will inventory roads with permanent structures (culverts or bridges)
every 10 years and update a database with information on road
improvements, road decommissioning, and erosion control (see Appendix
F, Road Inventory Protocol).
MRC will complete an initial inventory of all controllable erosion sites
from skid trails via aerial photo analysis and field observations as
described in section 8.3.3.2.11 Skid trail system plan.
MEASUREMENT CRITERIA
MRC will use our database of road observations and road work to
Provide information on the amount of controllable erosion
controlled by upgrading and decommissioning roads.
Document conditions of individual roads to allow MRC to monitor
improvements.
Set priorities for controllable erosion work (see section 8.3.3.2.1 to
8.3.3.2.3)
MRC will compare successive 10-year periods for how successful MRC
was in repairing sources of controllable erosion and for the quality of
individual road features.
ADAPTIVE MANAGEMENT
MRC will examine the causes of deviation if we are not meeting our
targets for reducing erosion from roads and skid trails.
MRC may decide to increase road surface improvements (rocking); limit
traffic usage (by time, quantity, or type); or decrease road density.
MRC has defined the riparian conservation measures subject to change
through the adaptive management process (Table 13-9).
Sediment prevention through watershed analysis
Effectiveness Monitoring
Watershed Analysis: Sediment Prevention
PROGRAM CODE M§13.5.3.1-2
OBJECTIVE
O§8.3.2-7 Reduce point source erosion from roads, skid trails, or landings and
sediment delivery associated with surface erosion by 50% within the first
30 years of our HCP/NCCP (i.e., from 4000 to 2000 yd3 per mi
2 per year)
and 70% within the initial 70 years of our HCP/NCCP (i.e., from 4000 to
1200 yd3 per mi
2 per year).
MONITORING APPROACH MRC will analyze sediment inputs from roads and skid trails during each
watershed analysis.
MEASUREMENT CRITERIA MRC discusses in Appendix G, G.2.2.3 and G.2.2.4 how we analyze
sediment delivery from roads and skid trails respectively. The initial
watershed analysis used a combination of field observations of point

Mendocino Redwood Company HCP/NCCP
13-50
Effectiveness Monitoring
Watershed Analysis: Sediment Prevention
source erosion and estimates from a surface erosion model from the
Standard Methodology for Conducting Watershed Analysis (WFPB 1995).
Future watershed analysis efforts may use this model or other methods
depending on the state of the technology at the time and information
generated from focus watershed studies.
ADAPTIVE MANAGEMENT
MRC will examine the cause of deviation if we are not meeting our targets
for prevention of sedimentation from roads and skid trails.
MRC may decide to increase road surface improvements (rocking), change
road classifications (traffic usage), or decrease road density.
MRC has defined the riparian conservation measures subject to change
through the adaptive management process (Table 13-9).
13.5.3.2 Validation monitoring
Sediment prevention through focus watersheds
Validation Monitoring
Focus Watersheds: Sediment Prevention
PROGRAM CODE M§13.5.3.2-1
HYPOTHESIS
SECTION 8.3.3.2
MRC conservation measures for roads, skid trails, and landings will
measurably reduce the amount of sediment entering stream channels, as
compared with the sediment amounts documented in the baseline road
inventory survey.
MONITORING APPROACH
MRC will monitor roads and skid trails within each of the focus
watersheds and record quantity and timing of sediment inputs at least
twice per decade or after storms with a 5-year or more recurrence interval.
In addition, we will collect data from road inventory monitoring at the
beginning and end of every decade (Appendix F, Road Inventory
Protocol).
MEASUREMENT CRITERIA
MRC will collect post-winter observations of all potentially deliverable
controllable erosion sites (crossings, culverts, landings, road slides,
erosion features, and skid trail erosion sites) to better examine site
characteristics and impacts from conservation measures.
MRC will not survey sites unless they were designated a priority on the
baseline surveys.
ADAPTIVE MANAGEMENT
MRC will examine the cause of deviation if we are not meeting our targets
for prevention of sedimentation from roads and skid trails.
MRC may decide to increase road surface improvements (rocking); limit
traffic usage (by time, quantity, or type); or decrease road density.
MRC has defined the riparian conservation measures subject to change
through the adaptive management process (Table 13-9).
13.5.4 Instream sediment
MRC will monitor stream sediment by
Long term channel monitoring.

Mendocino Redwood Company HCP/NCCP
13-51
Focus watershed studies.
Sediment budget.
13.5.4.1 Validation monitoring
Section 13.2 distinguishes effectiveness monitoring from validation monitoring. Sometimes, however,
effectiveness monitoring and validation monitoring overlap. In the case of the validation monitoring
programs discussed in this sub-section, namely M§13.5.4.1-1, M§13.5.4.1-2, and M§13.5.4.1-3, the focus
watershed studies for sediment budget, long term channel monitoring, and stream sediment will help MRC
draw conclusions about O§8.3.2-8:
O§8.3.2-8 Demonstrate an improving trend in the following parameters over the life of
the HCP/NCCP based on MRC conducting (a) watershed analyses at least
every 20 years, (b) long-term channel monitoring every 10 years, and (c)
focus watershed studies every 3-5 years:
Quality of stream gravel as measured by increased permeability
and percent of fine particles < 0.85 mm.
Stream-reach complexity as measured by residual pool depths
and standard deviation of residual pool depths within long-term
stream monitoring reaches.
Proportion of fine sediment in pools (V-star).
Decreased sediment inputs to the sediment budget for focus
watersheds.
Sediment budget within focus watersheds
Validation Monitoring
Focus Watersheds: Sediment Budget
PROGRAM CODE M§13.5.4.1-1
HYPOTHESIS
SECTIONS 8.3.3.1 AND
8.3.3.2
Conservation measures for mass wasting, roads, skid trails, and landings
will measurably reduce the amount of sediment entering stream channels,
as compared with the sediment amounts documented in baseline road
inventory and mass wasting surveys.
MONITORING APPROACH
MRC will maintain a sediment budget within each of the focus
watersheds. A sediment budget is represented by the equation:
Sediment Input + Change in Storage = Sediment Output.
MEASUREMENT CRITERIA
MRC will generate sediment budget estimates at the end of every decade.
MRC will measure and update Sediment Input from assessments of mass
wasting, prevention of sedimentation from road and skid trails, and stream
sediment monitoring.
MRC will determine Change in Storage through field surveys
documenting quantities of stored sediments. We will calibrate the
observations to the stream monitoring reaches that have longitudinal and
cross-section profiles surveyed. Our intent is to use changes within
longitudinal, cross-section profiles, and installed bank pins to assess
changes in sediment storage.
MRC will determine Sediment Output from Sediment Input and Change of
Storage, as well as observations of suspended sediment. We will only
collect output information in a few of the focus watersheds and within
limited timeframes. Our intent is to improve the accuracy of the sediment
budget.
ADAPTIVE MANAGEMENT MRC will examine the causes of deviation if we are not meeting our

Mendocino Redwood Company HCP/NCCP
13-52
Validation Monitoring
Focus Watersheds: Sediment Budget
targets for sediment prevention.
MRC may decide, based on the causes of deviation, to alter conservation
measures related to sediment inputs.
Long term channel monitoring: stream sediment
Validity Monitoring
Long Term Channel Monitoring: Stream Sediment
PROGRAM CODE M§13.5.4.1-2
HYPOTHESIS
SECTIONS 8.3.3.1, 8.3.3.2
AND 8.3.3.3
Conservation measures for mass wasting, roads, skid trails, and landings
will measurably improve instream habitat for covered aquatic species.
MONITORING APPROACH
MRC will monitor 60 or more long-term channel monitoring segments at
least once every 6 years using longitudinal profiles, cross sections, stream
bed size distribution, V* observations, and gravel permeability
observations; the channel monitoring segments will be identical to those in
which LWD observations are made.
MEASUREMENT CRITERIA
Longitudinal Profiles
MRC, working upstream, will survey the stream elevation at the thalweg
along the stream segment (Appendix G, section G.3.4, Module: stream
channel condition).
The following, all sensitive to sediment inputs, can be interpreted from the
longitudinal profile:
Changes in residual-pool depth.
Proportion of riffle and pool habitat by length.
Elevation fluctuations of the stream bed.
Density of habitat-providing pools.
Cross Sections and Stream Bed Size Distribution
MRC will mark with a permanent monument, within the long-term
channel monitoring segment, the location for cross-section surveys and
record this in the longitudinal profile survey. We will place the cross
sections along relatively straight reaches of channel on riffles.
Approximately 3-5 cross-section profiles will be taken along each
monitoring segment.
MRC will establish rebar pins at both ends of the cross section—well
above the flood-prone channel—to mark the cross section location. We
will measure the elevation and the distance from the left bank pin at least
every 5 ft or at any topographic changes visually apparent along the cross
section.
MRC will identify the bankfull channel in the survey. At each cross
section, we will characterize the size distribution of stream bed particles
by a pebble count (Appendix G, section G.3.4, Module: stream channel
condition).
Cross-section surveys provide information on stream channel response to
sediment. Comparison between subsequent years provides information on
changes to channel form. MRC will gather indications of sediment supply

Mendocino Redwood Company HCP/NCCP
13-53
Validity Monitoring
Long Term Channel Monitoring: Stream Sediment
and stream channel response from
Changes in bed elevation.
Width-to-depth ratio of the stream channel.
Size distribution of the stream bed.
When combined with a longitudinal profile, the cross-section profiles give
management insight into changes in habitat conditions within long-term
channel monitoring segments.
Gravel Permeability
MRC will take a total of 26 permeability measurements in each monitoring
segment at a depth of 25 cm to assess the quality of habitat for spawning
and survival of anadromous salmonid. Refer to Appendix H, H.3.1,
Determining adequate sample size.
V*8 Observations
MRC will take V* observations in pools within the long term channel
monitoring segment. The V* observations will follow the methods
outlined in Hilton and Lisle (1993).
ADAPTIVE MANAGEMENT
MRC will examine the causes of deviation if we are not meeting our
targets for sediment prevention.
MRC may decide, based on the causes of deviation, to alter conservation
measures related to sediment inputs.
Focus watershed studies: stream sediment
Validation Monitoring
Focus Watersheds: Stream Sediment
PROGRAM CODE M§13.5.4.1-3
HYPOTHESIS
SECTIONS 8.3.3.1, 8.3.3.2
AND 8.3.3.3
Conservation measures for mass wasting, roads, skid trails, and landings
will measurably reduce sediment amounts affecting instream habitat for
covered aquatic species as compared with sediment amounts from baseline
instream sediment measurements.
MONITORING APPROACH
MRC will determine
Stream channel response to stream sediments with longitudinal
profiles, residual pool depths, cross sections, stream bed size
distribution, V* observations, gravel permeability observations,
bank erosion observations, and bulk gravel samples in multiple
stream monitoring reaches covering a distribution of stream
channel types (morphologies, gradients, location within network).
NOTE
MRC will make their observations in 3 to 5-year intervals per
decade within the same channel segments used for
observations of riparian function.
8 The objective of V* is to track sediment transport, represented by the portion of pool filled with fine sediments.

Mendocino Redwood Company HCP/NCCP
13-54
Validation Monitoring
Focus Watersheds: Stream Sediment
Turbidity, suspended sediment, and stream-flow for interpretation
of annual loads, discrete sediment, and turbidity events.
MEASUREMENT CRITERIA
MRC will track the timing and extent of upslope or AMZ forest
management to compare with monitored stream sediment observations.
Channel Monitoring
MRC will conduct longitudinal profiles, residual pool depths, cross
sections, stream bed size distribution, V* observations, gravel permeability
observations, and bulk gravel samples in 5-7 stream-monitoring segments
covering a distribution of stream channel types (morphologies, gradients,
and location within network).
MRC will initially select the stream monitoring segments by stratified
random sampling based on proportion desired within target stream channel
types. The segments, identical to those monitored in riparian function,
will be at least 20-30 bankfull widths in length.
MRC will measure longitudinal profiles, cross sections, stream bed size
distribution, V* observations, gravel permeability observations, and bulk
gravel samples in the stream channel-monitoring segments twice during 3-
5 year time blocks per decade— specifically, during the first year and last
year of a time block. Methods will be the same as the long term channel
monitoring discussed previously, with the addition of bulk gravel
sampling.
MRC will install bank erosion pins in varying cross sections, within the
channel monitoring segments in focus watersheds, with varying vegetation
or silvicultural treatments, bank exposure (height and cover), root depth,
and shear stress. This will allow us to observe the level of sediment
contribution from bank erosion and the effectiveness of MRC conservation
measures for bank stability.
Suspended sediment and turbidity
MRC will install and maintain, at or near the outlet of South Fork Albion
and Little North Fork Navarro watersheds, an automated sampling station
for turbidity and suspended sediment.
MRC will use collected data to generate accurate estimates of annual
suspended sediment load, as well as turbidity duration and stream flow
relationships. NOTE
MRC will collect data at the continuous stations with programmable
data loggers, pressure transducers, continuous turbidity meters, and
automated pump samplers, operated by battery or solar panels.
MRC will augment this data with frequent manual sediment samples
and manual discharge measurements.
MRC will correlate continuous stage data to manual discharge
measurements made at different points along the hydrograph.
MRC expects that, given a good correlation between turbidity and
suspended sediment, over time sampling for suspended sediment will
become unnecessary to establish a rating curve for suspended
sediment to turbidity.
MRC will install staff plates and continuous turbidity meters and
periodically collect grab samples at major tributaries during storm
events to measure changes in turbidity and suspended sediment due to
changes in land management (roads, skid trails, etc.).

Mendocino Redwood Company HCP/NCCP
13-55
Validation Monitoring
Focus Watersheds: Stream Sediment
MRC will conduct continuous, automated sampling for turbidity and
manual sampling for suspended sediment and discharge in the Cottaneva
Creek focus watershed.
MRC will install a staff plate in the same location as the continuous
turbidity samplers. NOTE
MRC will periodically collect grab samples at continuous stream flow
stations during storm events to measure turbidity and suspended
sediment.
MRC will also periodically collect grab samples at major tributaries
during storm events to measure turbidity and suspended sediment.
MRC will depend heavily on available resources for our sampling
effort in the watersheds. If sampling is infrequent, detailed analysis of
data may be limited; however, comparisons with data from nearby
automated sampling stations may provide supplementary information.
Our goal is to observe long-term trends in discrete suspended
sediment loads.
MRC will allow the North Coast Regional Water Quality Control Board
and the wildlife agencies to conduct turbidity, suspended sediment, and
stream flow observations in the Noyo River and Big River and will assist
with monitoring of these stations, if time permits.
ADAPTIVE MANAGEMENT
MRC will examine the causes of deviation if sediment observations do not
show a trend toward reduced suspended sediment and turbidity as well as
increased stream channel complexity, pool depths, V*, fine sediment
percentage, and permeability.
MRC may decide, based on the causes of deviation, to alter conservation
measures related to sediment inputs.
13.5.5 Water drafting
13.5.5.1 Effectiveness monitoring
Effectiveness Monitoring
Water Drafting
PROGRAM CODE M§13.5.5.1-1
OBJECTIVE
O§8.4.1-3
Maintain equivalent temperatures downstream and upstream and limit the
reduction of the wetted width of the 1st downstream riffle as well as pool
volume.
MONITORING APPROACH
MRC will monitor annually a percentage of active water drafting sites to
determine their adherence to the guidelines in the Master Agreement for
Timber Operations (Appendix T) and their impacts to aquatic habitat.
MRC will monitor, during the entire drafting period and according to plans
approved by the wildlife agencies, stream stage and stream temperature
with continuous data-loggers.
MRC will conduct, as necessary, periodic measurements of residual pool
depth, channel dimensions, and stream flow within any area impacted by
water drafting, along with nearby control areas.
MEASUREMENT CRITERIA MRC will use digital recorders and flow meters to measure temperature,

Mendocino Redwood Company HCP/NCCP
13-56
Effectiveness Monitoring
Water Drafting
riffle crest, residual pool depths, channel dimensions, and flow in order to
assess aquatic habitat.
MRC will review monitoring reports on water drafting compliance for
supplemental data (Appendix D, section D.2.11, Water drafting).
ADAPTIVE MANAGEMENT
MRC will review the water drafting guidelines of MATO with the wildlife
agencies every 4 years, as well as at Years 30 and 70 of HCP/NCCP
implementation, to determine if we are meeting our objectives on schedule.
MRC will investigate to determine causes if we fail to meet our targets for
suitable aquatic habitat adjacent to water drafting sites.
MRC may decommission water drafting sites or adjust their intake rates, if
we do not meet our targets for aquatic habitat adjacent to water drafting
sites.
13.5.5.2 Validation monitoring
Validation Monitoring
Water Drafting
PROGRAM CODE M§13.5.5.2-1
HYPOTHESIS
SECTION 8.2.2 Aquatic organisms will respond to moderations in drafting rates, i.e.,
increases in residual water depths and decreases in water temperatures.
MONITORING APPROACH
MRC will evaluate, within each focus watershed, drafting operations,
aquatic habitat conditions, and condition of aquatic species (e.g., density
and condition indices) to determine impacts to sensitive aquatic plants and
animals.
MEASUREMENT CRITERIA MRC will determine response variation of salmonids, amphibians, rare
plants, and benthic macroinvertebrates to treatment and controls.
ADAPTIVE MANAGEMENT
MRC will investigate to determine causes if there are no improvements in
the conditions of aquatic species.
MRC may adjust the water drafting guidelines in the Master Agreement
for Timber Operations (Appendix T).
13.6 Monitoring covered aquatic species
13.6.1 Anadromous salmonid monitoring
MRC will update information on the presence of anadromous salmonids using annual spot checks
in large basins. We will conduct more extensive distribution surveys throughout each watershed
in 3-year cycles and collect annual estimates of the number of out-migrating salmon, particularly
coho salmon. MRC will also survey Chinook Salmon Monitoring Reaches (CSMR) annually to
evaluate the status of the species and the effectiveness of HCP/NCCP conservation measures.
The state and federal governments are working on a regional salmonid monitoring program in
core areas which will overlap the MRC plan area. As more information becomes available, MRC
and the wildlife agencies will evaluate both programs for compatibility and commonality. If we
can mesh our monitoring program with the agencies’ program without exceeding our anticipated
monitoring costs for our HCP/NCCP or diminishing the plan’s effectiveness, we may do so.
Mendocino Redwood Company HCP/NCCP
13-57
13.6.1.1 Effectiveness monitoring
Presence of anadromous salmonid in ASMB
Each year, MRC will conduct surveys for anadromous salmonid presence in our Annual
Salmonid Monitoring Basins (ASMB). We selected basins in which we own all or most of the
land to ensure that results reflect our own practices as opposed to activities outside our control.
Using these criteria, we identified the following as ASMB:
Hollow Tree Creek.
Cottaneva Creek.
Hardy Creek.
Juan Creek.
Howard Creek.
North Fork Noyo River.
Big River (above South Fork Big River).
South Fork Big River.
Albion River.
South Fork Albion River.
North Branch North Fork Navarro River.
South Branch North Fork Navarro River.
Greenwood Creek.
Elk Creek.
Mallo Pass Creek.
Alder Creek.
South Fork Garcia River.
Ackerman Creek.
We may conduct surveys in main-stem segments or in tributaries of these basins.
A species is considered present in a watershed if it is detected at least once during 3 consecutive
annual surveys. We selected a 3-year time period to recognize the distinct cohorts of coho
salmon that result from its life cycle. That life cycle ideally might proceed as follows: (1) eggs
in stream gravel (September–December); (2) alevin in stream gravel (January–June); (3) fry in
fresh water (few months to 2 years). If MRC does not detect coho salmon, for example, in years
2010 and 2011 but does observe them in 2012, we will consider coho salmon present at the site
for the time survey period of 2010-2012.
MRC surveyed all of the watersheds on our land during 2000-2002; the previous landowner
surveyed these same sites from 1994-1996. This provides 2 monitoring cycles to serve as baseline
data on species diversity and distribution within each watershed. Baseline data indicates that coho
salmon are present in 10 of the monitored drainage basins: Hollow Tree Creek, Cottaneva Creek,
North Fork Noyo River, Big River (upstream of South Fork Big River), South Fork Big River,
Albion River (upstream of South Fork Albion River), South Fork Albion River, North Branch
North Fork Navarro River, South Branch North Fork Navarro River, and South Fork Garcia
River. Steelhead are present in all 18 drainage basins identified for annual monitoring.
Chinook salmon migrate to sea during their first year of life—typically within 3 months of
emergence from spawning gravels—and spend most of their lives in coastal ocean waters (Healy
1991, Mills et al 1997, Moyle et al 1989). Due to their rapid migration after emergence from
spawning gravels, we suspect that Chinook salmon are less sensitive than coho salmon to timber
management. Monitoring their presence, however, can be difficult. The life cycles of coho
salmon are easier to monitor. As a result, the status of coho salmon provides a more convenient

Mendocino Redwood Company HCP/NCCP
13-58
metric to evaluate the over-all effectiveness of MRC conservation measures on salmonid habitat.
Nevertheless, Chinook salmon is a covered species in our HCP/NCCP and its habitat needs differ
from the other covered salmonids. Therefore, MRC will monitor the status of Chinook salmon in
the Chinook Salmon Monitoring Reaches (CSMR).
Effectiveness Monitoring
Anadromous Salmonid Presence: Annual Salmonid Monitoring Basins (ASMB)
PROGRAM CODE M§13.6.1.1-1
OBJECTIVE
O§10.2.1.2-1 Maintain covered salmonids within major drainage basins.
Maintain steelhead in 100% of the ASMB where baseline data and
new surveys indicate their presence.
Maintain coho salmon in 100% of ASMB, where baseline data and
new surveys indicate their presence.
MONITORING APPROACH MRC will assess anadromous salmonid presence annually within the 18
major drainage basins identified.
MEASUREMENT CRITERIA
MRC considers anadromous salmonid species present if we detect them
once during 3 annual consecutive surveys in an ASMB.
MRC will conclude that a basin is supporting new fish species not present
in previous surveys if we detect them on 2 or more occasions in a
continuous 6-year time period.
MRC will use snorkeling or single-pass electro-fishing to determine if
anadromous salmonid species are present; a survey site will consist of at
least 20 pools within each major drainage basin identified.
MRC will consider the survey complete, if we detect coho and steelhead
before sampling 20 pools.
MRC will collect data on ―catch per unit effort‖ and correlate the time for
first detection with fish abundance.
ADAPTIVE MANAGEMENT
MRC will examine the probable causes of deviation including formation of
temporary barriers to fish passage, low discharge, status of regional trends,
and physical habitat data.
MRC will meet and confer with the wildlife agencies regarding possible
solutions and adjustments to conservation measures, such as remediation of
barriers.
Anadromous salmonid distribution
Surveys for anadromous salmonid distribution will take place over a 3-year time period. In the
first year of the survey, MRC will visit approximately 450 sites across our watersheds to examine
the extent and distribution of juvenile anadromous salmonids. In the second and third years, we
will sample all sites in which a species was known to be historically present, but remains
undetected. If, during a 3-year time period, MRC does not observe a species known to be present
from baseline data, we will consider it absent for survey statistics.

Mendocino Redwood Company HCP/NCCP
13-59
Effectiveness Monitoring
Anadromous Salmonid Distribution
PROGRAM CODE M§13.6.1.1-2
OBJECTIVES
O§10.2.1.2-2
O§10.2.1.2-3
Maintain steelhead in 90% of sampling sites throughout the plan area,
where baseline data and new information indicates their presence.
Maintain coho salmon in 85% of sampling sites throughout the plan area,
where baseline data and new information indicates their presence.
NOTE MRC set objectives for coho salmon and steelhead distribution at less
than 100% to account for natural variations in flow and temporary
barriers, such as log jams, which may impede accessibility. When we
detect new fish species in a sampling site, we will consider that sampling
site able to support the new species only if we detect them.
MONITORING APPROACH MRC will assess anadromous salmonid distribution annually over a 3-year
period repeating the assessment every 12 years.
MEASUREMENT CRITERIA
MRC will visit all major watercourses with fish.
MRC will use a hierarchical framework to select the initial locations of
survey sites in each stream. Major streams are divided into lower, middle,
and upper reaches. Smaller streams are divided into lower and upper
reaches.
MRC will survey 1 site in each reach, or 3 sites in major streams and 2
sites in smaller streams. We will add other sites directly downstream and
upstream of potential migration barriers to determine which anadromous
salmonid species these barriers are impacting.
MRC will use snorkeling or single-pass electrofishing to determine if
aquatic species are present. A survey site will contain a minimum of 2
consecutive habitat sequences (pool-riffle sequences) and have a minimum
length of 90 ft. If future research improves methods to determine the
probability that a species is absent, MRC will incorporate these methods
into the distribution surveys.
MRC will collect data on ―catch per unit effort‖ (i.e., the number of fish
captured per unit effort of time).
MRC will conclude that a sampling site is supporting fish species not
present in previous surveys if we detect them on 2 or more occasions.
ADAPTIVE MANAGEMENT
MRC will examine the probable causes of deviation including formation
of temporary barriers to fish passage, low discharge, status of regional
trends, and physical habitat data.
MRC will meet and confer with the agencies regarding possible solutions
and adjustments to conservation measures, such as remediation of barriers.
Presence and relative abundance of Chinook salmon
Chinook salmon were historically present or are currently present in the following watersheds
within the plan area:
Hollow Tree Creek.
North Fork Noyo River.
Big River.
Albion River.
Garcia River.

Mendocino Redwood Company HCP/NCCP
13-60
Moreover, MRC believes that some streams are potential habitat for Chinook salmon. These
potential streams are
Cottaneva Creek.
South Fork Big River.
North Fork Navarro River.
South Fork Albion River.
Elk Creek.
MRC will identify 1 Chinook Salmon Monitoring Reach (CSMR) in each of the streams listed
above, for a total of 10 CSMRs. By locating CSMRs in streams with historical evidence of
Chinook salmon presence as well as in streams with no observations at all, MRC hopes to
observe expansions in Chinook distribution and relative abundance over time as conditions for
freshwater habitat improve.
MRC has identified 2 streams where we have encountered Chinook salmon most often during
monitoring: Hollow Tree Creek and North Fork Noyo River. Every year, we will monitor 1
CSMR in Hollow Tree Creek and 1 in North Fork Noyo River for the presence and relative
abundance of juvenile Chinook salmon. We will also randomly select 2 other CSMRs to monitor
every year. This amounts to a total of 4 CSMR surveys per year, rotating through all the CSMRs
roughly every 4 years. If MRC determines that Chinook salmon are occupying a CRMS for 2
consecutive monitoring cycles, we will survey that CSMR annually from that point forward.
MRC will monitor the habitat elements of Chinook salmon by selectively locating new Long
Term Channel Monitoring (LTCM) segments within areas frequented by Chinook. Several other
monitoring programs, such as those for stream temperature, sediment, and LWD, will also
indirectly asses the quantity and quality of habitat available to Chinook salmon.
Effectiveness Monitoring
Chinook Salmon Monitoring Reaches (CSMR)
PROGRAM CODE M§13.6.1.1-3
OBJECTIVE
OS10.2.1.2-4
Maintain Chinook salmon in the Chinook Salmon Monitoring Reaches
(CSMR) currently identified for annual monitoring: Hollow Tree Creek
and North Fork Noyo River (see HCP/NCCP Atlas, MAPS 3A-3C).
MONITORING APPROACH
MRC will assess the presence and relative abundance of Chinook salmon
juveniles annually within the 2 CSMRs most frequented by Chinook
salmon, i.e., Hollow Tree Creek and North Fork Noyo River.
MRC will establish 8 additional CSMRs in streams which are currently
unoccupied by Chinook salmon or which Chinook salmon may have
occupied in the past, i.e., Cottaneva Creek, Big River, South Fork Big
River, Albion River, South Fork Albion River, North Fork Navarro River,
Elk Creek, and Garcia River.
MRC will randomly select 2 CSMRs from the list above to survey
annually, in addition to Hollow Tree Creek and North Fork Noyo River.
MRC will survey a total of 4 CSMRs each year, rotating through all
CSMRs every 4 years.
MRC will use snorkel surveys within each CSMR in early spring when
juveniles are most likely to be present.
MRC will collect data on the relative abundance of Chinook salmon
juveniles within each CSMR by surveying the same reaches over time.

Mendocino Redwood Company HCP/NCCP
13-61
Effectiveness Monitoring
Chinook Salmon Monitoring Reaches (CSMR)
MRC will monitor a CSMR annually, if we detect Chinook salmon there
during 2 consecutive monitoring cycles.
MRC will ensure that each CSMR is similar in size (0.5 to 1.0 mi. long)
and choose its location based on suitable habitat as well as accessibility
and proximity to major landmarks.
MEASUREMENT CRITERIA
MRC considers Chinook salmon present if we detect them once during 5
annual consecutive surveys in a CSMR.
NOTE MRC selected a 5-year time period to determine presence in order to
account for the lifespan of most fall-run Chinook salmon. The 5-year time
period also provides MRC some flexibility in addressing the episodic
nature of the species occurrence within the plan area.
MRC will collect data on the number of juveniles observed within the
entire extent of a CSMR from at least 2 independent surveys per year.
MRC surveyors will snorkel the same CSMR and collect independent
estimates of the number of juveniles observed on the same day; we will
derive a mean number of fish observed from all surveys to represent the
relative abundance for each CSMR in a given year.
MRC surveyors will target the best habitats when the width of a channel is
too large to observe the entire wetted width.
MRC surveyors will embark on a survey at least 15 minutes apart and each
surveyor will wait until another surveyor has departed a habitat unit (pool,
riffle, glide, etc.) before entering it.
ADAPTIVE MANAGEMENT
MRC will examine the probable causes of deviation including
Formation of temporary barriers to fish passage.
Low discharge.
Status of regional trend.
Physical habitat data.
MRC will meet and confer with the wildlife agencies about possible
solutions and adjustments to conservation measures, such as remediation
of fish barriers.
13.6.1.2 Validation monitoring
Smolt abundance
Out-migrating juvenile coho salmon and steelhead (smolts) are a preferred life stage to monitor
since they have resided in a freshwater environment for at least 1 year and have been exposed to
seasonal variation in habitat quality and availability.
The number of adult salmon who return to their natal streams to spawn is important in
determining the abundance of smolts within a watershed. Salmon generally spend at least half
their lives residing in the ocean; MRC has little or no control over the number of adults who
return to spawn. Upon their return, however, the condition of their freshwater aquatic habitat
largely determines the number of salmon eggs that will survive to become smolts. We
hypothesize that the number of smolts will increase over time as freshwater habitat conditions
improve. Testing of this hypothesis will occur in the focus watersheds where we will closely
monitor both smolt abundance and habitat conditions.

Mendocino Redwood Company HCP/NCCP
13-62
MRC will not extrapolate data collected in the focal watersheds on smolt abundance and habitat
conditions to other watersheds without agreement from the wildlife agencies that such
extrapolation is appropriate. We will use information on smolt abundance to monitor trends in
out-migrating smolts. With this trend data, we can make comparisons to measurements of
suspended sediment or turbidity collected in these focus watersheds or to habitat conditions. In
addition, we can use the data for controlled before-and-after experiments to assess the
effectiveness of various land management applications.
Validation Monitoring
Smolt Abundance
PROGRAM CODE M§13.6.1.2-1
HYPOTHESIS
SECTIONS 4.2.9 AND 4.4.9
Abundance of juvenile anadromous salmonid will increase as habitat
conditions improve over time.
MONITORING APPROACH
MRC will estimate abundance of out-migrating smolts during the late
winter and spring within 2 focus watersheds—South Fork Albion River
and Little North Fork Navarro River.
MRC will monitor instream habitat conditions over time to allow for
comparison between habitat quality and smolt abundance.
MEASUREMENT CRITERIA
MRC will estimate smolt abundance using out-migrant traps to capture
juvenile coho salmon and steelhead.
MRC will install out-migrant traps as soon as stream discharge allows and
remove them when the out-migration of coho salmon smolts subsides in
late spring and none have been captured within a week.
MRC will operate out-migrant traps on an annual basis, rotating between 2
focus watersheds every 3 years; we may consider expanding these efforts
into the other focus watersheds, depending on available resources.
MRC will collect information on the timing of smolt out-migration; smolt
size; fish conditions, e.g., length-to-weight relationships; and community
structure of juvenile anadromous salmonids.
MRC will use DARR software9 to analyze trap efficiency and coho salmon
smolt abundance.
MRC will monitor habitat conditions (Appendix G, G.3.5, Module: fish
habitat).
ADAPTIVE MANAGEMENT
AND MONITORING
MRC will examine the relationship between the status of instream habitat
conditions and the abundance of coho salmon smolts.
MRC will evaluate probable causes, if the abundance of coho salmon
smolts significantly declines while habitat conditions are improving, and
confer with the wildlife agencies about possible solutions
MRC may initiate escapement estimates to assist in evaluating habitat
performance.
9 Darroch Analysis with Rank-Reduction (DARR) is a method for estimating abundance of smolts from outmigrant trap
data (Bjorkstedt 2005).
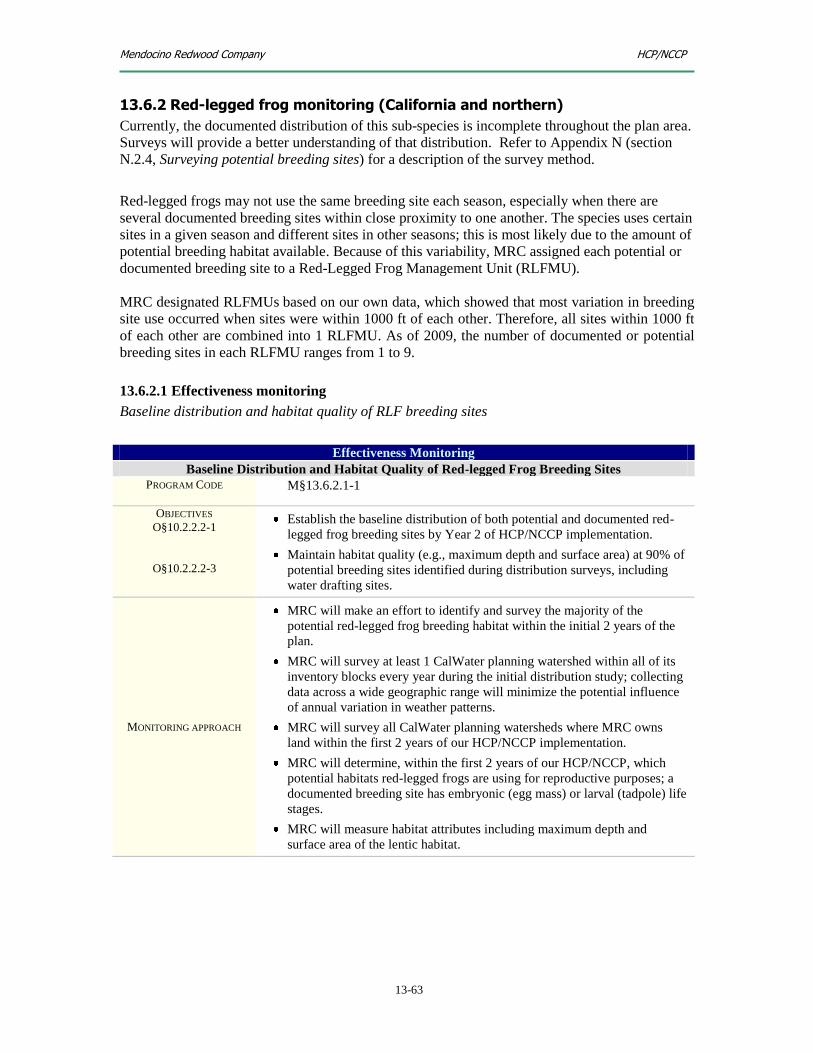
Mendocino Redwood Company HCP/NCCP
13-63
13.6.2 Red-legged frog monitoring (California and northern)
Currently, the documented distribution of this sub-species is incomplete throughout the plan area.
Surveys will provide a better understanding of that distribution. Refer to Appendix N (section
N.2.4, Surveying potential breeding sites) for a description of the survey method.
Red-legged frogs may not use the same breeding site each season, especially when there are
several documented breeding sites within close proximity to one another. The species uses certain
sites in a given season and different sites in other seasons; this is most likely due to the amount of
potential breeding habitat available. Because of this variability, MRC assigned each potential or
documented breeding site to a Red-Legged Frog Management Unit (RLFMU).
MRC designated RLFMUs based on our own data, which showed that most variation in breeding
site use occurred when sites were within 1000 ft of each other. Therefore, all sites within 1000 ft
of each other are combined into 1 RLFMU. As of 2009, the number of documented or potential
breeding sites in each RLFMU ranges from 1 to 9.
13.6.2.1 Effectiveness monitoring
Baseline distribution and habitat quality of RLF breeding sites
Effectiveness Monitoring
Baseline Distribution and Habitat Quality of Red-legged Frog Breeding Sites
PROGRAM CODE M§13.6.2.1-1
OBJECTIVES
O§10.2.2.2-1
O§10.2.2.2-3
Establish the baseline distribution of both potential and documented red-
legged frog breeding sites by Year 2 of HCP/NCCP implementation.
Maintain habitat quality (e.g., maximum depth and surface area) at 90% of
potential breeding sites identified during distribution surveys, including
water drafting sites.
MONITORING APPROACH
MRC will make an effort to identify and survey the majority of the
potential red-legged frog breeding habitat within the initial 2 years of the
plan.
MRC will survey at least 1 CalWater planning watershed within all of its
inventory blocks every year during the initial distribution study; collecting
data across a wide geographic range will minimize the potential influence
of annual variation in weather patterns.
MRC will survey all CalWater planning watersheds where MRC owns
land within the first 2 years of our HCP/NCCP implementation.
MRC will determine, within the first 2 years of our HCP/NCCP, which
potential habitats red-legged frogs are using for reproductive purposes; a
documented breeding site has embryonic (egg mass) or larval (tadpole) life
stages.
MRC will measure habitat attributes including maximum depth and
surface area of the lentic habitat.

Mendocino Redwood Company HCP/NCCP
13-64
Occupancy of red-legged frogs in documented breeding sites
Effectiveness Monitoring
Occupancy of Red-Legged Frogs in Documented Breeding Sites
PROGRAM CODE M§13.6.2.1-2
OBJECTIVE
O§10.2.2.2-2 Maintain red-legged frogs in 100% of the red-legged frog management
units (RLFMUs) where baseline surveys and new surveys indicate their
presence.
MONITORING APPROACH MRC will monitor all documented breeding sites on an annual basis for
actual use by red-legged frogs.
MEASUREMENT CRITERIA
MRC will consider that an RLFMU supports red-legged frog populations
if one or more documented breeding sites within the RLFMU remains
occupied.
MRC will conclude that red-legged frogs are occupying a documented
breeding site if we detect them breeding at least once during 3 years of
consecutive surveys.
ADAPTIVE MANAGEMENT
MRC will consider any reduction in the number of CalWater planning
watersheds with active breeding sites or any reduction in the number of
RLFMUs as significant.
MRC will determine the reasons for the reduction in the number of
RLFMUs, chart the appropriate action with the wildlife agencies, and
possibly create additional habitat in strategic locations or adjust
conservation measures.
Habitat quality and species present within RLF breeding sites
Effectiveness Monitoring
Re-evaluate Habitat Quality and Species Presence within RLF Breeding Sites
PROGRAM CODE M§13.6.2.1-3
OBJECTIVE
O§10.2.2.2-3 Maintain habitat quality (e.g., maximum depth and surface area) at 90% of
potential breeding sites identified during distribution surveys, including
water drafting sites.
MONITORING APPROACH
MRC will re-examine every 5 years all potential and documented breeding
habitat identified during the initial study.
MRC will conduct re-examinations to monitor for changes in the
maximum depth or surface area of the habitat present.
MRC will conduct surveys (Appendix N, section N.2.4, Surveying
potential breeding sites) to determine if red-legged frogs are using
potential habitats and expanding in range.
MEASUREMENT CRITERIA
MRC will document a breeding site and monitor it annually if we observe
evidence of red-legged frog reproduction (i.e., egg masses of larvae
present).
MRC will conclude that habitat quality has been maintained (on a site
specific basis) if at least 75% of the maximum depth of a feature is
maintained and at least 75% of the total surface area remains lentic habitat.
ADAPTIVE MANAGEMENT MRC will consider degraded habitat at more than 10% of potential
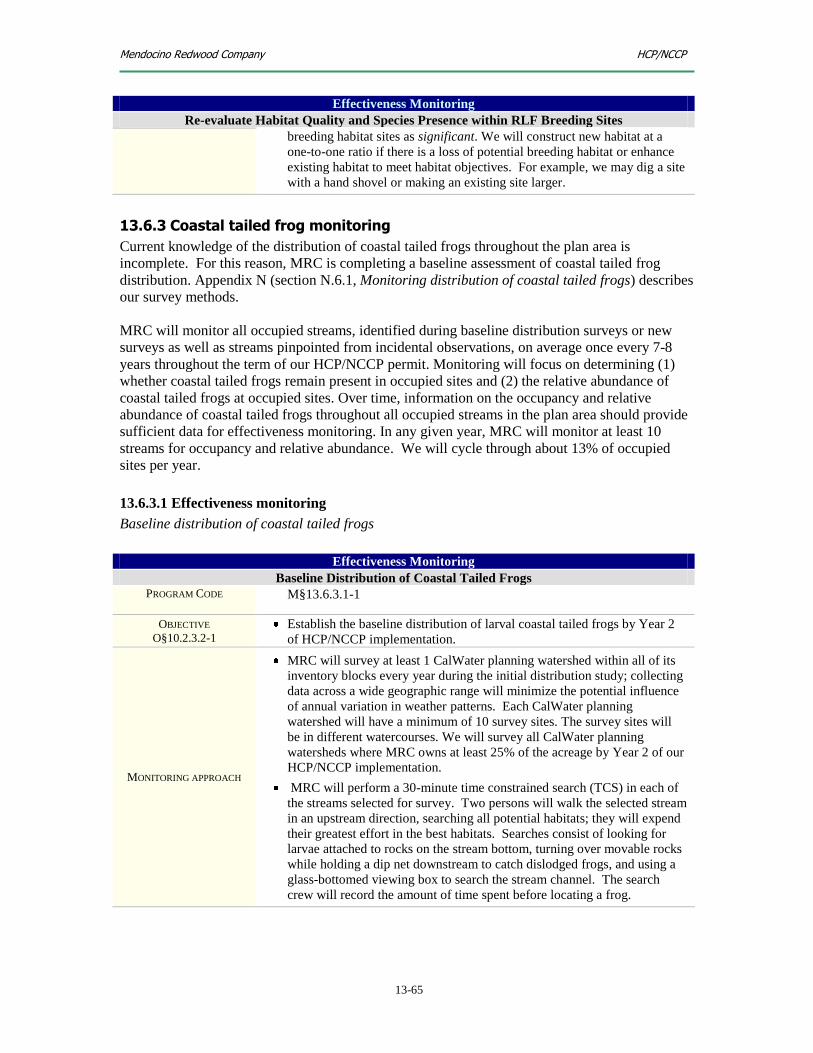
Mendocino Redwood Company HCP/NCCP
13-65
Effectiveness Monitoring
Re-evaluate Habitat Quality and Species Presence within RLF Breeding Sites
breeding habitat sites as significant. We will construct new habitat at a
one-to-one ratio if there is a loss of potential breeding habitat or enhance
existing habitat to meet habitat objectives. For example, we may dig a site
with a hand shovel or making an existing site larger.
13.6.3 Coastal tailed frog monitoring
Current knowledge of the distribution of coastal tailed frogs throughout the plan area is
incomplete. For this reason, MRC is completing a baseline assessment of coastal tailed frog
distribution. Appendix N (section N.6.1, Monitoring distribution of coastal tailed frogs) describes
our survey methods.
MRC will monitor all occupied streams, identified during baseline distribution surveys or new
surveys as well as streams pinpointed from incidental observations, on average once every 7-8
years throughout the term of our HCP/NCCP permit. Monitoring will focus on determining (1)
whether coastal tailed frogs remain present in occupied sites and (2) the relative abundance of
coastal tailed frogs at occupied sites. Over time, information on the occupancy and relative
abundance of coastal tailed frogs throughout all occupied streams in the plan area should provide
sufficient data for effectiveness monitoring. In any given year, MRC will monitor at least 10
streams for occupancy and relative abundance. We will cycle through about 13% of occupied
sites per year.
13.6.3.1 Effectiveness monitoring
Baseline distribution of coastal tailed frogs
Effectiveness Monitoring
Baseline Distribution of Coastal Tailed Frogs
PROGRAM CODE M§13.6.3.1-1
OBJECTIVE
O§10.2.3.2-1
Establish the baseline distribution of larval coastal tailed frogs by Year 2
of HCP/NCCP implementation.
MONITORING APPROACH
MRC will survey at least 1 CalWater planning watershed within all of its
inventory blocks every year during the initial distribution study; collecting
data across a wide geographic range will minimize the potential influence
of annual variation in weather patterns. Each CalWater planning
watershed will have a minimum of 10 survey sites. The survey sites will
be in different watercourses. We will survey all CalWater planning
watersheds where MRC owns at least 25% of the acreage by Year 2 of our
HCP/NCCP implementation.
MRC will perform a 30-minute time constrained search (TCS) in each of
the streams selected for survey. Two persons will walk the selected stream
in an upstream direction, searching all potential habitats; they will expend
their greatest effort in the best habitats. Searches consist of looking for
larvae attached to rocks on the stream bottom, turning over movable rocks
while holding a dip net downstream to catch dislodged frogs, and using a
glass-bottomed viewing box to search the stream channel. The search
crew will record the amount of time spent before locating a frog.

Mendocino Redwood Company HCP/NCCP
13-66
Effectiveness Monitoring
Baseline Distribution of Coastal Tailed Frogs
MEASUREMENT CRITERIA
MRC will consider coastal tailed frogs to be present if larval life stages are
present within a survey location.
MRC will conduct distribution surveys during the most appropriate season
(May to August) before larvae metamorphose and leave the stream
environment.
Distribution and relative abundance of coastal tailed frogs
All occupied streams identified during baseline distribution surveys, new surveys, or incidental
observations will be monitored once every 7-8 years (on average) throughout the permit term.
Monitoring will focus on determining (1) whether coastal tailed frogs continue to remain present
in occupied sites and (2) the relative abundance of coastal tailed frogs at occupied sites.
Effectiveness Monitoring
Distribution and Relative Abundance of Coastal Tailed Frogs
PROGRAM CODE M§13.6.3.1-2
OBJECTIVE
O§10.2.3.2-2 Maintain larval coastal tailed frogs in 95% of sites where the baseline
distribution survey, new surveys, or incidental observations indicate their
presence. NOTE MRC set the distribution objective at less than 100% to account for
sampling error.
MONITORING APPROACH
MRC will determine presence or probable absence with a 60-minute time
constrained search (TCS) in each of the sites where we detected coastal
tailed frogs during baseline or new surveys. Two persons will walk the
selected stream in an upstream direction, searching all potential habitats;
they will expend their greatest effort in the best habitats. Searches consist
of looking for larvae attached to rocks on the stream bottom, turning over
movable rocks while holding a dip net downstream to catch dislodged
frogs, and using a glass-bottomed viewing box to search the stream
channel. The search crew will record the amount of time spent before
locating a frog.
MRC will conduct surveys from May to August before larvae
metamorphose and leave the stream environment.
MRC will re-examine the distribution of coastal tailed frogs by conducting
presence or probable absence surveys at all occupied sites identified
through baseline surveys, new surveys, or incidental observations.
MRC will survey 10 streams per year, randomly rotating through all of the
occupied streams within the plan area, on average, every 8 years.
MRC will collect relative abundance estimates at each monitoring site
where we have confirmed the presence of coast tailed frogs (Appendix N,
section N.6.2, Monitoring relative abundance of coastal tailed frogs).
MEASUREMENT CRITERIA
MRC will consider coastal tailed frogs to be present if there is evidence of
larval life stages within a survey location.
MRC will posit a decline in the abundance of coastal tailed frogs if, after 3
survey cycles, the proportion of sites with demonstrable declines exceeds
the sites with demonstrable increases.

Mendocino Redwood Company HCP/NCCP
13-67
Effectiveness Monitoring
Distribution and Relative Abundance of Coastal Tailed Frogs
ADAPTIVE MANAGEMENT
MRC will consider altering AMZ conservation measures or increasing
AMZ protections if (1) there is a 5% reduction in the number of sites
occupied by coastal tailed frogs or (2) relative abundance has declined.
13.7 Overview of Terrestrial Monitoring
MRC will implement our terrestrial effectiveness and validation monitoring through the programs
outlined in Table 13-16. These programs evaluate populations of terrestrial species in the plan
area, as well as habitat and habitat components directly related to terrestrial species. Timber
inventory provides feedback for some of these monitoring programs (see Appendix U, section
U.7, Structure Classes and Habitat Inferences).
Successful completion of the terrestrial surveys may depend upon annual MRC harvests (see
section 13.2.2.7 and Table 13-7).
Table 13-16 Terrestrial Effectiveness and Validation Monitoring Programs
Terrestrial Effectiveness and Validation Monitoring Programs
Monitoring Program Description Monitoring Code Timing
Snags, Wildlife Trees, Recruitment Trees,
and Downed Wood
M§13.8.1-1
Sample annually.
Tabulate and compare results
from inventory every 10 years.
Basal Area of Hardwoods in Timber
Stands
M§13.8.1-2 Report annually.
Post-Harvest Follow-up on Hardwood
Representative Sample Areas
M§13.8.1-3
Sample when harvest occurs in
these areas.
Report annually.
Acreage and Number of Hardwood
Representative Sample Areas
M§13.8.1-4
Visit and assess over a 10-year
period; report every 10 years.
Acreage and Number of Old Growth
Stands and Trees
M§13.8.1-5 Visit and assess over a 10-year
period; report every 10 years.
Report annually on individual
old growth trees
Distribution and Area of Rocky Outcrops M§13.8.1-6 Visit and assess over a 10-year
period; report every 10 years.
Common Natural Communities M§13.8.2-1
Compile and report every 5
years.
Uncommon Natural Communities M§13.8.2-2
Compile and report every 5
years.
Invasive Species Control M§13.8.3-1 Report annually.

Mendocino Redwood Company HCP/NCCP
13-68
Terrestrial Effectiveness and Validation Monitoring Programs
Monitoring Program Description Monitoring Code Timing
Northern Spotted Owls: Level-1 and
Level-2 Territories
M§13.9.1.3-1 Complete and report annually.
Northern Spotted Owls: Distribution and
Acreage of Nesting/Roosting Habitat
M§13.9.1.3-2 Report every 10 years.
Population Trends of Northern Spotted
Owls
M§13.9.1.4-1 Complete and report every 5
years.
Report annually and ensure 1/5
of covered lands have been
surveyed.
Identification of Nesting/Roosting Habitat
for Northern Spotted Owls
M§13.9.1.4-2 Survey at least 100 nest sites of
individual spotted owl
territories; initial survey was
completed in 2007.
Survey at least 100 nest sites of
individual spotted owls starting
40 years after plan initiation;
estimate that the effort will take
8 years.
Optional
Benefits of High Protection for Northern
Spotted Owls and Their Territories
M§13.9.1.4-3 Complete annually.
Report every 5 years.
Optional
Effect of Harvest within 1000 ft of NSO
Territories with Limited Protection
M§13.9.1.4-4 Complete.
Report every 5 years
Effect of Habitat on Productivity of
Northern Spotted Owls
M§13.9.1.4-5 Complete annually.
Report every 5 years.
Optional
Effect of Hardwood Density on Northern
Spotted Owls
M§13.9.1.4-6 Complete annually.
Report every 5 years.
Effect of Barred Owl Control on Northern
Spotted Owls
M§13.9.1.4-7
Complete annually until
wildlife agencies and MRC
decide to terminate.
Report annually.
Activity Level of Marbled Murrelets in
Lower Alder Creek
M§13.9.2.1-1 Complete and report annually.
Murrelet Occupancy in Navarro,
Greenwood Creek, Albion River
Watersheds
M§13.9.2.1-2 Complete and report annually.

Mendocino Redwood Company HCP/NCCP
13-69
Terrestrial Effectiveness and Validation Monitoring Programs
Monitoring Program Description Monitoring Code Timing
Murrelet Habitat Distribution in LACMA M§13.9.2.2-1 Complete within the first 20
years of the plan.
Optional
Methods for Accelerating Growth of
Murrelet Habitat
M§13.9.2.2-2 No timeline
Optional
Radar Monitoring in Additional Drainages
M§13.9.2.2-3 Rotate monitoring between 10
drainages on a 5 year basis.
Optional
Spatial Extent of Known Burrow Systems
of Point Arena Mountain Beaver
M§13.9.3.1-1 Complete surveys over 5 years.
Report every 5 years.
Creating Habitat with Timber Harvest
within Dispersal Distance of Existing
Burrow Systems
M§13.9.3.1-2 Complete visits 2 years
following harvest.
Document spatial extent when
burrows discovered.
Report every 5 years
Defining Habitat for Point Arena Mountain
Beavers
M§13.9.3.2-1 Complete habitat surveys over 5
years along with surveys for
spatial extent.
Report every 5 years.
Optional
Creating Potential Habitat in or Adjacent to
Existing PAMB Burrow Systems
M§13.9.3.2-2 No timeline
Optional
Status and Trend of Covered Rare Plant
Species
M§13.10.3-1 Complete baseline surveys
within 5 years of
implementation.
Sample every 10 years
thereafter.
Report within year following
sampling.
The terrestrial monitoring programs separate species, habitat, and natural communities. Although
wildlife trees, hardwoods, downed wood, and old-growth may be important habitat components
for both northern spotted owls and marbled murrelets, MRC will monitor them in separate
programs. While wildlife trees, hardwoods, downed wood, and old-growth are all parts of natural
communities, MRC will monitor them in separate programs as well. Each monitoring program
relates directly to a conservation strategy for a specific species, habitat type, or habitat feature.
For each covered species, MRC will monitor both population and habitat. Effectiveness
monitoring for northern spotted owls, for example, will determine the number of Level-1 and
Level-2 territories on covered lands, as well as the amount and distribution of owl habitat. In
monitoring both population and habitat, MRC can examine whether conservation measures are

Mendocino Redwood Company HCP/NCCP
13-70
appropriate. Effectiveness monitoring may indicate that the number of Level-1 and Level-2 owl
territories is decreasing. If the number falls below its original baseline by 20% over 2 years, MRC
will implement contingency measures to attempt to correct the negative trend in northern spotted
owl productivity.
13.7.1 Timeline for terrestrial monitoring
While terrestrial monitoring is constrained by personnel and financial resources, MRC will
monitor Level-1 and Level-2 territories for northern spotted owls and marbled murrelet activity in
LACMA every year of our HCP/NCCP. Most monitoring programs will start within the first 10
years of our HCP/NCCP. Table 13-17 provides an estimated timeline for the first 20 years of
terrestrial monitoring. Monitoring programs in subsequent years of the plan will recycle through
this same schedule, as appropriate.

13-71
Table 13-17 Estimated Timeline for Terrestrial Monitoring
Estimated Timeline for Terrestrial Monitoring
Monitoring
Program Years Since HCP/NCCP Initiation
1 2 3 4 5 6 7 8 9 10 11 12 13 14 15 16 17 18 19 20
M§13.8.1-1 Snags, Wildlife
Trees, Recruitment
Trees, and Downed
Wood
M§13.8.1-2 Basal Area of
Hardwoods in Timber
Stands
M§13.8.1-3 Post-Harvest Follow-
up on Hardwood
Representative
Sample Areas
M§13.8.1-4 Acreage and Number
of Hardwood
Representative
Sample Areas
M§13.8.1-5 Acreage and Number
of Old Growth Stands
and Trees
M§13.8.1-6
Distribution and Area
of Rocky Outcrops
M§13.8.2-1 Common Natural
Communities
M§13.8.2-2
Uncommon Natural
Communities

13-72
Estimated Timeline for Terrestrial Monitoring
Monitoring
Program Years Since HCP/NCCP Initiation
1 2 3 4 5 6 7 8 9 10 11 12 13 14 15 16 17 18 19 20
M§13.8.3-1 Invasive Species
Control
M§13.9.1.3-1
Northern Spotted
Owls: Level-1 and
Level-2 Territories
M§13.9.1.3-2
Northern Spotted
Owls: Distribution
and Acreage of N/R
Habitat
M§13.9.1.4-1
Population Trends of
Northern Spotted
Owls
M§13.9.1.4-2 Identification of
Nesting/Roosting
Habitat for Northern
Spotted Owls OPTIONAL
M§13.9.1.4-3
Benefits of High
Protection for
Northern Spotted
Owls and Their
Territories OPTIONAL
M§13.9.1.4-4
Effect of Harvest
within 1000 ft of
NSO Territories with
Limited Protection

13-73
Estimated Timeline for Terrestrial Monitoring
Monitoring
Program Years Since HCP/NCCP Initiation
1 2 3 4 5 6 7 8 9 10 11 12 13 14 15 16 17 18 19 20
M§13.9.1.4-5
Effect of Habitat on
Productivity of
Northern Spotted
Owls OPTIONAL
M§13.9.1.4-6
Effect of Hardwood
Density on Northern
Spotted Owls
M§13.9.1.4-7
Effect of Barred Owl
Control on Northern
Spotted Owls
M§13.9.2.1-1
Activity Level of
Marbled Murrelets in
Lower Alder Creek
M§13.9.2.1-2
Murrelet Occupancy
in Navarro,
Greenwood Creek,
Albion River
Watersheds
M§13.9.2.2-1
Murrelet Habitat
Distribution in
LACMA OPTIONAL
M§13.9.2.2-2
Methods for
Accelerating Growth
of Murrelet Habitat OPTIONAL
M§13.9.2.2-3
Radar Monitoring in
Additional Drainages OPTIONAL
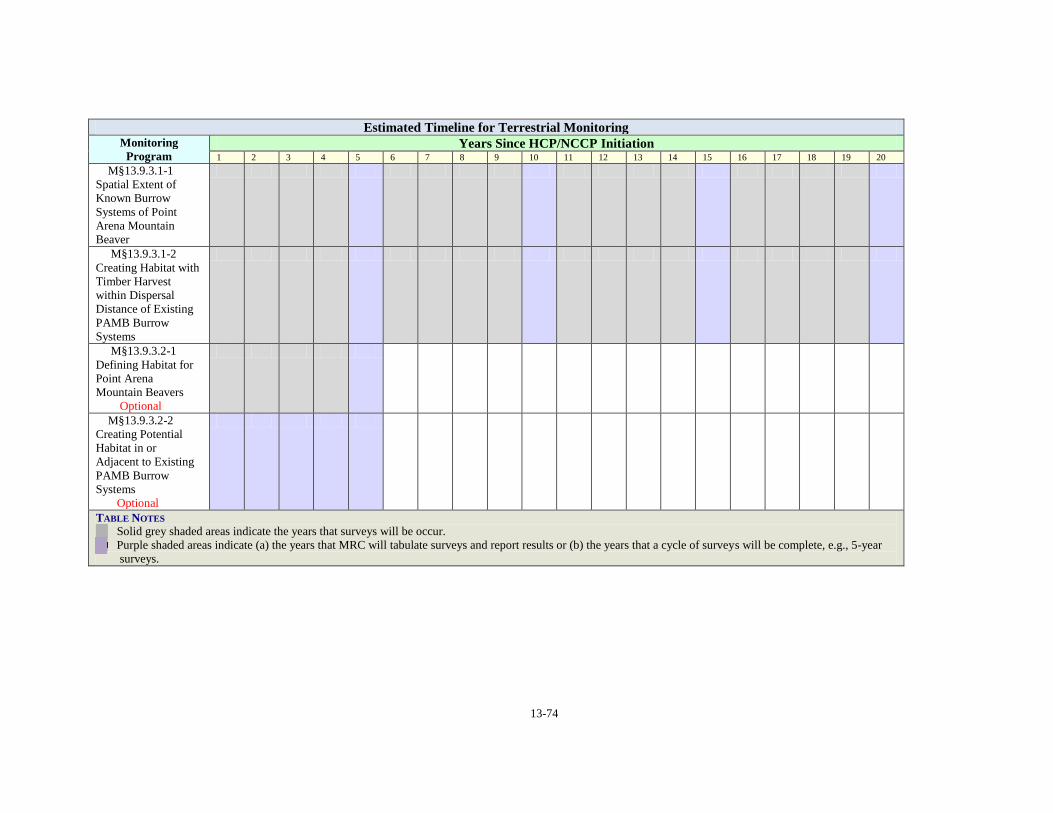
13-74
Estimated Timeline for Terrestrial Monitoring
Monitoring
Program Years Since HCP/NCCP Initiation
1 2 3 4 5 6 7 8 9 10 11 12 13 14 15 16 17 18 19 20
M§13.9.3.1-1
Spatial Extent of
Known Burrow
Systems of Point
Arena Mountain
Beaver
M§13.9.3.1-2
Creating Habitat with
Timber Harvest
within Dispersal
Distance of Existing
PAMB Burrow
Systems
M§13.9.3.2-1
Defining Habitat for
Point Arena
Mountain Beavers
Optional
M§13.9.3.2-2
Creating Potential
Habitat in or
Adjacent to Existing
PAMB Burrow
Systems
Optional
TABLE NOTES
Solid grey shaded areas indicate the years that surveys will be occur.
Purple shaded areas indicate (a) the years that MRC will tabulate surveys and report results or (b) the years that a cycle of surveys will be complete, e.g., 5-year
surveys.

Mendocino Redwood Company HCP/NCCP
13-75
13.8 Monitoring Terrestrial Habitat
For our HCP/NCCP, terrestrial habitat includes hard snags, wildlife trees, and downed wood;
hardwoods; old-growth; rocky outcrops; and natural communities. Effectiveness monitoring will
ensure that MRC meets or exceeds the requirements to maintain these habitat components.
13.8.1 Effectiveness monitoring
Snags, wildlife trees, recruitment trees, and downed wood
The initial number of snags across covered lands may be much lower than our stated objective.
Since we only established specific characteristics of wildlife trees in 2006 and have not begun
marking recruitment trees for wildlife trees or snags, we will use the first 10 years of our
HCP/NCCP to acquire baseline information on these habitat elements.
Effectiveness Monitoring
Snags, Wildlife Trees, Recruitment Trees, and Downed Wood
PROGRAM CODE M§13.8.1-1
OBJECTIVES
O§9.2.2-1
O§9.2.2-2
Retain in Class I and Large Class II AMZ at least
1 hard snag or recruitment tree on average per acre10
that is ≥ 16
in. dbh and ≥ 30 ft in height.
2 hard snags or recruitment trees on average per acre that is ≥ 24
in. dbh and ≥ 40 ft in height.
1 wildlife tree or recruitment tree on average per acre that is ≥ 16
in. dbh and ≥ 30 ft in height.
6 hard logs on average per acre that are (a) ≥ 16 in. average
diameter; ( b) ≥ 6 ft long; and (c) derived from at least 3 trees.
Retain in general forested areas at least
1 hard snag or recruitment tree on average per acre that is ≥16 in.
dbh and ≥ 30 ft in height.
1 hard snag or recruitment tree on average per acre that is ≥ 24 in.
dbh and ≥ 40 ft in height.
1 wildlife tree or recruitment tree on average per acre that is ≥ 16
in. dbh and ≥ 30 ft in height.
5 hard logs on average per acre that are (a) ≥ 16 in. average
diameter; (b) ≥ 6 ft long; and (c) derived from at least 3 trees.
MONITORING APPROACH
Sample forests for snags, wildlife trees, recruitment trees, and pieces of
downed wood (see Appendix U, section U.2.1.4, Data collection at
plots).11
Sample vegetative strata within inventory blocks.
Measure all snags, wildlife trees, recruitment trees (trees marked
with an ―R‖), and downed wood within a 37.2 ft radius (0.10 ac)
plot.
Compile information, every 10 years, about trends in number of snags,
wildlife trees, recruitment trees, and pieces of downed wood for all
covered lands. Compilation will include a yearly estimate of snags,
wildlife trees, recruitment trees, and pieces of downed wood to allow for
annual comparisons and estimates of trend direction. Annual estimates will
10
MRC calculated the value by silvicultural unit and then standardized the value per acre. 11
Samples will come from stands sampled for inventory. For reporting purposes, we will distinguish AMZ stands and
owl core areas from general forest stands.

Mendocino Redwood Company HCP/NCCP
13-76
Effectiveness Monitoring
Snags, Wildlife Trees, Recruitment Trees, and Downed Wood
also be included in an annual report (see Appendix D, D.4.2, Snags,
wildlife trees, recruitment trees, and downed wood). There will be report
breakdowns by planning watersheds, by inventory blocks, and by covered
lands (the standard for agency review).
Establish a baseline mean number of snags, wildlife trees, and pieces of
downed wood based on forest inventory data. As of 2010, covered lands
have an average of 0.36 snags per acre and 6.4 downed logs per acre based
on the definitions in the current inventory protocol.12
Examine trends over 10-year periods to determine if there is a discernible
upward, stable, or downward trend in number of snags, wildlife trees, or
recruitment trees from the baseline assessment.
Examine trends over 10-year periods to determine if there is a discernible
upward, stable, or downward trend in pieces of downed wood.
MEASUREMENT CRITERIA
An upward trend shows an obvious or statistically significant increase (α =
0.10) in the number of snags, wildlife trees, recruitment trees, and pieces
of downed wood from the baseline assessment. MRC will establish the
baseline level of wildlife trees and recruitment trees after the first 10 years
of HCP/NCCP implementation.
A static trend shows no detectable increase or decrease in the number of
snags, wildlife trees, or pieces of downed wood over time from the
baseline assessment, i.e., their number is not statistically different from the
baseline (α = 0.10).
A downward trend shows a statistically significant (α = 0.10) decrease in
the number of snags, wildlife trees, or pieces of downed wood from the
baseline estimate.
ADAPTIVE MANAGEMENT
If MRC detects an upward trend in any 10-year period, MRC and the
wildlife agencies will concur on any changes to the recruitment
requirement for snags, wildlife trees, recruitment trees, or pieces of
downed wood.
If MRC detects a downward trend in any 10-year period, MRC and the
wildlife agencies will concur on methods to improve performance such as
Increase retention numbers, size, or condition of trees retained for
recruitment.
Provide screen trees for recruitment trees.
Create snags.
12
Currently, the inventory department collects data for downed wood with a diameter of at least 6 in. and a length of
10 ft or more. Snags must be at least 6 in. dbh and 10 ft or more in height.
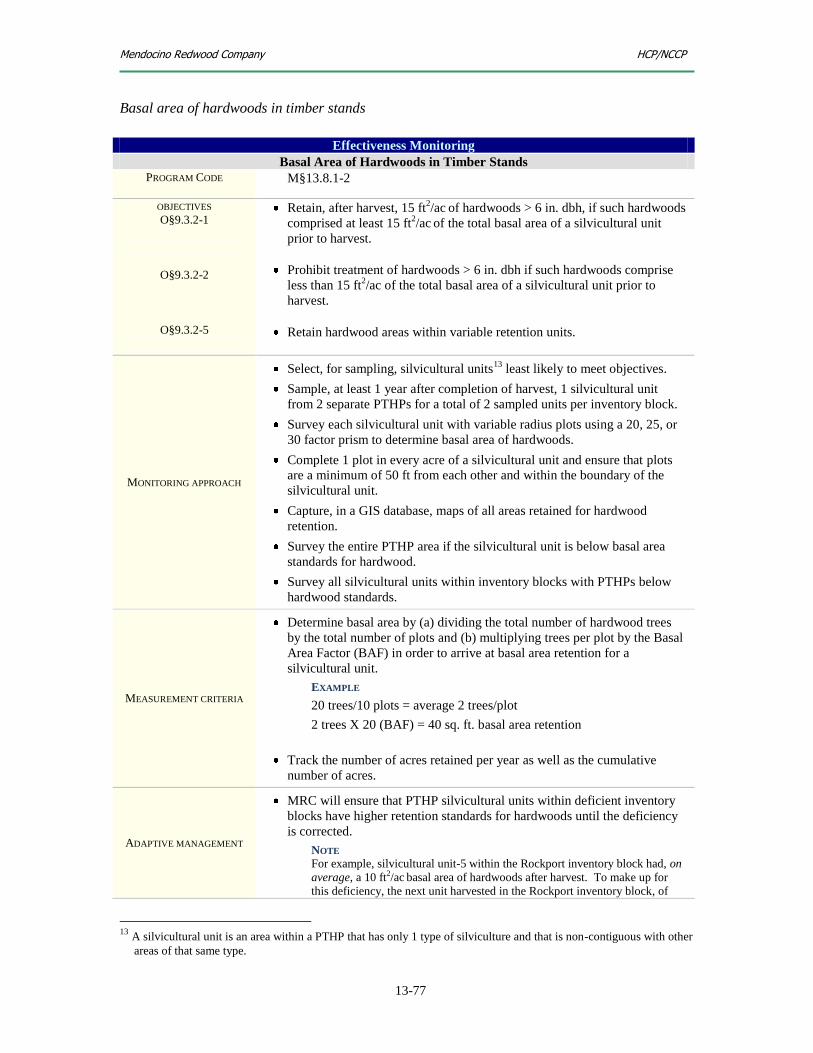
Mendocino Redwood Company HCP/NCCP
13-77
Basal area of hardwoods in timber stands
Effectiveness Monitoring
Basal Area of Hardwoods in Timber Stands
PROGRAM CODE M§13.8.1-2
OBJECTIVES
O§9.3.2-1
O§9.3.2-2
O§9.3.2-5
Retain, after harvest, 15 ft2/ac
of hardwoods > 6 in. dbh, if such hardwoods
comprised at least 15 ft2/ac
of the total basal area of a silvicultural unit
prior to harvest.
Prohibit treatment of hardwoods > 6 in. dbh if such hardwoods comprise
less than 15 ft2/ac of the total basal area of a silvicultural unit prior to
harvest.
Retain hardwood areas within variable retention units.
MONITORING APPROACH
Select, for sampling, silvicultural units13
least likely to meet objectives.
Sample, at least 1 year after completion of harvest, 1 silvicultural unit
from 2 separate PTHPs for a total of 2 sampled units per inventory block.
Survey each silvicultural unit with variable radius plots using a 20, 25, or
30 factor prism to determine basal area of hardwoods.
Complete 1 plot in every acre of a silvicultural unit and ensure that plots
are a minimum of 50 ft from each other and within the boundary of the
silvicultural unit.
Capture, in a GIS database, maps of all areas retained for hardwood
retention.
Survey the entire PTHP area if the silvicultural unit is below basal area
standards for hardwood.
Survey all silvicultural units within inventory blocks with PTHPs below
hardwood standards.
MEASUREMENT CRITERIA
Determine basal area by (a) dividing the total number of hardwood trees
by the total number of plots and (b) multiplying trees per plot by the Basal
Area Factor (BAF) in order to arrive at basal area retention for a
silvicultural unit.
EXAMPLE
20 trees/10 plots = average 2 trees/plot
2 trees X 20 (BAF) = 40 sq. ft. basal area retention
Track the number of acres retained per year as well as the cumulative
number of acres.
ADAPTIVE MANAGEMENT
MRC will ensure that PTHP silvicultural units within deficient inventory
blocks have higher retention standards for hardwoods until the deficiency
is corrected.
NOTE
For example, silvicultural unit-5 within the Rockport inventory block had, on
average, a 10 ft2/ac basal area of hardwoods after harvest. To make up for
this deficiency, the next unit harvested in the Rockport inventory block, of
13
A silvicultural unit is an area within a PTHP that has only 1 type of silviculture and that is non-contiguous with other
areas of that same type.

Mendocino Redwood Company HCP/NCCP
13-78
Effectiveness Monitoring
Basal Area of Hardwoods in Timber Stands
approximately the same or greater acreage as unit-5, must retain 20 ft2/ac of
basal area of hardwoods after harvest. Once deficiencies in unit-5 are
counterbalanced with hardwoods from other silvicultural units in the Rockport
inventory block, that inventory block can revert to the retention standard of 15
ft2/ac of basal area after harvest.
Post-harvest follow-up on hardwood representative sample areas
Effectiveness Monitoring
Post-Harvest Follow-up on Hardwood Representative Sample Areas
PROGRAM CODE M§13.8.1-3
OBJECTIVES
O§9.3.2-6
O§9.3.2-7
Harvest in representative sample areas only to maintain the relative
proportion of hardwoods to conifers.
Designate 1487 ac as representative sample areas for early seral hardwood
stands (Appendix B, HCP/NCCP Atlas, MAPS 4A-C).
MONITORING APPROACH Complete inventory cruise of all hardwood representative sample areas
before and after harvest (Appendix U, section U.2, Sampling Method).
MEASUREMENT CRITERIA
Determine relative site occupancy of hardwoods-to-conifers before and
after harvest by
Comparing basal area of each species by 8 in. size class before and
after harvest.
Comparing density of stems of each species before and after
harvest.
ADAPTIVE MANAGEMENT
If forestry operations result in a change in the relative proportion of
hardwoods-to-confers in a representative sample area, MRC will designate
a new representative sample area in the same general location and of the
same general size, if possible, as a replacement.
Acreage and Number of Hardwood representative sample areas
Effectiveness Monitoring
Acreage and Number of Hardwood Representative Sample Areas
PROGRAM CODE M§13.8.1-4
OBJECTIVES
O§9.3.2-6
O§9.3.2-7
Harvest in representative sample areas only to maintain the relative
proportion of hardwoods to conifers.
Designate 1487 ac as representative sample areas for early seral hardwood
stands (Appendix B, HCP/NCCP Atlas, MAPS 4A-C).
MONITORING APPROACH
Review representative sample areas once every 10 years by aerial photos
or satellite images and by ground visits to ensure they retain their desired
characteristics.

Mendocino Redwood Company HCP/NCCP
13-79
Effectiveness Monitoring
Acreage and Number of Hardwood Representative Sample Areas
MEASUREMENT CRITERIA Compare the acreage of the original hardwood sample areas to current
hardwood sample areas.
ADAPTIVE MANAGEMENT
Review changes in current sample areas from the original 1487 ac of
sample areas.
Substitute, if possible, a new representative sample area in the same
general location and of the approximate acreage, if harvest changes the
relative proportion of hardwoods to conifers in a representative sample
area.
Meet with the wildlife agencies if changes are due to management
practices—even practices outside of the hardwood sample areas—and
determine if adaptive management is necessary.
Old growth
Effectiveness Monitoring
Acreage and Number of Old Growth Stands and Trees
PROGRAM CODE M§13.8.1-5
OBJECTIVES
O§9.4.2-1
O§9.4.2-2
O§9.4.2-3
Maintain 101 ac of Type I old growth currently identified in the plan area,
as well as any new Type I old-growth stands later discovered in the plan
area, in order to retain their stand acreage and enhance stand function.
Maintain 520 ac of Type II stands currently identified in the plan area, as
well as any new Type II stands later discovered in the plan area in order to
retain their stand acreage and enhance stand function.
Increase acreage of mature and late successional forest within AMZ and
LACMA (see M§13.9.2.2-1, M§13.5.1.2-2, M§13.5.1.1-1, M§13.5.1.1-2).
MONITORING APPROACH
MRC will confirm the acreage of Type II old-growth stands during the
first 40 years of our HCP/NCCP.
MRC will re-assess Type I and Type II old-growth acreage at least every
10 years or when the composition of the stand changes, e.g., with the
discovery of new stands or after catastrophic fires or storms affect Type I
stands or stands with Type II old-growth.
MRC acknowledges that drawing a ―boundary line‖ around an old growth
stand is difficult and will result in some observer bias. The intent is that
the ―boundary line‖ around each stand includes all old-growth trees within
the stand and their screen trees. Type I stands will remain un-harvested
reserves even if all their trees burn in a catastrophic fire or other natural
disasters occur.
MRC will visit and assess, over a 10-year period, each Type I and Type II
stand to ensure we maintain or enhance old-growth characteristics (e.g.,
density of old growth trees and presence of downed wood).
MRC will inventory single old-growth trees during timber cruises prior to
harvest.
MRC will photograph, when possible, reference areas within Type I and
Type II stands to assess changes over time.

Mendocino Redwood Company HCP/NCCP
13-80
Effectiveness Monitoring
Acreage and Number of Old Growth Stands and Trees
MRC will take aerial imagery at least once every 10 years, that show the
boundaries of Type I and Type II old-growth stands.
MRC will report to the wildlife agencies the number of individual old-
growth trees.
MEASUREMENT CRITERIA
MRC will use acres of un-harvested old-growth (Type I) as well as
number and acreage of Type II old-growth stands as indices of
conservation effectiveness.
ADAPTIVE MANAGEMENT
MRC does not expect acreage of old growth stands on our land to change
drastically.
MRC expects Type II old-growth to increase slightly within the first 10
years of our HCP/NCCP as we discover new old growth stands.
MRC will report to the wildlife agencies any decrease in acres of old-
growth stands.
MRC will meet with the wildlife agencies if the size of Type I or Type II
old-growth stands decreases more than 10%.
NOTE
MRC set the ―red flag‖ at a decrease that exceeds 10% because some stands
may currently be misclassified or incorrectly mapped. Any reduction up to
10% could simply be a result of this type of measurement error. In fact, prior
to HCP/NCCP implementation, we discovered errors that changed the amount
of Type I acres by as much as 10%.
MRC will meet with the wildlife agencies to determine potential adaptive
management if the number of individual old growth trees decline
unexpectedly.
Rocky outcrops
Effectiveness Monitoring
Distribution and Area of Rocky Outcrops
PROGRAM CODE M§13.8.1-6
OBJECTIVE
O§9.5.2-1
Preserve and maintain 3 rocky outcrops comprising 63 ac (20 ha) across 3
planning watersheds.
MONITORING APPROACH
MRC will examine aerial imagery every 10 years to track changes in the
number and size of rocky outcrops on our land.
MRC will identify all rocky outcrops on our land, excluding those in use
as rock pits at the time of HCP/NCCP implementation.
MRC will evaluate acres of rocky outcrops by planning watershed using
aerial photos and on-the-ground reconnaissance.
MRC acknowledges that drawing ―boundary lines‖ around rocky outcrops
is difficult. Our intent is to encompass all areas at least 1 ac in size in
which ground cover is entirely rock and in which near vertical rock faces
are at least 50 ft high and 100 ft long; these areas are not currently in use
as rock pits.
MEASUREMENT CRITERIA MRC will use the number and size of rocky outcrops to detect changes
across our land; rocky outcrops must be at least 1 ac in size and not

Mendocino Redwood Company HCP/NCCP
13-81
Effectiveness Monitoring
Distribution and Area of Rocky Outcrops
currently in use as a rock pit to qualify for protection.
MRC will not use any of our current 63 ac of rocky outcrops for rock pits.
ADAPTIVE MANAGEMENT
MRC anticipates that the actual acres of rocky outcrops on our lands may
change as survey techniques improve.
MRC will meet with the wildlife agencies to determine potential adaptive
management, if the distribution or area of rocky outcrops declines
unexpectedly.
13.8.2 Natural communities
Obviously there is no single method to survey and monitor an entire ecosystem. At best,
biologists can use indicators to judge the ongoing health of a natural community, for example:
Is the acreage of a natural community shrinking or expanding?
Is the population of a covered species in the natural community, such as the northern
spotted owl, increasing, decreasing, or remaining stable?
Is the distribution of an indicator species in a natural community changing?
Is the species distribution within the natural community changing?
MRC is proposing that the level of monitoring intensity for a natural community be
commensurate with the level of impact from management activities. Coastal redwood and
Douglas-fir forest, mixed evergreen forest, and riparian forest comprise 98% of covered lands.
The vast majority of the MRC monitoring effort will be in these 3 natural communities. Very
limited monitoring will take place in the other natural communities—closed-cone or pygmy
forest, oak woodland, salt marsh, and natural grassland—because they represent less than 2% of
covered lands and little impact will occur in these areas. In pygmy forest, for example, there will
be no timber harvesting and minimal road construction. Likewise, there will be no timber
harvesting in oak woodlands; MRC will only conduct essential timber harvesting in conifer
stands that border this natural community. Communities with few covered activities still merit
monitoring to reveal changes in the status of constituent species or their habitat conditions. These
changes may be due to human activity (e.g., litter, pollution, and alteration) or natural processes
(e.g., succession and invasive species).
While Chapter 13 proposes specific monitoring goals for aquatic and terrestrial habitat and
species, as well as rare plants, these goals in total can be a measure of the health of the MRC
natural communities.
Common natural communities
This category applies to coastal redwood and Douglas-fir forest, mixed evergreen forest, and
riparian forest. In this category, MRC will monitor covered species and their habitat through
surveys and data gathering.
Covered Species
Monitoring abundance, richness, and distribution of covered species within a
natural community can indicate whether changes are taking place that affect the
health of the community. Analysis of data collected over time can show trends
and signal declines and increases in the health of a community.
Aquatic and Terrestrial Habitat

Mendocino Redwood Company HCP/NCCP
13-82
Monitoring abundance, richness, and distribution of habitat elements, such as
snags, downed wood, or hardwoods, can show trends that signal declines and
increases in the health of a community. More inclusive monitoring of species
habitat, like the older forests preferred by northern spotted owls, may provide
even better insight. All this information taken together can isolate limiting factors
and improve community health.
Common natural communities
Effectiveness Monitoring
Common Natural Communities
PROGRAM CODE M§13.8.2-1
OBJECTIVES
O§9.6.1.2-1
O§9.6.1.2-2
O§9.6.1.2-3
Regenerate harvested conifer forest with a mix of conifer species similar to
the harvested stand.
Maintain various successional stages of coastal forest, including Type I
and Type II old growth stands and representative hardwood forest areas.
Maintain existing stand dominance of native conifers other than redwood
and Douglas-fir where this occurs.
MONITORING APPROACH
MRC will review the number and species distribution of conifer species
planted in harvested conifer stands.
MRC will conduct a review every 5 years of structure classes on covered
lands.
MRC will assess the number of planted species to dominant species in any
conifer stand in which conifers other than redwood and Douglas-fir
predominate.
MEASUREMENT CRITERIA
MRC will compare the number and species distribution of conifer species
planted in a harvested stand with those that were harvested. If the
distribution of planted conifer species is different from the distribution that
existed prior to harvest, MRC will provide a rationale for the difference.
MRC will consider proportion of planted species significantly different if
it varies by more than 20% from the dominant conifer species mix.
MRC will continue ongoing review of structure classes in the expectation
that there will be a trend towards mid-to-late successional stages.
MRC will review with the wildlife agencies if a change in structure class
exceeds +/- 20%.
ADAPTIVE MANAGEMENT
MRC will meet with the wildlife agencies, if any significant changes
occur, to determine corrective actions, as needed.
MRC will review with the wildlife agencies any change in structure class
which exceeds +/- 20% of the initial baseline numbers.
Uncommon natural communities
This category applies to closed-cone (pygmy and Bishop pine), oak woodland, and natural
grassland. It is unlikely that covered activities will have a significant impact on these
communities.
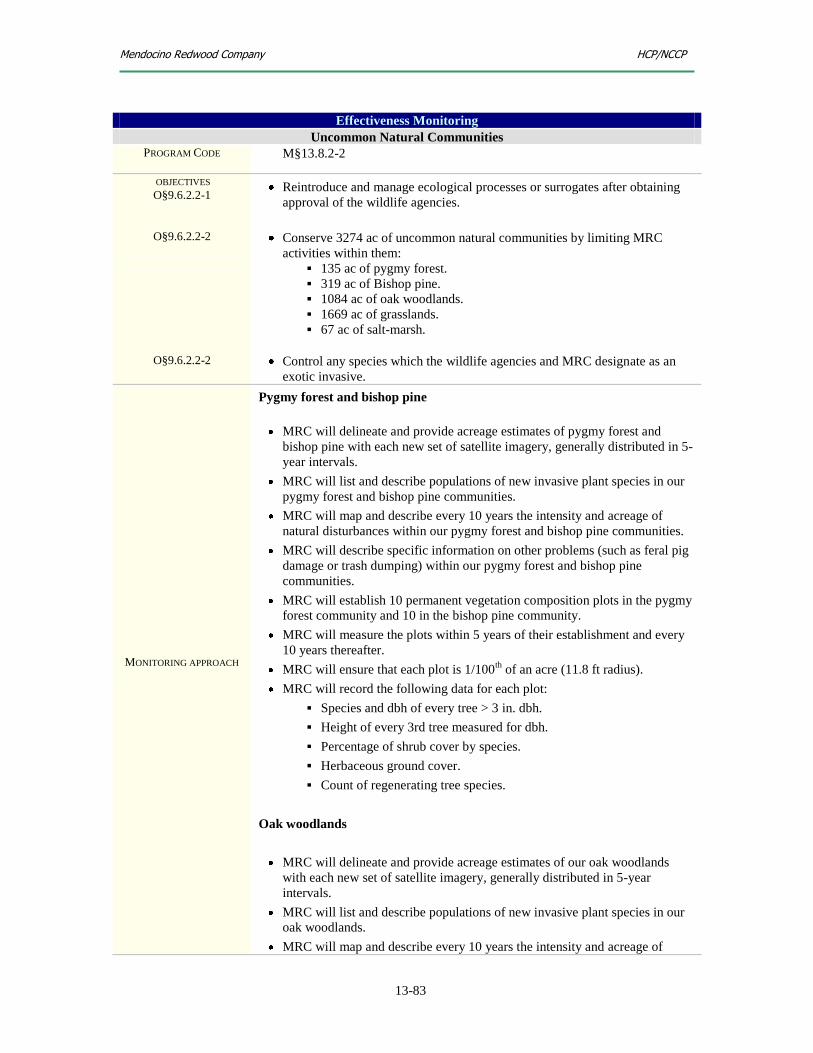
Mendocino Redwood Company HCP/NCCP
13-83
Effectiveness Monitoring
Uncommon Natural Communities
PROGRAM CODE M§13.8.2-2
OBJECTIVES
O§9.6.2.2-1
O§9.6.2.2-2
O§9.6.2.2-2
Reintroduce and manage ecological processes or surrogates after obtaining
approval of the wildlife agencies.
Conserve 3274 ac of uncommon natural communities by limiting MRC
activities within them:
135 ac of pygmy forest.
319 ac of Bishop pine.
1084 ac of oak woodlands.
1669 ac of grasslands.
67 ac of salt-marsh.
Control any species which the wildlife agencies and MRC designate as an
exotic invasive.
MONITORING APPROACH
Pygmy forest and bishop pine
MRC will delineate and provide acreage estimates of pygmy forest and
bishop pine with each new set of satellite imagery, generally distributed in 5-
year intervals.
MRC will list and describe populations of new invasive plant species in our
pygmy forest and bishop pine communities.
MRC will map and describe every 10 years the intensity and acreage of
natural disturbances within our pygmy forest and bishop pine communities.
MRC will describe specific information on other problems (such as feral pig
damage or trash dumping) within our pygmy forest and bishop pine
communities.
MRC will establish 10 permanent vegetation composition plots in the pygmy
forest community and 10 in the bishop pine community.
MRC will measure the plots within 5 years of their establishment and every
10 years thereafter.
MRC will ensure that each plot is 1/100th
of an acre (11.8 ft radius).
MRC will record the following data for each plot:
Species and dbh of every tree > 3 in. dbh.
Height of every 3rd tree measured for dbh.
Percentage of shrub cover by species.
Herbaceous ground cover.
Count of regenerating tree species.
Oak woodlands
MRC will delineate and provide acreage estimates of our oak woodlands
with each new set of satellite imagery, generally distributed in 5-year
intervals.
MRC will list and describe populations of new invasive plant species in our
oak woodlands.
MRC will map and describe every 10 years the intensity and acreage of

Mendocino Redwood Company HCP/NCCP
13-84
Effectiveness Monitoring
Uncommon Natural Communities
natural disturbances within our oak woodlands.
MRC will describe specific information on other problems (such as feral pig
damage or trash dumping) within our oak woodlands.
MRC will establish 20 permanent vegetation composition plots within our
oak woodlands.
MRC will measure the plots within 5 years of their establishment and every
10 years thereafter.
MRC will ensure that each plot is 1/10th
of an acre (37.2 ft radius).
MRC will record the following for each plot:
Species and dbh of every tree > 6 in. dbh.
Height of every 3rd tree measured for dbh.
Percentage of shrub cover by species.
Count of regenerating tree species.
Grasslands
MRC will delineate and provide acreage estimates of our grasslands with
each new set of satellite imagery, generally distributed in 5-year intervals.
MRC will list and describe populations of new invasive plant species in our
grasslands.
MRC will map and describe every 10 years the intensity and acreage of
natural disturbances within our grasslands.
MRC will describe specific information on other problems (such as feral pig
damage or trash dumping) within our grasslands.
MRC will establish permanent photo point plots at 20 randomly selected
locations within our currently existing grasslands.
MRC will take photos in every cardinal direction from each plot center
within 5 years of plot establishment and every 10 years thereafter.
Salt-Marsh
MRC will delineate salt-marsh and estimate its acreage with each new set of
satellite imagery, and then distribute this information in 5-year intervals.
MRC will list and describe populations of new invasive plant species in our
salt-marsh.
MRC will map and describe the intensity and acreage of natural disturbances
within our salt marsh every 10 years.
MEASUREMENT CRITERIA
MRC will compare all future data to baseline data in a report provided to the
wildlife agencies within 1 year following measurements.
MRC will compare future data to baseline data to determine if species
composition is changing in natural communities.

Mendocino Redwood Company HCP/NCCP
13-85
Effectiveness Monitoring
Uncommon Natural Communities
ADAPTIVE MANAGEMENT
MRC will analyze the data and meet with the wildlife agencies to assess
changes in species composition in these uncommon natural communities.
NOTE
If MRC and the wildlife agencies agree that there is a change in species
composition in these communities, the wildlife agencies may provide
financial assistance to MRC to address the changes that shift the natural
community away from its current type (e.g., oak woodland shifting towards
Douglas fir).
13.8.3 Invasive species control
Effectiveness Monitoring
Invasive Species Control
PROGRAM CODE M§13.8.3-1
OBJECTIVES
O§9.7.2-1
O§9.7.2-2
O§9.7.2-2
Eradicate or reduce the cover, biomass, and distribution of target, non-
native invasive plants, such as jubata grass, broom, and eucalyptus, in the
plan area through an Invasive Plant Control Program (IPCP).
Reduce the number and distribution of non-native, invasive animals, such
as bullfrogs, if they threaten the ecological balance in natural communities
or the populations of covered species.
Implement, with external or MRC funding and with the cooperation of the
wildlife agencies as well as other land agencies, control programs which
benefit the region through information on existing and newly discovered
invasive species.
MONITORING APPROACH
MRC will provide the wildlife agencies an annual progress report on
developing the Invasive Plant Control Program (IPCP).
MRC will develop a database, in consultation with the wildlife agencies,
of current and historic outbreaks of invasive species in the plan area,
including
Relative size of the outbreak.
GPS location.
Treatment (chemicals, amount, and application).
Control outcomes.
MRC will report annually to the wildlife agencies on known populations
of invasive species in the plan area.
MEASUREMENT CRITERIA MRC will compare all future data to baseline data and issue a report to the
wildlife agencies within 1 year of data collection.
ADAPTIVE MANAGEMENT
MRC will meet with the wildlife agencies, if any significant changes
occur, to determine corrective actions, as needed.

Mendocino Redwood Company HCP/NCCP
13-86
13.9 Monitoring terrestrial species
13.9.1 Northern spotted owls
13.9.1.1 Productive and strategic territories
Effectiveness monitoring for northern spotted owls consists of 2 monitoring programs. The first
monitoring program determines reproductive status of known productive territories and whether
―strategic‖ territories may produce young in the near future. The ―strategic‖ territories may
replace other Level-1 and Level-2 territories that decline in productivity as the owls within the
territories grow older or are displaced. The second program tracks habitat distribution on the
landscape to ensure MRC is meeting our objectives.
13.9.1.2 Banding program
As part of our monitoring and management, MRC proposes to band spotted owls. This will help
us better understand the demographic patterns of our owl populations, as well as the success at
reproduction and survival of individual owls protected by different management strategies.
Banding under our HCP/NCCP permit will replace the typical recovery permit. In order to
accommodate the wildlife agencies, we have accepted the following restrictions:
1. MRC must band or re-sight at least 60 northern spotted owls in every calendar year.
2. MRC will meet with the wildlife agencies, if we do not succeed in banding or re-
sighting the requisite number of spotted owls, to determine if we can continue the
banding program.
3. MRC will include in an annual report (a) re-sightings of spotted owls dispersing from
other timberlands or other territories on covered lands; (b) calculations to determine
owl demographic parameters14
of populations (such as survival); and (c) lists of all
bands placed on spotted owls.
4. MRC will report any injury or mortality to the wildlife agencies.
5. MRC will only use individuals approved by the wildlife agencies to band spotted
owls.
If MRC does not adhere to the above restrictions, the wildlife agencies may rescind our banding
authorization.
13.9.1.3 Effectiveness monitoring
Level-1 and level-2 territories of northern spotted owls
Effectiveness Monitoring
Northern Spotted Owls: Level-1 and Level-2 Territories
PROGRAM CODE M§13.9.1.3-1
OBJECTIVES
O§10.3.1.2-1
O§10.3.1.2-2
Population Objective 1
Maintain at least 28 Level-1 territories and 67 Level-2 territories during
the first 60 years of our HCP/NCCP.
Population Objective 2
Increase to 34 Level-1 territories and 80 Level-2 territories by Year 75 of
our HCP/NCCP.
14
Because of the years of data collection needed to calculate these parameters, MRC may not be able to provide any
statistically valid demographics until 10 years after HCP/NCCP implementation.

Mendocino Redwood Company HCP/NCCP
13-87
Effectiveness Monitoring
Northern Spotted Owls: Level-1 and Level-2 Territories
O§10.3.1.2-3
O§10.3.1.2-4
Distribution Objective 1
Achieve by Year 40 of our HCP/NCCP a distribution of spotted owl
territories in each inventory block that is proportionate to its potential
nesting/roosting habitat in the plan area, i.e., an inventory block with 10%
of the total nesting/roosting habitat on MRC covered lands should have at
least 10% of the Level-1 and Level-2 territories specified in the population
objectives (see Table 10-7).
Distribution Objective 2
Achieve by Year 75 of our HCP/NCCP a distribution of spotted owl
territories in each inventory block that exceeds Distribution Objective 1 by
20% (see Table 10-7).
MONITORING APPROACH
MRC will use standard protocols to survey and monitor northern spotted
owl reproduction (see Appendix K, section K.5, Protocols).
MRC will annually monitor all territories assigned high or moderate
protection as well as strategic territories with limited protection to identify
their productivity level, using the following parameters:
Occupancy status (male, female, pair, absent, unknown).
Nesting status (nesting, nesting unknown, or non-nesting).
Number of fledglings produced (unknown, 0, 1, 2, or 3).
MRC will determine the number and locations of strategic Level-3 owls to
monitor using the following parameters:
Number of Level-1 and Level-2 owl territories in the previous year.
Number of Level-3 territories within inventory blocks that may not
meet distribution objectives.
Proximity of Level-3 territories to harvests or other operations.
MRC will band and track Level-1, Level-2, and strategic Level-3 spotted
owls.
ADAPTIVE MANAGEMENT MRC will implement contingency strategies, if the number of Level-1 and
Level-2 territories falls below contingency triggers (section 10.3.2.5).
Distribution and acreage of nesting/roosting habitat
Effectiveness Monitoring
Northern Spotted Owls: Distribution and Acreage of Nesting/Roosting Habitat
PROGRAM CODE M§13.9.1.3-2
OBJECTIVES
O§10.3.1.2-5
O§10.3.1.2-6
Habitat Objective 1
Achieve by Year 40 of our HCP/NCCP a landscape configuration in which
23% of all potential habitat is nesting/roosting habitat, while still
maintaining separate objectives for each inventory block.
Habitat Objective 2
Achieve by Year 75 of our HCP/NCCP a landscape configuration in which
25% of all potential habitat and 25% of each inventory block are
nesting/roosting habitat.

Mendocino Redwood Company HCP/NCCP
13-88
Effectiveness Monitoring
Northern Spotted Owls: Distribution and Acreage of Nesting/Roosting Habitat
MONITORING APPROACH
MRC will use data from our forest inventory and growth model to
determine the amount of nesting/roosting habitat by inventory block every
10 years for all covered lands (see Appendix U, section U.7, Structure
Classes and Habitat Inferences).
ADAPTIVE MANAGEMENT
MRC will confer with the wildlife agencies, if we do not meet Habitat
Objective 1 or Habitat Objective 2, to determine whether we should
implement potential adaptive management strategies including
Increasing the minimum habitat retention within 0.7 miles of core
areas.
Increasing core areas in owl territories with high protection to
increase overall habitat.
13.9.1.4 Validation monitoring
Though limited in scope, validation monitoring requires more intensive effort than effectiveness
monitoring. MRC will examine 6 hypotheses related to owl population trends, habitat
classification, and protection levels. All validation monitoring programs are optional with the
exception of those for Hypothesis 1 and Hypothesis 4. Hypotheses 3 through 6 use the MRC
banding program as an assessment tool.
Population trends (required)
Validation Monitoring
Population Trends of Northern Spotted Owls
PROGRAM CODE M§13.9.1.4-1
HYPOTHESIS
SECTION 5.2.10
The number of northern spotted owl territories is stable or increasing on
covered lands in the short-term and will increase in the long-term.
MONITORING APPROACH
MRC will track trends of spotted owls by completing a rolling 5-year survey
over covered lands; survey results will include the number of owl detections
and territories located.
MRC will complete 3 surveys within 1 year in inventory blocks, covering
an equivalent acreage every year (see Appendix K, section K.5, Protocols).
MRC will coordinate our survey efforts with other surveys (e.g., PTHP
surveys and effectiveness monitoring for Level-1 and Level-2 territories) so
that we do not ―over-call‖ owls.
MRC will geographically stratify inventory blocks in order to decrease the
effect of geography on results.
MEASUREMENT CRITERIA
MRC will compare the number of territories located every 5 years with
those located in the previous 5 years to determine if the number of
territories has increased, decreased, or remained the same (see Appendix K,
section K-7, Survey plan for determining population trends).
MRC will report on the number of territories detected annually and consult
with the wildlife agencies on how to detect a trend in the number of
territories.

Mendocino Redwood Company HCP/NCCP
13-89
Validation Monitoring
Population Trends of Northern Spotted Owls
ADAPTIVE MANAGEMENT
MRC will examine the cause of any deviation from the previous number of
territories and meet with the wildlife agencies.
MRC may convene a scientific review panel to examine the causes of
decline and to recommend corrective actions.
Nesting/roosting habitat (optional)
Validation Monitoring
Identification of Nesting/Roosting Habitat for Northern Spotted Owls
PROGRAM CODE M§13.9.1.4-2
HYPOTHESIS
SECTION 5.2.10
MRC has used structure classes to correctly designate nesting/roosting
habitat.
MONITORING APPROACH
MRC has developed a nest site protocol to ground-truth areas around nest
sites and compare habitat features around nests to random sites (see
Appendix K, section K.3.3. Comparison of nest tree and random tree).
MRC will ground-truth at least 100 nest sites using this method.
MRC will complete the first set of nest sites by HCP/NCCP
commencement.
MRC will undertake the nest-site survey again 40 years after HCP/NCCP
commencement to determine if northern spotted owls select different
nesting habitat as habitat changes in response to timber management.
MRC will enter data from the nest-site survey into a spreadsheet and
translate the data into inventory structure classes, used to assign habitat
types to stands.
MRC will categorize structure classes as nesting/roosting, foraging, or
unsuitable habitat (section 10.3.1.4.7, Validation of habitat typing).
NOTE
MRC will not re-sample nest sites from the same northern spotted owl territory
until we have measured all Level-1 and Level-2 territories. This should limit
any statistical biases associated with a lack of independence.
MEASUREMENT CRITERIA
MRC will determine what percentage of our sampled nest sites are in plots
not identified in our inventory as nesting/roosting habitat.
ADAPTIVE MANAGEMENT
MRC will meet with the wildlife agencies to discuss potential changes in
habitat typing if our verification rate is less than 60% correct.
NOTE
MRC can only make changes to structure class assignments with prior approval
of the wildlife agencies.
MRC will meet with the wildlife agencies to change structure class
assignments if either believes a change is warranted—even in cases where
MRC habitat typing proves to be 60% or more correct.
MRC will notify the agencies of any changes in structure class assignments,
including affected acreage, through the annual report for northern spotted
owls.
MRC will adjust or alter the rules for designating structure class, as
required.

Mendocino Redwood Company HCP/NCCP
13-90
Benefits of high protection (optional)
Validation Monitoring
Benefits of High Protection for Northern Spotted Owls and Their Territories
PROGRAM CODE M§13.9.1.4-3
HYPOTHESIS
SECTION 5.2.10
The demographic parameters of individual owls and owl territories with
high protection will show more improvement than those with moderate
protection.
MONITORING APPROACH
MRC will develop, in consultation with the wildlife agencies, a study plan.
MRC will follow all banding procedures outlined in Appendix K, section
K.6.2, Banding of northern spotted owls.
MRC will band each northern spotted owl with a color patterned band on
one leg (for ease of re-sighting) and an individual USFWS numbered band
on the other leg (for recapture identification).
MRC will assess productivity levels of all territories and individual owls
protected with high and moderate protection using protocols outlined in
Appendix K, section K.5.3, Protocols for determining reproductive status.
MRC will assign owls the productivity level of the territory they inhabit at
the time of assessment.
MRC will use 10 years of productivity data to assess a total productivity for
each individual owl or owl territory assessed.
MRC will determine the total years of high protection for each individual
owl or owl territory.
MRC will evaluate each territory on its assigned protections as well as on its
functional protection (i.e., the average amount of habitat acreage present
regardless of assigned productivity level) during the 10-year assessment
timeline.
MEASUREMENT CRITERIA
MRC will determine if high protection results in improved demographic
parameters of northern spotted owls or owl territories.
MRC will infer that assigned or equivalent high protection results in
enhanced vital rates or territory occupation if the number of
fledglings, survival of adults, or fidelity to the territory is greater
than sites assigned moderate protection.
MRC will infer that assigned or equivalent high protection results in
equivalent vital rates or territory occupation if the number of
fledglings, survival of adults, or fidelity to the territory is equal to
sites assigned moderate protection.
MRC will infer that assigned or equivalent high protection has a
negative impact on vital rates or territory occupation if the number of
fledglings, survival of adults, or fidelity to the territory is less than
sites assigned moderate protection.
ADAPTIVE MANAGEMENT
MRC will provide the most productive spotted owls with a 90-acre core area
if a there is a detectable positive effect from the high protection measures.
MRC will provide the most productive spotted owls with a 72-acre core area
if there is a detectable negative effect from the high protection measures.
MRC will only make adaptive management changes after at least 20 years
of data collection, including contingencies.
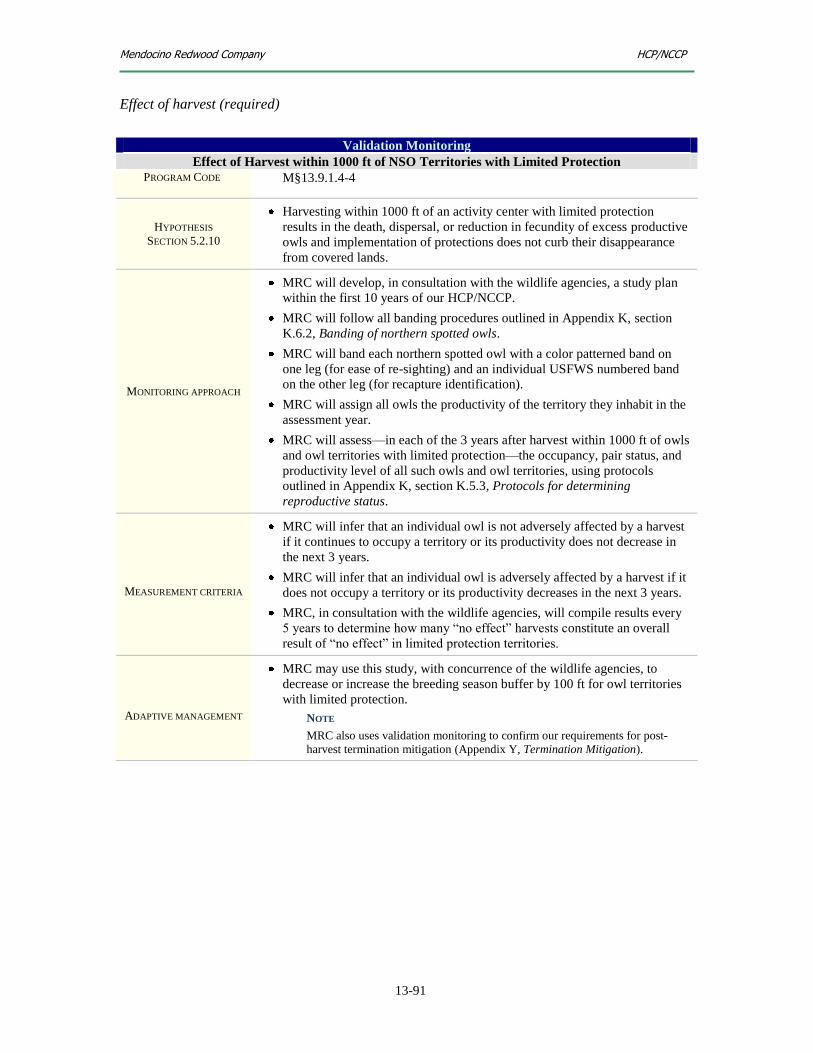
Mendocino Redwood Company HCP/NCCP
13-91
Effect of harvest (required)
Validation Monitoring
Effect of Harvest within 1000 ft of NSO Territories with Limited Protection
PROGRAM CODE M§13.9.1.4-4
HYPOTHESIS
SECTION 5.2.10
Harvesting within 1000 ft of an activity center with limited protection
results in the death, dispersal, or reduction in fecundity of excess productive
owls and implementation of protections does not curb their disappearance
from covered lands.
MONITORING APPROACH
MRC will develop, in consultation with the wildlife agencies, a study plan
within the first 10 years of our HCP/NCCP.
MRC will follow all banding procedures outlined in Appendix K, section
K.6.2, Banding of northern spotted owls.
MRC will band each northern spotted owl with a color patterned band on
one leg (for ease of re-sighting) and an individual USFWS numbered band
on the other leg (for recapture identification).
MRC will assign all owls the productivity of the territory they inhabit in the
assessment year.
MRC will assess—in each of the 3 years after harvest within 1000 ft of owls
and owl territories with limited protection—the occupancy, pair status, and
productivity level of all such owls and owl territories, using protocols
outlined in Appendix K, section K.5.3, Protocols for determining
reproductive status.
MEASUREMENT CRITERIA
MRC will infer that an individual owl is not adversely affected by a harvest
if it continues to occupy a territory or its productivity does not decrease in
the next 3 years.
MRC will infer that an individual owl is adversely affected by a harvest if it
does not occupy a territory or its productivity decreases in the next 3 years.
MRC, in consultation with the wildlife agencies, will compile results every
5 years to determine how many ―no effect‖ harvests constitute an overall
result of ―no effect‖ in limited protection territories.
ADAPTIVE MANAGEMENT
MRC may use this study, with concurrence of the wildlife agencies, to
decrease or increase the breeding season buffer by 100 ft for owl territories
with limited protection.
NOTE
MRC also uses validation monitoring to confirm our requirements for post-
harvest termination mitigation (Appendix Y, Termination Mitigation).

Mendocino Redwood Company HCP/NCCP
13-92
Effect of habitat on productivity (optional)
Validation Monitoring
Effect of Habitat on Productivity of Northern Spotted Owls
PROGRAM CODE M§13.9.1.4-5
HYPOTHESIS
SECTION 5.2.10
The pattern, arrangement, and amount of acreage of both foraging and
nesting/roosting habitat within 0.7 miles of an activity center can affect the
productivity of the associated owl and its territory.
MONITORING APPROACH
MRC will develop, in consultation with the wildlife agencies, a study plan.
MRC will follow all banding procedures outlined in Appendix K, section
K.6.2, Banding of northern spotted owls.
MRC will band each northern spotted owl with a color patterned band on one
leg (for ease of re-sighting) and an individual USFWS numbered band on the
other leg (for re-capture identification).
MRC will assess occupancy, pair status, and productivity level of (a) all
banded owls, (b) all owls receiving high or moderate protection, and (c)
some owls receiving limited protection, according to the protocols outlined
in Appendix K, section K.5.3, Protocols for determining reproductive status.
MRC will assign all owls the productivity of the territory they inhabit in the
assessment year.
MRC will compute the amount of each habitat type within 0.7 miles of
selected spotted owl territories during the time frame of assessment.
MEASUREMENT CRITERIA
MRC, in consultation with the wildlife agencies, will compile results every 5
years to determine if we need to make any changes in habitat protection.
ADAPTIVE MANAGEMENT
MRC, with concurrence of the wildlife agencies, will decrease the amount of
required habitat for moderate protection owls within 0.7 miles of the current
activity center from 500 ac to 450 ac if owl productivity does not positively
correlate with the amount of foraging and nesting/roosting habitat
MRC, with concurrence of the wildlife agencies, will increase the amount of
required habitat for moderate protection owls within 0.7 miles of the current
activity center from 500 ac to 550 ac if owl productivity does positively
correlate with the amount of foraging and nesting/roosting habitat.
Effect of hardwood acreage on northern spotted owls (required)
Validation Monitoring
Effect of Hardwood Density on Northern Spotted Owls
PROGRAM CODE M§13.9.1.4-6
HYPOTHESIS
SECTION 5.2.10 There is no correlation between spotted owls and the amount and basal area
of hardwoods, especially tanoaks within 0.7 miles of owl activity centers.
MONITORING APPROACH
MRC will develop, in consultation with the wildlife agencies, a study plan
within the first 10 years of HCP/NCCP implementation.
MRC will follow all banding procedures outlined in Appendix K, section
K.6.2, Banding of northern spotted owls.
MRC will assess productivity of all individual owls and territories selected
for 3 consecutive years, using protocols outlined in Appendix K, section

Mendocino Redwood Company HCP/NCCP
13-93
Validation Monitoring
Effect of Hardwood Density on Northern Spotted Owls
K.5.3, Protocols for determining reproductive status.
MRC will conduct a pilot study using 9 randomly selected spotted owl
territories—3 from Navarro East inventory block, 3 from Navarro West
inventory block, and 3 from Albion inventory block—that are not likely to be
abandoned and that have a history of frequent occupation.
NOTE
MRC biologists determine annually which territories are likely to be abandoned
by how long owls have been absent from those territories. If owls have been
absent from a territory for 3 consecutive years, for example, we consider the
territory abandoned.
MRC will evaluate, in each of the 3 years, hardwood basal area within
several different spatial buffers up to 0.7 miles of activity centers using a
sampling and inventory protocol agreed upon by us and the wildlife agencies.
MRC will determine if there is a correlation between spotted owl
productivity and the amount of tanoak basal area in the vicinity of owl
activity centers.
MEASUREMENT CRITERIA
MRC will infer a positive relationship if there is a positive correlation
between owl productivity and basal area of hardwoods within several
different spatial buffers up to 0.7 miles of an owl activity center.
MRC will not infer a relationship if there is no correlation between owl
productivity and basal area of hardwoods within several different spatial
buffers up to 0.7 miles of an owl activity center.
MRC will infer a negative relationship if there is a negative correlation
between owl productivity and basal area of hardwoods within several
different spatial buffers up to 0.7 miles of an owl activity center.
ADAPTIVE MANAGEMENT
MRC and the wildlife agencies will decide whether to continue this
validation monitoring program based on the results of the pilot study
MRC and the wildlife agencies will determine a study plan for the remainder
of the term, if they decide to continue the study.
MRC may increase hardwood retention within 0.7 miles of spotted owl
activity centers, if there is a positive correlation between basal area of
hardwoods and owl productivity.
Effect of barred owl control on northern spotted owls (required)
Validation Monitoring
Effect of Barred Owl Control on Northern Spotted Owls
PROGRAM CODE M§13.9.1.4-7
HYPOTHESIS
5.2.10
Occupancy of northern spotted owl territories where MRC has controlled or
removed barred owls will improve.
Occupancy of northern spotted owl territories where MRC has not controlled
or removed barred owls will decline.
MONITORING APPROACH
MRC will develop, in consultation with the wildlife agencies, a study plan
within the first 2 years of HCP/NCCP implementation.
MRC will follow all banding procedures outlined in Appendix K, section
K.6.2, Banding of northern spotted owls.

Mendocino Redwood Company HCP/NCCP
13-94
Validation Monitoring
Effect of Barred Owl Control on Northern Spotted Owls
MRC will assess the demographic parameters of all individual northern
spotted owls and their territories impaired by barred owls before MRC
commences control efforts and for at least 10 years after such control efforts.
MRC will assess the demographic parameters of northern spotted owls and
their territories where MRC has not controlled or removed barred owls for at
least 10 years.
MRC will work with the wildlife agencies to gain the appropriate permits for
the removal of barred owls from northern spotted owl territories; we will use
these pilot efforts to guide further studies for barred owl control during
HCP/NCCP implementation.
NOTE
After lethal removal of barred owls, MRC will make a reasonable attempt to
locate authorized schools, museums, researchers, agencies, and others who
can properly and legally use the carcasses. In the event that our attempts
are unsuccessful, MRC will inform the wildlife agencies and offer them the
specimens. After MRC exhausts all reasonable options for donation of the
carcasses, we will burn or bury them in accordance with California State
and federal law.
MRC will determine if there is any improvement in the demographics of
northern spotted owl territories (i.e., greater productivity) following barred
owl control.
MRC and the wildlife agencies will outline in a study plan the demographic
parameters and statistical tests that MRC will use to determine the
effectiveness of barred owl control.
MEASUREMENT CRITERIA
MRC will infer a positive effect if occupancy and productivity of northern
spotted owls improve after barred owl control and removal, and decline in
areas where MRC has not implemented such control and removal.
MRC will not infer a relationship if there is no difference in the demographic
parameters of northern spotted owls in areas with barred owl control and
removal versus areas without such control and removal.
MRC will infer a negative effect if occupancy and productivity of a majority
of northern spotted owls decline after barred owl control and removal or
show no improvement over spotted owl demographics in areas where MRC
has not implemented such control and removal.
MRC and the wildlife agencies will confer to determine how mixed results
(i.e., no difference between northern spotted owl territories with control and
those without) fit into adaptive management protocol.
ADAPTIVE MANAGEMENT
If MRC infers a positive effect, we will continue with control of barred owls
in northern spotted owl territories.
If MRC infers a mixed effect, MRC and the wildlife agencies will evaluate
and improve the study plan to better understand the effect of barred owl
removal on northern spotted owls.
If MRC infers a negative effect, we will implement a reduced contingency
trigger (30% rather than 20% of the northern spotted owl population) and
provide an 18 acre ―no harvest‖ core area for all spotted owl pairs assigned
limited protection.

Mendocino Redwood Company HCP/NCCP
13-95
13.9.2 Marbled murrelet
13.9.2.1 Effectiveness monitoring
Previous MRC surveys for murrelets in Lower Alder Creek were scattered throughout the
watershed, rather than in consistent locations from year to year. As part of HCP/NCCP
implementation, MRC will use permanent radar stations to determine the level of murrelet
activity within Lower Alder Creek. These surveys will provide an index of murrelet abundance
each year. MRC and the wildlife agencies will determine if the activity level of murrelets is
increasing, decreasing, or remaining stable. By providing this information on murrelet activity
trends in Lower Alder Creek, MRC will contribute considerably to regional knowledge of
murrelet populations.
MRC will also complete annual radar surveys on the Navarro River, Greenwood Creek, and the
Albion River as part of our effectiveness monitoring. Since we detected murrelets flying up the
Navarro River in 2000 and 2001, we will survey this drainage for continued activity. However,
MRC will not track activity trends due to the low number of detections. If additional detections
occur on other drainages, MRC and the wildlife agencies may switch the monitoring effort to
these locations. Moreover, the wildlife agencies may fund additional radar surveys above and
beyond those in LACMA and the designated drainages.
Radar monitoring for murrelets in Lower Alder Creek
Effectiveness Monitoring
Activity Level of Marbled Murrelets in Lower Alder Creek
PROGRAM CODE M§13.9.2.1-1
OBJECTIVE
O§10.3.2.2-2 Retain permanently all sites occupied by marbled murrelets.
MONITORING APPROACH
MRC will establish and maintain 2 permanent radar survey stations
(Appendix L, Marbled Murrelet Data and Protocol, Figure L-1) on the
Lower Alder Creek drainage, specifically at the rock pit approximately 1
mile above the mouth of Alder Creek and 1 mile west of the rock processing
plant (closer to the coast).
MRC began a pilot project15
in 2011 to assess annual variation, determine
our ability to detect trends in numbers of detections, and establish a baseline
activity level in Lower Alder Creek.
MRC will continue the pilot project through 2011 at which point MRC and
the wildlife agencies will decide on any alterations to the project.
MRC will, as part of the pilot project,
Conduct all surveys from June 15th
–July 31st in order to maximize
detections.
Conduct 5 surveys at each of the sites for a total of 10 surveys
throughout the year.
Start surveys 75 minutes before sunrise and end them 75 minutes
after sunrise.
15
Although MRC completed previous radar surveys near these radar stations, there were inconsistencies in the number
of completed surveys, the time of year, and the location of the survey stations. For this reason, we will use data from
surveys completed in 2007 through 2011 to establish a baseline number of murrelet detections in lower Alder Creek.
We will use this baseline to assess whether the number of murrelet detections is declining. To assess the statistical
power of our current proposal, we used data from 2003 through 2005. The results of this analysis are in Appendix L,
section L.2, Radar Surveys in LACMA.

Mendocino Redwood Company HCP/NCCP
13-96
Effectiveness Monitoring
Activity Level of Marbled Murrelets in Lower Alder Creek
Maintain each radar station by topping small trees and shrubs less
than 4 in. dbh to keep them below road level.
Seek approval of the wildlife agencies for any other management at
the radar sites.
Photograph each radar site annually and provide these photos to the
wildlife agencies in an annual report; take photos looking in the
direction of the area surveyed by the radar unit.
Determine, in consultation with the wildlife agencies, the appropriate
radar settings (or range of radar settings) for surveys following the
2011 survey season.
MRC, in consultation with the wildlife agencies, will complete a power
analysis on the data from the completed pilot study. From this analysis we
will assess any detectable decrease in the murrelet population and possibly
change survey efforts or protocol with the agreement of the wildlife
agencies.
MRC may change, after consultation with the wildlife agencies, the locations
of proposed survey sites if better sites emerge.
MRC and the wildlife agencies will concur on a monitoring plan if additional
occupied murrelet sites are located in the plan area.
MRC will use the mean or median number (or other measures of abundance
with the agreement of the wildlife agencies) of murrelet detections per radar
survey per year; data from 2007-2011 will provide the baseline index for
activity levels of murrelets in Lower Alder Creek.
MRC will analyze surveys prior to 2011 and thereafter to determine the
number of detections at each survey station; for example, the number of
detections closer to the mouth of Lower Alder Creek is vastly greater than
the number of detections at the rock pit.
MRC will include survey statistics in an annual report, such as mean,
median, range of detections, standard error, and standard deviation of
detections.
MEASUREMENT CRITERIA
MRC will compare annual detections of murrelets with the baseline number
of detections in future years to uncover any decline in the number of
detections.
ADAPTIVE MANAGEMENT
MRC will continue to monitor permanent radar stations in Lower Alder
Creek even if murrelets decline or if they are no longer detected for the term
of the plan.
MRC and the wildlife agencies may explore independent correlates of trend
including prey base, offshore conditions, and disease.
MRC may take a more conservative approach to conservation measures in
Lower Alder Creek, providing (a) larger disturbance buffers and more
habitat protections for known occupied sites; (b) active corvid management;
and (c) temporary restrictions on harvesting.

Mendocino Redwood Company HCP/NCCP
13-97
Radar monitoring for murrelets in Navarro, Greenwood Creek, and Albion
Effectiveness Monitoring
Murrelet Occupancy in Navarro, Greenwood Creek, Albion River Watersheds
PROGRAM CODE M§13.9.2.1-2
OBJECTIVE
O§10.3.2.2-3
Maintain murrelet presence in the Navarro River watershed and in drainages
in which, in the future, MRC biologists detect murrelets.
MONITORING APPROACH
MRC will establish and maintain 6 permanent survey stations for radar
monitoring with concurrence of the wildlife agencies—2 on Navarro River,
2 on Albion River, and 2 on Greenwood Creek.
NOTE
Our intent is to set up radar monitoring stations on drainages where
murrelets currently occur or likely will occur in the future.
MRC will
Conduct all surveys from June 15th
through July 31st in order to
maximize detections.
Conduct 2 surveys at each of the sites for a total of 12 surveys
throughout the year.
Start surveys 75 minutes before sunrise and end them 75 minutes
after sunrise.
Maintain each radar station by topping small trees and shrubs less
than 4 in. dbh to keep them below road level.
Seek approval of the wildlife agencies for any other management at
the radar sites.
Photograph annually each radar site in the direction of the area
surveyed and provide these photos to the wildlife agencies in an
annual report.
Determine, in consultation with the wildlife agencies, the appropriate
radar settings (or range of radar settings) after the initial survey
season.
MRC may change, after consultation with the wildlife agencies, the locations
of proposed survey sites if better sites emerge.
MRC will include survey statistics in an annual report, such as mean,
median, range of detections, standard error, and standard deviation of
detections.
MEASUREMENT CRITERIA
MRC will compare annual detections of murrelet in the Navarro River,
Albion River, and Greenwood Creek with previous data.
MRC will consider even 1 ―murrelet-type‖ detection in the Albion River or
Greenwood Creek a major finding that requires consultation with the wildlife
agencies.
ADAPTIVE MANAGEMENT
MRC will confer with the wildlife agencies if any murrelet-type detections
occur on Greenwood Creek or Albion River.
MRC will consider all potential trees as primary murrelet trees in drainages
where murrelet-type detections occur until MRC and the wildlife agencies
agree and implement a plan to narrow down the areas where murrelets are
present and absent. For example, in the Navarro watershed, MRC considers
all potential trees as primary murrelet trees in the Navarro West inventory
block; in the Navarro East inventory block, however, potential trees can be

Mendocino Redwood Company HCP/NCCP
13-98
Effectiveness Monitoring
Murrelet Occupancy in Navarro, Greenwood Creek, Albion River Watersheds
either primary or secondary murrelet trees.
13.9.2.2 Validation monitoring
MRC will conduct validation monitoring on 3 hypotheses for marbled murrelets:
1. Current LACMA boundary covers all murrelet habitat within the Lower Alder Creek
planning watershed. NOTE
To our knowledge, we have included all potential murrelet habitat in the Lower Alder Creek watershed
within LACMA; however, we have not completed a field review of all stands in the Lower Alder Creek
watershed. As a result of habitat assessment, we may add or switch acres in LACMA to better protect
potential habitat stands contiguous with LACMA.
2. Specific silvicultural techniques for specific stands will accelerate growth of marbled
murrelet habitat. NOTE
Management within LACMA will allow stands without current habitat to progress quickly to potential
nesting stands. To further accelerate growth of marbled murrelet habitat, MRC may experiment with
silvicultural prescriptions elsewhere in the plan area.
3. Murrelets may re-colonize other areas of MRC forestland. NOTE
MRC will rotate radar stations in watersheds where murrelets are more likely to occur to determine if
murrelets may be in areas previously thought to be unoccupied.
These 3 adaptive management programs are optional; MRC may or may not implement them
during the term of our HCP/NCCP.
Murrelet habitat distribution in LACMA (optional)
Validation Monitoring
Murrelet Habitat Distribution in LACMA
PROGRAM CODE M§13.9.2.2-1
HYPOTHESIS
SECTION 5.3.8 The current LACMA boundary covers all areas of murrelet habitat in the
Lower Alder Creek drainage.
MONITORING APPROACH
MRC, in consultation with the wildlife agencies, will determine within the
first 5 years of our HCP/NCCP a system to evaluate areas of potential
murrelet habitat within the Lower Alder Creek watershed that are contiguous
with but outside of LACMA and that may provide better habitat.
MRC, in consultation with the wildlife agencies, will determine whether an
area is characteristic of murrelet habitat or not; the most basic criteria is
whether there are at least 3 potential habitat trees each within 100 ft of
another.
MRC will set up radar or ground-observer stations for areas of potential
murrelet habitat and, if possible, conduct surveys.
MEASUREMENT CRITERIA MRC will determine that murrelets are occupying an area if any murrelets
exhibit behavior indicative of occupancy.

Mendocino Redwood Company HCP/NCCP
13-99
Validation Monitoring
Murrelet Habitat Distribution in LACMA
ADAPTIVE MANAGEMENT
MRC may add newly discovered occupied stands within the Lower Alder
Creek drainage to LACMA and extend the associated conservation measures
to the stands as long as the maximum acreage of LACMA remains less than
1437 ac.
MRC, with the agreement of the wildlife agencies, may trade suitable habitat
areas contiguous with the current boundary of LACMA for existing habitat
areas in LACMA if LACMA has reached its maximum acreage of 1437 ac.
EXAMPLE
Area-1 is in LACMA; there have been no murrelet detections in Area-1. Area-2
is outside LACMA but within the Lower Alder Creek drainage; there have been
murrelet detections in Area-2. MRC, with agreement of the wildlife agencies,
could trade Area-2 for Area-1.
Accelerating murrelet habitat growth (optional)
Validation Monitoring
Methods for Accelerating Growth of Murrelet Habitat
PROGRAM CODE M§13.9.2.2-2
HYPOTHESIS
SECTION 5.3.8
Specific silvicultural prescriptions will generate suitable marbled murrelet
habitat quicker than not managing a stand silviculturally.
MONITORING APPROACH
MRC will develop, in consultation with the wildlife agencies, a study plan
within the first 5 years of our HCP/NCCP.
MRC will pre-test the proposed methods over a period of at least 5 years in 2
or more stands outside of LACMA before implementing them within
LACMA, with the exclusion of murrelet core areas.
MRC will establish permanent paired habitat plots in stands in the Lower
Alder Creek Habitat Area (LACHA) or the Lower Alder Creek Buffer Area
(LACBA), managing one area with habitat improvement and leaving the
other unmanaged.
MRC will evaluate permanent plots once every 5 years for changes in stand
structure and individual trees.
MRC will measure all characteristics that could affect whether a stand is
murrelet habitat or not (i.e., dbh, tree species composition, diameter of
largest limbs, canopy cover, etc.).
MRC will permanently mark and identify trees in the plots so that they can
be monitored throughout the term of our HCP/NCCP.
MEASUREMENT CRITERIA MRC will compare habitat characteristics between the managed and
unmanaged stands.
ADAPTIVE MANAGEMENT
MRC will confer with the wildlife agencies, after 20 years of monitoring, if
(1) there is no detectable change between managed and unmanaged stands;
or (2) unmanaged stands are producing murrelet habitat faster than managed
stands; or (3) managed stands are producing murrelet habitat faster than
unmanaged stands.
MRC and the wildlife agencies will decide if specific silvicultural
prescriptions can be implemented for specific stands within LACMA that
will not require wildlife agency consultation.

Mendocino Redwood Company HCP/NCCP
13-100
Validation Monitoring
Methods for Accelerating Growth of Murrelet Habitat
MRC may waive this adaptive management if both MRC and the wildlife
agencies agree that (1) new research adequately addresses the issue of how
to manage forests to accelerate habitat for marbled murrelets; and (2) MRC
implements the methods behind that research.
Radar monitoring in additional drainages (optional)
Validation Monitoring
Radar Monitoring in Additional Drainages
PROGRAM CODE M§13.9.2.2-3
HYPOTHESIS
SECTION 5.3.8
Murrelets will re-colonize other areas of MRC forestland.
MONITORING APPROACH
MRC will rotate radar monitoring stations in 9 additional drainages over a
10-year period: 16
1. Juan Creek (Rockport inventory block).
2. Hardy Creek (Rockport inventory block).
3. Mallo Pass Creek (South Coast inventory block).
4. Elk Creek (South Coast inventory block).
5. Russell Brook (Big River inventory block).
6. Noyo River (Noyo inventory block).
7. Hollowtree Creek (Rockport inventory block).
8. Garcia River (Garcia inventory block).
9. Cottaneva Creek (Rockport inventory block).
MRC will complete 2 radar surveys on 2 of the 9 drainages every year, i.e., 4
radar surveys per year.
MRC will
Conduct all surveys from June 15th
through July 31st in order to
maximize detections.
Conduct 5 surveys at each of the sites for a total of 10 surveys
throughout the year.
Start surveys 75 minutes before sunrise and end them 75 minutes
after sunrise.
Maintain each radar station by topping small trees and shrubs less
than 4 in. dbh to keep them below road level.
Seek approval of the wildlife agencies for any other management at
the radar sites.
Photograph annually each radar site in the direction of the area
surveyed and provide these photos to the wildlife agencies in an
annual report.
Determine, in consultation with the wildlife agencies, the appropriate
radar settings (or range of radar settings) after the initial survey
16
The HCP/NCCP Atlas (MAPS 6A-C) shows the plan area, the inventory blocks, locations of documented detections
from past murrelet surveys, and points of no detection.

Mendocino Redwood Company HCP/NCCP
13-101
Validation Monitoring
Radar Monitoring in Additional Drainages
season.
MRC may change, after consultation with the wildlife agencies, the locations
of proposed survey sites if better sites emerge.
MRC will include in the annual report survey statistics, such as mean,
median, range of detections, standard error, and standard deviation of
detections.
MRC and the wildlife agencies will review the ongoing need for this
monitoring program after every 10-year cycle.
MEASUREMENT CRITERIA MRC will use the number of murrelet-type detections in each drainage to
evaluate the hypothesis.17
ADAPTIVE MANAGEMENT
MRC, if we do not complete this monitoring program in any given year, will
consider all trees in all covered lands outside of Navarro, Albion, and
Greenwood Creek watersheds as primary murrelet trees until we re-
commence the program.
MRC will confer with the wildlife agencies if any murrelet-type detections
occur during any surveys.
MRC will consider all potential trees as primary murrelet trees in drainages
where murrelet-type detections occur until MRC and the wildlife agencies
agree and implement a plan to narrow down the areas murrelets occupy.
MRC will designate primary and secondary murrelet trees in areas murrelets
do not occupy.
13.9.3 Point arena mountain beaver
13.9.3.1 Effectiveness monitoring
MRC has not consistently monitored burrow systems of Point Arena mountain beavers in the
past; information is sparse on burrow systems and spatial extent. We will use the spatial extents
of known burrow systems to determine whether we are protecting the burrow systems under the
proposed conservation measures. An on-going study of the Point Arena mountain beavers, begun
in 2004, may help us to design a more effective monitoring program (Zielinski and Mazurek
2006).
Spatial extent of PAMB burrow systems
Effectiveness Monitoring
Spatial Extent of Known Burrow Systems of Point Arena Mountain Beaver
PROGRAM CODE M§13.9.3.1-1
OBJECTIVE
O§10.3.3.2-1 Maintain or enhance at least 85% of the known burrow systems of Point
Arena mountain beaver in the plan area (i.e., 12 of 14).
MONITORING APPROACH
MRC will establish the initial size of known burrow systems by measuring
their spatial extent.
MRC will designate any burrow greater than 32 ft (10 m) from its nearest
burrow as a separate burrow system.18
17
Appendix L, Marbled Murrelet Data and Protocol, defines ―murrelet-type detection‖ on p. L-1.

Mendocino Redwood Company HCP/NCCP
13-102
Effectiveness Monitoring
Spatial Extent of Known Burrow Systems of Point Arena Mountain Beaver
MRC will re-visit each known mountain beaver burrow system in the initial
year of HCP/NCCP implementation and every 5 years thereafter to assess
whether it is active or inactive and its spatial extent. We will initially place
fern bundles at the entrance to the 5 burrow openings exhibiting the greatest
likelihood of being active in a system to determine if a site is active or
inactive; sites in which bundles remain after 4 days will be considered
inactive. Later, MRC may use hair snares or camera stations to assess active
burrow systems. Other signs of an active burrow include fresh excavations
and herbaceous plant clippings near or around the burrow. Signs of an
inactive burrow include growth of vegetation over the burrow entrance,
cobwebs over the burrow entrance, and a general appearance of
abandonment.
MRC will set a reference point with a permanent marker and measure the
distance from this point to openings at the edges of the burrow system
(Figure 13-5).
MRC will convert information on burrow systems to GIS coverage in which
polygons will represent each burrow system; GIS will determine the size of
each burrow system.
MEASUREMENT CRITERIA
MRC, in consultation with the wildlife agencies, will determine our ability
(or statistical power) to detect differences in the size of burrow systems after
completing 2 rounds of measurements on all surveyed burrow systems.
MRC will compare the area of each burrow system to previous assessments
of the spatial extent of each burrow system.
MRC, in consultation with the wildlife agencies, will determine by year
2025 (1) the detectable size differences in average spatial extent of all
burrow systems and (2) the spatial extent of individual burrow systems.
ADAPTIVE MANAGEMENT
MRC will halt research and consult with the wildlife agencies if the number
of active burrow systems falls below our objectives, namely 12.
MRC will consult with the wildlife agencies if we detect a decreasing trend
in the spatial extent of burrow systems.
18
In completing initial surveys of mountain beaver burrow systems, MRC surveyors generally noted that if another
burrow was not found within 32 ft (10 m) of the last burrow, it was exceedingly unlikely to find more burrows farther
away. As a result, we collected all baseline data with 32 ft as the minimum distance between two separate burrow
systems.
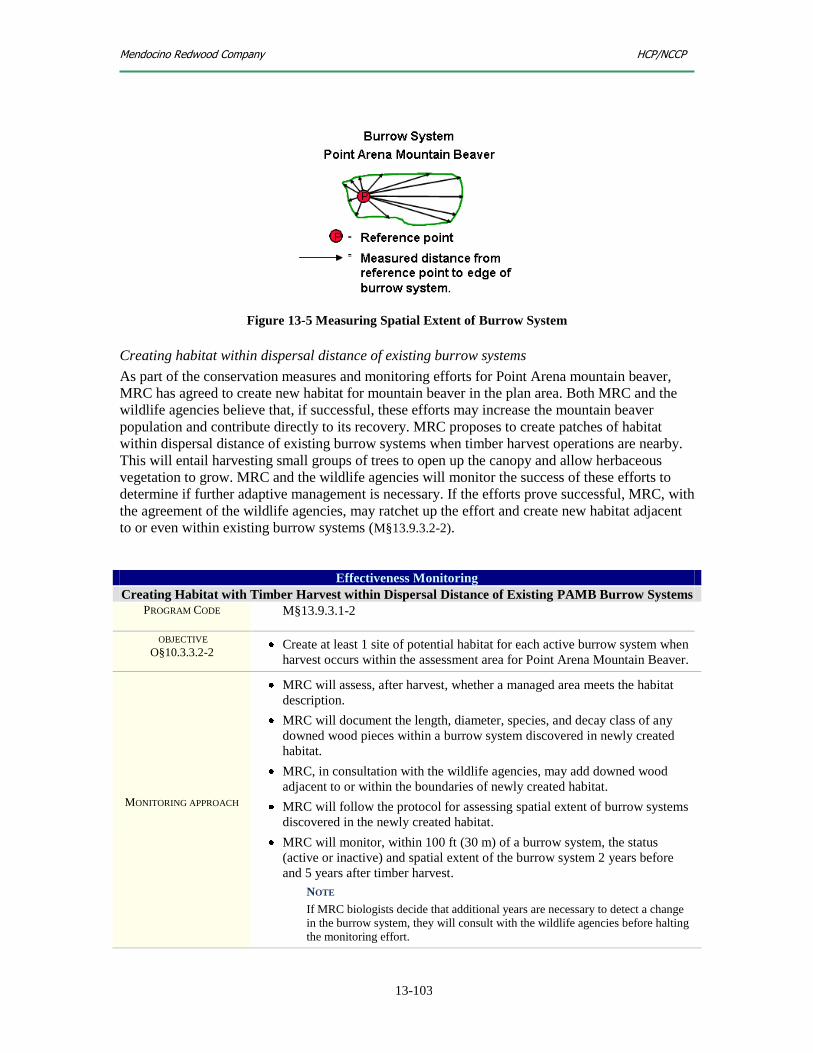
Mendocino Redwood Company HCP/NCCP
13-103
Figure 13-5 Measuring Spatial Extent of Burrow System
Creating habitat within dispersal distance of existing burrow systems
As part of the conservation measures and monitoring efforts for Point Arena mountain beaver,
MRC has agreed to create new habitat for mountain beaver in the plan area. Both MRC and the
wildlife agencies believe that, if successful, these efforts may increase the mountain beaver
population and contribute directly to its recovery. MRC proposes to create patches of habitat
within dispersal distance of existing burrow systems when timber harvest operations are nearby.
This will entail harvesting small groups of trees to open up the canopy and allow herbaceous
vegetation to grow. MRC and the wildlife agencies will monitor the success of these efforts to
determine if further adaptive management is necessary. If the efforts prove successful, MRC, with
the agreement of the wildlife agencies, may ratchet up the effort and create new habitat adjacent
to or even within existing burrow systems (M§13.9.3.2-2).
Effectiveness Monitoring
Creating Habitat with Timber Harvest within Dispersal Distance of Existing PAMB Burrow Systems
PROGRAM CODE M§13.9.3.1-2
OBJECTIVE
O§10.3.3.2-2 Create at least 1 site of potential habitat for each active burrow system when
harvest occurs within the assessment area for Point Arena Mountain Beaver.
MONITORING APPROACH
MRC will assess, after harvest, whether a managed area meets the habitat
description.
MRC will document the length, diameter, species, and decay class of any
downed wood pieces within a burrow system discovered in newly created
habitat.
MRC, in consultation with the wildlife agencies, may add downed wood
adjacent to or within the boundaries of newly created habitat.
MRC will follow the protocol for assessing spatial extent of burrow systems
discovered in the newly created habitat.
MRC will monitor, within 100 ft (30 m) of a burrow system, the status
(active or inactive) and spatial extent of the burrow system 2 years before
and 5 years after timber harvest.
NOTE
If MRC biologists decide that additional years are necessary to detect a change
in the burrow system, they will consult with the wildlife agencies before halting
the monitoring effort.

Mendocino Redwood Company HCP/NCCP
13-104
Effectiveness Monitoring
Creating Habitat with Timber Harvest within Dispersal Distance of Existing PAMB Burrow Systems
MEASUREMENT CRITERIA
MRC will evaluate the relative change between control and treated burrow
sites in a Before-After-Control-Impact (BACI) approach, i.e., Area control –
Area treatment.
MRC will infer a positive effect if the relative area of the treatment site
increases at least 1250 ft2 more than the pre-manipulation area.
19
MRC will infer a negative effect if the relative area of the treatment site
decreases at least 1250 ft2 less than the pre-manipulation area.
MRC will infer no effect for any change between these thresholds.
NOTE
MRC is proposing a priori inferences, as opposed to conducting statistical tests.
There are inherently low sample sizes available and limited pre- and post-
evaluation periods to quantify variability. Moreover, it is unlikely that the
control and treatment experiments will be simultaneous.
ADAPTIVE MANAGEMENT MRC will confer with the wildlife agencies to determine if MRC should
create more habitat with timber harvest.
13.9.3.2 Validation monitoring
The current definition of potential habitat for Point Arena mountain beavers is very broad
(USFWS 2002). This is due to a lack of knowledge on habitat requirements for Point Arena
mountain beavers (USFWS 1998a), especially on timberlands. As a result, MRC has applied a
broad definition to our conservation measures for the Point Arena mountain beaver. We propose
to complete research on our land; from that research there may emerge a more accurate definition
of suitable habitat for Point Arena mountain beavers. All validation monitoring for Point Arena
mountain beavers is optional.
Defining PAMB habitat (optional)
Validation Monitoring
Defining Habitat for Point Arena Mountain Beavers
PROGRAM CODE M§13.9.3.2-1
HYPOTHESIS
SECTION 5.4.9
Our current habitat definition correctly describes potential habitat for Point
Arena mountain beaver (section 10.3.3.2.1).
MONITORING APPROACH
MRC will measure the spatial extent of all known burrow systems of Point
Arena mountain beavers in the plan area.
MRC, after flagging spatial extent, will estimate the center point of the
burrow system and measure soil texture, site impacts (i.e., timber harvest,
vegetation management, and cattle grazing), aspect, slope, and canopy
cover for the burrow system.
MRC will measure ground-cover using the line-transect method—
establishing 2 transects (20 m in length, 1 m wide) in cardinal directions
(i.e., north-south and east-west) centered on the center point of the burrow
system.
MRC will measure canopy cover (using a spherical densiometer) at the
boundaries of a burrow system in four cardinal directions (i.e., north, south,
east, and west).
19
The number 1250 ft2 is approximately ½ the size of the smallest measured burrow system in the plan area.

Mendocino Redwood Company HCP/NCCP
13-105
Validation Monitoring
Defining Habitat for Point Arena Mountain Beavers
MRC will identify and determine relative abundance (%) of each plant
species at a 1X1 m quadrant in the center of the burrow system and at 4
other 1X1 m quadrants in locations prescribed by random numbers.
MRC will use a random number table to determine a random distance and
azimuth for placement quadrants in the burrow system.
MRC will count and identify tree species and determine height and dbh (for
trees whose dbh is 4 in. or more) of all trees within the boundary of a
burrow system.
MRC will identify species, diameter, and decay class of tree stumps within
the burrow system.
MRC will count and identify by species all trees less than 4 in. dbh within
the boundary of a burrow system.
MRC will use a random number table to generate a random azimuth. We
will move the plot up to another 329 ft (100 m) following the random
azimuth to a new point. The new point must fall within an area that meets
the definition of potential habitat for Point Arena mountain beaver. If the
new area does not meet the definition, we will move the plot another 329 ft
(100 m) following the new azimuth from the original burrow system. At the
end point, MRC will re-create the spatial extent of the initial burrow system
using measurements from that burrow system. This will create, in effect, a
replica of the spatial extent of the original burrow system. If the random
site contains any burrows of Point Arena mountain beaver, the recreated
site will be moved another 329 ft (100 m). The end point then becomes the
new center point of the ―random site.‖ MRC will then use the same
procedure as above to measure and record habitat characteristics of the re-
created site with habitat characteristics of the actual burrow system.
MEASUREMENT CRITERIA MRC and the wildlife agencies will determine if data analysis from a pilot
study suggests we should take action under adaptive management.
ADAPTIVE MANAGEMENT MRC and the terrestrial wildlife agencies will agree on any changes in the
definition of potential habitat, if data analysis indicates the current
definition is too narrow or too broad.
Creating potential habitat in or adjacent to existing burrow systems (optional)
Validation Monitoring
Creating Potential Habitat in or Adjacent to Existing PAMB Burrow Systems
PROGRAM CODE M§13.9.3.2-2
HYPOTHESIS
SECTION 5.4.9
Timber harvest and other management techniques can create new habitat
for Point Arena mountain beavers and allow for the expansion of burrow
systems into new areas.
MONITORING APPROACH
MRC will establish control and experimental burrow systems with similar
topographical and vegetation conditions; the control plot will be no-harvest
within a buffer area and the experimental plot will have harvest within 100
ft of a burrow system or within a burrow system.
MRC will monitor, within 100 ft of a burrow system, the status (active or
inactive) and spatial extent of the burrow system 2 years before and 5 years
after timber harvest.
NOTE

Mendocino Redwood Company HCP/NCCP
13-106
Validation Monitoring
Creating Potential Habitat in or Adjacent to Existing PAMB Burrow Systems
If MRC biologists decide that additional years are necessary to detect a change
in the burrow system, they will consult with the wildlife agencies before
halting the monitoring effort.
MRC will document the length, diameter, species, and decay class of any
downed wood pieces within the burrow system.
MRC, in consultation with the wildlife agencies, may add downed wood
adjacent to or within the boundaries of the burrow systems to determine its
effect on the spatial extent of those systems.
MRC will assess, after harvest, whether the managed area meets the habitat
description and exhibits burrows.
MEASUREMENT CRITERIA
MRC will evaluate the relative change between control and treated burrow
sites in a Before-After-Control-Impact (BACI) approach, i.e., Area control –
Area treatment.
MRC will infer a positive effect if the relative area of the treatment site
increases at least 1250 ft2 more than the pre-manipulation area.
MRC will infer a negative effect if the relative area of the treatment site
decreases at least 1250 ft2 less than the pre-manipulation area.
MRC will infer no effect for any change between these thresholds.
NOTE
MRC is proposing a priori inferences, as opposed to conducting statistical
tests. There are inherently low sample sizes available and limited pre- and
post-evaluation periods to quantify variability. Moreover, it is unlikely that the
control and treatment experiments will be simultaneous.
ADAPTIVE MANAGEMENT
MRC and the wildlife agencies may allow harvest within 100 ft of burrow
systems without the need for consultation if
At least 3 burrow systems have had no effect or a positive effect
following timber harvest.
AND
No burrow systems have experienced a negative effect following
timber harvest.
MRC will ensure that felled trees fall outside the burrow systems of Point
Arena mountain beavers.
MRC will not plant conifers within 100 ft of a burrow system, if the
wildlife agencies allow us to harvest within the protected buffer for
mountain beavers.
MRC will meet with the wildlife agencies to determine a future course for
conservation measures and experimentation, in the event that a harvest has
a negative effect on the spatial extent of a burrow system.
MRC will meet with the wildlife agencies to develop habitat management
guidance derived from the monitoring studies (e.g., LWD management and
canopy management).
13.10 Monitoring Rare Plants
13.10.1 Elements of rare plant strategy
The conservation strategy for covered rare plants relies on 3 key elements: (1) conservation
measures (see Chapter 11, Conservation Measures for Rare Plants); (2) monitoring; and (3)
adaptive management. The intent of the conservation measures for rare plants is to

Mendocino Redwood Company HCP/NCCP
13-107
Conserve the natural communities, habitats, and occurrences of covered rare
plant species found in the plan area.
Contribute to the recovery of covered rare plant species in the plan area that are
listed as threatened or endangered by CDFG or USFWS.
Manage and conserve rare plant species that are not listed as threatened or
endangered so that listing remains unnecessary.
We will assess the effectiveness of our conservation measures through a long-term monitoring
program that tracks the abundance and distribution of covered rare plants throughout our land.
Monitoring results will reveal trend, i.e., whether rare plant species are decreasing, stable, or
increasing on our land. We will evaluate trend conditions and other factors to determine whether
we are meeting our conservation objectives or whether we need to propose changes in our
conservation measures.
Rare plant monitoring will include effectiveness and compliance monitoring. In addition, MRC
will use targeted studies to improve knowledge of some covered rare plants and to select
appropriate species-specific conservation measures. In general, the monitoring protocols, which
are species-specific, should
Confirm that MRC is conducting rare plant surveys according to CDFG
guidelines.
Confirm that MRC is implementing conservation measures as prescribed in the
rare plant conservation strategy.
Evaluate the effectiveness of conservation measures.
Determine whether MRC is meeting conservation objectives.
13.10.2 Implementation of rare plant monitoring
MRC will implement effectiveness monitoring for rare plants. We will scale the effectiveness
monitoring according to the rarity and threat level of each plant species and the significance of its
occurrences on our land, as expressed in each species management category (section 11.5.2,
Assigning covered rare plants species to management categories ). We will monitor species of
highest concern (i.e., Management Category 1 and Management Category 2) more intensively,
both in terms of survey frequency and data collected. Likewise, we will monitor species of lesser
concern (i.e., Management Category 3 and Management Category 4) less intensively, while still
collecting sufficient data for evaluation.
Effectiveness monitoring will consist of status and trend monitoring for Management Category 1
through Management Category 3, and presence or absence monitoring for Management Category
4. Status and trend monitoring will include measurements of abundance and distribution, as well
as assessment of habitat characteristics. In addition, for each PTHP or covered activity, MRC will
collect information on operation type, vegetation, and disturbance. Monitoring methods for rare
plants must be species-specific and situation-specific (Elzinga et al. 1998); MRC will develop
these protocols within 1-5 years of HCP/NCCP approval using the guidelines in section
13.10.2.2. The basis for specific monitoring protocols and elements (e.g., sample plot size,
sample plot location) are characteristics such as life-form (e.g., annual, herbaceous perennial,
shrub, and tree), size range of the plant, habitat characteristics, and distribution in the plan area.
Atkinson and others (2004) support the use of different levels and frequencies of effectiveness
monitoring for species in different management categories. Menges and Gordon (1996) propose
scaling monitoring levels for rare plants to rarity and threat status, with the rarest and most
threatened species receiving the most intensive monitoring. For the rarest plants, Menges and
Gordon (1996) also recommend demographic monitoring (i.e., tracking the fate of individual
plants throughout their life cycle) as a part of long-term effectiveness monitoring. However,
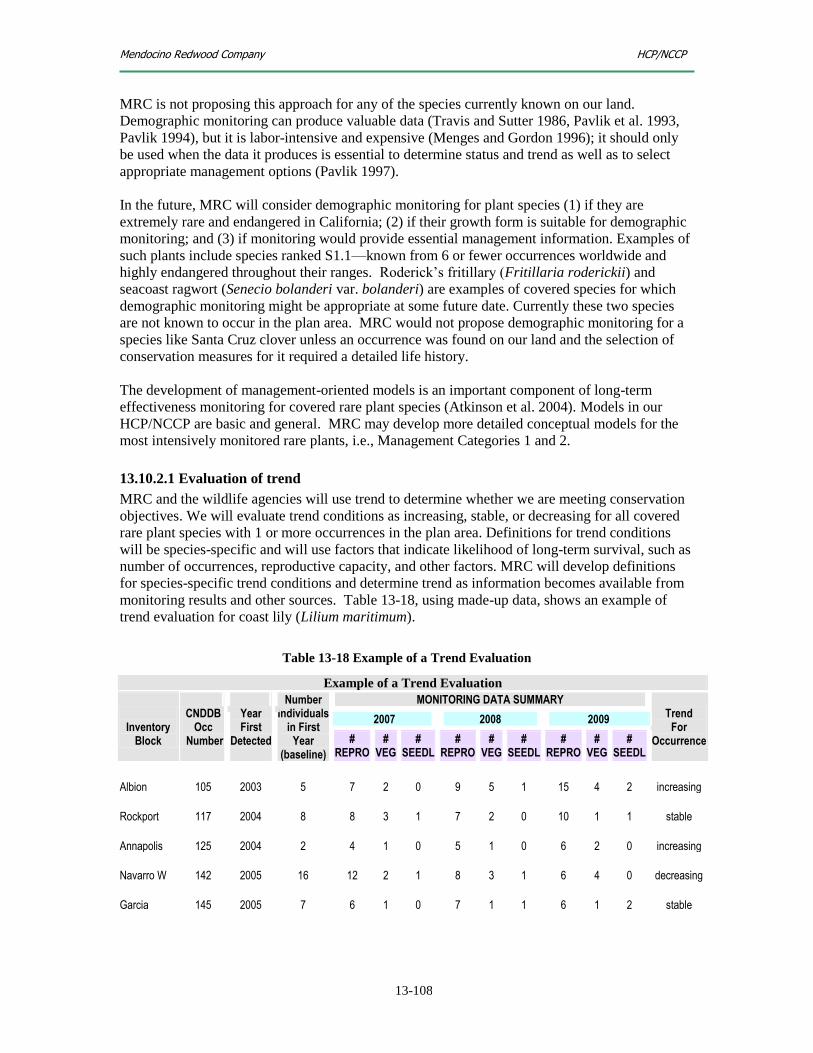
Mendocino Redwood Company HCP/NCCP
13-108
MRC is not proposing this approach for any of the species currently known on our land.
Demographic monitoring can produce valuable data (Travis and Sutter 1986, Pavlik et al. 1993,
Pavlik 1994), but it is labor-intensive and expensive (Menges and Gordon 1996); it should only
be used when the data it produces is essential to determine status and trend as well as to select
appropriate management options (Pavlik 1997).
In the future, MRC will consider demographic monitoring for plant species (1) if they are
extremely rare and endangered in California; (2) if their growth form is suitable for demographic
monitoring; and (3) if monitoring would provide essential management information. Examples of
such plants include species ranked S1.1—known from 6 or fewer occurrences worldwide and
highly endangered throughout their ranges. Roderick’s fritillary (Fritillaria roderickii) and
seacoast ragwort (Senecio bolanderi var. bolanderi) are examples of covered species for which
demographic monitoring might be appropriate at some future date. Currently these two species
are not known to occur in the plan area. MRC would not propose demographic monitoring for a
species like Santa Cruz clover unless an occurrence was found on our land and the selection of
conservation measures for it required a detailed life history.
The development of management-oriented models is an important component of long-term
effectiveness monitoring for covered rare plant species (Atkinson et al. 2004). Models in our
HCP/NCCP are basic and general. MRC may develop more detailed conceptual models for the
most intensively monitored rare plants, i.e., Management Categories 1 and 2.
13.10.2.1 Evaluation of trend
MRC and the wildlife agencies will use trend to determine whether we are meeting conservation
objectives. We will evaluate trend conditions as increasing, stable, or decreasing for all covered
rare plant species with 1 or more occurrences in the plan area. Definitions for trend conditions
will be species-specific and will use factors that indicate likelihood of long-term survival, such as
number of occurrences, reproductive capacity, and other factors. MRC will develop definitions
for species-specific trend conditions and determine trend as information becomes available from
monitoring results and other sources. Table 13-18, using made-up data, shows an example of
trend evaluation for coast lily (Lilium maritimum).
Table 13-18 Example of a Trend Evaluation
Example of a Trend Evaluation
Inventory
Block
CNDDB Occ
Number
Year First
Detected
Number Individuals
in First Year
(baseline)
MONITORING DATA SUMMARY Trend
For Occurrence
2007 2008 2009
# REPRO
# VEG
# SEEDL
# REPRO
# VEG
# SEEDL
# REPRO
# VEG
# SEEDL
Albion 105 2003 5 7 2 0 9 5 1 15 4 2 increasing
Rockport 117 2004 8 8 3 1 7 2 0 10 1 1 stable
Annapolis 125 2004 2 4 1 0 5 1 0 6 2 0 increasing
Navarro W 142 2005 16 12 2 1 8 3 1 6 4 0 decreasing
Garcia 145 2005 7 6 1 0 7 1 1 6 1 2 stable

Mendocino Redwood Company HCP/NCCP
13-109
Example of a Trend Evaluation
Inventory
Block
CNDDB Occ
Number
Year First
Detected
Number Individuals
in First Year
(baseline)
MONITORING DATA SUMMARY Trend
For Occurrence
2007 2008 2009
# REPRO
# VEG
# SEEDL
# REPRO
# VEG
# SEEDL
# REPRO
# VEG
# SEEDL
TREND FOR SPECIES IS INCREASING-STABLE
Until and unless statistical measures can show otherwise, the following conventions will apply as
trend definitions for single occurrences and for species in the plan area: Trend Definitions for Single Occurrences
INCREASING: Number of reproductive and vegetative individuals (combined) shows > 20%
increase over time from baseline.
STABLE: Number of reproductive and vegetative individuals (combined) shows < 20%
increase or decrease over time from baseline.
DECREASING: number of reproductive and vegetative individuals (combined) shows ≥ 20%
decrease over time from baseline.
TREND NOT DETERMINED: Less than 3 monitoring events since baseline or variability in
number of individuals is greater than described in definitions above.
Trend Definitions for Species in the Plan Area
INCREASING: Majority20
of occurrences are increasing.
INCREASING-STABLE: Majority of occurrences are increasing or stable.
STABLE: Majority of occurrences are stable.
STABLE-DECREASING: Majority of occurrences are stable or decreasing.
DECREASING: Majority of occurrences are decreasing.
TREND NOT DETERMINED: Variability is greater than described in definitions above.
13.10.2.2 Targeted studies
MRC is proposing targeted studies21
to improve our biological knowledge of covered plant
species and to select the most effective conservation measures for them. These studies will follow
guidelines from Designing Monitoring Programs in an Adaptive Management Context for
Regional Multiple Species Conservation Plans (Atkinson et al. 2004).
Targeted studies increase the effectiveness of monitoring and management by improving
knowledge about the ecological system and about management techniques. Targeted studies,
which may be implemented on a short or long term, typically
Resolve critical uncertainties about natural systems under management (e.g., plant
succession and weed dynamics in response to fire; top-down predator effects on food
webs; identification of stress-sensitive and stress-tolerant species).
Apply experimental management treatments.
Advantages of using targeted studies include the ability of management to
Focus on the most critical aspects of a question.
Spend a shorter duration compared to validation monitoring.
Provide results that are scientifically valid, i.e., based on experiment and controls.
MRC is proposing targeted studies (1) to determine optimum buffer conditions for rare plant
occurrences, (2) to investigate the characteristics of early successional rare species, and (3) to
20
Majority, in the context of all trend definitions, means greater than 50 percent. 21
Targeted studies are a form of validation monitoring.

Mendocino Redwood Company HCP/NCCP
13-110
select appropriate conservation measures for such species. Additional targeted studies may be
proposed during future phases of our HCP/NCCP.
Determining optimum buffer conditions
MRC is proposing a targeted study to determine optimum buffer widths and management
conditions necessary to protect covered rare plant occurrences. The intent of the buffer is to
minimize the effects of covered activities on the core occurrence area by delineating a zone where
habitat conditions favored by the rare plant will be maintained and harmful effects will be
minimized (section 11.7.1.1). The buffer should maintain habitat characteristics important to a
covered rare plant species, including microclimatic factors (humidity, temperature, and solar
radiation); hydrology and soil characteristics; and populations of beneficial mycorrhizal fungi and
potential pollinators. In addition, buffers will limit the range of disturbances associated with
covered activities, such as soil compaction and vegetation removal.
MRC is unaware of published studies from California that have investigated the question of
buffer width.22
Studies by Harris (1984, 1988) and Russell et al. (2000) have examined changes in
microclimatic factors in old-growth forests that are associated with adjacent clearcuts. Russell et
al. (2000) studied the influence of clearcuts on adjacent old-growth redwood forests in northern
California. They concluded that changes in microclimatic factors associated with clearcuts
penetrated significant distances into old-growth forests—in some cases, distances approximately
equal to 3 times the height of the dominant trees in the area. Their findings support the position
that timber harvest activities can modify habitat conditions in areas distant from harvest activity.
The use of buffers to minimize the impacts of covered activities on core occurrence areas of
covered rare plants is supported by their findings.
Scientific data on which to base the selection of specific buffer widths and management
conditions is very limited. The buffer widths and buffer management protocols proposed in our
HCP/NCCP represent our best professional judgment, based on studies like those cited above and
field observations of consultants and agency biologists familiar with the species, habitats, and
timber harvest practices of coastal northern California. MRC is proposing a targeted study to
examine the effectiveness of a range of buffer widths and buffer management protocols and to
determine the optimum buffer widths and conditions.
MRC may develop a targeted study to examine buffer widths for covered rare plants after
approval of our HCP/NCCP and collection of several years of monitoring data. Our targeted
study will focus on issues identified by both MRC and the wildlife agencies. The study design
process will
Review relevant literature and other information, including the viewpoints of agency
biologists and other scientists who have considered this problem.
Include several different covered rare plant species that exhibit a range of variation in life
form (e.g., annual, herbaceous perennial, shrub, and tree) and habitat preferences (e.g.,
forests, grasslands, wetlands).
Include microclimatic variables that are known to be important to rare plant survival and
reproduction, and that can be accurately measured.
22
We are aware, however, that agency biologists working in northwestern California—Clare Golec (Caltrans), Tony
LaBanca (CDFG), Linnea Hanson (USFS), and Dave Imper (USFWS)—have discussed the subject of appropriate
buffer width.

Mendocino Redwood Company HCP/NCCP
13-111
Investigate buffer effectiveness in response to a range of intensity of silvicultural activity
in the adjacent harvested timberlands.
Investigate a range of buffer widths and conditions (e.g., locale) for each covered rare
plant species included in the study.
Use an experimental approach with adequate controls and replicates.
Organize and present findings in the final report so that they can be readily applied to
adaptive management.
Monitoring methods for early successional species
MRC may propose an additional targeted study (1) to improve knowledge of the biology of the
early successional species Humboldt milk-vetch (Astragalus agnicidus) and (2) to develop a
monitoring strategy for this species. Standard monitoring methods for determining status and
trend, and for evaluating whether conservation measures are being met, may not be effective
(Elzinga et al. 1998). Many early successional species in California germinate vigorously in
response to certain types of disturbance. They grow, produce seed crops, then decline in
abundance (at least, above-ground individuals) as the habitat matures and the time since
disturbance increases. Species of this type are known to persist for decades as seeds in the soil
seed bank, even though there is no presence above ground (Leck et al. 1989). Evaluations of
status and trend that rely mainly on standard measurements, such as numbers of extant
individuals or area currently occupied, may not accurately represent the ability of these species to
survive over the long term (Elzinga et al. 1998).
MRC may develop a targeted study to examine Humboldt milk-vetch after approval of our
HCP/NCCP and after conducting pilot studies to test monitoring methods. If implemented, this
targeted study will focus on issues identified by both MRC and the wildlife agencies. The study
design process will
Review relevant literature, including Berg and Bittman (1988), Hiss and Pickart (1992),
Pickart et al. (1991), and Bencie (1997).
Conduct reconnaissance-level field visits to Humboldt milk-vetch occurrences in the plan
area.
Summarize existing information, including data from PTHPs and other field
observations, on the responses to disturbance exhibited by Humboldt milk-vetch,
including responses to natural and human-caused disturbances.
Consider demographic monitoring (tracing the fate of individuals) of a sample of
Humboldt milk-vetch to determine life cycle characteristics, including year-to-year
changes in plant size and seed production that occur over time.
Consider a limited-scale investigation of the seed bank characteristics of Humboldt milk-
vetch.
Consider limited-scale experimental translocation (using seed as the propagule) to
compare seed germination and seedling survival under different disturbance regimes.
Consider the effects of reforestation on Humboldt milk-vetch.

Mendocino Redwood Company HCP/NCCP
13-112
Consider a limited-scale experiment using fire to promote habitat quality and stimulate
seed production.
13.10.3 Effectiveness monitoring
Effectiveness Monitoring
Status and Trend of Covered Rare Plant Species
PROGRAM CODE M§13.10.3-1
OBJECTIVES
O§11.2-1
O§11.2-2
O§11.2-3
O§11.2-4
O§11.2-5
O§11.2-6
O§11.2-7
O§11.2-8
O§11.2-9
O§11.2-10
O§11.2-11
O§11.2-12
O§11.2-13
Management Category 1 (MC1)
Maintain all covered rare plant occurrences in the plan area at stable-to-
increasing levels of abundance and distribution (i.e., occurrence trend is
stable-to-increasing).
Avoid or minimize mortality of individual plants.
Minimize direct and indirect adverse impacts to core occurrences, such as
ground disturbances, accelerated erosion, accelerated sedimentation, fuel
spills, slash deposition, and increases in number or cover of invasive pest
plants.
Retain existing site conditions of importance to covered rare plants, such as
microclimatic factors (sun/shade levels, humidity); soil factors (soil structure,
soil moisture regime, soil compaction level); local hydrology; ground
disturbance levels; and plant species composition of the community and
habitat.
Management Category 2 (MC2)
Maintain a stable-to-increasing number of occurrences in each inventory
block where the covered species is known (i.e., species trend is stable-to-
increasing).
Maintain, on average, stable-to-increasing levels of abundance and
distribution for the covered species throughout its range in the plan area (i.e.,
species trend is stable-to-increasing).
Minimize mortality of individual plants.
Reduce direct and indirect adverse impacts, such as ground disturbances,
accelerated erosion, accelerated sedimentation, fuel spills, slash deposition,
and increases in number or cover of invasive pest plants.
Minimize changes in site conditions of importance to rare plants, such as
microclimatic factors (sun/shade levels, humidity); soil factors (soil structure,
soil moisture regime, soil compaction level); local hydrology; ground
disturbance levels; and plant species composition of the community and
habitat.
Management Category 3 (MC3)
Maintain stable-to-increasing levels of abundance and distribution within all
inventory blocks where the covered species is found (i.e., species trend is
stable-to-increasing).
Reduce mortality of individual rare plants, as feasible.
Reduce, as feasible, direct and indirect adverse impacts, such as ground
disturbance, accelerated erosion, accelerated sedimentation, fuel spills, slash
deposition, and increases in number or cover of invasive pest plants.
Minimize, as feasible, changes in site conditions of importance to rare plants,

Mendocino Redwood Company HCP/NCCP
13-113
Effectiveness Monitoring
Status and Trend of Covered Rare Plant Species
O§11.2-14
O§11.2-15
O§11.2-16
such as microclimatic factors (sun/shade levels, humidity); soil factors (soil
moisture regime, soil compaction level); local hydrology; ground disturbance
levels; and plant species composition of the community and habitat.
Management Category 4 (MC4)
Maintain number and size of occurrences in the plan area so that the species
continues to qualify for its current S rank or an S rank that denotes greater
abundance.
Reduce mortality of individual rare plants, as feasible.
Maintain stable-to-increasing occurrences in the plan area, mainly through
community-based conservation measures.
MONITORING APPROACH
MRC will monitor status and trend of covered rare plants on our land.
MRC will monitor individual plant species and occurrences at a level that is
appropriate, based on the management category of each species.
MRC will design species-specific and situation-specific monitoring protocols,
including sampling methods that meet accepted standards for accuracy and
precision, using guidelines from Designing Monitoring Programs in an
Adaptive Management Context for Regional Multiple Species Conservation
Plans (Atkinson et al. 2004) and Measuring and Monitoring Plant
Populations (Elzinga et al. 1998).
MRC will submit monitoring designs to the wildlife agencies for review.
MRC will use a pilot program to test the effectiveness and efficiency of initial
monitoring approaches (Elzinga et al. 1998, Atkinson et al. 2004).
MRC will modify initial monitoring protocols, as needed, in response to new
information, including detection of new core occurrences in the plan area and
emergence of new information on the biological and ecological characteristics
of covered rare plant species (Atkinson et al. 2004).
MRC will use the status and trend of individual core occurrences and of the
species as a whole in the plan area to determine trend and evaluate whether
we are meeting our conservation objectives.
MEASUREMENT CRITERIA
MRC will use the following guidelines in developing species-specific and
situation-specific monitoring protocols for each covered rare plant species
known to occur in the plan area:
Management Categories 1 and 2/Monitoring Approach 1
Monitoring Requirements: Plant Data
MRC will monitor occurrences.
Number and frequency
MRC will monitor all occurrences in the plan area once a year until
the initial status and trend of each occurrence (i.e., stable, decreasing,
increasing) is established. NOTE
The monitoring time required to determine status and trend will vary with
the individual species and its characteristics.
MRC will adjust monitoring frequency, after we have determined
initial status and trend, as follows: If the trend for an occurrence is stable-to-increasing, monitor
once every 5 years; in addition, for PTHP areas, monitor once in
the year prior to stand entry and once in the year following stand
entry. If the trend for an occurrence is declining, continue monitoring
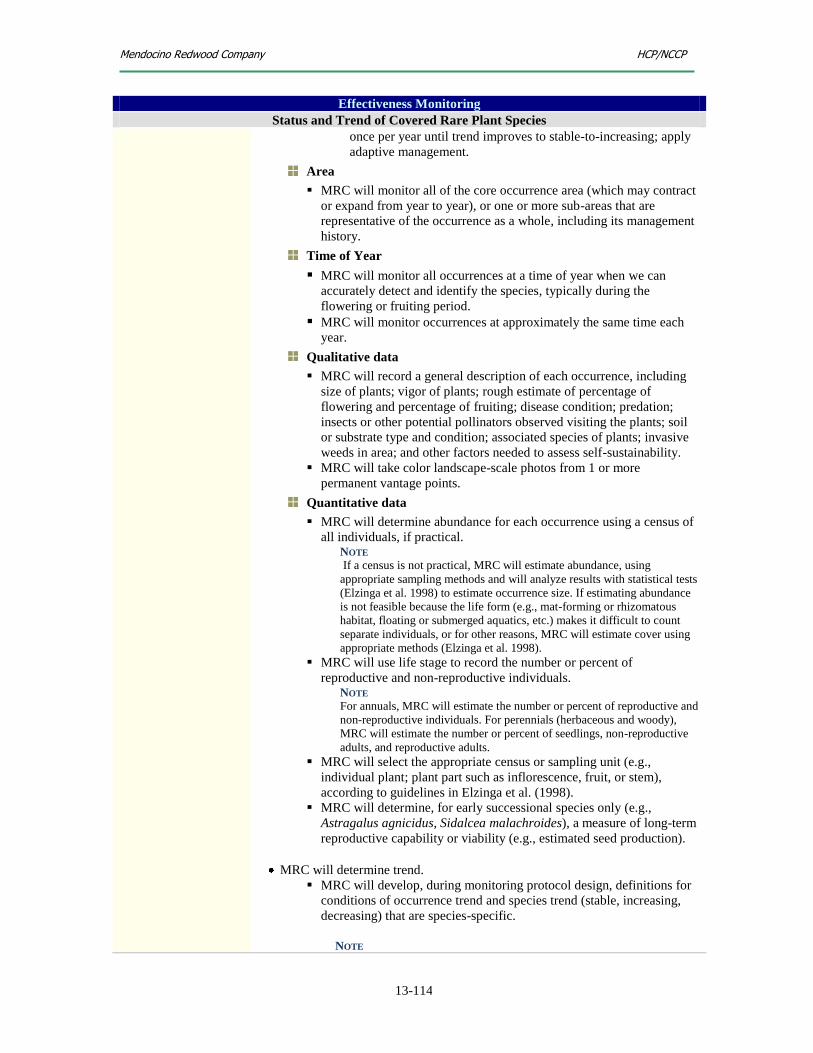
Mendocino Redwood Company HCP/NCCP
13-114
Effectiveness Monitoring
Status and Trend of Covered Rare Plant Species
once per year until trend improves to stable-to-increasing; apply
adaptive management.
Area
MRC will monitor all of the core occurrence area (which may contract
or expand from year to year), or one or more sub-areas that are
representative of the occurrence as a whole, including its management
history.
Time of Year
MRC will monitor all occurrences at a time of year when we can
accurately detect and identify the species, typically during the
flowering or fruiting period. MRC will monitor occurrences at approximately the same time each
year.
Qualitative data
MRC will record a general description of each occurrence, including
size of plants; vigor of plants; rough estimate of percentage of
flowering and percentage of fruiting; disease condition; predation;
insects or other potential pollinators observed visiting the plants; soil
or substrate type and condition; associated species of plants; invasive
weeds in area; and other factors needed to assess self-sustainability.
MRC will take color landscape-scale photos from 1 or more
permanent vantage points.
Quantitative data
MRC will determine abundance for each occurrence using a census of
all individuals, if practical. NOTE
If a census is not practical, MRC will estimate abundance, using
appropriate sampling methods and will analyze results with statistical tests
(Elzinga et al. 1998) to estimate occurrence size. If estimating abundance
is not feasible because the life form (e.g., mat-forming or rhizomatous
habitat, floating or submerged aquatics, etc.) makes it difficult to count
separate individuals, or for other reasons, MRC will estimate cover using
appropriate methods (Elzinga et al. 1998).
MRC will use life stage to record the number or percent of
reproductive and non-reproductive individuals. NOTE
For annuals, MRC will estimate the number or percent of reproductive and
non-reproductive individuals. For perennials (herbaceous and woody),
MRC will estimate the number or percent of seedlings, non-reproductive
adults, and reproductive adults.
MRC will select the appropriate census or sampling unit (e.g.,
individual plant; plant part such as inflorescence, fruit, or stem),
according to guidelines in Elzinga et al. (1998).
MRC will determine, for early successional species only (e.g.,
Astragalus agnicidus, Sidalcea malachroides), a measure of long-term
reproductive capability or viability (e.g., estimated seed production).
MRC will determine trend.
MRC will develop, during monitoring protocol design, definitions for
conditions of occurrence trend and species trend (stable, increasing,
decreasing) that are species-specific.
NOTE
Mendocino Redwood Company HCP/NCCP
13-115
Effectiveness Monitoring
Status and Trend of Covered Rare Plant Species
In general, definitions will incorporate parameters related to self-
sustainability, such as area occupied; number or cover of individuals; and
measures of viability like seed production (Pavlik 1996).
MRC will evaluate data and determine trend for each occurrence and
for all occurrences in the plan area.
MRC will apply adaptive management in consultation with the
wildlife agencies, based on trend condition. If the overall trend for the
species in the plan area is (1) declining—conservation measures may
increase; (2) stable—conservation measures will remain the same; (3)
increasing—conservation measures may decrease.
MRC will retain current management and monitoring, if the overall
trend for species in the plan area is stable or increasing.
MRC will monitor invasive pest plants and weed control efforts.
MRC will initially record for each species of invasive pest plant found
in core occurrence and buffer areas the following information:
Name of invasive plant species.
Estimated percent cover of weeds in each core occurrence area
and buffer area.
Observed and potential impacts to rare plants, including
ecosystem and community effects.
MRC will record, after weed control treatment, the estimated percent
cover of weeds within areas where weeds were controlled and in
adjacent areas where weeds were not controlled.
Management Category 3/Monitoring Approach 2
Monitoring Requirements: Plant Data
MRC will monitor occurrences.
Number and frequency
MRC will monitor a representative sample of occurrences in the plan
area once a year until the initial status and trend of the monitored
occurrence (i.e., stable, decreasing, increasing) is established. NOTE
A representative sample of occurrences will include (1) one or more
occurrences in each inventory block in which the species occurs; (2)
occurrences that encompass the range limits of the species in the plan area
for geographic distribution, size, and community or habitat type; and (3)
enough occurrences so that overall status and trend for the species in the
plan area can be tracked over the long-term. Selection of occurrences will
follow guidance in Elzinga et al. (1998). If MRC discovers additional
occurrences—after the initial monitoring program is established and within
the timeframe of our HCP/NCCP—and these occurrences have special
conservation significance due to size, ecology, or location, MRC may add
them to the subset undergoing long-term status or trend monitoring.
MRC will adjust monitoring frequency, after we have determined
initial status and trend, as follows: If the trend for an occurrence is stable-to-increasing, monitor
once every 5 years; in addition, for PTHP areas, monitor once in
the year prior to stand entry and once in the year following stand
entry. If the trend for an occurrence is declining, continue monitoring
once per year until trend improves to stable-or-increasing and

Mendocino Redwood Company HCP/NCCP
13-116
Effectiveness Monitoring
Status and Trend of Covered Rare Plant Species
apply adaptive management.
Area
MRC will monitor all of the core occurrence area (which may contract
or expand from year to year), or one or more sub-areas that are
representative of the occurrence as a whole, including its management
history.
Time of Year
MRC will monitor all occurrences at a time of year when we can
accurately detect and identify the species, typically during the
flowering or fruiting period. MRC will monitor occurrences at approximately the same time each
year.
Qualitative data
MRC will prepare a general description of the occurrence, including
size of plants; vigor of plants; rough estimate of percentage of
flowering and percentage of fruiting; disease condition; predation;
insects or other potential pollinators observed visiting the plants;
soil/substrate type and condition; associated species of plants; invasive
weeds in area; and other factors needed to assess self-sustainability.
MRC will take color landscape-scale photos from 1 or more
permanent vantage points.
Quantitative data
MRC will determine abundance using a census of all individuals, if
practical; otherwise, we will estimate cover by cover class using visual
estimates in representative sample plots (Elzinga et al. 1998).
MRC will use life stage to record the number or percent of
reproductive and non-reproductive individuals. NOTE
For annuals, MRC will estimate the number or percent of reproductive and
non-reproductive individuals. For perennials (herbaceous and woody),
MRC will estimate the number or percent of seedlings, non-reproductive
adults, and reproductive adults.
MRC will select the appropriate census unit (e.g., individual plant;
plant part such as inflorescence, fruit, or stem), according to Elzinga et
al. (1998).
MRC will determine trend.
MRC will develop, during monitoring protocol design, definitions for
conditions of occurrence trend and species trend (stable, increasing,
decreasing) that are species-specific. NOTE
In general, definitions will incorporate parameters related to self-
sustainability, such as area occupied; number or cover of individuals; and
measures of viability like seed production (Pavlik 1996).
MRC will evaluate data and determine trend for all monitored
occurrences in the plan area.
MRC will apply adaptive management in consultation with the
wildlife agencies, based on trend condition. If the overall trend for the
species in the plan area is (1) declining—conservation measures may
increase; (2) stable—conservation measures will remain the same; (3)
increasing—conservation measures may decrease.

Mendocino Redwood Company HCP/NCCP
13-117
Effectiveness Monitoring
Status and Trend of Covered Rare Plant Species
MRC will monitor invasive pest plants and weed control efforts.
MRC will initially record for each species of invasive pest plant
found in core occurrence and buffer areas the following information:
Name of invasive plant species.
Estimated percent cover of weeds in each core occurrence area
and buffer area.
Observed and potential impacts to rare plants, including
ecosystem and community effects.
MRC will record, after weed control treatment, the estimated
percentage of weed cover within areas where weeds were controlled
and in adjacent areas where weeds were not controlled.
Management Category 4/Monitoring Approach 3
Monitoring Requirements: Plant Data
MRC will monitor occurrences.
Number and frequency
MRC will monitor presence/absence on a representative sample of
occurrences in the plan area. NOTE
A representative sample of occurrences will include (1) one or more
occurrences in each inventory block in which the species occurs; (2)
occurrences that encompass the range limits of the species in the plan area
for geographic distribution, size, and community or habitat type; and (3)
enough occurrences so that overall status and trend for the species in the
plan area can be tracked over the long term. Selection of monitoring sites
will follow guidance in Elzinga et al. (1998). If MRC discovers additional
occurrences—after the initial monitoring program is established and
within the timeframe of our HCP/NCCP—and these occurrences have
special conservation significance due to size, ecology, or location, MRC
may add them to the subset undergoing long-term status/trend monitoring.
MRC will adjust monitoring frequency, after we determine initial
status and trend, as follows: If trend for occurrence is stable-to-increasing, monitor once
every 5 years; for PTHP areas, monitor once in the year prior to
stand entry and once in the year following stand entry. If trend for occurrence is declining, continue monitoring once
per year until trend improves to stable-to-increasing and apply
adaptive management.
Area
MRC will monitor all of the core occurrence area (which may contract
or expand from year to year), or one or more sub-areas that are
representative of the occurrence as a whole.
Time of Year
MRC will monitor all occurrences at a time of year when we can
accurately detect and identify the species, typically during the
flowering or fruiting period. MRC will monitor occurrences at approximately the same time each
year.
Qualitative data

Mendocino Redwood Company HCP/NCCP
13-118
Effectiveness Monitoring
Status and Trend of Covered Rare Plant Species
MRC will prepare a general description of the occurrence, including,
at a minimum, a rough visual estimate of number of individuals or
area covered by rare plants and a summary of occurrence
characteristics important to conservation.
MRC will take color landscape-scale photos from 1 or more
permanent vantage points.
MRC will determine trend.
MRC will base determination of species trend on data about presence
or absence of occurrences.
MRC will apply adaptive management in consultation with the
wildlife agencies, if loss of occurrences in the plan area results in a
change in S rank from less rare to more rare (e.g., from S4 to S3).
MRC will monitor invasive pest plants.
MRC will list invasive pest plants observed in the vicinity of the
occurrence and will note observed and possible future impacts to rare
plants, including ecosystem and community effects.
Management Category 1-4/ Monitoring Approach 1-3
Monitoring Requirements: Operation Type, Vegetation, and Disturbance Data
MRC will collect, for each PTHP or other covered activity, the following
data:
Operation type (e.g., yarding, road maintenance, silviculture).
Tree characteristics before and after harvest (species mix, density, and
size class).
Seral stage (primary, early, middle, late, mature), using consistent and
objective definitions.
Percent canopy cover, measured with the best available method, e.g.,
vertical densitometer or aerial photography.
Understory species composition.
Level of pre-harvest physical disturbance (none, low, medium, high),
using consistent and objective definitions.
Type of pre-harvest physical disturbance (road maintenance or use,
erosion, landslides, blow-down, fire, flood effects).
ADAPTIVE MANAGEMENT
MRC will determine the trend of all rare plant species found in the plan area,
based on species-specific definitions of trend condition (declining, stable, or
increasing) developed as a part of monitoring protocols.
MRC will determine whether conservation objectives are being met.
MRC will confer with the wildlife agencies on a regular basis (i.e., at least
every 5 years or upon request) to decide whether we should modify
conservation measures.
If MRC or the wildlife agencies propose to modify conservation
measures, they must determine whether adequate information exists—
in the scientific literature, targeted studies, or other sources—to do so.
If adequate information exists to modify existing conservation
measures or to select an alternative conservation measure, MRC and
the wildlife agencies may jointly select and approve the change,
consistent with goals and objectives.
If adequate information does not exist to modify existing conservation
Mendocino Redwood Company HCP/NCCP
13-119
Effectiveness Monitoring
Status and Trend of Covered Rare Plant Species
measures or if monitoring reveals declines, MRC and the wildlife
agencies will work together to develop the goals for a targeted study
and select a person to design the study, collect and interpret study data,
and make recommendations based on study findings.
MRC and the wildlife agencies will, jointly or individually, fund or seek
funding for any targeted studies that they decide to implement.
MRC and the wildlife agencies will act on the findings of the targeted study
in a timely manner.
MRC and the wildlife agencies may convene a science panel to advise the
parties in the resolution of any disagreements that may persist during the
adaptive management process (see section 13.11)
13.10.4 Adaptive management
Adaptive management for covered rare plants will be an interactive, long-term process that uses
the results of monitoring and targeted studies to evaluate the effectiveness of conservation
measures and make adjustments in conservation measures, if warranted. Adaptive management,
required by the revised Natural Community Conservation Planning Act (2003), applies to covered
rare plants as well as natural communities. It is inherent in the process that MRC and the wildlife
agencies will use to determine management categories for rare plants. If the status of a covered
rare plant improves or declines in the plan area, as determined through monitoring, there may be
changes to its management category and to its conservation measures. Adaptive management also
kicks in when MRC is not meeting conservation objectives. If trend condition and other
information provided in the MRC annual status report to the wildlife agencies indicate that MRC
is not meeting the conservation objectives, then MRC and the wildlife agencies will confer on
appropriate modifications to the conservation measures. MRC will also confer with the wildlife
agencies if conservation measures prove to be more restrictive than necessary; either MRC or the
wildlife agencies may recommend modifications in this case. The long-term goal is to manage
and conserve rare plant species that are not listed as threatened or endangered so that listing
remains unnecessary
Key elements in implementation of adaptive management include the following:
MRC will determine the trend of all covered rare plant species
found in the plan area, based on species-specific metrics of trend
condition (declining, stable, or increasing) developed in
conjunction with monitoring protocols.
MRC will determine whether we are meeting conservation
objectives, based on trend and other factors.
MRC will confer with the wildlife agencies on a regular basis (i.e.,
at least every 5 years or upon request) to decide whether we should
modify conservation measures.
MRC and the wildlife agencies must determine whether adequate
information exists—in the scientific literature, targeted studies, or
other sources—to modify conservation measures.
MRC and the wildlife agencies will jointly select and approve

Mendocino Redwood Company HCP/NCCP
13-120
modifications to conservation measures, if adequate information
exists to do so.
MRC and the wildlife agencies will work together to fill
information gaps, using, for example, targeted studies, if adequate
information does not exist for modifying conservation measures.
MRC and the wildlife agencies will develop goals and select a
person to design a targeted study, collect and interpret study data,
and make recommendations based on study findings, if such a study
is warranted.
MRC and the wildlife agencies will, jointly or individually, fund or
seek funding for any targeted studies that they decide to implement.
MRC and the wildlife agencies will act on the findings of the
targeted study in a timely manner.
13.11 Program Structure for Adaptive Management and Monitoring
MRC oversees the programs for adaptive management and monitoring. The wildlife agencies will
provide input and help guide the programs, but MRC has ultimate responsibility for implementing
the programs. MRC will prioritize HCP/NCCP activities, develop annual and long-term work
plans, and disseminate annual reports. The wildlife agencies—USFWS, NMFS, and CDFG—are
responsible for ensuring the proper implementation of our HCP/NCCP. Based on the annual
reports they receive, they will guide the efforts of MRC so that our HCP/NCCP remains in
compliance.
A Science Panel will provide technical interpretations of issues in dispute and assist MRC and the
wildlife agencies to reach consensus. If monitoring indicates that a conservation measure needs
modification, MRC will meet with the wildlife agencies to determine the necessary changes. If
MRC and the wildlife agencies cannot reach agreement on a change to a conservation measure,
they will consult a scientific review panel. The scientific review panel will consist of experts in a
discipline relevant to the conservation measure. The panel will include
One person chosen by the wildlife agencies.
One person chosen by MRC.
One person acceptable to both MRC and the wildlife agencies.
The wildlife agencies will consider the findings and recommendations of the scientific review
panel in determining changes to conservation measures.
For monitoring purposes, the 80-year term consists of 20-year intervals. At the end of 20, 40, and
60 years, MRC and the wildlife agencies will convene and discuss whether to change the
monitoring programs, particularly the intensity of sampling. The wildlife agencies may ask for a
review of a monitoring program any time during the term of our HCP/NCCP. Likewise, MRC,
with approval of the wildlife agencies, can initiate minor changes to a monitoring program. As
scientific knowledge and technology improve over the course of 80 years, MRC or the wildlife
agencies will likely suggest many changes in monitoring methods and protocols.

Mendocino Redwood Company HCP/NCCP
13-121
13.11.1 Partnerships
MRC cannot shoulder the total cost of researching all issues of forest management that may arise
during the term of our HCP/NCCP. However, we are willing to partner with governmental
agencies, research institutions, as well as public and non-governmental organizations to examine
the scientific justification for our current and future land management practices. Under such an
arrangement, research partners must follow the rules in place for individuals or contractors
entering and using our forest lands. MRC will share with the wildlife agencies any data gathered
in research partnerships that might be useful in evaluating HCP/NCCP performance.
13.12 Reporting Requirements
MRC will prepare reports over the term of our HCP/NCCP that document permit compliance, as
well as management actions, monitoring results, and targeted studies. Appendix D, HCP/NCCP
Report Timelines and Samples, contains reporting schedules, report examples, and a cross-
reference table to specific sections in Chapter 13 that link to the report examples. These reports
provide the wildlife agencies with data on compliance, validation, and effectiveness monitoring
for aquatic and terrestrial habitat and species, as well as information on roads, mass wasting, and
timber inventory. The purpose of the reports is to communicate the findings of the monitoring and
adaptive management program about the effectiveness of MRC in meeting the goals and
objectives of our HCP/NCCP. Although MRC will submit most reports annually, there are
different report intervals. Finally, MRC will submit reports to designated representatives of the
wildlife agencies and share them with other interested parties, as appropriate.
The goals of the reports are to
Demonstrate to the wildlife agencies that MRC is properly implementing our
HCP/NCCP.
Disclose and correct any problems with HCP/NCCP implementation.
Document issues with HCP/NCCP implementation that may require consultation
with wildlife agencies.
Identify administrative or minor changes to HCP/NCCP components that could
increase the effectiveness of conservation measures.
13.12.1 Compliance Reporting
To ensure that PTHPs conform to HCP/NCCP conservation measures and to assist the wildlife
agencies in verifying compliance, MRC will provide the wildlife agencies with notices of
operation start and completion, as well as compliance reports. In some cases, an individual report
may serve several purposes. A report may indicate, for example, how MRC is complying with
HCP/NCCP requirements and whether a group of conservation measures are effective.
For those years in which monitoring occurs, MRC will submit year-end reports to the wildlife
agencies on
Aquatic habitat and species.
Long-term channels.
LWD recruitment and placement.
Sediment control.
Northern spotted owls.
Marbled murrelets.
Point Arena mountain beavers.

Mendocino Redwood Company HCP/NCCP
13-122
Snags, wildlife trees, and downed wood.
Hardwoods.
Rare plants.
MRC will submit reports every ten years to the wildlife agencies on
Natural communities.
Old growth.
Rocky outcrops.
13.12.2 Website and workshops
Monitoring reports pertaining to our HCP/NCCP will be available to the public on the MRC
website (www.mendocinoredwoodcompany.com). In addition, during each year of HCP/NCCP
implementation, MRC will conduct public workshops that assess our progress in meeting the
conservation objectives of the plan.