chapter 13 ecological theory - rockefeller university
TRANSCRIPT

PERSPECTIVES
IN
Ecological Theory Edited by
JONATHAN ROUGHGARDEN, ROBEI\.T M. MAY
and
SIMON A. LEVIN
1989
PRINCETON UNIVERSITY PRESS
Princeton, New Jersey
STRUCTURE AND ASSEMBLY OF COMMUNITIES
Chapter 13
Food Webs and Community Structure
JOEL E. COHEN
v
A central problem of biology is to devise helpful concepts (e.g., genes) and tested quantitative models (e.g., Mendel's laws) to describe, explain, and predict biological variation. The problem of characterizing variation arises in different gui1;es in population genetics (genetic variation), demography (variation by age, sex, location, etc.), epidemiology (variation by risk factuiS and disease status), and ecology (variation in species composition and interactions in communities). In each field, there is variation over time, in space, and among units of observation (individuals, populations, or comparable habitats).
This paper reviews some recent efforts to describe, explain, and predict variation in the food webs of ecological communities. There are many notions of an ecological community and many approaches to describing and understanding community ecology. Panoramic reviews of community ecology are available (e.g., Diamond and Case 1986; Kikkawa and Anderson 1986; National Research Council 1986). For present purposes, a community is whatever lives in a habitat (lake, forest, sea floor) that some ecologist wants to study.
Once the physical boundaries of a habitat are defined, it is natural to study flows of matter and energy across and within the boundaries. A partial description of these flows is provided by food webs, which used to be called food cycles (Elton 1927).
A food web describes which kinds of organisms in a community eat which other kinds, if any. A community food web (hereafter simply "web") describes the feeding habits of a set of organisms chosen on the basis of taxonomy, location, or other criteria without prior regard to the feeding habits among the organisms. Webs were invented in the natural-historical approach to community ecology as a descriptive summary of which species were observed to eat which others.
181

182 Joel E. Cohen
If an ecological community is like a city, a web is like a street map of the city: it shows where road traffic can and does go. A street map usually omits many important details, for example, the flow of pedestrian and bicycle traffic, the amount of traffic that flows along the available streets, the kind of vehicular traffic it is, the reasons for the traffic, the laws governing traffic flow, rush hours, and the place of origin of the vehicles. By analogy, a web often omits small flows of food or predation on minor species, the quantities of food or energy consumed, the chemical composition of food flows, the behavioral and physical constraints on predation, temporal variations (periodic or stochastic) in eating, and the population dynamics of the species involved. Thus a web gives at best very sketchy information about the functioning of a community. But just as a map provides a helpful framework for organizing more detailed information, a web helps picture how a community works.
Many approaches to studying webs are available. I will not attempt here a comprehensive review of food webs, since such reviews are available (see Pimm 1982 and in press; DeAngelis, Post, and Sugihara 1983). A difference of temperament, training, and language seems to divide those who prefer to study webs in physical and chemical terms (e.g., Lotka 1925; Lindemann 1942; Wiegert 1976; Budyko 1980; Margalef 1984; Remmert 1984) from those who prefer to study webs in terms of the natural history of species of living organisms (e.g., many authors in the collection by Hazen 1964). Here "natural history" comprises morphological, genetic, physiological, behavioral, and demographic characteristics of species. Recent natural-historical approaches have focused on combinatorial aspects of web structure (Cohen 1978; Sugihara 1982, 1983, 1984), on the theory of interactions between web structure and the stability of dynamic models (May 1973; Pimm and Lawton 1977; Pimm 1982, 1984; Sugihara 1982), and on empirical generalizations (Paine 1980; Briand 1983a,b; Beaver 1983, 1985).
Fortunately, nature is serenely indifferent to the prejudices ecologists bring her. It will eventually be necessary to integrate the physico-chemical and naturalhistorical approaches to community ecology. I hope that the food-web models reviewed here will help bring about that integration.
This paper reviews some recent discoveries about webs, suggests opportunities for further empirical and theoretical study, and sketches some uses for actual and potential knowledge about webs. I attempt to describe in a simple way some recent discoveries that, in their original presentations, may appear forbiddingly technical, and to place these discoveries in a larger scientific and practical setting.
So far as I know, webs were first described in scientific detail at the beginning of this century. Simplifications that they were, the webs appeared extremely complex relative to the concepts available for understanding them. The webs differed strikingly from one habitat to another. Now enough webs have been patiently observed and recorded to demonstrate that ensembles or collections of webs display simple general properties that are not evident from any single web.
FOOD WEBS AND COMMUNITY STRUCTTlRE 183
Building on a collection of webs that I initiated (Cohen 1978), F. Briand assembled and edited 113 community webs from 89 distinct published studies. Thus many field ecologists contributed to the discoveries reviewed here. Most of the world's biomes are represented among these webs. There are 55 continental (23 terrestrial and 32 aquatic), 45 coastal, and 13 oceanic webs, ranging from arctic to antarctic regions. The sources and major characteristics of these webs are listed by Briand and Cohen (1987). Forty have been fully documented (Briand 1983a) and the remainder soon will be (Cohen, Briand, and Newman, in press).
In what follows, I will illustrate what a web is and how a web is described. I will present some recent quantitative empirical generalizations about webs. Then I will present a simple model, called the "cascade model," that unifies the quantitative generalizations. Though this model does not purport to represent everything field ecologists know is happening in webs, no other model at present connects and explains quantitatively what is observed. The cascade model also makes novel predictions that can be tested. Then I describe problems from other parts of ecology that can be analyzed using the cascade model and the facts on which it is based. Finally, I sketch some potential uses of facts and theories about webs.
TERMS
Let me introduce some terms and illustrate them with an example. A trophic species is a collection of organisms that has the same Jiets and the same predators. This definition combines Sugihara's definitions (1982, p. 19) that resources are trophically equivalent if they have identical consumers and that consumers are trophically equivalent if they have identical resources. A trophic species will sometimes, but not always, be a biological species in the usual sense of biological species: a collection of organisms with shared genetics. A trophic species may be a biological species of plant or animal, or several species, or a stage in the life cycle of one biological species. Hereafter the word "species" without further specification means "trophic species."
Independently of Sugihara (1982, p. 19), Briand and I (1984) introduced the concept of trophic species to find out if there was merit in a criticism that Pimm (1982, p. 168) made of my earlier finding (Cohen 1977), that webs generally had about four (biological) species of predators for every three (biological) species of prey. Pimm suggested that ecologists distinguish among species with fur or feathers, which are likely to be consumers, more often than among species with more difficult taxonomy, such as many plants, microorganisms, and insects, which are likely to be consumed. The excess of predators, he suggested, could be an artifact of the interests and knowledge of ecologists.
To test that possibility, Briand and I devised an automated lumping procedure

184 Joel E. Cohen
that puts together those biological species or other biological units of a web that eat the same kinds of prey and have the same kinds of predators. We call each equivalence class that results from such lumping a trophic species. Our intent was to apply a uniform rule to distinguishing among the units of a web to see if this uniform rule altered the ratio of predators to prey. Indeed it did! A slight excess of predators remains, but the ratio of predators to prey counting lumped or trophic species (Briand and Cohen I984) is much nearer I: I than the ratio based on the original data. Pimm's criticism had merit. We believe that using trophic species, as we shall do henceforth in this paper, corrects a bias of ecologists and gives a more realistic picture of the trophic structure of communities.
A web is a collection of trophic species, together with their feeding relations. Each arrow in a web goes from food to eater, or from prey to predator. I call each arrow a "link," short for "trophic link."
Figure 13.1 pictures the unlumped web on an island in the Pacific Ocean. Some species are top, meaning that no other species in the web eats them, for example, reef heron, starlings. Some species are intermediate, meaning that at least one species eats them, and they eat at least one species, for example, insects, skinks, fish. Some species are basal, meaning that they eat no other species, for example, algae, phytoplankton. The web omits decomposers. A crude way to
Rat Pig •
\
~"" I /7 Coconut crabs
,_, "\i~w :- • 7"/' / _:::~-.. Algae / 1/ B• (filamentous, --> Fish ,; Pandanus -> ~ganic calcareous) ----->· Man / de ris
7 Annelids ~ -->Snails
~ • ~"- <- Cyrtosperma -> 1/ ln/v:rtebrates ~~ '"'-....... Land /7 1
"\ vegetation
Zooplankton / \ ~ Land /.., Fowl / ~ "' crustacea
----'Fungi
Phytoplankton Sea turtles Insects
/ \ Marine environment Turtle grass
Skinks, gecl<os Terrestrial environment
\, Reef heron
FIGURE 13.1. Food web in rhe Kapingamarangi Atoll. (From Niering 1963, p. 157.) As reported by Niering, the biological units in this figure range taxonomically from individual biological species (man, pig) to very large aggregates of species (phytoplankton, land vegetation), and do nor correspond ro trophic species.
FOOD WEBS AND COMMUNITY STRUCTURE 185
quantify the structure of webs is to count the numbers of species that are top, intermediate, and basal.
These three kinds of species specify four kinds of links: basal-intermediate links, for example, phytoplankton to zooplankton; basal-top links, for example, coconut to man; intermediate-intermediate links, for example, zooplankton to fish; and intermediate-top links, for example, fish to frigate birds. Additional information about structure is given by the numbers oflinks of each of these four kinds.
A chain is a path of links from a basal species to a top species, e.g., phytoplankton to fish to terns. The length of a chain is the number of links in it. In figure 13.1 the longest chain has only four links, and there is only one chain of length 4.
A cycle is a directed sequence of one or more links starting from, and ending at, the same species. A cycle oflength I describes cannibalism, in which a species eats itself. Cannibalism is common in nature. But ecologists report cannibalism so unreliably that we have suppressed it from all the data even where it is reported. A cycle of length 2 means that A eats B and B eats A. In this example, as in most webs, there are no cycles of length 2 or more.
In summary, the terms just defined are trophic species, including top, intermediate and basal; links, including basal-intermediate, basal-top, intermediateintermediate, and intermediate-top; and chains, length (the number of! inks), and cycles.
In what follows, the terms "observed web" or "real web" mean a web edited to eliminate obvious errors, inconsistencies, and oversights, in which the original ecologist's biological units are replaced by trophic species. Are such webs really "real"?
Clearly the processed data are more constrained by reality than, for example, webs constructed a priori as model ecosystems. As a relative term, "real" means not that the data are perfect, but that they are not invented.
I think it may eventually be possible to claim much more for edited webs based on trophic species. By analogy, chemists have learned that it is more useful and economical to describe chemical "reality" in terms of chemical elements, which were once considered hypothetical, than in terms of gross phenomenology like color, taste, and density. Geneticists have learned that it is more useful and economical to describe the factors affecting inheritance in terms of genes, which were once considered hypothetical, than in terms of the gross phenomenology of certain macroscopic characters. I suggest that a web in which the units are trophic species may prove to be a more useful and economical description of the trophic organization of ecological communities than a description in terms of taxonomic phenomenology. Whether trophic species are closer to reality than the full glory of a naturalist's notebook will have to be determined by the eventual usefulness of the empirical and theoretical generalizations that develop using trophic species.

186 Joel E. Cohen
LAWS
Here are five laws or empirical generalizations about webs. First, excluding cannibalism, cycles are rare. This generalization, without
detailed supporting data, has been known for a long time (e.g., Gallop in 1972). Of 113 webs, 3 webs each contain a single cycle of length 2, and there are no other cycles (Cohen and Newman 1985, p. 426; Cohen, Briand, and Newman 1986, p. 333).
The rarity of cycles is not an artifact of using trophic species instead of the original units of observation, such as biological species, size classes, or aggregates of species. The reason is that the lumping procedure does not alter the connectivity of the web: the trophic species containing unit A is trophically linked to the trophic species containing unit B if and only if A was originally trophically linked to B. It follows that any cycle present in the original web must be represented by a cycle of the same length in the lumped web. Therefore, excluding cannibalism, if 110 of 113 lumped webs have no cycles, then 110 of the original webs had no cycles. The remaining three of the original webs had no cycles longer than length 2. There is no evidence that cycles occur in more webs if biological species are used instead of trophic species.
Second, chains are short (Hutchinson 1959). If one finds the maximum chain length within each web, then the median of this maximum in the 113 webs studied by Cohen, Briand, and Newman (1986) is four links and the upper quartile of the maximum chain length is five links. The longest chains in all 113 webs had ten links, and only one web had chains that long.
The last three laws deal with scale in variance (Cohen 1977; Briand and Cohen 1984; Cohen and Briand 1984). Scale invariance means that webs of different size have constant shape, in some sense.
Our third law is scale in variance in the proportions of all species that are top species, intermediate species, and basal species (fig. 13.2). There is evidently no increasing or decreasing trend in these proportions as the number of species increases (Briand and Cohen 1984). Here scale invariance describes the observation that as the number of species in 62 webs varies from 0 to 33, the proportions of top, intermediate, and basal species apparently remain invariant. This scale in variance explains my earlier observation (Cohen 1977) that the ratio of number of predators to number of prey has no systematic increasing or d~creasing trend when webs with different numbers of species are compared. The number of predators is the sum of the numbers of top plus intermediate species, while the number of prey is the sum of the numbers of intermediate plus basal species. Mithen and Lawton (1986) and Tilman (1986) have developed other explanations for the same finding.
Our fourth law is scale in variance in the proportions of the different kinds of
f3 8
0.6
5; 0.4
.J g F Q2
~ F-
0
f3 0.8
M a. U)
.J
~ 12 ........ w t:( 0.4
i5 w ~ a: ~ 0.2 ~
0
FOOD WEBS AND COMMUNITY STRUCTURE
c c r r F' c c c
, F
f ,
f F'
F' F'
f
f f f
10
f
c ec
C F f
F' f f c
c c
20
c
F' f F F' F' f F'
f c F'
f
10
10
c F' F C
c
f
F'
c
20
20
c
c
c
r r F
A
F' c
c F'
F'
f
f
c
TOTAL SPECIES
••
B
F'
c
c
c r c
30
F
c c c F'
30
30
187
FIGURE 13.2. Three ratios, plotted as a function of the number of species, show scaleinvariance in the proportions of species. The fitted lines are constrained to be horizontal. (a) Top species/total species; the height of the line is 0.2853. (b) Intermediate species/total species; the height of the line is 0.5251. (c) Basal species/total species; the height of the line is 0.1896. (From Briand and Cohen 1984, p. 265.)

188 Joel E. Cohen
links. In figure 13.3a (Cohen and Briand 1984), for example, the abscissa is the number of species and the ordinate is the proportion of basal-intermediate links among all links. There is no clear evidence of an increasing or decreasing trend. The proportions of different kinds of links, like the proportions of species, are approximately scale-invariant.
The fifth law is that the ratio of links to species is scale-invariant. Figure 13.4 plots the observed number of links in each web against the observed number of species, for 113 webs (Cohen, Briand, and Newman 1986). The data are approximated well by a straight line with slope about 2. That means that a web of 25 species has on average about 50 links. We first came across this generalization with 62 webs (Cohen and Briand 1984). Then Briand collected an additional 51 webs, and we found (Cohen, Briand, and Newman 1986) that the new data superimpose beautifully on the old. So far, this scale-invariant ratio of links to species is a consistent feature of nature.
In summary, I have reviewed evidence for five "laws" of webs. Qualitatively, these laws state that cycles are rare, chains are short, and there is scale-in variance in the proportions of different kinds of species, in the proportions of different kinds oflinks, and in the ratio oflinks to species. Each of these laws may be stated quantitatively.
By constructing hypothetical examples, it is not too hard to see that each of these laws may fail to hold while the remaining laws continue to-hold. This means that the laws are logically independent. That all five laws characterize observed webs suggest that the laws are not empirically independent, and that it might be possible to find fewer than five assumptions that could explain and unify the five laws.
I make no claim that these are the only important empirical "laws" of webs. For example, I have omitted my own finding (Cohen 1978) that the trophic niches of predators in webs may usually be represented by intervals of a line, as well as Sugihara's related findings (1982, 1983, 1984) on the rarity of homological holes and the high frequency of rigid circuits. I selected the five "laws" reviewed above because they are phenomenologically important and because a simple model can connect them qualitatively and quantitatively.
MODELS
I turn now to a model that shows how the five empirical regularities described in the preceding section are related.
LetS denote the number of trophic species and L the number oflinks. List all the species along both the rows and columns of a "predation matrix," a square table of numbers with S rows and S columns. Name the matrix A. Put a 1 in the
06
...J04
' .. ...J
02
0
04
03
...J '0 Iii
...J
0.1
0
FOOD WEBS AND COMMUNITY STRUCTURE 189
(a) 4 (c)
r r
' c ...J ~ c ' ...... ' = ' '
c ...J ,, '
' r-r'fc
r c r r r r r 6
,__ __ ,l!..!_;~'----"----f f r ,.
r r
,.r c c
' , t c c ~ '' ' ' ' c
' c c c r c I ro' 0 K> 30 10 20 30
(b) (d)
06
c
' ' ' c c ' • , .
r r ~Q4 ' c, '
I: c ...J r r • '. 't • '
02 • r 't c
c • c c c '~ c' c: • c • ••
10 20 30 0 K> 20 30 s s
FIGURE 133. Four ratios, plotted as a function of the number of species, show scale invarian.;.; iu the proportions of links. The fitted lines are constrained to be horizontal. (a) Basalintermediate links/total links; the height of the line is 0.274. (b) Basal-top links/total links; the height of the line is 0.077. (c) Intermediate-intermediate links/total links; the height of the line is 0.301. (d) Intermediate-top links/total links; the height of the line is 0.348. The points in the upper left corner of (a) are based on very few links. (From Cohen and Briand 1984, p. 4107.)
intersection of row i and column j (element aij of the matrix A) if the species labeled j eats the species labeled i, and a 0 if species j does not eat species i. Since cannibalism is excluded from the data, all the diagonal elements (where i = j) are set equal to 0. In terms of this predation matrix, the total number of links is the sum of the elements of A. The sum picks up a 1 if there is a link from prey i to predator j and a 0 if there is no link.
The predation matrix also tells whether a species is top. If a species is top, then

190 Joel E. Cohen
0 0
120
0
....:J
~ 0 omo §0
~ 0
60 0 oo & 0 0
§ 0 8§0
0
oof>§b~ 0
~OWJ coo
0
oof> 0 20 40
species, S
FIGURE 13.4. Observed number L oflinks as a function of the observed numberS of specie;in 113 webs. (From Cohen, Briand, and Newman 1986, p. 335.)
nobody eats it. That means that the row of that species should be all O's. So a 0-row corresponds to a top species. Similarly, a 0-column corresponds to a basal species because the species eats nothing. A species that has neither a 0-row nor a 0-column is intermediate.
I now describe the cascade model, but not the calculations required to squeeze results out of it. Some limnologists (e.g., Carpenter, Kitchell, and Hodgson 1985) use the term "cascade" with a different meaning, to describe the dynamics of limiting nutrients in webs. When the term "cascade" appears, it seems advisable to look for a definition. In this article, "cascade" refers only to the model in the next paragraph.
First, suppose nature numbers the S species in the community from 1 to S (without showing us the numbering), and suppose that the numbering specifies a
FOOD WEBS AND COMMUNITY STRUCTURE 191
pecking order for feeding, as follows. Any species j in this hierarchy or cascade can feed on any species i with a lower number i <j {which does not mean thatj does feed on i, only that j can feed on i). However, species j car.uv< ;"'cJ ull any species with a number k at least as large, k 2::: j. Second, the cascade model assumes that each species actually eats any species below it according to this numbering with probability diS, independently of whatever dse is going on in the web. Thus the probability that species} does not eat species i <j is 1 -diS. These two assumptions, of an ordering and of a probability of feeding propor-
1 tiona! to liS, are all there is to the cascade model. In the predation matrix A, aij is always 0 if i 2::: j. The predation matrix in the
cascade model is strictly upper triangular, that is, every element on or below the main diagonal is 0. An element above the diagonal (i <j) is 1 with probability diS and 0 with probability 1 - diS, and all elements are independent.
As is conventional, I use E to denote the average or expected number. I now show how to compute E(L), the expected number of links, according to the cascade model. The expected number of links is the expectation of the sum of the predation matrix elements. There are S2 elements in the predation matrix A, and the probability is diS that an element aij (i <j) above the main diagonal equals l. All other elements of A are 0 by construction. Since there are S(S-1)/2 elements above the main diagonal, the expected sum of the elements of A is S(S -l)/2 X
diS = d(S-1)12 = E(L). Thus E(L) is a linear function of S with slope d/2. Since at present I have no theory to predict the slope, I have to estimate the
slope from the data in figure 13.4. The slope of the line there is approximately 2, so I take d = 4 approximately. That is the only curve-fitting in this model. Everything else is derived. Thus E(L) = 2(S-1) = 2S- 2. Among webs with 26 species, the average number oflinks is predicted to be fifty. Since the number of species ranges from 3 to 48 in our data, the constant term -2 in this equation is negligible compared to the term 2S proportional to S. Qualitatively, the cascade model reflects the observation that the expected number oflinks is nearly proportional to the number of species. Quantitatively, the links-species scaling law fits because I made it fit by taking d = 4.
Roughly speaking, dl2 [more exactly, d(S-1)1(2S)] is the average number of predators per species and dl2 is the average number of prey per species. Here the average is taken over all webs with a given number of species and, more importantly, over all species within a web. Obviously, a species at the top of the cascade has no predators, while a species at the bottom of the cascade has no prey. However, averaged over all positions in the cascade, an average species has about two predators and about two prey.
As the number of species becomes large, the cascade model predicts 26% top species, 48% intermediate species, and 26% basal species. Thus the model predicts a 1 : 1 ratio of predators to prey. We observe 29% top species, 53% intermediate, and 19% basal (see fig. 13.2), giving roughly a 1.1 : 1 ratio of predators to prey. The
192 Joel E. Cohen
model predicts the following percentages of basal-intermediate, basal-top, intermediate-intermediate, and intermediate-top links: 27, 13, 33, and 27. We observe, correspondingly, 27, 8, 30, and 35 (see fig. 13.3).
It is nice that the cascade model reproduces all the laws of scale invariance qualitatively, but it is far more striking that the cascade model gives a remarkable quantitative agreement between observed and predicted proportions. We put one number d into the cascade model and get out five independent numbers (because the three species proportions have to add up to I and the four link proportions have to add up to I). I emphasize that these predictions use only the observed ratio of links to species.
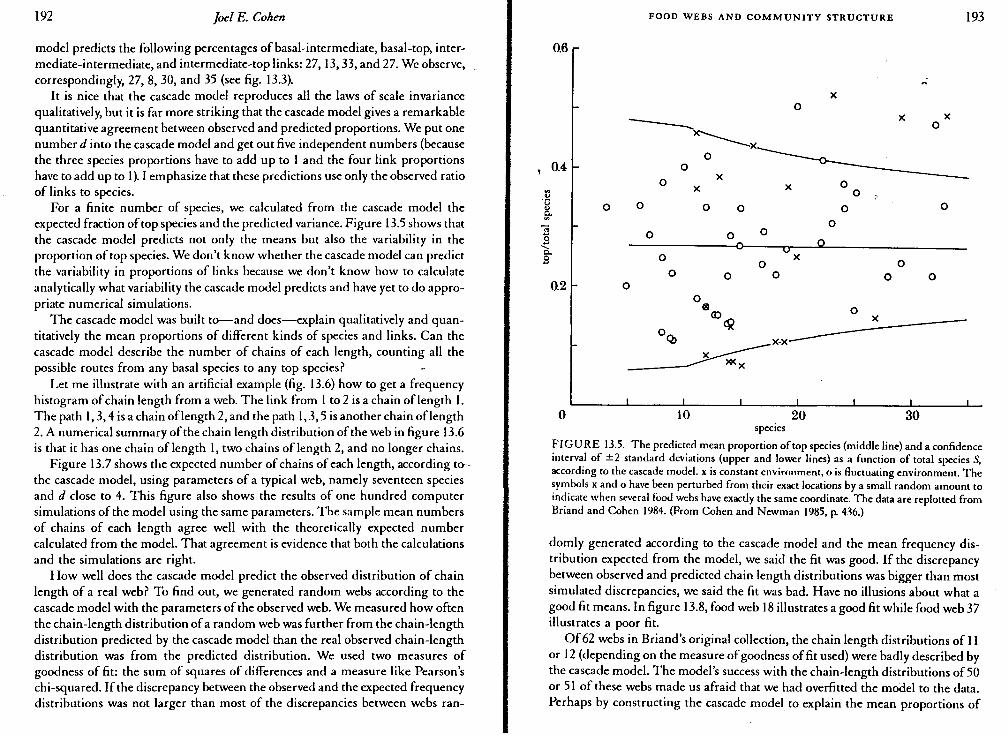
For a finite number of species, we calculated from the cascade model the expected fraction of top species and the predicted variance. Figure 13.5 shows that the cascade model predicts not only the means but also the variability in the proportion of top species. We don't know whether the cascade model can predict the variability in proportions of links because we don't know how to calculate analytically what variability the cascade model predicts and have yet to do appropriate numerical simulations.
The cascade model was built to-and does-explain qualitatively and quantitatively the mean proportions of different kinds of species and links. Can the cascade model describe the number of chains of each length, counting all the possible routes from any basal species to any top species?
Let me illustrate with an artificial example (fig. 13.6) how to get a frequency histogram of chain length from a web. The link from I to 2 is a chain oflength l. The path I, 3, 4 is a chain oflength 2, and the path I, 3, 5 is another chain of length 2. A numerical summary of the chain length distribution of the web in figure 13.6 is that it has one chain of length I, two chains oflength 2, and no longer chains.
Figure 13.7 shows the expected number of chains of each length, according tothe cascade model, using parameters of a typical web, namely seventeen species and d close to 4. This figure also shows the results of one hundred computer simulations of the model using the same parameters. The sample mean numbers of chains of each length agree well with the theoretically expected number calculated from the model. That agreement is evidence that both the calculations and the simulations are right.
How well does the cascade model predict the observed distribution of chain length of a real web? To find out, we generated random webs according to the cascade model with the parameters of the observed web. We measured how often the chain-length distribution of a random web was further from the chain-length distribution predicted by the cascade model than the real observed chain-length distribution was from the predicted distribution. We used two measures of goodness of fit: the sum of squares of differences and a measure like Pearson's chi-squared. If the discrepancy between the observed and the expected frequency distributions was not larger than most of the discrepancies between webs ran-
FOOD WEBS AND COMMUNITY STRUCTURE 193
0.6
X 0
X X 0 ------x---..____x
0 0
X l 0.4
"' u
0 X X 0
0 0 0 0 0 ·~ 0 0
0 0 0 0
0 0 0
0 0 0 0 0 0.2 0
0 X
0 10 species
FIGURE 13.5. The predicted mean proportion of top species (middle line) and a confidence interval of ±2 standard deviations (upper and lower lines) as a function of total species S, according to the cascade model. x is constant environment, o is fluctuating environment. The symbols x and o have been perturbed from their exact locations by a small random amount to indicate when several food webs have exactly the same coordinate. The data are replotted from Briand and Cohen 1984. (From Cohen and Newman 1985, p. 436.)
domly generated according to the cascade model and the mean frequency distribution expected from the model, we said the fit was good. If the discrepancy between observed and predicted chain length distributions was bigger than most simulated discrepancies, we said the fit was bad. Have no illusions about what a good fit means. In figure 13.8, food web 18 illustrates a good fit while food web 37 illustrates a poor fit.
Of 62 webs in Briand's original collection, the chain length distributions of II or 12 (depending on the measure of goodness of fit used) were badly described by the cascade model. The model's success with the chain-length distributions of 50 or 51 of these webs made us afraid that we had overfitted the model to the data. Perhaps by constructing the cascade model to explain the mean proportions of

"' c:: "@ ..c: u '-
0 ... u ..c
194 Joel E. Cohen
0 ® ®v v FIGURE 13.6. Hypothetical food web to illustrate how the frequency distribution of chain lengths is counted. There is one chain oflength I (from species I to species 2), and there are two chains of length 2 (from species I to species 4 and from species I to species 5).
D
D
§ 6 D --...... c::
D
0
0 1 3 5 7 9
chain length
FIGURE 13.7. Theoretically expected number (solid line) of chains oflength 1 to 9 in a web of S = 17 species, according to the cascade model with d = 3.75, sample mean number (o) of chains of each length in 100 simulations of the cascade model, and sample mean plus one sample standard deviation (0) in the number of chains of each length. No chains with more than nine links occurred in the simulations; the expected total number of such chains per simulation is 0.003. (From Cohen, Briand, and Newman I986, p. 324.)
FOOD WEBS AND COMMUNITY STRUCTURE 195
FIG. 13.8 Food web fits.
Food web 18 Food •!·~b ?7 "Acceptable" fit "Poor" fit
Chain Predicted Observed Predicted Observed length frequency frequency frequency frequency
I 6.5 13 6.0 0 2 9.9 10 10.3 2l 3 8.6 5 IO.l 23 4 5.2 4 6.8 8
2:::5 3.6 0 5.3 0
FIGURE 13.8. Examples of "acceptable" and "poor" fits between the predicted (mean) numbers of chains of each length according to the cascade model and the observed numbers of chains of each length. In the serial numbering of Briand (1983~ which is used here, number 18 is the Kapingamarangi Atoll food web (see fig. 13.1 above) of Niering (1963) and number 37 is the California sublittoral (sand bottom) food web of Clarke, Flechsig, and Grigg (1967). These webs correspond (see Briand I983a), respectively, to food webs numbered 11 and 2 by Cohen (1978), who gives the predation matrices in full. For food web 18, four chains oflength 4 are shown while figure 13.1 has one chain of four links. The reason for this discrepancy is that Cohen (1978) added, to the predation matrix for this web, links that Niering (I963) described in his text but omitted from his figure.
top, intermediate, and basal species and the proportions of different kinds of links, we had used so much information from the data that there was no possibility for the fits to the chain-length distribution to be bad, even though they were not used to build the model. This worried us. So Briand found and edited 51 additional webs which we had never analyzed before. The ratio oflinks to species was roughly the same for these new webs as for the old webs, as I mentioned already. \ViLh these fresh data, we found only 5 webs with poor fits to the cascade model's predicted frequency distribution of chain length. The proportion of poor fits, 5 of 51 webs, was smaller among the new webs than it had been among the original webs.
The cascade model uses no information about chain length to predict the frequency distributions of chain length. The predictions derive solely from the number of species and the number of links. No other parameters are free.
The cascade model needs to be tested further, tested until it fails, as it surely will. How well can the cascade model predict the moments of chain length (as Stuart Pimm has asked), or patterns of omnivory and intervality? Apparently, the niche overlap graph of most webs is an interval graph, that is, the overlaps Gf trophic niches revealed by most webs are consistent with the trophic niches being one-dimensional (Cohen 1978). Under what conditions, if any, does the cascade
196 Joel E. Cohen
model predict that intervality should be common? Can the cascade model relate to the combinatorial web models of Sugihara (1982, 1983, 1984)? Much testing remains to be done.
The cascade model makes new predictions. In large webs (S > 17), the cascade model implies a rule of thumb that I have never seen stated in the ecological literature: The mean length of a chain should equal the mean number of prey species plus the mean number of predators of an average species (Newman and Cohen 1986). Both should equal a number near 4. This purported rule is open to empirical test.
The cascade model explains qualitatively why the longest chain in webs are typically short. Newman and I (1986) derived the relative expected frequency of various chain lengths as the number of species goes to infinity, according to the cascade model, and found that, with a realistic value of d, practically no chains have length 8, 9, or 10. The cascade model predicts that, in very large webs, the length of the longest chain grows like (log S)/(log log S). That is very slow growth. In a web with 108 species, which is probably an upper bound for the world, the cascade model predicts that the longest chain will almost never have more than twenty links.
CONNECTIONS
The cascade model connects with quantitative questions and theories elsewhere in ecology. I will sketch the connection of the cascade model with three topics: the species-area curve, the relative importance of predation and competition in communities, and allometric equations for the effects of body size.
First, one of the best-known quantitative empirical generalizations of ecology/ is the species-area curve (e.g., MacArthur and Wilson 1967; Schoener 1976, 1986; Diamond and May 1981). In its simplest form, the species-area curve asserts that the number of biological species on an island is proportional to the area of the island raised to some power near lf.t. (When examined in detail [Schoener 1986], species-area curves are vastly more complicated.) The cascade model predicts, among other things, how the mean or maximal length of chains depends on the number of trophic species in a community. If the number of trophic species can be assumed or demonstrated (by a future empirical study of actual webs) to be proportional to the number of biological species, then a combination of the species-area curve and the cascade model predicts how chain lengths should vary on islands of different areas.
It is not necessary to go into the details of the formulas to see that if the number of species on an island increases very slowly with area, and if the maximal or mean chain length in a web increases very slowly with the number of species in a community, then the maximal or mean chain length should increase
FOOD WEBS AND COMMUNITY STRUCTURE 197
extremely slowly, or be practically constant, with increasing island area. The combination of the species-area curve and the cascade model explains, qualitatively at least, why there is not a known relation between the area a community occupies and the mean or maximal chain length of its web.
An alternative explanation, suggested by Robert T. Paiu.:o; :.: :~:.: th.::re is no known relation between the area of a community and the mean or maximal chain length of its web because nobody has looked for such a relation. If the cascade model provokes an ecologist to examine the relation empiri.rally, the model will have served a useful purpose, whether or not its predictions are confirmed. It remains to derive the formulas explicitly and to look for empirical tests of the assumptions and predictions.
Second, the cascade model relates to the roles of competition and predation in ecological communities. Hairston, Smith, and Slobodkin (1960), as described succinctly by Schoener (1982, p. 590), "argued that competition shoi.dd prevail among top predators, whereas predation should prevail among organisms of intermediate trophic status, mainly herbivores. Because the herbivores are held down by competing top carnivores, competition should prevail again among the herbivore's [sic] food species, green plants." Menge and Sutherland (1976, p. 353) proposed, by contrast, that as trophic position goes from high to low within a community, the relative importance of predation should increase monotonically while the relative importance of competition should decline monotonically. Connell (1983) and Schoener (1983) reviewed at length field experiments on interspecific competition which bear on these generalizations, and Schoener (1985) analyzed the points of agreement and disagreement in the two reviews.
Predation and competition can be interpreted in terms of quantities computable from the cascade model. It is then possible to examine whether these quantities behave according to the generalizations of Hairston, Smith, and Slobodkin (1960) or Menge and Sutherland (1976). For example, a natural measure of the amount of predation on trophic species i in the cascade model is the expected (i.e., average) number of predators on trophic species i, which is easily seen to be d(S -i)IS. There areS - i species above species i in the trophic pecking order, and the probability that any one of them will feed on species i is diS, so the expected number of predators on species i is the product d(S -i)IS. Since i = I is the lowest trophic position in the cascade model and i = S is the highest, the cascade model implies that this measure of predation should increase linearly as trophic position goes from high to low within a community, exactly as proposed by Menge and Sutherland (1976).
However, the generalizations of Hairston, Smith, and Slobodkin and Menge and Sutherland pertain to the relative importance of competition and predation. So the behavior of a measure of predation needs to be related to the behavior of a measure of competition, such as, for example, one used by Briand (l983a).
Third, physical interpretations of the ord(:ring of trophic species assumed in

198 Joel E. Cohen
the cascade model may make it possible to connect the study of webs with the study of allometry and pnysiological ecology. The combination might be called "ecological allometry." For example, extending to entire webs a qualitative suggestion of Elton (1927, pp. 68-70) for individual chains, suppose that each trophic species consists of individuals more or less homogeneous with respect to size or mass, and that the larger the species' label i = 1, 2, ... , Sin the cascade model (i.e., the higher the trophic position), the larger the mass of each individual in that species. (Food chains of parasites generally follow the opposite rule: parasites are much smaller than their hosts [Elton 1927, chap. 6].) The assumption that body mass increases with a species' label i in the cascade model can be tested empirically, since it implies that no (nonparasitic) trophic species can eat a species larger than itself. When trophic species in real webs are ordered by body mass, is the matrix that describes the trophic relations of the community generally upper triangular, as assumed by the cascade model?
If so, this simple assumption will permit the cascade model to connect facts about food webs with quantitative empirical generalizations that physiological ecologists have discovered about body size (e.g., Peters 1983; Calder 1984; Peterson, Page, and Dodge 1984; Peters and Raelson 1984; Vezina 1985; May and Rubinstein 1985). From preliminary calculations, it appears that several empirical ecological generalizations, which have previously lacked a physical explanation, may be derived from a combination of the cascade model with assumptions or facts about body size.
APPLICATIONS
This work may eventually contribute to human well-being in four ways. First, environmental toxins cumulate along food chains. "Eating 0.5 kg of
Lake Erie fish can cause as much PCB [polychlorinated biphenyl] intake as drinking 1.5 X 10⁶ L of Lake Erie water" (National Research Council1986). An understanding of the distribution of the length of food chains is necessary, though not sufficient, for understanding how toxins are concentrated by living orgamsms.
Second, people have not been very successful at anticipating all the consequences of introducing or eliminating species. Such perturbations of natural ecosystems are being practiced with increasing frequency in programs of biological control. An understanding of the invariant properties of webs is essential for anticipating the consequences of species' removals and introductions. For example, a perturbation that eliminated most of the top trophic species, or most of the basal trophic species, could be expected to be followed by major changes in the structure of the web if the community adjusts to reestablish invariant proportions
FOOD WEBS AND COMMUNITY STRUCTURE 199
of top, intermediate, and basal species. The cascade model or its successors may eventually make it possible to derive more quantitative predictions.
Third, an understanding of webs will help in the design of nature reserves and of those future ecosystems that will be required for long-term manned space flight and extraterrestrial colonies. A nature reserve with all top species would be expected to have trouble, according to the cascade model. For humans to survive and to be fed in space, we need to know more about the care <>no tf.ecling of webs.
Fourth, and finally, since some webs include man, an understanding of webs may give us a better understanding of man's place in nature, here on earth. We have not detected any consistent differences between webs that contain man and webs that do not. Of course, we have not looked yet at webs of agricultural ecosystems strongly influenced by man. When we look at new classes of webs, we may expect to see new patterns.
ACKNOWLEDGMENTS
This work was supported in part by National Science Foundation grants BSR 84-07461 and BSR 87-05047 and by the hospitality of Mr. and Mrs. William T. Golden. Robert T. Paine and George Sugihara offered very helpful comments on a previous draft. Parts of this chapter overlap parts of my paper "Untangling 'an entangled bank': recent facts and theories about community food webs," prepared for a book on community ecology to be edited by Alan Hastings.
REFERENCES
Beaver, R. A. 1983. The communities living in Nepenthes pitcher plants: Fauna and food webs. In J. H. Frank, and L. P. Lounibos, eds., Phytotelmata: Terrestrial Plants as Hosts for Aquatic Insect Communities, pp. 129-59. Plexus Publishing, Medford, N.J.
Beaver, R. A. 1985. Geographical variation in food web structure in Nepenthes pitcher plants. Ecol. Entomol. (Lond.) 10:241-48.
Briand, F. 1983a. Environmental control of food wcL structure. Ecology 64:253-63.
Briancl, F. 1983b. Biogeographic patterns in food web organization. In DeAngelis, Post, and Sugihara (1983), pp. 37-39.
Briand, F., and J. E. Cohen. 1984. Community food webs have scale-invariant structure. Nature 307:264-66.
Briand, F., and J. E. Cohen. 1987. Environmental correlates of food chain length. Science 238:956-60.
Budyko, M. I. 1980. Global Ecology. Progress Publishers, Moscow.
Calder, W. A. 1984. Size, Function, and Life History. Harvard University Press, Cambridge, Mass.

200 Joel E. Cohen
Carpenter, S. R. J. F. Kitchell, and J. F. Hodgson. 1985. Cascading trophic interactions and lake productivity. BioScience 35(10):634-39.
Clarke, T. A., A. 0. Flechsig, and R. W. Grigg. 1967. Ecological studies during Project Sea Lab II. Science 157:1381-89.
Cohen, J. E. 1977. Ratio of prey to predators in community food webs. Nature 270:165-67.
Cohen, J. E. 1978. Food webs and Niche Space. Princeton University Press, Princeton, N.J.
Cohen, J. E., and F. Briand. 1984. Trophic links of community food webs. Proc. Nat. Acad. Sci. USA 81:4105-4109.
Cohen, J. E., F. Briand, and C. M. Newman. 1986. A stochastic theory of community food webs. m: Predicted and observed lengths of f~od chains. Proc. Roy. Soc. Lond. (B) 228:317-53.
Cohen, J. E., F. Briand, and C. M. Newman. In press. Community Food webs: Data and Theory. Springer-Verlag, New York.
Cohen, J. E., and C. M. Newman. 1985. A stochastic theory of community food webs. 1: Models and aggregated data. Proc. Roy. Soc. Lond. (B) 224:421-48.
Cohen, J. E., C. M. Newman, and F. Briand. 1985. A stochastic theory of community food webs. 11: Individual webs. Proc. Roy. Soc. Lond. (B) 224:449-61.
Connell, J. H. 1983. On the prevalence and relative importance of interspecific competition: Evidence from field experiments. Amer. Natur. 122:661-.:._96.
Cooley, J. H., and F. B. Golley, eds. 1984. Trends in Ecological Research for the 1980s. Plenum Press, New York and London.
DeAngelis, D. L., W. M. Post, and G. Sugihara, eds. 1983. Current Trends in Food web Theory. ORNL-5983. Oak Ridge National Laboratory, Oak Ridge, Tenn. ~
Diamond, J. M., and T. J. Case, eds. 1986. Community Ecology. Harper and Row, New York.
Diamond, J. M., and R. M. May. 1981. Island biogeography and the design of natural reserves. In May (1981), pp. 228-52.
Elton, C. 1927. Animal Ecology. (New impression with additional notes, 1935.) Macmillan, New York.
Gallopin, G. C. 1972. Structural properties of food webs. In B. C. Patten, ed., Systems Analysis and Simulation in Ecology, vol. 2, pp. 241-82. Academic Press, New York.
Hairston, N. G., F. E. Smith, and L. B. Slobodkin. 1960. Community structure, population control, and competition. Amer. Natur. 94:421-25.
Hazen, W. E., ed. 1964. Readings in Population and Community Ecology. Saunders, Philadelphia.
Hutchinson, G. E. 1959. Homage to Santa Rosalia, or why are there so many kinds of animals? Amer. Natur. 93:145-59.
FOOD WEBS AND COMMUNITY STRUCTURE 201
Kikkawa, J., and D. J. Anderson, eds. 1986. Community Ecology: Pattern and Process. Blackwell Scientific, Melbourne and Oxford.
Lindemann, R. L. 194 2. The trophic-dynamic aspect of ecology. Ecology 23:399-418.
Lotka, A. J. 1925. Elements of Physical Biology. Baltimore: Williams and Wilkins, Baltimore. (Reprinted 1956, Elements of Mathematical Biology. Dover, New York.)
MacArthur, R. H., and E. 0. Wilson. 1967. The Theory (>f leland Riogengraphy. Princeton University Press, Princeton, N.J.
Margalef, R. 1984. Simple facts about life and environment not to forget in preparing schoolbooks for our grandchildren. In Cooley and Golley (1984), pp. 299-320.
May, R. M. 1973. Stability and Complexity in Model Ecosystems. Princeton University Press, Princeton, N.J.
May, R. M., ed. 1981. Theoretical Ecology: Principles and Applications, 2d ed. Sinauer, Sunderland, Mass.
May, R. M., and D. I. Rubenstein. 1985. Reproductive strategies. In C. R. Austin, and · R. V. Short, eds., Reproduction in Mammals, Book 4: Reproductive Fitness, 2d ed. Cambridge University Press, Cambridge, England.
Menge, B. A., and J. P. Sutherland. 1976. Species diversity gradient~: Synthesis of the roles of predation, competition, and temporal heterogenetty. Amer. Natur. 110:351-69.
Mithen, S. J., and J. H. Lawton. 1986. Food-web models that generate constant predator-prey ratios. Oecologia 69:542-50.
National Research Council, Commission of Life Sciences, Committee on the Applications of Ecological Theory to Environmental Problems. 1986. Ecological Knowledge and Environmental Problem-Solving. National Academy Press, Washington, D.C.
Newman, C. M., and J. E. Cohen. 1986. A stochastic theory of community food webs. 1v: Theory of food chain lengths in large webs. Proc. Roy. Soc. Lond. (B) 228:355-77.
Niering, W. A. 1963. Terrestrial ecology ofKapingamarangi Atoll, Caroline Islands. Ecol. Monogr. 33:131-60.
Paine, R. T. 1980. Food webs: Linkage, interaction strength and community infra~tructure. f. Anim. Ecol. 49:667-85.
Peters, R. H. 1983. The Ecological Implications of Body Size. Cambridge University Press, Cambridge, England.
Peters, R. H., and J. V. Raelson. 1984. Relations between individual size and mammalian population density. Amer. Natur. 124:498-517.
Peterson, R. 0., R. E. Page, and K. M. Dodge. 1984. Wolves, moose, and the allometry of population cycles. Science 224:1350-52.
Pimm, S. L. 1982. Food webs. Chapman and Hall, London.

202 Joel E. Cohen
Pimm, S. L. 1984. The complexity and stability of ecosystems. Nature 307:321-26.
Pimm, S. L. In press. The geometry of niches. In A. Hastings, ed., Community Ecology: The Mathematical Theory. Lecture Notes in Biomathematics. SpringerVerlag, New York.
Pimm, S. L., and R. L. Kitching. 1986. The determinants of food chain lengths. Oikos, special issue on trophic exploitation.
Pimm, S. L., and L. H. Lawton. 1977. The number of trophic levels in ecological communities. Nature 268:329-31.
Remmert, H. 1984. And now? Ecosystem research! In Cooley and Golley (1984), pp. 179-91.
Schoener, T. W. 1976. The species-area relation within archipelagos: Models and evidence from island land birds. Proceedings of the 16th International Ornithological Congress (Canberra), pp. 629-42.
Schoener, T. W. 1982. The controversy over interspecific competition. Amer. Sci. 70:586-95.
Schoener, T. W. 1983. Field experiments on interspecific competition. Amer. Natur. 122:240-85.
Schoener, T. W. 1985. Some comments on Connell's and my reviews of field experiments on interspecific competition. Amer. Natur. 125:730-40.
Schoener, T. W. 1986. Patterns in terrestrial vertebrate versus arthropod _communities: Do systematic differences in regularity exist? In Diamond and Case (1986), pp. 556-86.
Sugihara, G. 1982. Niche hierarchy: Structure, organization, and assembly in natural communities. Ph.D. dissertation, Princeton University, Princeton, N.J.
Sugihara, G. 1983. Holes in niche space: A derived assembly rule and its relation to, intervality. In DeAngelis, Post, and Sugihara (1983), pp. 25-35. '
Sugihara, G. 1984. Graph theory, homology, and food webs. Proc. Symp. Appl. Math. 30:83-101. American Mathematical Society, Providence.
Tilman, D. 1986. A consumer-resource approach to community structure. Amer. Zoo/. 26:5-22.
Vezina, A. F. 1985. Empirical relationships between predator and prey size among terrestrial vertebrate predators. Oecologia 67:555-65.
Wiegert, R. G., ed. 1976. Ecological Energetics. Benchmark Papers in Ecology, 4. Dowden, Hutchinson and Ross, Stroudsburg, Penn.