chapter 12 - sunlight and plant production · mechanisms to optimise their use of sunlight. many...
TRANSCRIPT
Chapter 12 - Sunlight and plant production
http://plantsinaction.science.uq.edu.au/book/export/html/255[8/09/2017 2:59:23 PM]
Chapter 12 - Sunlight and plant productionChapter editor: Dennis H. Greer
School of Agricultural and Wine Sciences, Charles Sturt University, Australia
This Chapter is updated from the original chapter (1st edition) from Sharon Robinson, Jenny Watling,Dennis Bittisnich, Shu Fukai, Chris Beadle, Mike Clearwater and Paul Kriedemann.
12.0-Ch-Fig-12.0-NoNum.png
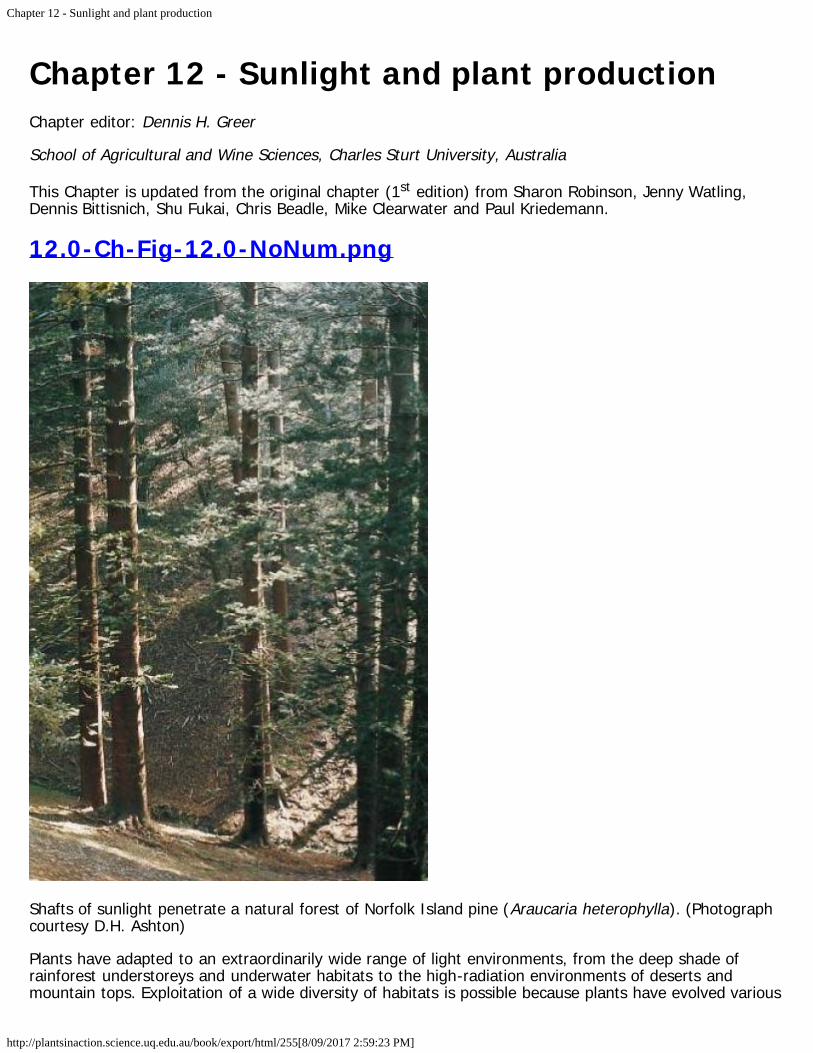
Shafts of sunlight penetrate a natural forest of Norfolk Island pine (Araucaria heterophylla). (Photographcourtesy D.H. Ashton)
Plants have adapted to an extraordinarily wide range of light environments, from the deep shade ofrainforest understoreys and underwater habitats to the high-radiation environments of deserts andmountain tops. Exploitation of a wide diversity of habitats is possible because plants have evolved various
Chapter 12 - Sunlight and plant production
http://plantsinaction.science.uq.edu.au/book/export/html/255[8/09/2017 2:59:23 PM]
mechanisms to optimise their use of sunlight. Many plants also exhibit great plasticity in their response tochanges in light availability within a particular habitat. This potential for acclimation enables plants toexploit more variable environments than plants with a narrower range of responses to light.
Terrestrial ecosystems are both sustained and regulated by sunlight: sustained in massive ways byphotosynthetically active radiation, but regulated in subtle ways by other wavelengths. Wavelengths mosteffective for photosynthesis occupy a band between about 380 and 720 nm. A wider band from about350 to 800 nm spans the action spectra for other crucial responses in plant growth and reproductivedevelopment that are also light regulated. These include seed germination, tropisms, morphogenesis,pigmentation, and photoperiodic responses such as floral initiation (topics covered in Chapter 8 -environmental effects on plant development).
The outcomes of these two light-dependent categories differ by many orders of magnitude in terms ofenergy flow within a plant community. In one case, a flow of radiant energy is converted into chemicalenergy and stored as biomass; in the other, miniscule levels of radiant energy trigger shifts in geneexpression and consequent developmental responses. Nevertheless, each category is mediated bypigment systems that transduce solar energy into highly ordered chemical forms: biosynthetic systems inphotosynthesis, triggering systems in photo-morphogenesis (light-mediated development, where plantgrowth patterns respond to the light spectrum).
12.0-Ch-Fig-12.1.png
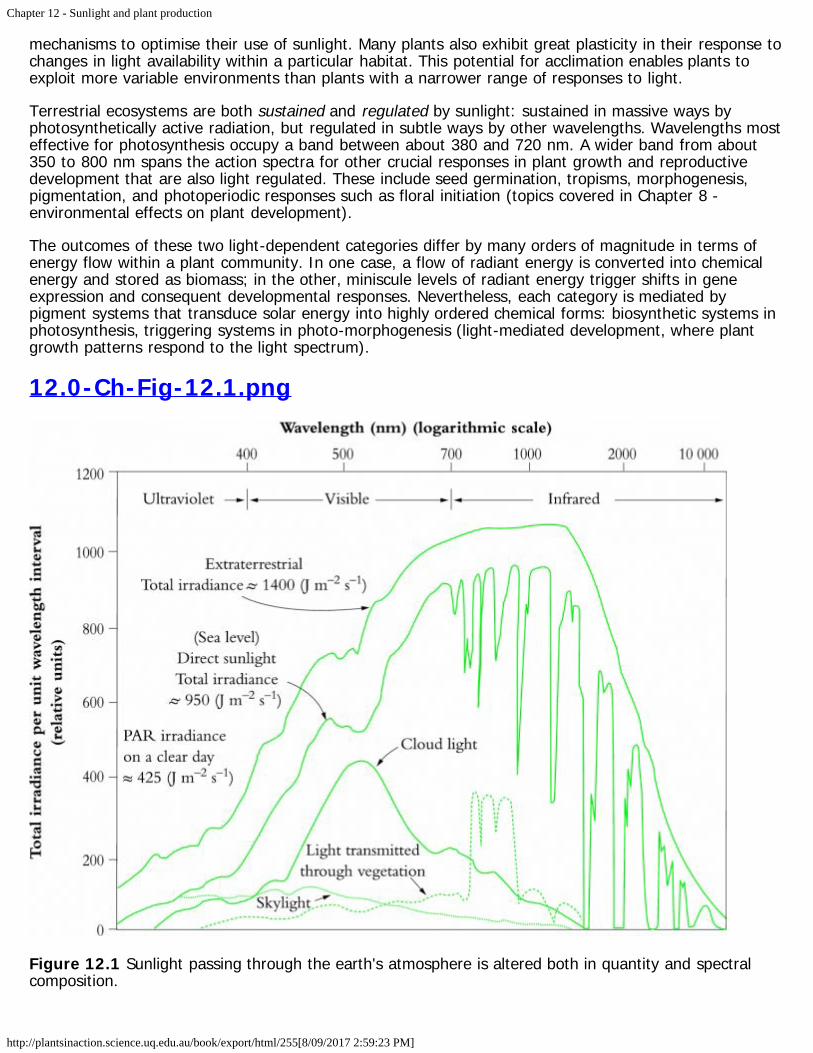
Figure 12.1 Sunlight passing through the earth's atmosphere is altered both in quantity and spectralcomposition.
Chapter 12 - Sunlight and plant production
http://plantsinaction.science.uq.edu.au/book/export/html/255[8/09/2017 2:59:23 PM]
The earth’s atmosphere attenuates solar radiation in highly selective ways (Figure 12.1). Substantialamounts of infrared energy (between about 850 and 1300 nm) are absorbed by CO2, ozone andespecially by water vapour, while ozone is principally responsible for a cut-off in ultraviolet radiationbelow about 300 nm. Attenuation of discrete bands of infrared radiation by water vapour is especiallynoticeable (right side of figure), while absorption of ultraviolet by stratospheric ozone is also of specialsignificance for terrestrial organisms. Cloud light is especially rich in visible wavelengths with a peakaround 500 µm. Our atmosphere thus represents a ‘window’ through which visible wavelengths pour ontothe earth’s surface, and terrestrial life forms have evolved with attributes that are a direct consequence ofthis spectral composition.
Selective filtering of wavelengths either side of the visible spectrum is crucial. Ultraviolet radiation iscomprehensively absorbed by biological ingredients, especially proteins, RNA and DNA and pigments.Because energy per quantum increases with the decrease in wavelength, ultraviolet radiation imposes aheavy load of energy on biological components with attendant disruption. Similarly, wavelengths beyondthe visible spectrum, though less energetic, are still damaging because tissue water absorbs infraredradiation. All life processes operate within an aqueous milieu, so that the absorption properties of watermolecules would put cellular function at risk if sunlight was not also attenuated with respect to infraredradiation by the atmosphere.
Between these two extremes stands the visible spectrum, and it is no coincidence that all manner ofbiological systems have evolved to make effective use of this narrow band of solar radiation. Vegetationshows strong attenuation of visible wavelengths that drive photosynthesis, but transmit near-infraredradiation that would otherwise heat leaves. Vascular plants are a case in point, where canopy, leaf andchloroplasts have all adapted to the light climate with features that optimise their use of sunlight. Theseinclude mechanisms to deal with excess radiation.
Photosynthetic efficiency in low light confers a selective advantage on shade-adapted plants, but alsorenders them especially vulnerable to full sun. Accordingly, such species have evolved remarkablefeatures for photoprotection. Their acclimation to sun and shade, together with properties of sun-lovingplants, thus reveal an extraordinary plasticity in the photosynthetic apparatus of vascular plants (Section12.1). Even increased UV-B radiation, commonly associated with global change, and the so called ‘ozonehole’ over Antarctica, elicits responses that offer photoprotection to plants (Section 12.6).
Aside from the biological hazards, solar radiation obviously sustains global photosynthesis, and closequantitative relationships exist between energy absorption and biomass production. Such relationshipsare especially well defined for managed communities, with cropping, plantation forests and horticultureproviding clear examples (Sections 12.2, 12.3, 12.4). Canopy architecture is a major determinant ofsunlight interception, and hence production of biomass. Canopy pruning in horticulture are examples ofenhanced productivity through increased interception of light. In such cases, light-dependent regulationof plant development assumes prominence because tree and vine canopies are shaped for both overallinterception of light as well as maximum fruitfulness.
A note on units: Visible wavelengths of sunlight can be represented as either a quantum flux or a radiantenergy flux. Quantum flux is regarded here as synonymous with 'photon irradiance' (Q) and has units ofµmol quanta m-2 s-1 ('µmol quanta' rather than 'µmol photons' because the quantum energy derived fromphotons drives photosynthesis). For the sake of making a clear distinction from quantum flux, radiantenergy flux is simplified to 'irradiance', and for present purposes, irradiance coincides withphotosynthetically active radiation (PAR). Irradiance is then expressed as joules (J) per square meter perunit time. Depending on the application, time can span seconds, days or years, and is then coupled witheither joules, megajoules (MJ) or gigajoules (GJ).
12.1 - Photosynthesis in sun and shadeIn low light, plants need to absorb maximum light for photosynthesis if they are to survive. In high lightthe problem is reversed. Plants need to maximise their capacity for utilising their abundant light energy.
Chapter 12 - Sunlight and plant production
http://plantsinaction.science.uq.edu.au/book/export/html/255[8/09/2017 2:59:23 PM]
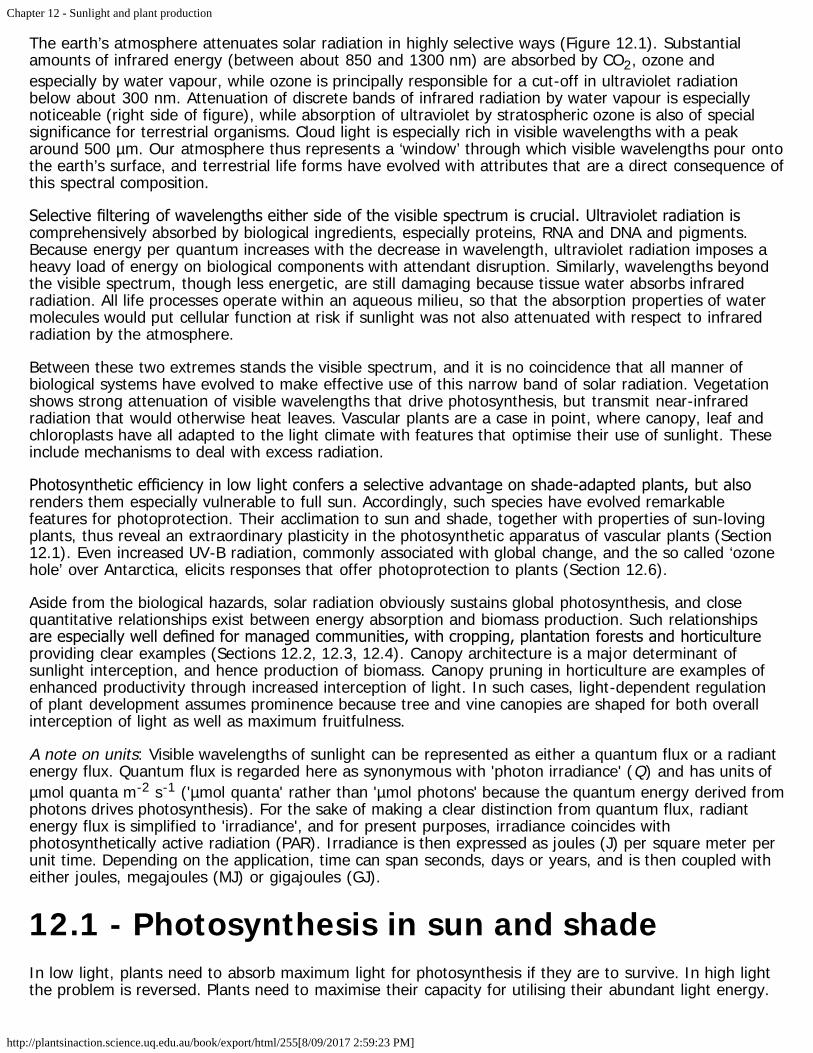
At the same time, the plants have to deal with excess sunlight when their photosynthetic capacity isexceeded. As a consequence of such unrelenting selection pressures, plants have evolved a variety offeatures that optimise light interception, absorption and processing, according to the light environment inwhich they had evolved and adapted (Figure 12.2). Adaptation implies a genetically determined capabilityto adjust attributes, i.e., acclimate to either sun or shade. Such acclimation calls for adjustment in one ormore attributes concerned with interception and utilisation of sunlight. Common features of either sun orshade plants are outlined below, and the advantage to plants growing in different light environments isdiscussed. Field applications are illustrated with examples of sun/shade acclimation and sunfleckutilisation in rainforest plants.
12.1-Ch-Fig-12.2.png
Figure 12.2 A comparison of photosynthetic structure and function in sun and shade plants. Majorcharacteristics are described for cells, leaves and whole plants. (Original drawing courtesy S.A. Robinson)
Initial steps of photosynthesis involve interception and absorption of photons by photosynthetic organs;subsequent steps are involved with utilisation or dissipation of the absorbed quantum energy.
Chapter 12 - Sunlight and plant production
http://plantsinaction.science.uq.edu.au/book/export/html/255[8/09/2017 2:59:23 PM]
Interception of light varies according to size, angle, orientation and surface features of the photosyntheticorgan(s) and is also influenced by the arrangement of photosynthetic tissue within those organs (Figure12.2).
12.1.1 - Light interception and utilisation12.1-Ch-Fig-12.3.png
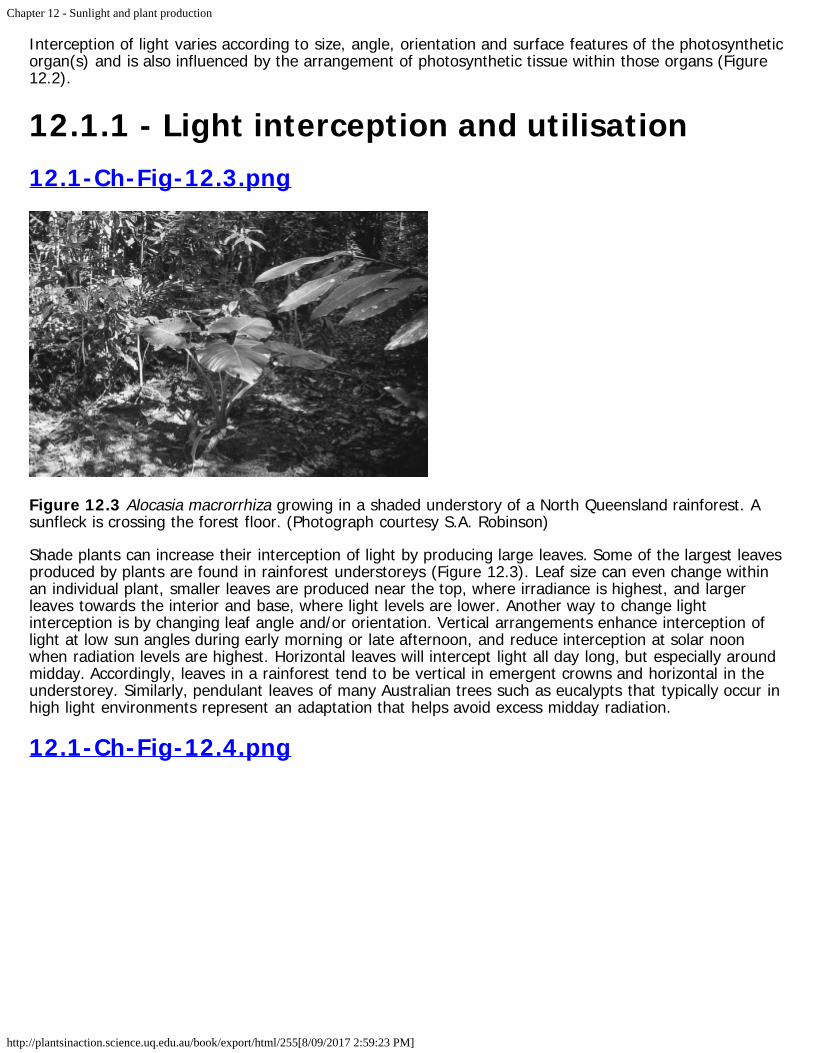
Figure 12.3 Alocasia macrorrhiza growing in a shaded understory of a North Queensland rainforest. Asunfleck is crossing the forest floor. (Photograph courtesy S.A. Robinson)
Shade plants can increase their interception of light by producing large leaves. Some of the largest leavesproduced by plants are found in rainforest understoreys (Figure 12.3). Leaf size can even change withinan individual plant, smaller leaves are produced near the top, where irradiance is highest, and largerleaves towards the interior and base, where light levels are lower. Another way to change lightinterception is by changing leaf angle and/or orientation. Vertical arrangements enhance interception oflight at low sun angles during early morning or late afternoon, and reduce interception at solar noonwhen radiation levels are highest. Horizontal leaves will intercept light all day long, but especially aroundmidday. Accordingly, leaves in a rainforest tend to be vertical in emergent crowns and horizontal in theunderstorey. Similarly, pendulant leaves of many Australian trees such as eucalypts that typically occur inhigh light environments represent an adaptation that helps avoid excess midday radiation.
12.1-Ch-Fig-12.4.png
Chapter 12 - Sunlight and plant production
http://plantsinaction.science.uq.edu.au/book/export/html/255[8/09/2017 2:59:23 PM]
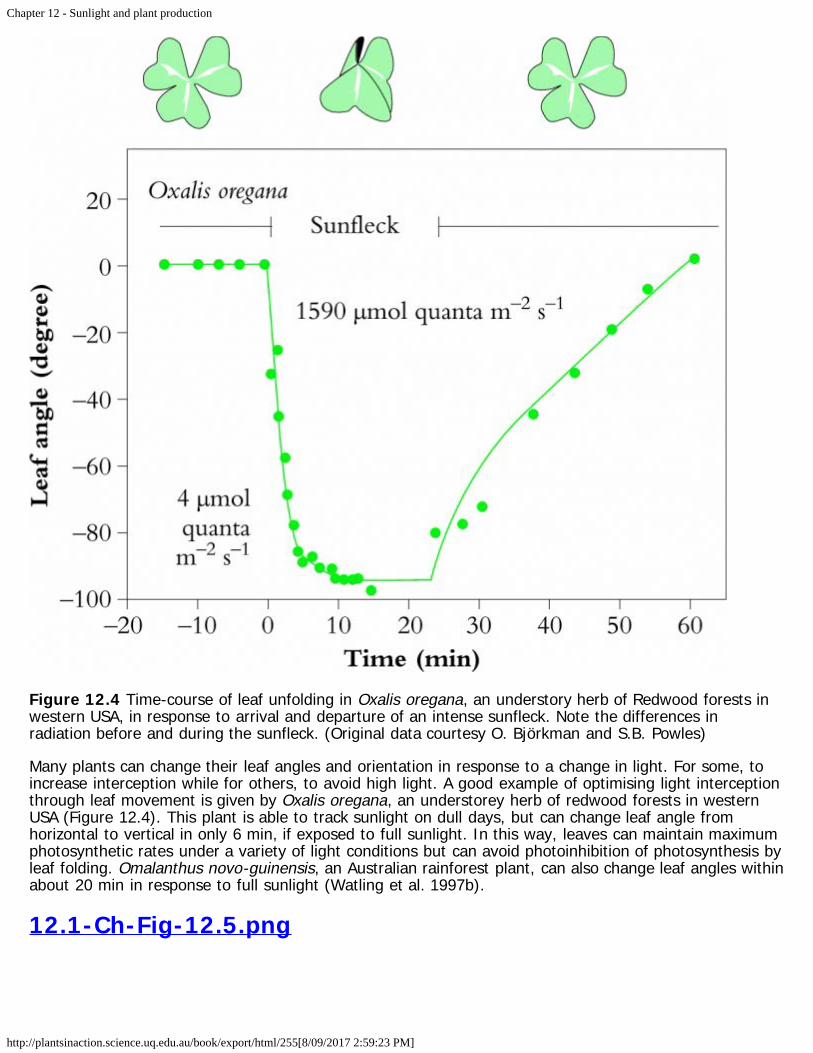
Figure 12.4 Time-course of leaf unfolding in Oxalis oregana, an understory herb of Redwood forests inwestern USA, in response to arrival and departure of an intense sunfleck. Note the differences inradiation before and during the sunfleck. (Original data courtesy O. Björkman and S.B. Powles)
Many plants can change their leaf angles and orientation in response to a change in light. For some, toincrease interception while for others, to avoid high light. A good example of optimising light interceptionthrough leaf movement is given by Oxalis oregana, an understorey herb of redwood forests in westernUSA (Figure 12.4). This plant is able to track sunlight on dull days, but can change leaf angle fromhorizontal to vertical in only 6 min, if exposed to full sunlight. In this way, leaves can maintain maximumphotosynthetic rates under a variety of light conditions but can avoid photoinhibition of photosynthesis byleaf folding. Omalanthus novo-guinensis, an Australian rainforest plant, can also change leaf angles withinabout 20 min in response to full sunlight (Watling et al. 1997b).
12.1-Ch-Fig-12.5.png

Chapter 12 - Sunlight and plant production
http://plantsinaction.science.uq.edu.au/book/export/html/255[8/09/2017 2:59:23 PM]
Figure 12.5 Cotyledon orbiculata grown for 20 weeks under high light (1,300 µmol quanta m-2 s-1, left)or low light (350 µmol quanta m-2 s-1, right) in controlled growth chambers. Scale bar = 10 cm. (S.A.Robinson et al., Bot Acta 106: 307-312, 1993; photograph courtesy S.A. Robinson)
Another way of reducing light capture is a change in leaf-surface properties. Many plants in high lightenvironments have a high reflectance of their leaves from a coat of hairs or wax or even salt crystals.Cotyledon orbiculata, a crassulacean acid metabolism (CAM) plant from southern Africa, produces a waxcoating on the leaves. Plants grown at high light produce copious quantities of white wax which reflects60% of incident light whereas plants grown in low light produce very little wax and leaf reflectance dropsto 9% (Figure 12.5). Young eucalypt leaves also produce wax, while leaves of Celmisia longifolia, thesnow daisy of the Australian Alps, are covered in a thick layer of silvery fibres. In these instances, plantsare avoiding high light by creating their own shade, but does leaf anatomy adjust to environments wherelight is limiting?
Epidermal cells in some rainforest shade-adapted species are shaped to enhance light capture by actingas a lens. The optical properties of such cells focus incident sunlight into the layer of photosynthetictissue just below the epidermis, reducing light lost due to reflectance and transmittance.
Light interception can also be regulated at a tissue and organelle level. Photosynthetic tissue can beconcentrated equally on both sides of a leaf (isobilateral) to maximise light absorption from either side, orpreferentially on one side (dorsiventral) as is common in species where leaves are predominantlyhorizontal.
Chloroplast density and location within leaves is also sensitive to the light climate, and energy capturevaries accordingly. Alignment along vertical cell walls will reduce overall absorption of incident light, andin Oxalis leaves absorbance can be reduced 20% when chloroplasts align less to the horizontal and moreto the vertical walls of mesophyll cells.
Once sunlight has been intercepted by an assimilatory organ, photon absorption then depends on theextent and nature of light-absorbing pigments in the photosynthetic tissues. In terrestrial plants, themajor light-absorbing pigments are chlorophylls a and b plus a range of carotenoids which can act asaccessory pigments. Compared with high-light plants, plants grown in low light tend to allocate relativelymore resources to their light-harvesting pigments and the associated proteins than to the enzymeRubisco and other soluble proteins involved in CO2 fixation. This shift in allocation of nitrogen-basedresources can be accompanied by marked changes in leaf anatomy, especially depth of mesophyll tissue(see Case study 12.1) and reflects a need for increased efficiency of light absorption when sunlight islimited.
Chapter 12 - Sunlight and plant production
http://plantsinaction.science.uq.edu.au/book/export/html/255[8/09/2017 2:59:23 PM]
12.1-Ch-Fig-12.6.png
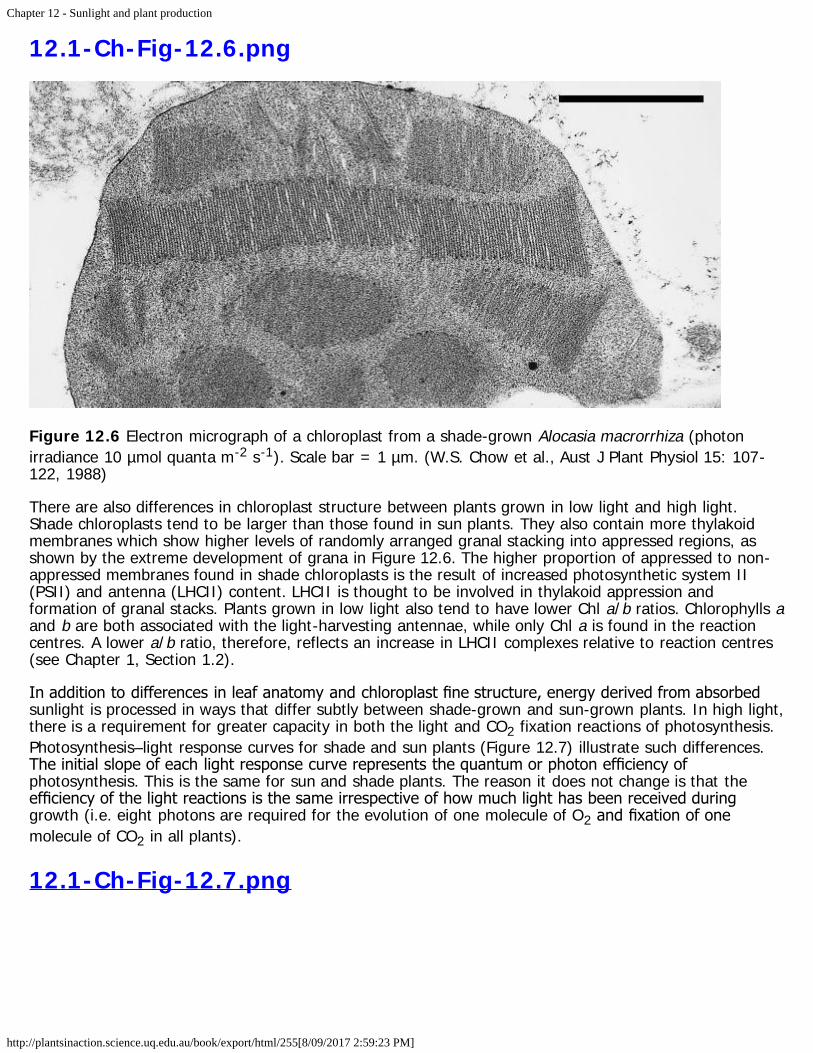
Figure 12.6 Electron micrograph of a chloroplast from a shade-grown Alocasia macrorrhiza (photonirradiance 10 µmol quanta m-2 s-1). Scale bar = 1 µm. (W.S. Chow et al., Aust J Plant Physiol 15: 107-122, 1988)
There are also differences in chloroplast structure between plants grown in low light and high light.Shade chloroplasts tend to be larger than those found in sun plants. They also contain more thylakoidmembranes which show higher levels of randomly arranged granal stacking into appressed regions, asshown by the extreme development of grana in Figure 12.6. The higher proportion of appressed to non-appressed membranes found in shade chloroplasts is the result of increased photosynthetic system II(PSII) and antenna (LHCII) content. LHCII is thought to be involved in thylakoid appression andformation of granal stacks. Plants grown in low light also tend to have lower Chl a/b ratios. Chlorophylls aand b are both associated with the light-harvesting antennae, while only Chl a is found in the reactioncentres. A lower a/b ratio, therefore, reflects an increase in LHCII complexes relative to reaction centres(see Chapter 1, Section 1.2).
In addition to differences in leaf anatomy and chloroplast fine structure, energy derived from absorbedsunlight is processed in ways that differ subtly between shade-grown and sun-grown plants. In high light,there is a requirement for greater capacity in both the light and CO2 fixation reactions of photosynthesis.Photosynthesis–light response curves for shade and sun plants (Figure 12.7) illustrate such differences.The initial slope of each light response curve represents the quantum or photon efficiency ofphotosynthesis. This is the same for sun and shade plants. The reason it does not change is that theefficiency of the light reactions is the same irrespective of how much light has been received duringgrowth (i.e. eight photons are required for the evolution of one molecule of O2 and fixation of onemolecule of CO2 in all plants).
12.1-Ch-Fig-12.7.png

Chapter 12 - Sunlight and plant production
http://plantsinaction.science.uq.edu.au/book/export/html/255[8/09/2017 2:59:23 PM]
Figure 12.7 Photosynthesis-light response curve for typical shade and sun plants, showing relationshipsbetween photosynthetic rate and absorbed light (expressed as a photon irradiance). Dashed lines areextrapolations of initial linear slopes where photosynthesis is light limited, and represent quantum yield(moles of O2 evolved per mole quanta absorbed). (Original data courtesy S.A. Robinson)
However, sun plants tend to have a greater capacity for photosynthetic electron transport (greaterabundance of transport components such as Cyt b559, Cyt b563, Cyt f and plastoquinone). They also havea greater capacity for ATP synthesis per unit of chlorophyll compared with shade plants. Taken together,these capacities of sun plants allow more sunlight to be processed into ATP and NADPH for use in CO2assimilation and other synthetic events. Such capacity is also matched by a greater investment inenzymes of the photosynthetic carbon reduction (PCR) cycle, resulting in a higher light-saturation pointand a higher maximum rate of photosynthesis (Pmax) for sun plants (Figure 12.7). As a furtherdistinction, sun leaves tend to be thicker and have more cell layers. They also have higher stomatalconductances to facilitate rapid uptake of CO2.
A higher photosynthetic capacity in sun plants does, however, incur some costs. The sun leaves tend tohave higher respiration rates which increases the light-compensation point relative to shade plants(Figure 12.7). Higher respiration rates probably result from (1) increased carbohydrate processing in highlight, (2) increased costs of constructing sun leaves and (3) a higher cost of maintaining sun leaves.Further details on maintenance costs are given in Chapter 5, Section 6.5.
Greater transpiration is a further cost of the higher photosynthetic capacity as a result of higher stomatalconductance. Sun plants often respond to the greater transpiration by increasing their root : shoot ratios.Under conditions where water is limiting, however, stomatal conductance may be reduced, sacrificingphotosynthesis in favour of slower transpiration.

Chapter 12 - Sunlight and plant production
http://plantsinaction.science.uq.edu.au/book/export/html/255[8/09/2017 2:59:23 PM]
12.1.2 - Photoinhibition and photoprotectionIn the light-response curves for photosynthesis (Figure 12.7 above), photosynthesis is regarded as lightlimited in the initial linear region of the curve. However, at higher photon irradiances once the light-saturation point (that is, the maximum rate of photosynthesis) has been reached, further increases inlight will exceed the energy-utilising capacity of that photosynthesising leaf. Refer to the dashed lines inFigure 12.7 which represent a continuation of the initial rate of photosynthesis (quantum yield ofphotosynthesis) and demonstrates the actual light absorption. The extent to which this absorbed light isnot ‘gainfully employed’ for photosynthesis is set by Pmax (the light-saturated rate of photosynthesis innormal air). At low light (< 100 µmol quanta m–2 s–1), both sun and shade leaves use more than 80% ofthe absorbed light for photosynthesis. However, once Pmax has been reached, all additional absorbed lightis in excess of that which can be used in photosynthesis.
Since shade plants have a lower Pmax than sun plants, they experience more excess light at a givenphoton irradiance above saturation. Additional stresses such as drought, nutrient limitation ortemperature extremes can also lead to a reduction in Pmax and thus increase the probability of plantsbeing exposed to excess light. However, even the most hardy sun plant will reach Pmax at less than fullsunlight (incident beam normal to leaf surface). At that level (say, 1000 µmol quanta m–2 s–1),approximately 25% of absorbed energy is used to drive photosynthesis, but at full sunlight (c. 2000 µmolquanta m–2 s–1) as little as 10% is used (Long et al. 1994). Individual leaves on plants growing in fullsun commonly experience such excess light intensities. This is potentially damaging, and plants adaptedto full sunlight have evolved a number of mechanisms for either avoiding excess light or for dissipatingthe excess absorbed energy.
12.1-Ch-Fig-12.8.png
Chapter 12 - Sunlight and plant production
http://plantsinaction.science.uq.edu.au/book/export/html/255[8/09/2017 2:59:23 PM]
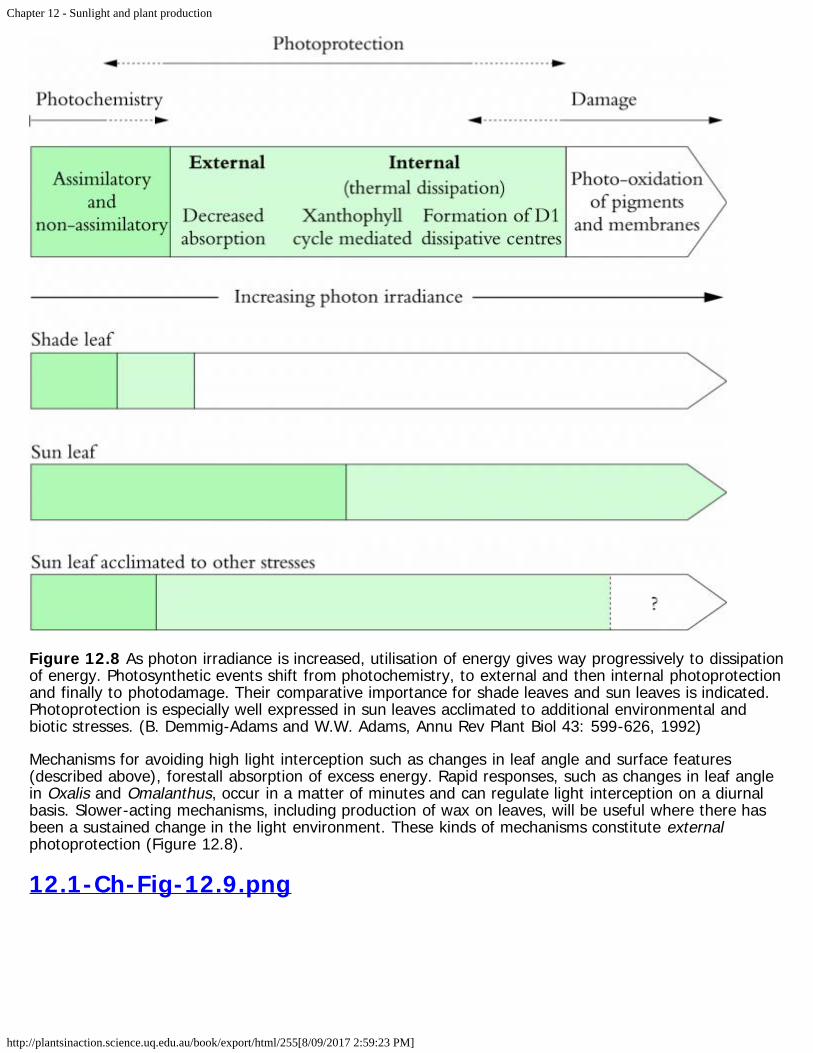
Figure 12.8 As photon irradiance is increased, utilisation of energy gives way progressively to dissipationof energy. Photosynthetic events shift from photochemistry, to external and then internal photoprotectionand finally to photodamage. Their comparative importance for shade leaves and sun leaves is indicated.Photoprotection is especially well expressed in sun leaves acclimated to additional environmental andbiotic stresses. (B. Demmig-Adams and W.W. Adams, Annu Rev Plant Biol 43: 599-626, 1992)
Mechanisms for avoiding high light interception such as changes in leaf angle and surface features(described above), forestall absorption of excess energy. Rapid responses, such as changes in leaf anglein Oxalis and Omalanthus, occur in a matter of minutes and can regulate light interception on a diurnalbasis. Slower-acting mechanisms, including production of wax on leaves, will be useful where there hasbeen a sustained change in the light environment. These kinds of mechanisms constitute externalphotoprotection (Figure 12.8).
12.1-Ch-Fig-12.9.png

Chapter 12 - Sunlight and plant production
http://plantsinaction.science.uq.edu.au/book/export/html/255[8/09/2017 2:59:23 PM]
Figure 12.9 Photosynthesis and photoinhibition in sun and shade leaves. (Original diagram courtesy C.B.Osmond)
Absorption of excess sunlight as outlined above often leads to photoinhibition of photosynthesis, that is,defined here as a light-dependent decrease in the photon yield of photosynthesis (Figure 12.9).Photoinhibition is one of the most important regulatory mechanisms in photosynthesis, and results from aseries of internal photoprotective mechanisms which act to reduce the amount of energy reaching thephotochemical reaction centres of photosystem II (PSII). One immediate consequence of reducing lightenergy to PSII is a reduction in photon yield (expressed in terms of absorbed light).
Shade plants have an even greater need to dissipate excess light interception because they absorb morelight (more chlorophyll per unit leaf mass), but need less light to saturate photosynthesis. Prolonged

Chapter 12 - Sunlight and plant production
http://plantsinaction.science.uq.edu.au/book/export/html/255[8/09/2017 2:59:23 PM]
exposure of plants to excess light induces photoprotective processes that reduces the photon yield ofphotosynthesis, but Pmax remains unchanged (curve A). However, further exposures to excess light willresult in both photon yield and Pmax being reduced (curve B). The photosynthetic rate is then reduced atall light levels as a consequence of the photoprotection.
Photoprotection is normally sufficient to cope with light absorbed by leaves; the more extremephotodamage only occurs when the capacity for photoprotection is exhausted. Photodamage ismanifested as a decline in both photon yield and Pmax, and recovers very slowly (hours to days), whereasphotoinhibition and photoprotection recovers much faster (minutes to hours). Severe photodamageresults in bleaching of pigments and damage to membranes (photo-oxidation) and may lead to tissuedeath.
12.1-Ch-Fig-12.10.png
Figure 12.10 Absorption of blue or red light (wavebands corresponding to leaf absorption maxima) leadsto excitation of chlorophyll from its ground state. Arrow thickness above indicates comparative importanceof each process for energy utilisation.
Consider the alternative fates of light energy absorbed by a leaf and their relevance to photoprotection,photoinhibition and photodamage (Figure 12.10). Although blue light has higher energy and causesexcitation to a higher excited state, this energy is quickly lost as heat, and chlorophyll molecules drop toa lower excited state. Utilisation of energy from excited chlorophyll molecules results in either assimilatoryor non-assimilatory photochemistry, thermal dissipation or release of light of a longer wavelength(fluorescence). The proportion of absorbed energy consumed by these different processes dictates theircomparative significance, and in order of importance as protective devices they are:

Chapter 12 - Sunlight and plant production
http://plantsinaction.science.uq.edu.au/book/export/html/255[8/09/2017 2:59:23 PM]
1. Assimilatory photochemistry, leading to fixation of CO2 into stable chemical products;2. Non-assimilatory photochemistry, that is, energy consumption by metabolic processes that do not
result in fixation of CO2 into stable chemical products, including photorespiration, nitrate reductionand the Mehler reaction. All consume energy but there is no net gain in carbon as a result;
3. Conversion of light energy into heat (thermal dissipation);4. Re-emission of photons as fluorescence. Emission of in vivo Chl a fluorescence is revealed
dramatically during measurements (Chapter 1, Section 1.2.5). Such emission still accounts for only1% of energy derived from absorbed light.
Most of the NADPH and ATP formed during photosynthetic energy transduction is stored as stablephotosynthetic products. Some is consumed in photorespiration and nitrate reduction. Because these non-assimilatory processes also utilise NADPH and ATP, they help reduce the need for photoprotection. TheMehler reaction, in which electrons flow to O2 via photosynthetic system I (PSI) (Chapter 1, Figure 1.10),still supports electron flow and thus might also reduce a need for photoprotection.
However, if photochemical capacity is exceeded by incoming energy, a plant will engage photoprotectivemechanisms which increase the amount of energy dissipated as heat. This non-photochemical conversionof light energy is thought to occur in the PSII antennae and involves a group of pigments known asxanthophylls and includes violaxanthin, antheraxanthin and zeaxanthin (Figure 12.11). These are aspecial group of carotenoid pigments which undergo interconversion in response to excess light. Energy isdissipated in the process. In low light, violaxanthin predominates, but when light is in excess, conversionto zeaxanthin via antheraxanthin occurs. This conversion requires a low pH, ascorbate and NADPH. Suchconditions exist in the lumen of chloroplasts in high light. Zeaxanthin, and possibly antheraxanthin,provide photoprotective thermal dissipation of the excess light energy. When light levels are no longerexcessive, zeaxanthin slowly converts back to violaxanthin via antheraxanthin (Figure 12.11). Total poolsizes of the xanthophyll pigments increase with increasing exposure to excess light. Sun plants can havethree- to four-fold larger pools of violaxanthin, antheraxanthin and zeaxanthin than shade plants and thepresence of other stresses can also result in increases in pool size.
12.1-Ch-Fig-12.11.png
Figure 12.11 The xanthophyll cycle summarised here contributes to dissipation of excess light energy,

Chapter 12 - Sunlight and plant production
http://plantsinaction.science.uq.edu.au/book/export/html/255[8/09/2017 2:59:23 PM]
and involves three pigments, violaxanthin (V), antheraxanthin (A) and zeaxanthin (Z). (Original drawingcourtesy S.A. Robinson)
Internal differences between sun and shade leaves with respect to energy dissipation are also apparent inthe different patterns of attenuation of light through mesophyll tissues, such as in succulent CAM plantssuch as Cotyledon orbiculata. There, xanthophylls are mostly found in outermost cell layers where thelight environment is strongest. If the reflective wax coating is intact, no internal photoprotection isrequired at the growth irradiance and there is no zeaxanthin formed. However, if the surface wax(external photo-protection) is removed by hand, internal photoprotection is then needed and zeaxanthinappears in the outermost layer (Figure 12.12).
12.1-Ch-Fig-12.12.png

Chapter 12 - Sunlight and plant production
http://plantsinaction.science.uq.edu.au/book/export/html/255[8/09/2017 2:59:23 PM]
Figure 12.12 External and internal photoprotection in thick leaves of the succulent CAM plant Cotyledonorbiculata. Removal of protective wax from upper surfaces stimulates synthesis of zeaxanthin. (S.A.Robinson and C.B. Osmond, Aust J Plant Physiol 21: 497-506, 1994)
Overall activity of the xanthophyll cycle varies with mesophyll irradiance, while the concentration ofparticular components also varies according to tissue depth. Changes in concentration of the variouscomponents of the xanthophyll cycle are shown here for successive (1 mm) layers in thick leaves of C.orbiculata, with and without their wax coating. In waxed leaves at the end of a dark period (top figure,Figure 12.12) xanthophyll cycle pigments are represented mainly by violaxanthin (V) with a small amountof antheraxanthin (A). After 6 h exposure to high light (middle figure, Figure 12.12) a small amount of

Chapter 12 - Sunlight and plant production
http://plantsinaction.science.uq.edu.au/book/export/html/255[8/09/2017 2:59:23 PM]
violaxanthin is converted to antheraxanthin, but no zeaxanthin (Z) is formed, indicating that the naturalwax coating on these leaves is protecting chloroplasts from excess light. Physical removal of surface wax(brushed leaves in bottom figure, Figure 12.12) results in zeaxanthin production within the uppermostlayer of leaf tissue but not in deeper tissues or lower surfaces. Restriction of this xanthophyll cyclecomponent to the top section confirms that zeaxanthin accumulation is a response to excess light.
12.1.3 - Sun/shade acclimation and rainforestgapsA seed germinating in a rainforest understorey starts life in a low light environment. This will not presentmajor problems to an obligate shade species which cannot tolerate strong sunlight; such species haveadapted to life in an understorey. However, many rainforest species are better described as either shadetolerant (i.e. able to germinate and persist in low light, but requiring higher light to reach maturity) orshade intolerant (unable to germinate or grow in low light). In successional terms, shade tolerance is afeature associated with climax species and shade intolerance with pioneer species.
Shade-tolerant species can persist as seedlings in the understorey, often for years, while still being ableto respond to an increase in light availability when it occurs.
By comparison, shade-intolerant (early-successional) species can only germinate and grow where there isample sunlight, and consequently they tend to occur in wide gaps and on forest edges. Wide gaps arerelatively rare in old-growth rainforests which have been undisturbed by logging or slash and burnagriculture. Shade-intolerant species are unable to maintain a positive carbon balance when growing inlow light. The change from a high light to a low light environment requires a change in allocation of plantresources as described in the quantitative growth chapter (Section 6.2). Shade-intolerant plants areunable to make this change and are burdened with the higher costs of construction and maintenance ofleaves better suited to strong sunlight
Germination
Shade-intolerant species tend to produce numerous small seeds throughout the year which are widelydispersed. Their seeds are also able to remain viable for long periods (years) by going through a periodof dormancy. This is often broken by high temperature or strong direct sunlight with a high ratio of redto far-red irradiance (R:FR ratio decreases with sunlight attenuation through canopies). Suchenvironmental cues for germination are all experienced in wide gaps. Following germination, seedlingsshow rapid growth to maturity, allowing them to become well established in a gap before other slowergrowing species. These characteristics increase the probability of success for shade-intolerant species inthe heterogeneous light environment of a rainforest.
Shade-tolerant species, on the other hand, have evolved a different suite of characteristics. They tend toproduce a few large seeds which are generally not well dispersed, with little or no dormancy. However,the seeds have the ability to germinate in low light and persist in the understorey as seedlings for years.A rarity of gaps and a lack of dormancy found in most shade-tolerant species increases the probability ofestablishing in a low-light understorey environment. In situations like this, the larger seed providesseedlings with a reserve which they can draw upon during early establishment. In rainforests, treeseedlings survival in understorey habitats is positively correlated with seed size, especially in the first fewmonths following germination.
Following establishment in the understorey, seedlings of shade-tolerant species may have to wait a longtime before a gap appears overhead. Many species succumb to attack from herbivores or pathogens ormay be crushed by large animals (including humans!). Those that do survive must be able to acclimateto the new conditions arising on gap formation; their ability to do this will depend on the nature of thenew microclimate and the acclimation potential of each species.

Chapter 12 - Sunlight and plant production
http://plantsinaction.science.uq.edu.au/book/export/html/255[8/09/2017 2:59:23 PM]
Growth response to high light
Emergent trees of tropical rainforests have to endure strong sunlight, and leaves comprising the crownsof such trees will have acclimated to full sun. In young-growth forests, canopy emergents are early-successional fast-growing species that are adapted for fast growth in full sun on large disturbances. Suchspecies represent an initial phase in forest dynamics that might last 10–20 years. By contrast, in old-growth forests, early-successional species have long since completed their life cycles, and will have beenreplaced by later-successional species whose seedlings initially tolerated deep shade on the forest floor,but now endure full sun as canopy emergents. Such remarkable plasticity is an adaptive feature of late-successional species and involves sun/shade acclimation by individual leaves.
The differences in growth rate of early-successional fast-growing species versus later-successional andshade-adapted species is illustrated in Figure 12.13 by two rainforest species that are important in thetimber industry: the sun-loving red cedar (Toona australis) and the shade-adapted tulip oak(Argyrodendron sp.).
12.1-Ch-Fig-12.13.png
Figure 12.13 Growth of (left) Toona australis (sun loving) and right Argyrodendron sp. (shade adapted).Plants are the same age (6 months) and grown in same size pots (15 cm) in high light and high nutrientsupply. (Thompson et al., 1992a; photographs courtesy P.E. Kriedemann)
A detailed study of three rainforest species from North Queensland was conducted by Thompson et al.(1992a, b). The red cedar Toona australis (an early-successional species) and two species of tulip oakArgyrodendron (late-successional species) showed different acclimation potentials when grown under arange of light conditions (Figure 12.14).
When grown under high light, 535 µmol quanta m-2 s-1,which is typical of average canopy radiation in atropical rainforest, T. australis achieved a higher Pmax and light-saturation point than either of the

Chapter 12 - Sunlight and plant production
http://plantsinaction.science.uq.edu.au/book/export/html/255[8/09/2017 2:59:23 PM]
Argyrodendron species. However, T. australis was more sensitive to nutrient levels, being unable toacclimate to the same degree in low-nutrient compared to high-nutrient regimes. Moreover, fast growthin T. australis was greatly promoted by a positive light x nutrient interaction on leaf expansion andphotosynthetic capacity; adaptive features with a clear selective advantage on open sites where soildisturbance liberates nutrients.
12.1-Ch-Fig-12.14.png

Chapter 12 - Sunlight and plant production
http://plantsinaction.science.uq.edu.au/book/export/html/255[8/09/2017 2:59:23 PM]
Chapter 12 - Sunlight and plant production
http://plantsinaction.science.uq.edu.au/book/export/html/255[8/09/2017 2:59:23 PM]
Figure 12.14 Photosynthesis versus light response curves for seedlings of a shade-adapted rainforesttree species (Argyrodendron) and a sun-loving tree (Toona australis). Seedlings were grown underfactorial combinations of weak, medium or strong light (shown left to right) × either high or low nutrientsupply (solid lines with filled symbols, and dashed lines with open symbols respectively). (W.A. Thompsonet al., 1992b)
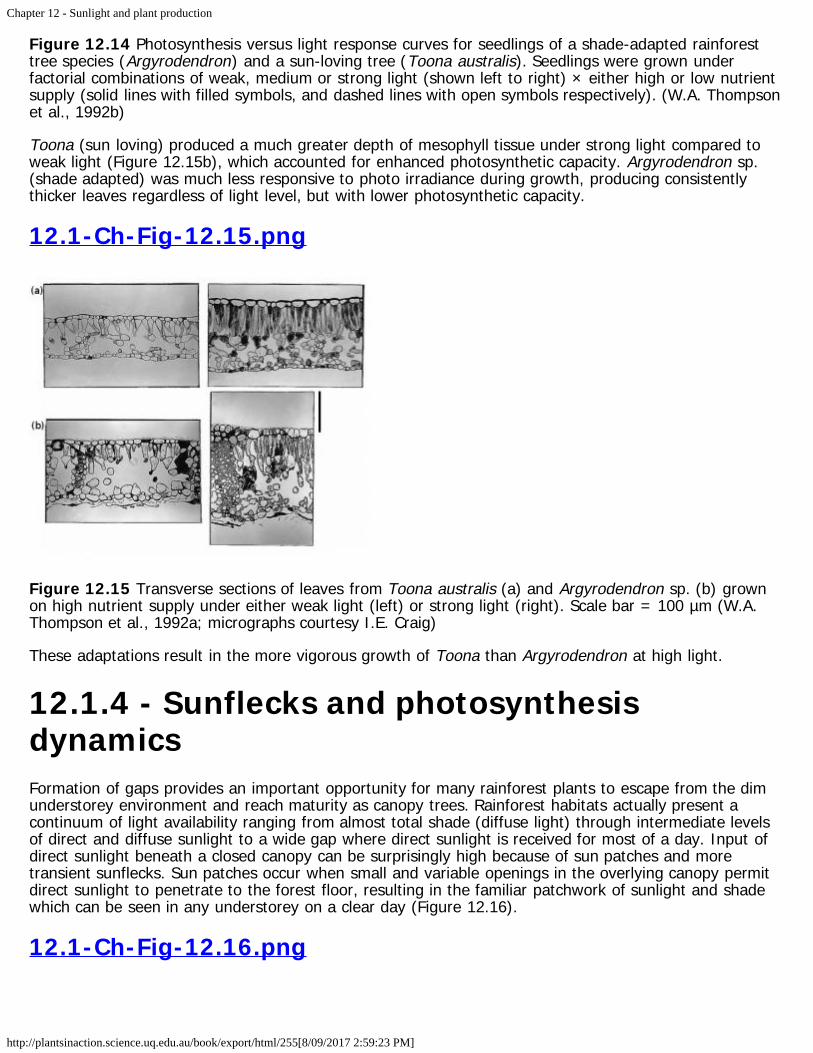
Toona (sun loving) produced a much greater depth of mesophyll tissue under strong light compared toweak light (Figure 12.15b), which accounted for enhanced photosynthetic capacity. Argyrodendron sp.(shade adapted) was much less responsive to photo irradiance during growth, producing consistentlythicker leaves regardless of light level, but with lower photosynthetic capacity.
12.1-Ch-Fig-12.15.png
Figure 12.15 Transverse sections of leaves from Toona australis (a) and Argyrodendron sp. (b) grownon high nutrient supply under either weak light (left) or strong light (right). Scale bar = 100 µm (W.A.Thompson et al., 1992a; micrographs courtesy I.E. Craig)
These adaptations result in the more vigorous growth of Toona than Argyrodendron at high light.
12.1.4 - Sunflecks and photosynthesisdynamicsFormation of gaps provides an important opportunity for many rainforest plants to escape from the dimunderstorey environment and reach maturity as canopy trees. Rainforest habitats actually present acontinuum of light availability ranging from almost total shade (diffuse light) through intermediate levelsof direct and diffuse sunlight to a wide gap where direct sunlight is received for most of a day. Input ofdirect sunlight beneath a closed canopy can be surprisingly high because of sun patches and moretransient sunflecks. Sun patches occur when small and variable openings in the overlying canopy permitdirect sunlight to penetrate to the forest floor, resulting in the familiar patchwork of sunlight and shadewhich can be seen in any understorey on a clear day (Figure 12.16).
12.1-Ch-Fig-12.16.png
Chapter 12 - Sunlight and plant production
http://plantsinaction.science.uq.edu.au/book/export/html/255[8/09/2017 2:59:23 PM]
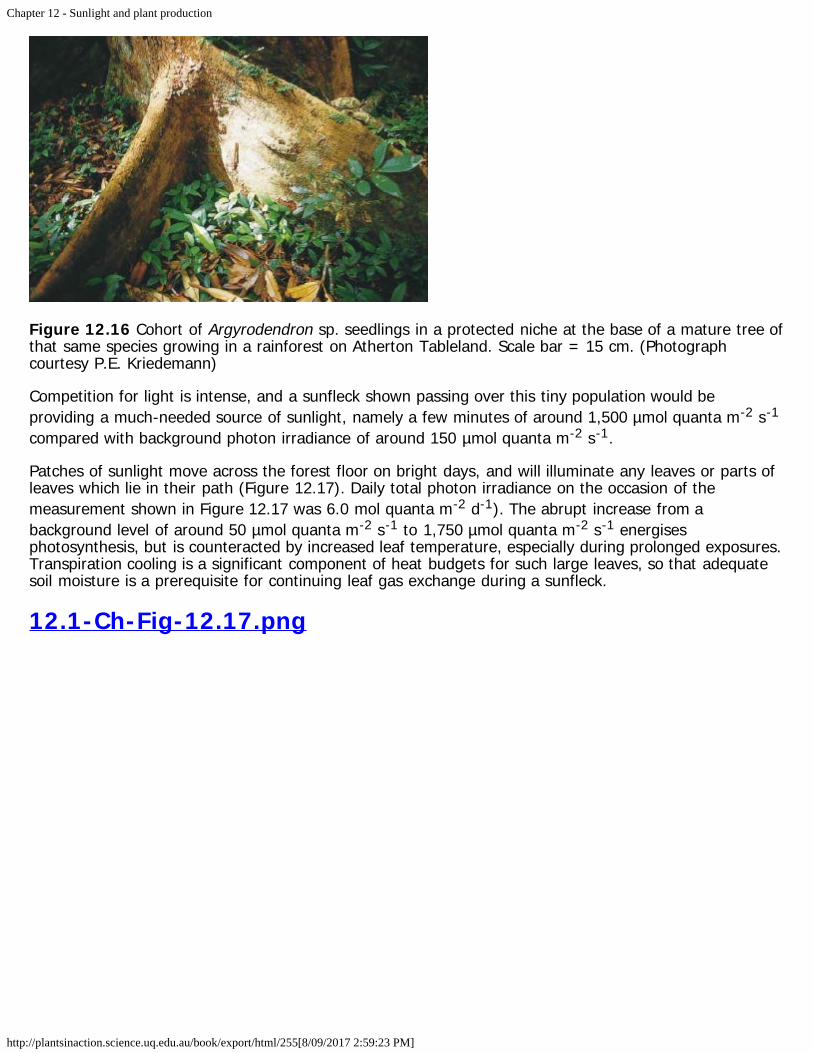
Figure 12.16 Cohort of Argyrodendron sp. seedlings in a protected niche at the base of a mature tree ofthat same species growing in a rainforest on Atherton Tableland. Scale bar = 15 cm. (Photographcourtesy P.E. Kriedemann)
Competition for light is intense, and a sunfleck shown passing over this tiny population would beproviding a much-needed source of sunlight, namely a few minutes of around 1,500 µmol quanta m-2 s-1
compared with background photon irradiance of around 150 µmol quanta m-2 s-1.
Patches of sunlight move across the forest floor on bright days, and will illuminate any leaves or parts ofleaves which lie in their path (Figure 12.17). Daily total photon irradiance on the occasion of themeasurement shown in Figure 12.17 was 6.0 mol quanta m-2 d-1). The abrupt increase from abackground level of around 50 µmol quanta m-2 s-1 to 1,750 µmol quanta m-2 s-1 energisesphotosynthesis, but is counteracted by increased leaf temperature, especially during prolonged exposures.Transpiration cooling is a significant component of heat budgets for such large leaves, so that adequatesoil moisture is a prerequisite for continuing leaf gas exchange during a sunfleck.
12.1-Ch-Fig-12.17.png

Chapter 12 - Sunlight and plant production
http://plantsinaction.science.uq.edu.au/book/export/html/255[8/09/2017 2:59:23 PM]
Figure 12.17 Natural variation in photon irradiance and leaf temperature experienced by Alocasiamacrorrhiza growing in the understorey of a North Queensland rainforest. (J.R. Watling et al. 1997a, b)
Sunfleck frequency will be an additional factor for carbon gain during exposure to strong photonirradiance. Photosynthetic induction state diminishes to a minimum after 30 min in low light (see Figure12.18 below) and some minutes are required to regain full capacity in strong light. Infrequent sunflecksare thus used with reduced efficiency.
Sunflecks and sun patches are of potential use to understorey plants for photosynthesis, but is thispotential realised? Growth of understorey tree seedlings has been shown to be correlated with theamount of direct light received in sunflecks, and up to 60% of carbon gain in such environments hasbeen attributed to this source. However, when compared with expected values based on the knownsteady-state response of plants to light, sunfleck utilisation is often below predicted values (Pfitsch andPearcy 1989). Moreover, species vary in their capacity to utilise sunflecks. Watling et al. (1997a)measured the growth of four Australian rainforest species under simulated sunfleck regimes and showedthat sunflecks contributed to growth in two species (Diploglottis diphyllostegia and Micromelumminutum), whereas the other two species (Alocasia macrorrhiza and Omalanthus novo-guinensis) wereunable to make effective use of sunflecks.
Factors underlying this variation in sunfleck utilisation efficiency
Two components of a plant’s photosynthetic physiology will determine how the light in a sunfleck is used.Firstly, photosynthetic capacity (Pmax) will set a ceiling on the amount of light a plant can use. Secondly,a few minutes of illumination at least are needed for PCR cycle intermediates to reach critical levels, andthis ‘induction requirement’ of photosynthesis determines how quickly a leaf can respond to an increasein photon irradiance.

Chapter 12 - Sunlight and plant production
http://plantsinaction.science.uq.edu.au/book/export/html/255[8/09/2017 2:59:23 PM]
Measured photosynthetic capacities of understorey plants are often low. When a leaf experiences asunfleck, carbon fixation will increase to the point of light saturation. If an understorey plant couldincrease Pmax, it could utilise more light. But there are trade-offs. For example, higher respiration rateswould increase the light-compensation point, and increase carbon losses during the low light periodsseparating sunflecks.
Regardless of photosynthetic capacity, the ability of a plant to use sunflecks is also affected by theinduction requirement of photosynthesis. When a leaf that has been in low light for some time is exposedto an increase in photon irradiance, the rate of photosynthesis does not increase instantaneously to thenew level. Instead, there is a gradual increase in assimilation which can take from 10–60 min forcompletion. This ‘induction period’ varies according to species as well as the induction state of the leafconcerned. Three different processes are involved; namely (1) buildup of PCR cycle intermediates and inparticular ribulose-1,5-bisphosphate (RuBP), (2) light-dependent activation of Rubisco, and (3) light-dependent opening of stomata. Each of these processes follows a different time-course. Buildup of ametabolite pool is fastest (1–2 min), followed by Rubisco activation (2–5min) and finally stomatal opening(up to 60 min). Relaxation in low light is more protracted but generally occurs in the same sequence,leading to a decline in the induction state.
12.1-Ch-Fig-12.18.png
Figure 12.18 Loss of photosynthetic induction state in Alocasia macrorrhiza following transfer fromsaturating light to low light. Replicate determinations represented by different symbols and error bars.
Chapter 12 - Sunlight and plant production
http://plantsinaction.science.uq.edu.au/book/export/html/255[8/09/2017 2:59:23 PM]
(J.R. Watling et al. 1997a, b)
Thus, the longer a leaf has been in low light, the lower it’s the induction state. Figure 12.18 illustratesthis for a leaf of Alocasia macrorrhiza, a plant common in rainforest understoreys and forest edges ineastern Australia. Fully-induced leaves were transferred to low light (10 µmol quanta m-2 s-1) fordifferent lengths of time (up to 60 min). Their induction state was determined as the proportion of light-saturated photosynthetic capacity (Pmax) achieved within 2 min after return to saturating light. Inductionloss in Alocasia, therefore, has a half time of about 25 min, but other species have been found to beeither faster (e.g. Adenocaulon bicolor, an understorey herb from the redwood forests of western USA;Pfitsch and Pearcy 1989) or slower (e.g. Castanospora alphandii, a shade-tolerant tree from Australianrainforests; Watling et al. 1997a, b).
Chazdon and Pearcy (1986) showed that continuous light is not needed for induction to proceed. Ifleaves were subjected to a series of 60 s lightflecks (artificial sunflecks) separated by 2 min of low light,then induction state increased with each successive lightfleck. In nature, sunflecks are often clusteredwith a sequence of irregular bursts, separated by dull periods of variable duration. Under thesecircumstances, the state of induction might improve such that a plant will respond more rapidly to closingsunflecks in each sequence. This is supported by the data of Chazdon and Pearcy (1986), where theefficiency with which a sequence of lightflecks was utilised increased with successive lightflecks (efficiencywas calculated as the actual amount of carbon fixed during a lightfleck relative to the amount predicted ifthere had been no induction period).
Carbon gain by fully induced leaves during lightflecks can exceed that expected, resulting in improvedefficiency of light utilisation. This ‘intermittency phenomenon’ was noted by Kriedemann et al. (1973) ingrapevine leaves exposed to high-frequency lightflecks. Similar investigations in a number of otherspecies have also shown that such enhancement occurs only with short-duration lightflecks and is moreprominent in fully induced leaves. Alocasia macrorrhiza showed improved efficiency of lightfleck utilisationby fully induced leaves only when lightflecks were of 40 s duration or less. Un-induced leaves neededlightflecks 10s or shorter (Chazdon and Pearcy 1986).
This apparent improvement in light use efficiency results from continued carbon fixation in low light (ordarkness) following a lightfleck. During a short lightfleck, pools of triose phosphate and RuBP build upbecause carbon fixation runs transiently slower than the light reactions. This pool of PCR intermediates isthen used for post-illumination CO2 fixation. In rainforest understoreys, where sunflecks are generallylonger than a few seconds, this kind of enhancement is unlikely to be important. However, it maycontribute significantly to carbon gain under crop canopies, where sunflecks are much shorter and morefrequent.
One consequence of generally low photosynthetic capacities in understorey plants is a limited ability toprocess the light energy they absorb during strong sunflecks. This limited ability can also be exacerbatedby a low induction state. Under these conditions, understorey plants will need to dissipate excess energyif they are to avoid photodamage. Field measurements of chlorophyll fluorescence from A. macrorrhizashow a decline in the quantum yield of photosynthesis (measured as Fv/Fm) during saturating sunflecks,indicating that photoprotective mechanisms are probably being engaged. Simultaneous assessment of thexanthophyll pigments shows that interconversion of violaxanthin to zeaxanthin is also occurring. After thesunfleck has passed, conversion of zeaxanthin to violaxanthin is extremely slow in species such as A.macrorrhiza, perhaps allowing a more rapid photoprotective response for subsequent sunflecks. However,quantum yield increases more rapidly than xanthophyll reconversion on return to low light, demonstratinga requirement for both high ΔpH and zeaxanthin for internal photoprotection to occur (Watling et al.1997b).
Engagement of photoprotective mechanisms by shade-tolerant plants in an understorey environment mayseem surprising, but serves to illustrate the extent of spatial heterogeneity in resource availability whichis a feature of most habitats.

Chapter 12 - Sunlight and plant production
http://plantsinaction.science.uq.edu.au/book/export/html/255[8/09/2017 2:59:23 PM]
Feature essay 12.1 - Perspectives onphotoprotection and photoinhibitionBarry Osmond
12.1-FE-Fig-1.png
Figure 1 Barry Osmond contemplating photoprotection during sun flecks in a rainforest understorey atthe Australian National Botanic Gardens, Canberra
Plants often harvest more light than they can use in photosynthesis. When they are exposed to excesslight there is an ever-present possibility of photoinhibition. This may happen when tree fall produces arainforest gap and suddenly exposes seedlings adapted to life on a forest floor to sustained 10- or 20-fold increases in photon irradiance, or when water stress or low temperature restricts access to CO2 insun plants. The photochemical efficiency of light utilisation (\(\phi_{PSII}\)) declines rapidly, and in mostcases reversibly. Usually the excess light is wasted as heat, instead of being used to drive assimilation.These reversible changes in efficiency are known as photoprotection, and, if adequate, photoinhibitorydamage to the water splitting PSII reaction center (photoinactivation) is avoided. Plants must constantlymanage the trade-off between photoprotection and photoinactivation, while optimizing the photochemicalefficiency of PSII.
Some of the earliest systematic studies of photoinhibition were done by A. Ewart (1896) in Pfeffer’slaboratory in Leipzig 120 years ago (Figure 2). He examined the effects of excess light on the ability ofchloroplasts in leaves to evolve O2. He detected this by examining the movement of O2-requiringbacteria towards photosynthetically active cells in leaf sections. Ewart is best remembered because hewent on to translate three volumes of Pfeffer’s famous textbook (The Physiology of Plants) into English,

Chapter 12 - Sunlight and plant production
http://plantsinaction.science.uq.edu.au/book/export/html/255[8/09/2017 2:59:23 PM]
and later became the first Professor of Plant Physiology in Australia (University of Melbourne, 1904).
12.1-FE-Fig-2.png
Figure 2 Photoinhibitory printing of excerpts from the first page of Ewart's paper on assimilatoryinhibition on a leaf of the shade plant Cissus antarctica. A microfilm negative of the text was paperclipped to the leaf which was exposed to full sunlight for an hour. Chlorophyll fluorescence was
Chapter 12 - Sunlight and plant production
http://plantsinaction.science.uq.edu.au/book/export/html/255[8/09/2017 2:59:23 PM]
subsequently imaged with a special video camera. Those areas of the leaf exposed to strong light underthe text show severely reduced fluorescence due to photoinhibition. The latent image persists for severalweeks because these shade plants repair photoinhibitory damage only slowly (Osmond et al. 1999)
Modern research on photoinhibition of light reactions of photosynthesis was strongly influenced by theDutch biophysicist Bessel Kok (1956), responsible for so many advances in photosynthetic research, andby the early field studies of CO2 exchange by Björkman and Holmgren (1963) in Sweden. Björkman’ssabbatical in Australia in 1971 stimulated renewed interest in photoinhibition, and with Australian andGerman collaborators, research in his Stanford laboratory has repeatedly changed the way people think inthis field (Powles 1984; Demmig-Adams and Adams 1992). Australian research in photoinhibitioncontinues to attract attention (Anderson et al. 1997; Matsubara et al. 2012; Jia et al. 2013). Althoughmodern research techniques such as in vivo chlorophyll fluorescence are much more quantitative andfield-portable, the questions being probed are remarkably similar to those studied by Ewart!
By and large, leaves on most plants cannot avoid harvesting light, but some have evolved with externalfeatures to forestall absorption of excess radiation. For example, leaves of desert plants often reflect alarge part of incident light, the high reflectivity being due to hairs, salt crusts (as in Australian saltbushessuch as Atriplex nummularia) or epidermal waxes (Robinson et al. ). Such features are effectivelymechanisms for external photoprotection. In others such as Townsville stylo (Macroptiliumatropurpureum) leaves demonstrate very effective light-avoiding responses when water stressed. Ludlowand Björkman (1984) showed that if leaves of Townsville stylo were restrained perpendicular to incidentsunlight, high-temperature-dependent photoinhibition ensued. It was obvious that unrestrainedmovement in the field preserved green and functional stylo leaves under conditions that acceleratedsenescence of leaves on adjacent herbs and grasses. By way of contrast, in some species like thecompass plant (Lactuca scariola) leaves actually track the sun’s movement to maximise light interception.
The best defence against photoinhibition is a photosynthetic apparatus organised to take advantage ofbright light. Sun plants have high capacities for CO2 fixation and retain high photosynthetic efficiency atrelatively high photon irradiance (see Figure 12.9, and Case study 12.1). Depending on photosyntheticpathway and environmental conditions, sun plants may also sustain high rates of non-assimilatoryelectron transport in carbon recycling during oxygenase photorespiration (Section 2.3) and in the water-water cycle (Mehler reaction; Asada 1999) in the absence of net CO2 fixation during stress. Sun plantsare also well endowed with photoprotective mechanisms that facilitate a reversible downregulation of PSIIefficiency and stimulate wastage of absorbed photons as heat in the antennae pigment–proteincomplexes, before transfer to the reaction centre of PSII. These processes, linked to the energetic statusof thykaloids and the interconversion of xanthophyll pigments (Section 12.1.2), provide internalphotoprotection for PSII reaction centres (Demmig-Adams and Adams 1992). Sun exposed leaves ofsome epiphytes with low photosynthetic capacity, such as dodder and mistletoes have two xanthophyllcycles and so seem doubly photoprotected (Matsubara et al. 2002). Collectively known as mechanisms ofnon-photochemical quenching (NPQ) of chlorophyll fluorescence, these mechanisms that protect againstphotoinactivation have become a remarkably active realm of plant structural biology (Osmond 2015).
For the most part, these antennae-based processes seem to accommodate photon excess in most naturalenvironments. However, when photon excess is sustained, especially in combination with other stresses,photoinhibitory damage leading to photoinactivation of PSII reaction centres may follow. The site ofdamage in most cases seems to be the psbA gene product, the D1 protein which is the most rapidlyturned over protein in chloroplasts. The D1 protein is also the binding site for the triazine family ofherbicides and accounts for their lethal effects. Turnover of D1 is accelerated in bright light, and it isoften described as the ‘suicide protein’ (Aro et al. 1993; Chow and Aro 2005). Sun plants have high ratesof chloroplast protein synthesis, and are thus able to repair damage to the critical D1 protein of PSIIreaction centres more readily than in shade plants (Section 1.2).
Shade plants, in which the photosynthetic apparatus is organised to take advantage of low light, arepoorly endowed with all of the above processes. Some, such as the archetypical Australian shade plantsAlocasia and South American Tradescantia (Park et al. 1996) show the dynamic internal light avoidanceproperty of chloroplast movement to anticlinal cell walls in strong light. However, when exposed to

Chapter 12 - Sunlight and plant production
http://plantsinaction.science.uq.edu.au/book/export/html/255[8/09/2017 2:59:23 PM]
sustained bright sunlight, in excess of that encountered during growth, shade-tolerant plants such asAlocasia at the margins of Queensland rainforests suffer photoinhibitory damage. Structural organisationof the photosynthetic apparatus reflects these biophysical and bio-chemical realities at all levels, and notsurprisingly the very different granal structures of shade and sun plants have important implications forphotoinhibitory damage (Anderson and Aro 1994; Matsubara et al. 2012). In the short term, shade plantsaccommodate bright light in sunflecks without photoinhibitory damage, and even exploit it for additionalpost-illumination CO2 exchange (Chazdon and Pearcy 1986; Pearcy and Way 2012).
Somewhat surprisingly, the inner canopy shade leaves of some trees, especially those of tropical origin,are also equipped with two xanthophyll cycles (García-Plazaola et al. 2007). For example, inner canopyavocado shade leaves engage the near universal, initially rapidly relaxing violaxanthin cycle during astrong sun fleck. If these leaves are exposed to prolonged sunlight (following a cyclone for example) theslowly relaxing lutein epoxide cycle “locks in” photoprotection. A traffic-light inspired holistic summarylight intensity- and time-dependent interaction of these photoprotective processes is illustrated in Fig. 3(Jia et al 2013). Photoacclimation to bright light, the successful long-term accommodation ofphotoinhibitory processes, is genetically limited in many species. Yet in avocado it is manifest as theretrofitting of old shade leaves to perform as sun leaves, with increased photosynthetic capacity andenhanced photoprotection involving two xanthophyll cycles.
12.1-FE-Fig-3.png
Figure 3 The Yin and Yang of photoinhibition. Depending on genotype, irradiance and time the extent ofphotoinhibition (indicated by decline in ϕPSII) proceeds through engagement of internal mechanisms ofphotoprotection (indicated by the extent of NPQ). Rapidly reversible (seconds to minutes) NPQΔpHpotentiates the more slowly reversible (minutes to hours) de-epoxidation of violaxanthin toantheraxanthin and zeaxanthin (NPQΔAZ) in light harvesting antennae of PSII in thylakoid membranes. Insome plants, such as avocado, this photoprotection is augmented by a second de-epoxidation of luteinepoxide to lutein (NPQΔLAZ) that may persist for days. If still inadequate it will be followed by similarlyslowly recoverable PSII reaction centre photoinactivation (NPQPI). (Reproduced from Jia et al. 2013. PlantPhysiology 161, 836-852; Copyright American Society of Plant Biologists)

Chapter 12 - Sunlight and plant production
http://plantsinaction.science.uq.edu.au/book/export/html/255[8/09/2017 2:59:23 PM]
Although unicellular algae such as Chlamydomonas sp. have been widely used to research mechanisms ofphotoinhibitory damage (Förster et al. 2005), relatively much less is known of photoinhibition in eithermarine or freshwater environments. Under natural conditions, vertical movement of unicellular algae inwater columns is an important determinant of photon exposure and photoinhibitory responses, whichinvolve many of the same processes as in higher plants (Franklin et al. 2003). In addition, the ubiquitousmarine macrophyte Ulva is susceptible to desiccation and high-temperature-dependent photoinhibitorydamage in rock pools and estuaries when low tides occur at midday. The diversity of photosyntheticpigments among marine macrophytic algae suggests several alternative photoinhibitory mechanisms thatare currently under investigation.
Clearly, photoinhibition is an integral and indispensable component of photosynthesis. The inefficiencies itproduces in light utilisation are essential to the stability of the photosynthetic apparatus in organisms thatdepend on light for life, and especially in environments where they can do little to regulate the incomingflux of this basic resource. The costs of these inefficiencies remain difficult to estimate and the extent towhich plant distribution in relation to sunlight is governed by photoinhibitory responses, remainscontroversial. Perhaps one of the most convincing examples is the interaction of bright light and lowtemperature which restricts re-establishment of eucalyptus seedlings to the shaded south side of parenttrees on the Southern Highlands of New South Wales (Ball et al. 1991; Case study 14.1). New techniquesfor the remote sensing of chlorophyll fluorescence that monitor photosynthesis, photoprotection andphotoinhibition offer exciting insights that will facilitate integration of these processes from leaves tocanopies (Nichol et al. 2012) with the added prospect of ground truth for satellite observation of solarinduced fluorescence at the landscape level. As with most aspects of plant biology today, geneticmanipulations of many aspects of the above component photoprotective mechanisms are mooted tobenefit plant productivity through mitigation of various aspects of photoinhibition (Ort et al. 2015).
This revision and update of Feature Essay 12.1 is dedicated to the memory of Professor Jan M Anderson(1932-2015) for her outstanding leadership and encouragement of Australian research in photosynthesis.
References
Anderson JM, Aro E-M (1994) Grana stacking and protection of photosystem II in thylakoidmembranes of higher plant leaves under sustained high irradiance: an hypothesis. Photosyn Res 41:315–326.
Anderson JM, Park Y-I, Chow WS (1997) Photoinhibition and photoprotection in nature. Physiol Plant100: 214–223.
Aro E-M, Virgin I., Andersson B (1993) Photoinhibition of photosystem II. Inactivation, proteindamage and turnover. Biochim Biophys Acta 1134, 113–134.
Asada K (1999) The water-water cycle in chloroplasts: scavenging of active oxygens and dissipation ofexcess photons. Annu Rev Plant Physiol Plant Mol Biol 50, 601-639.
Ball MC, Hodges VS, Laughlin GP (1991) Cold-induced photoinhibition limits regeneration of snowgum at treeline. Funct Ecol 5: 663–668.
Björkman O, Holmgren P (1963) Adaptability of the photosynthetic apparatus to light intensity inecotypes from exposed and shaded habitats. Physiol Plant 16, 889–914.
Chazdon RL, Pearcy RW (1986) Photosynthetic responses to light variation in rainforest species. IICarbon gain and photosynthetic efficiency during lightflecks. Oecologia 69: 524–531.
Chow WS, Aro E-M (2005) Photoinactivation and mechanisms of recovery. In ‘Photosystem II. Thelight-driven water: plastoquinone oxidoreductase advances in photosynthesis and respiration’, Vol. eds TJWydrzynski, K Satoh, JA Freeman. 627–648, Springer, Dordrecht, The Netherlands)
Chapter 12 - Sunlight and plant production
http://plantsinaction.science.uq.edu.au/book/export/html/255[8/09/2017 2:59:23 PM]
Demmig-Adams B, Adams III WW (1992) Photoprotection and other responses of plants to highlight stress. Annu Rev Plant Physiol Plant Mol Biol 43: 599–626.
Ewart AJ (1896) On assimilatory inhibition in plants. J Linnean Soc 31: 364-461.
Förster B, Osmond CB, Pogson BJ (2005) Improved survival of very high light and oxidative stress isconferred by spontaneous gain-of-function mutations in Chlamydomonas. Biochim Biophys Acta(Bioenerg) 1709, 45-57.
Franklin LA, Osmond CB, Larkum AWD (2003) Photoinhibition, UV-B and algal photosynthesis. InPhotosynthesis in Algae. Advances in Photosynthesis and Respiration, Vol. eds AWD Larkum, SE Douglas,J A Raven. 351-384, Kluwer, Dordrecht.
García-Plazoala J-I, Matsubara S, Osmond CB (2007) The lutein epoxide cycle in higher plants: itsrelationship to other xanthophyll cycles and possible functions. Funct Plant Biol 34, 754-779.
Jia HS, Förster B, Chow WS et al. (2013) Decreased photochemical efficiency of Photosystem IIfollowing sunlight exposure of shade-grown leaves of avocado (Persea americana Mill.): because of, or inspite of, two kinetically distinct xanthophyll cycles? Plant Physiol 161: 836-852.
Kok B (1956) On the inhibition of photosynthesis by intense light. Biochim Biophys Acta 21: 234–244.
Ludlow MM, Björkman O (1984. Paraheliotropic leaf movement in Siratro as a protective mechanismagainst drought-induced damage to primary photosynthetic reactions: damage by excessive light andheat. Planta 161: 505–518.
Matsubara S, Gilmore AM, Ball MC et al. (2002) Sustained down regulation of photosystem II inmistletoes during winter depression of photosynthesis. Funct Plant Biol 29: 1157-1169.
Matsubara S, Förster B, Waterman M et al. (2012) From ecophysiology to phenomics: someimplications of photoprotection and shade-sun acclimation in situ for dynamics of thylakoids in vitro. PhilTrans Royal Soc London B 367: 3503-3514.
Nichol CJ, Pieruschka R, Takayama K et al. (2012) Canopy conundrums: building on the Biosphere2 experience to scale measurements of inner and outer canopy photoprotection from the leaf to thelandscape. Funct Plant Biol 39: 1-24.
Ort D R et al. (2015) Redesigning photosynthesis to sustainably meet global food and bioenergydemand. Proc Nat Acad Sci USA 112: 8529-8536.
Osmond B, Schwartz O, Gunning B (1999) Photoinhibitory printing on leaves, visualised by chlorophyllfluorescence imaging and confocal microscopy, is due to diminished fluorescence from grana. Aust J PlantPhysiol 26: 717-724.
Osmond B (2015) An ecophysiologist’s apology. Book Review: Non-photochemical Quenching and EnergyDissipation in Plants, Algae and Cyanobacteria, Advances in Photosynthesis and Respiration, Vol 40. edsB. Demmig-Adams, G. Garab, W.W. Adams III and Govindjee (eds) (2014), Springer, Dordrecht.Photosyn Res 124:127-130
Park Y I, Chow WS, Anderson JM (1996) Chloroplast movement in the shade plant Tradescantiaalbiflora helps protect photosystem II against light stress. Plant Physiol 111: 867-875.
Pearcy RW, Way DA (2012) Two decades of sunfleck research: looking back to move forward. TreePhysiol 32 1059-1061.
Powles SB (1984) Photoinhibition of photosynthesis by visible light. Annu Rev Plant Physiol 35: 15-44.
Robinson SA, Lovelock CE, Osmond CB (1993) Wax as a mechanism for protection against
Chapter 12 - Sunlight and plant production
http://plantsinaction.science.uq.edu.au/book/export/html/255[8/09/2017 2:59:23 PM]
photoinhibition - a study of Cotyledon orbiculata. Bot Acta 106: 307-312.
12.2 - Agricultural production and lightSolar radiation is linked to agricultural productivity via biomass production and allocation to harvestedparts such as grains and fruit. Radiation in this context is in relation to canopy photosynthesis. Biomass isderived from photosynthesis, but is less than the total carbon that is assimilated due to a largerespiratory loss by the plant (see Case study 12.1). Carbon lost via respiration is, however, a fairlyconstant proportion of photosynthesis, and thus variation in canopy photosynthesis is sufficient toaccount for variation in biomass production.
How then does interception of photosynthetically active radiation (PAR) or photon irradiance affectbiomass production and allocation to crop yield? Three steps are considered in this section: (1) variationin the incident PAR during crop growth, (2) interception of PAR by a crop canopy and (3) efficiency ofPAR conversion into biomass and yield.
Crop yield commonly depends on the total amount of light intercepted, particularly when crop growth isnot limited by other factors such as nutrient or water deficiency or temperature extremes. One examplehighlighting the importance of solar radiation for crop yield comes from a comparison of rice crops inAustralia with those grown in tropical areas.
Rice in Australia is grown almost exclusively in southern New South Wales during dry summer months(November–March). Crops are fully irrigated and well fertilised and yield around 9 t ha–1. This high yieldis associated with high incident solar energy (commonly 10–15 MJ m–2 d–1 PAR) during the long growingseason. In tropical Asian countries, rice is commonly grown under cloudy conditions during the wetseason (June–November). Yield is lower (4–5 t ha–1) even with high nutrient inputs, because of a shortergrowing season and lower solar energy (often around 8–10 MJ m–2 d–1 PAR). Experiments with shadingtreatments have shown that growth and yield of rice and many other agricultural crops, are reduced bydecreased solar radiation.
12.2.1 - Leaf area index and canopy lightclimateInterception of light by a crop canopy is strongly related to total or canopy leaf area. A crop will thusintercept more light and hence grow faster if it develops the canopy leaf area rapidly. This principleapplies to both annual crops, which are usually planted at the beginning of a growing season and toperennial crops, which resume growth after a dormant season. Leaf area development of sugar cane, forexample, is generally slower in the year of planting compared with a subsequent ratooned crop, wherecanopy regrowth is enhanced by stored photoassimilates. By analogy with early canopy expansion,retention of green leaves late in a growing season also extends light interception and enhances storageof photoassimilates. This is also true for perennial crops. For some deciduous horticultural crops, leaf areaexpansion is also rapid because of preformed primordia which emerge rapidly and comprise the largestleaves (Greer 1996).
The leaf area index (LAI) is the ratio of total projected leaf area (one side only) per unit ground area, andis widely used to characterise the canopy light climate. A canopy where LAI equals 1 has a leaf areaequal to the soil surface area on which it grows. This does not mean all light is intercepted, becausesome leaves overlap, leaving gaps. Moreover, not all leaves are positioned at right angles to the incidentradiation. A crop under favourable growing conditions increases LAI rapidly during early development to amaximum of 3 to 7.

Chapter 12 - Sunlight and plant production
http://plantsinaction.science.uq.edu.au/book/export/html/255[8/09/2017 2:59:23 PM]
12.1-Ch-Fig-12.19.png
Figure 12.19 Changes in leaf area index (LAI) (a), light interception (b), and the overall relationshipbetween light interception and LAI (c) for three species, sorghum, maize and rice in South SastQueensland. (P. Inthapan and S. Fukai, Aust J Exp Agric 28: 243-248, 1988)
An example of LAI development of three tropical cereal crops grown under well-watered conditions inSouth East Queensland is given in Figure 12.19. Sorghum showed a more rapid increase in LAI than didmaize, largely because of a higher sowing density (33 v. 5.6 plants m–2). A late maturing rice cropshowed slowest leaf area development during early stages of growth, but the maximum LAI was none theless higher for rice than for maize. As a general rule, maximum LAI is achieved just prior to flowering incereal crops. By that stage, growing points are differentiating floral rather than leaf primordia, andinitiation of new leaves has ceased.
Some cereal crops lose leaves and the LAI declines during grain filling as crops mature. Differences in LAIdevelopment among the three crops (Figure 12.20a) are evident in light interception by the respectivecanopies (Figure 12.19b); interception prior to 60 d was highest in sorghum and lowest in rice. However,in all three crops, canopy light interception increased rapidly during early stages of growth. Incidentradiation was almost completely intercepted once a high LAI had been achieved.
Despite wide variation in crop phenology, sunlight interception and LAI maintain a tight curvilinearrelationship (Figure 12.19c). Thus, interception increases sharply with increases in LAI to about 90%once LAI exceeds 4, and approaches an asymptote at higher LAI, see also Figure 12.20 from Khurana andMcLaren (1982). In this research on potato, numerous treatments were imposed, involving differentstorage of seeds at low temperatures including apically and multisprouted seed treated at 4 and 12 °Cand then at 8 °C before planting. In Treatment1, the trial included unsprouted seed stored at 4 °C, in
Chapter 12 - Sunlight and plant production
http://plantsinaction.science.uq.edu.au/book/export/html/255[8/09/2017 2:59:23 PM]
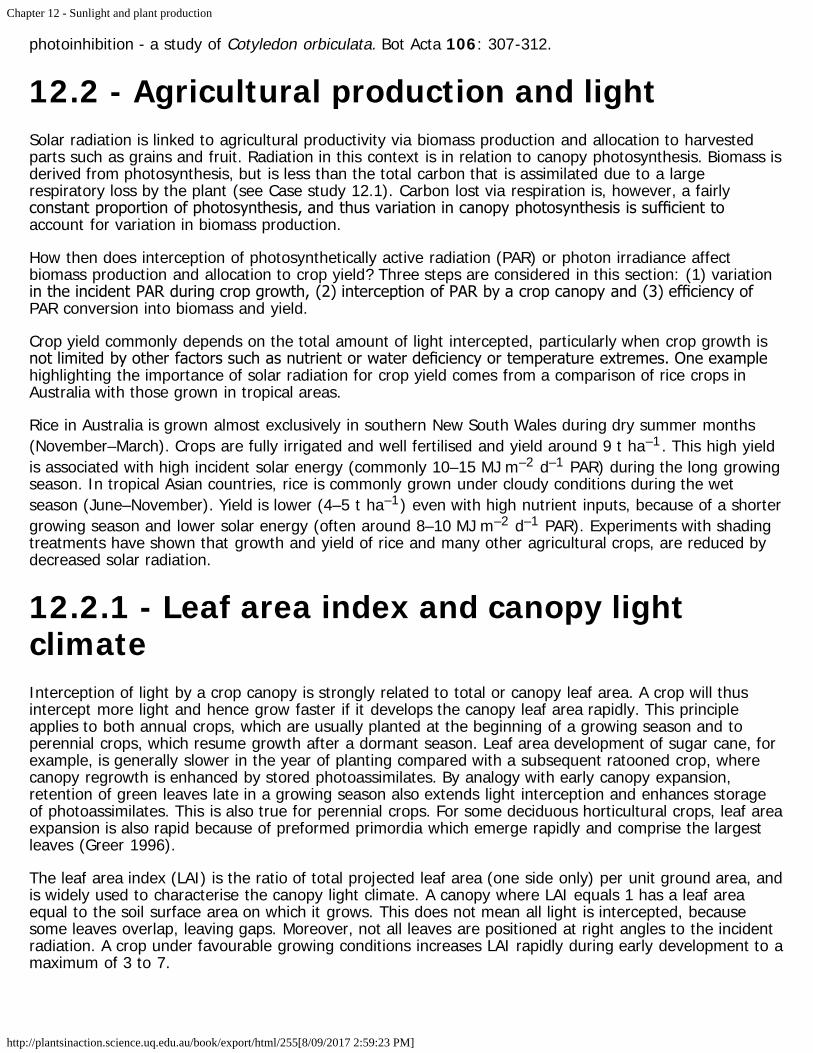
Treatment 2, the trial included seed stored in the dark and in Treatment 3, two additional sproutingtreatments were mixed alternately along the row. Such a relationship between LAI and light interceptionapplies to many crops, and emphasises (1) the importance of a rapid increase in LAI during early stagesof growth, and (2) a requirement for only moderate LAI to achieve effective light interception. Indeed,excessive leaf area development can be counter-productive, because reproductive development, andhence economic yield, may be reduced due to self-shading and resource allocation to leaf production(such as for fruit trees and grapevines, Section 12.4).
12.2-Ch-Fig-12.20.png
Figure 12.20 The proportion of incident radiation intercepted by potato canopies as a function of leafarea index. The different symbols indicate agronomic treatments over two growing seasons. In 1979: □cv. Record, ○ cv. Pentland Crown. In 1980: cv. Pentland Crown with three treatments (see text):●Treatment 1, ▲Treatment 2, ■ Treatment 3. (Based on Khurana and McLaren 1982)
The time-course of light interception during crop growth can be manipulated to some extent by farmers.For example, seeding rate is an important management option which affects interception and subsequentcrop growth and yield. A high seeding rate would produce a high plant population density and a high LAIat crop establishment. This hastens canopy interception and hence biomass production would bepromoted. Any advantage of a high plant density may, however, disappear with time during crop growth,because radiation interception of a medium plant density may eventually catch up with that of the highdensity (Figure 12.21).
12.2-Ch-Fig-12.21.png

Chapter 12 - Sunlight and plant production
http://plantsinaction.science.uq.edu.au/book/export/html/255[8/09/2017 2:59:23 PM]
Figure 12.21 Changes in dry matter (a), leaf area index (LAI) (b), and photon irradiance at ground level(c) for wheat crops grown at five different densities, 1.4, 7, 35, 154 and 447 plants m-2 for treatments 1to 5 respectively. (D.W. Puckridge and C.M. Donald, Aust J Agric Res 18: 193-211, 1967)
In this case, density 3 (35 plants m–2) was sufficient for radiation interception and plant dry matterproduction. If plant density is very low, shown as density 1 (1.4 plants m–2) or density 2 (7 plants m–2)in Figure 12.21, LAI never exceeded 2 and final biomass at harvest was much smaller than valuesreturned from higher densities. Solar radiation was not fully intercepted and hence wasted at low plantingdensity, and potential yield (dry mass produced per unit area) was never realised.
As solar radiation penetrates a crop canopy, PAR is intercepted by leaves and photon irradiancecommonly declines exponentially with cumulative leaf area (i.e. depth in Figure 12.23), according to theexponential relationship:
\[ I = I_0 e^{-kL} \tag{12.1} \]
where \(I\) is horizontal photon irradiance within a canopy, \(I_0\) is horizontal photon irradiance abovethat canopy, \(L\) is LAI from the top of the canopy to the point where \(I\) is determined, and \(k\) isan extinction coefficient (a more explicit formulation for PAR attenuation through a forest canopy is givenin the next section).
12.2-Ch-Fig-12.22.png

Chapter 12 - Sunlight and plant production
http://plantsinaction.science.uq.edu.au/book/export/html/255[8/09/2017 2:59:23 PM]
Figure 12.22 Total dry matter production at harvest of several different crops as a function of the totalamount of solar radiation intercepted over the whole growing season. (Based on Monteith 1977)
Large \(k\) values imply that photon irradiance decreases rapidly with depth, whereas a canopy with asmall \(k\) would allow solar radiation to penetrate deeply, for a similar leaf area profile. Variation in \(k\)value is commonly associated with leaf angle. Canopies with more horizontal leaves, such as sun-floweror cotton, have large \(k\) values, often 0.7–1.0, whereas those with more erect leaves, such as barleyand sugar cane, have small values, often 0.3–0.6.
Irrespective of the canopy extinction, there is a strong relationship between the light intercepted by thecanopy over the growing season and the total dry matter produced for a number of crops (Fig. 12. 22).Thus, it is imperative on growing crops to manage the LAI to achieve maximum light interception fromthe early part of the season to maximise production of dry matter.
12.2.2 - Light use efficiency12.2-Ch-Fig-12.23.png
Chapter 12 - Sunlight and plant production
http://plantsinaction.science.uq.edu.au/book/export/html/255[8/09/2017 2:59:23 PM]
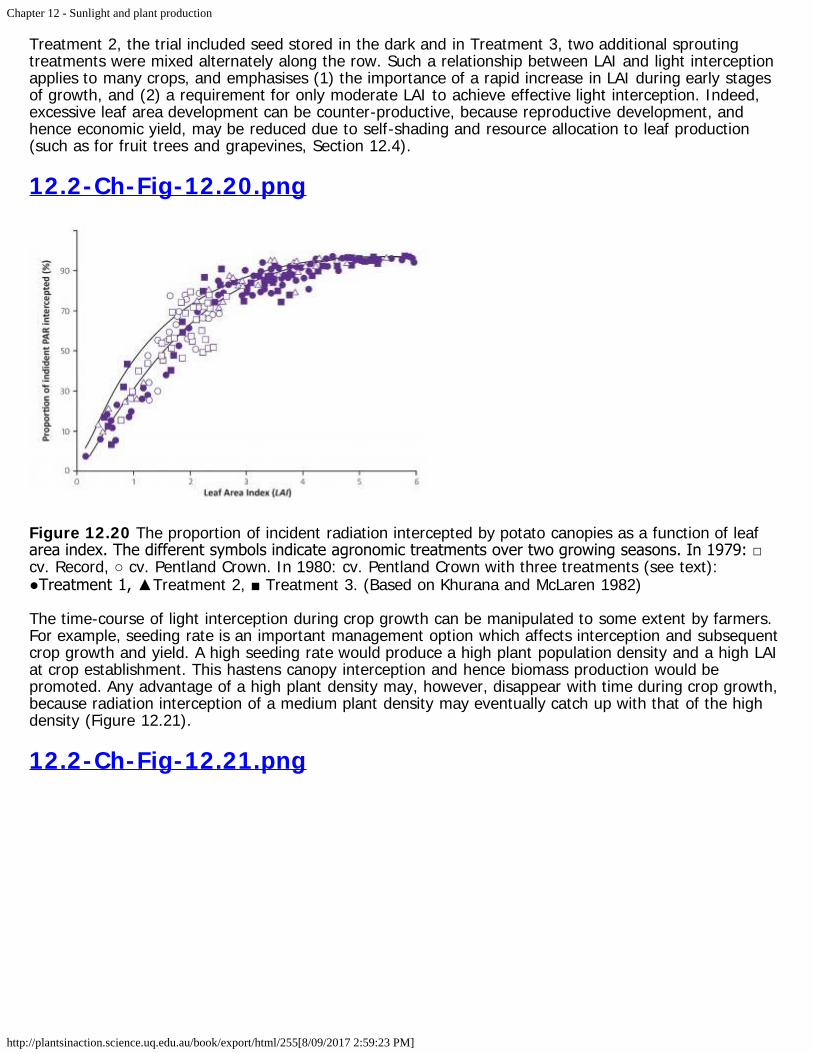
Figure 12.23 A hypothetical wheat ideotype with features presumed conducive to high grain yield as acrop community. (C. M. Donald, Euphytica 17: 385-403, 1968)
Sunlight intercepted is not utilised with similar efficiency by different crops. There are clear differences inlight use efficiency between crop species, particularly between those with C3 and those with C4photosynthetic pathways. The photosynthetic advantage of C4 species at a leaf level is evident here at acanopy level, where efficiency is higher by 30–100%. Expressed in terms of dry mass formed (g) per unitof photosynthetically active energy absorbed (MJ), the efficiency of sorghum and maize (C4
photosynthesis) in Figure 12.19 was 1.32 g MJ–1, while that of rice (C3 photosynthesis) was only 0.93 gMJ–1.
Canopy structure, and particularly the spatial distribution of leaf angles, has an important bearing on thecanopy light climate and energy conversion. Large leaf angles, with leaves close to vertical, ensure goodlight penetration when solar angle is high, and a high proportion of leaves receive similar photonirradiances. An even distribution of light at leaf surfaces is advantageous for canopy photosynthesis and

Chapter 12 - Sunlight and plant production
http://plantsinaction.science.uq.edu.au/book/export/html/255[8/09/2017 2:59:23 PM]
improves light use efficiency over canopies where upper horizontal leaves intercept most solar radiationand lower leaves experience greatly attenuated levels. Small and erect leaves, particularly in top canopylayers, are thus a key feature of an ideal plant type, or ‘ideotype’ for high-density cropping (Figure12.23).
Canopy radiation climate is especially complex in mixed crops and pastures where species withcontrasting forms grow together. In grass–legume pastures, grass is generally taller than the legumecomponent and is better placed to intercept incident radiation. Legumes then exist in permanent shade.Height is, therefore, an important determinant of light interception within a mixed sward, and thusspecies composition. In such mixed swards, management options such as nitrogen fertiliser application,grazing time or cutting frequency all affect the relative height and hence radiation interception bycomponent species. High-nitrogen fertiliser tends to favour grass, while clover may become dominantunder nitrogen-limiting conditions.
12.2-Ch-Fig-12.24.png
Figure 12.24 Photon irradiance declines with depth (cumulative LAI) in any plant community. That rateof decline is accentuated by a preponderance of horizontal leaves. (W.R. Stern and C.M. Donald, Aust JAgric Res 13: 599-614, 1962)
Light profiles within a pasture are, therefore, affected by LAI profiles of component species (Figure12.24), and a clover-rich sward with more horizontal leaves (N0, no added nitrogen) shows strongerattenuation of sunlight than a grass-rich sward with a preponderance of vertical leaves (N225, nitrogenadded). In common with monocultures, pasture productivity is enhanced by a species balance thatensures even distribution of sunlight within a mixed community.
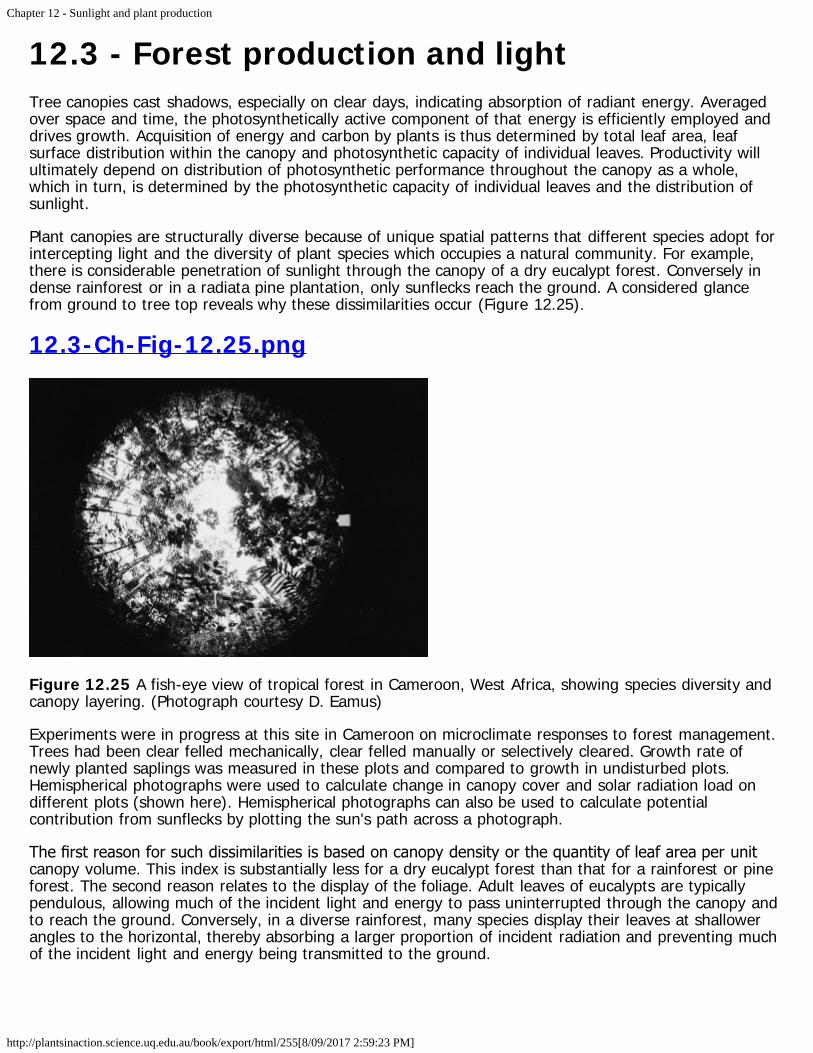
Chapter 12 - Sunlight and plant production
http://plantsinaction.science.uq.edu.au/book/export/html/255[8/09/2017 2:59:23 PM]
12.3 - Forest production and lightTree canopies cast shadows, especially on clear days, indicating absorption of radiant energy. Averagedover space and time, the photosynthetically active component of that energy is efficiently employed anddrives growth. Acquisition of energy and carbon by plants is thus determined by total leaf area, leafsurface distribution within the canopy and photosynthetic capacity of individual leaves. Productivity willultimately depend on distribution of photosynthetic performance throughout the canopy as a whole,which in turn, is determined by the photosynthetic capacity of individual leaves and the distribution ofsunlight.
Plant canopies are structurally diverse because of unique spatial patterns that different species adopt forintercepting light and the diversity of plant species which occupies a natural community. For example,there is considerable penetration of sunlight through the canopy of a dry eucalypt forest. Conversely indense rainforest or in a radiata pine plantation, only sunflecks reach the ground. A considered glancefrom ground to tree top reveals why these dissimilarities occur (Figure 12.25).
12.3-Ch-Fig-12.25.png
Figure 12.25 A fish-eye view of tropical forest in Cameroon, West Africa, showing species diversity andcanopy layering. (Photograph courtesy D. Eamus)
Experiments were in progress at this site in Cameroon on microclimate responses to forest management.Trees had been clear felled mechanically, clear felled manually or selectively cleared. Growth rate ofnewly planted saplings was measured in these plots and compared to growth in undisturbed plots.Hemispherical photographs were used to calculate change in canopy cover and solar radiation load ondifferent plots (shown here). Hemispherical photographs can also be used to calculate potentialcontribution from sunflecks by plotting the sun's path across a photograph.
The first reason for such dissimilarities is based on canopy density or the quantity of leaf area per unitcanopy volume. This index is substantially less for a dry eucalypt forest than that for a rainforest or pineforest. The second reason relates to the display of the foliage. Adult leaves of eucalypts are typicallypendulous, allowing much of the incident light and energy to pass uninterrupted through the canopy andto reach the ground. Conversely, in a diverse rainforest, many species display their leaves at shallowerangles to the horizontal, thereby absorbing a larger proportion of incident radiation and preventing muchof the incident light and energy being transmitted to the ground.
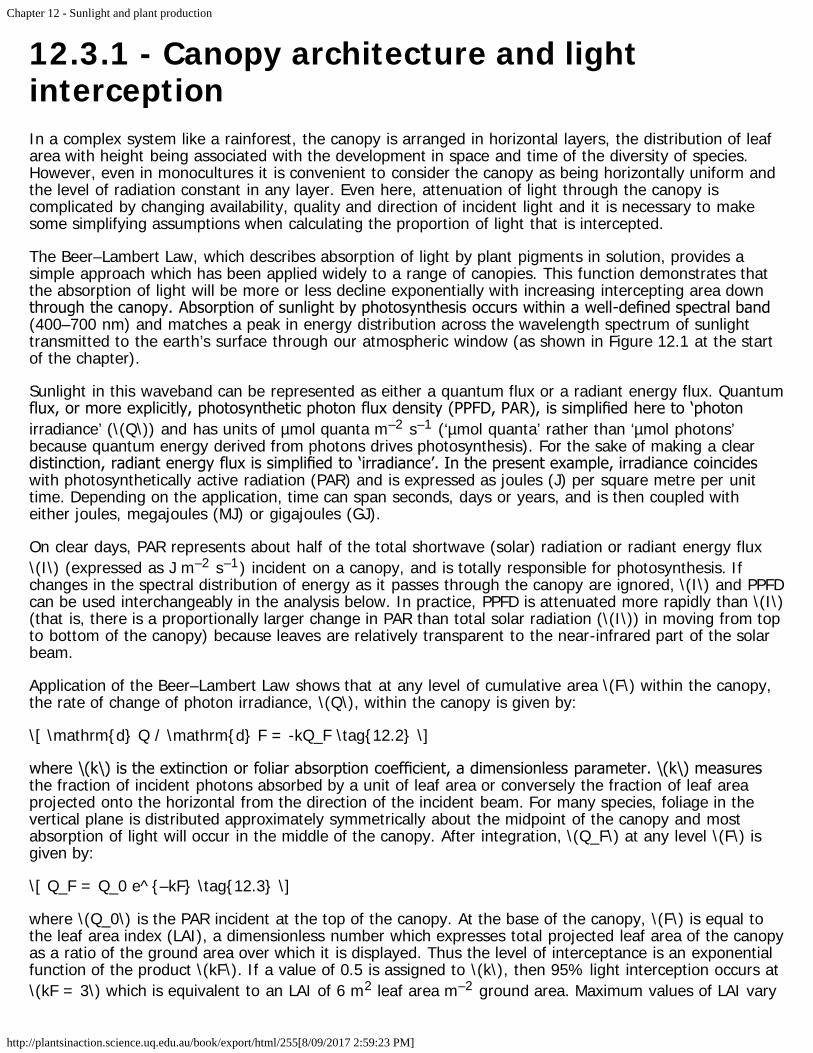
Chapter 12 - Sunlight and plant production
http://plantsinaction.science.uq.edu.au/book/export/html/255[8/09/2017 2:59:23 PM]
12.3.1 - Canopy architecture and lightinterceptionIn a complex system like a rainforest, the canopy is arranged in horizontal layers, the distribution of leafarea with height being associated with the development in space and time of the diversity of species.However, even in monocultures it is convenient to consider the canopy as being horizontally uniform andthe level of radiation constant in any layer. Even here, attenuation of light through the canopy iscomplicated by changing availability, quality and direction of incident light and it is necessary to makesome simplifying assumptions when calculating the proportion of light that is intercepted.
The Beer–Lambert Law, which describes absorption of light by plant pigments in solution, provides asimple approach which has been applied widely to a range of canopies. This function demonstrates thatthe absorption of light will be more or less decline exponentially with increasing intercepting area downthrough the canopy. Absorption of sunlight by photosynthesis occurs within a well-defined spectral band(400–700 nm) and matches a peak in energy distribution across the wavelength spectrum of sunlighttransmitted to the earth’s surface through our atmospheric window (as shown in Figure 12.1 at the startof the chapter).
Sunlight in this waveband can be represented as either a quantum flux or a radiant energy flux. Quantumflux, or more explicitly, photosynthetic photon flux density (PPFD, PAR), is simplified here to ‘photonirradiance’ (\(Q\)) and has units of µmol quanta m–2 s–1 (‘µmol quanta’ rather than ‘µmol photons’because quantum energy derived from photons drives photosynthesis). For the sake of making a cleardistinction, radiant energy flux is simplified to ‘irradiance’. In the present example, irradiance coincideswith photosynthetically active radiation (PAR) and is expressed as joules (J) per square metre per unittime. Depending on the application, time can span seconds, days or years, and is then coupled witheither joules, megajoules (MJ) or gigajoules (GJ).
On clear days, PAR represents about half of the total shortwave (solar) radiation or radiant energy flux\(I\) (expressed as J m–2 s–1) incident on a canopy, and is totally responsible for photosynthesis. Ifchanges in the spectral distribution of energy as it passes through the canopy are ignored, \(I\) and PPFDcan be used interchangeably in the analysis below. In practice, PPFD is attenuated more rapidly than \(I\)(that is, there is a proportionally larger change in PAR than total solar radiation (\(I\)) in moving from topto bottom of the canopy) because leaves are relatively transparent to the near-infrared part of the solarbeam.
Application of the Beer–Lambert Law shows that at any level of cumulative area \(F\) within the canopy,the rate of change of photon irradiance, \(Q\), within the canopy is given by:
\[ \mathrm{d} Q / \mathrm{d} F = -kQ_F \tag{12.2} \]
where \(k\) is the extinction or foliar absorption coefficient, a dimensionless parameter. \(k\) measuresthe fraction of incident photons absorbed by a unit of leaf area or conversely the fraction of leaf areaprojected onto the horizontal from the direction of the incident beam. For many species, foliage in thevertical plane is distributed approximately symmetrically about the midpoint of the canopy and mostabsorption of light will occur in the middle of the canopy. After integration, \(Q_F\) at any level \(F\) isgiven by:
\[ Q_F = Q_0 e^{–kF} \tag{12.3} \]
where \(Q_0\) is the PAR incident at the top of the canopy. At the base of the canopy, \(F\) is equal tothe leaf area index (LAI), a dimensionless number which expresses total projected leaf area of the canopyas a ratio of the ground area over which it is displayed. Thus the level of interceptance is an exponentialfunction of the product \(kF\). If a value of 0.5 is assigned to \(k\), then 95% light interception occurs at\(kF = 3\) which is equivalent to an LAI of 6 m2 leaf area m–2 ground area. Maximum values of LAI vary

Chapter 12 - Sunlight and plant production
http://plantsinaction.science.uq.edu.au/book/export/html/255[8/09/2017 2:59:23 PM]
with species, site, stress and season.
In practice, \(k\) is not a constant value for any canopy and varies with solar elevation, the ratio of directto diffuse beam irradiance and any changes in canopy structure or leaf inclination and orientation whichoccur seasonally or in response to the movement of leaves (e.g. heliotropism). For the majority ofcanopies, \(k\) varies from 0.3 to 1.3. Canopies with erectophile leaves (e.g. grasses) and high leafangles to the horizontal or with a clumped distribution have a lower \(k\) and intercept less light per unitof foliage compared to canopies with planophile leaves with a higher \(k\) (e.g. clovers) and low leafangles or a regular distribution. The cumulative leaf area required to intercept 95% of the radiationincident at the top of the canopy will be greater for canopies dominated by erectophile leaves or having aclumped distribution.
In many species and plant communities, leaf inclination may change from erectophile at the top of thecanopy to planophile at the bottom. This allows more even distribution and interception of light andreduces the proportion of leaves which is exposed at the top of a canopy to levels of light which aresaturating for photosynthesis and, conversely, reduces the proportion of leaves at the bottom of a canopywhich is exposed to levels below the light-compensation point for photosynthesis. For a canopy withleaves distributed randomly with respect to orientation and inclination, \(k\) is approximately 0.5(Monteith and Unsworth 1990) and this value is commonly assigned to \(k\) in the literature.
12.3.2 - Canopy productivityPhotosynthesis is driven by the fraction of radiation intercepted by the canopy and gross photosyntheticproduction (\(A_g\)), a measure of the total amount of CO2 fixed in photosynthesis, can be expressed as:
\[ A_g = A_0 [1 - exp(-kS_{a}W_{l})] \tag{12.4} \]
\(A_0\) is the gross photosynthetic production at full light interception and \(S_{a}W_{l}\) expresses LAIas the product of specific leaf area (\(S_{a}\), the ratio of leaf area:leaf dry mass) and dry mass of leaforganic matter (\(W_{l}\), often approximated as leaf dry mass).
Efficiency of light conversion to biomass (\( \varepsilon \))
As implied by Equation 12.4, there is a proportional relationship between production of dry mass andinterception of radiation (see Fig. 12.22), while LAI is a major determinant of photosynthetic production.The slope of this relationship is a measure of the conversion efficiency (\( \varepsilon \)) of light (photonirradiance if based on PAR) or irradiance (\(I\) if based on shortwave radiation) to dry mass. \(\varepsilon \) has units of g MJ–1 and values based on photon irradiance are approximately twice thosebased on \(I\). \( \epsilon \) can be considered to be the canopy-scale equivalent of \( \varphi \), thequantum yield of individual leaves. Values of \( \varepsilon \) based on absorbed radiation are net of anylight or radiation that is reflected upward from the direction in which the incident value is measured.
This proportional relationship was first clearly defined in the above terms for the seasonal growth oftemperate agricultural and horticultural crops in Britain (Monteith 1977, Fig. 12.22). It has since beenshown to hold for a range of vegetation types and environments. Proportionality occurs becausephotosynthesis by most leaves in a canopy tends to be light limited. Consequently any increase in lightintercepted or absorbed results in an increase in dry mass production. As crops grow from establishmentor plant communities develop from a state of initial colonisation to maturity, LAI increases, and a greaterleaf surface results in greater levels of light interception and rates of growth.
12.3-Ch-Fig-12.26.png

Chapter 12 - Sunlight and plant production
http://plantsinaction.science.uq.edu.au/book/export/html/255[8/09/2017 2:59:23 PM]
Figure 12.26 Above-ground dry mass production and intercepted radiation for eucalypts in plantationsin Tasmania and Victoria show a linear relationship. Closed symbols refer to different species orprovenances of the same species at Tasmanian sites. Open symbols refer to Eucalyptus globulus growingin Victoria. (Original data C.L. Beadle and G. Inions)
As predicted by theory, linear relationships between above-ground dry mass production and interceptedradiation have been observed for eucalypts in plantation forests in southeast Australia: \( \varepsilon \)was around 0.45 g MJ–1 (based on \(I\), Figure 12.26). Conversion efficiency was independent of speciesand provenance within species, and for one species, Eucalyptus globulus, was independent of site.Differences in growth rate between species, in this case during the early phase of forest growth, can beentirely a function of more rapid development of LAI in one species compared to another.
Comparative analyses of \( \varepsilon \) for different vegetation types are commonly based on above-ground dry mass (\(W_{a}\)) because of lack of information on below-ground biomass (\(W_{b}\)). \(\varepsilon \) based on \(W_{a}\) will be less than that based on \( W_{a} + W_{b} \) by the ratio\(W_{a} : (W_{a} + W_{b}) \). Partitioning of dry mass to roots may be substantially higher on a

Chapter 12 - Sunlight and plant production
http://plantsinaction.science.uq.edu.au/book/export/html/255[8/09/2017 2:59:23 PM]
resource-poor compared to a resource-rich site. Consequently, a comparison of \( \varepsilon \) betweensites based on \(W_{a}\) rather than \( W_{a} + W_{b} \) would lead to a relative underestimate of theefficiency of conversion of light to dry mass on poorer sites. Similarly, stress in response to soil waterdeficit, high vapour pressure deficit (leading to stomatal closure) or extremes of temperature will reduce\( \varepsilon \) and may also change the partitioning of dry mass. Reductions in \( \varepsilon \) occurin response to stomatal closure or to stresses of sufficient severity to reduce the quantum yield ofphotosynthesis. In effect, plants reduce photosynthesis by redirecting absorbed energy away fromphotochemistry and into photoprotective pathways which disperse absorbed energy as heat. \(\varepsilon \) thus embodies the photosynthetic history of a crop over a given interval and integrates theeffects of all environmental variables on photosynthetic utilisation of absorbed radiation.
In summary, forest canopies consist of multiple layers. A logarithmic gradient of sunlight availability existsfrom upper to lower layers, and leaf properties adjust accordingly.
Case study 12.1 - Pine forest production andlight use efficiency12.1-CS-Fig-1.png

Chapter 12 - Sunlight and plant production
http://plantsinaction.science.uq.edu.au/book/export/html/255[8/09/2017 2:59:23 PM]
Figure 1 Radiata pine (a provenance of Pinus radiata from the Pacific island of Guadalupe off the coastof Mexico) growing in a provenance trial on a dry site near Canberra. (Photograph courtesy P.E.Kriedemann)
Pines are a useful example to study patterns of forest production and light use efficiency because Pinus isthe most widely studied genus of trees and occurs in environments ranging from boreal zones to thetropics. Pines have been established as plantations worldwide, including on dry sites as shown in Figure 1.This low-input site resulted in a sparse canopy that would thicken considerably with additional water andnutrients but serves to illustrate how close planting results in straight stems with little taper. For closed-canopy pine forests across this diversity of environments, measured rates of annual above-ground drymatter production vary 30-fold from 0.2 to 5 kg m–2 year–1 with wood production ranging from nearzero up to 4.2 kg m–2 year–1 (Table 1). Can this huge range be explained from our knowledge ofphysiological and ecological processes, and, in particular, are differences in canopy use of sunlightresponsible?
12.1-CS-Tab-1.png
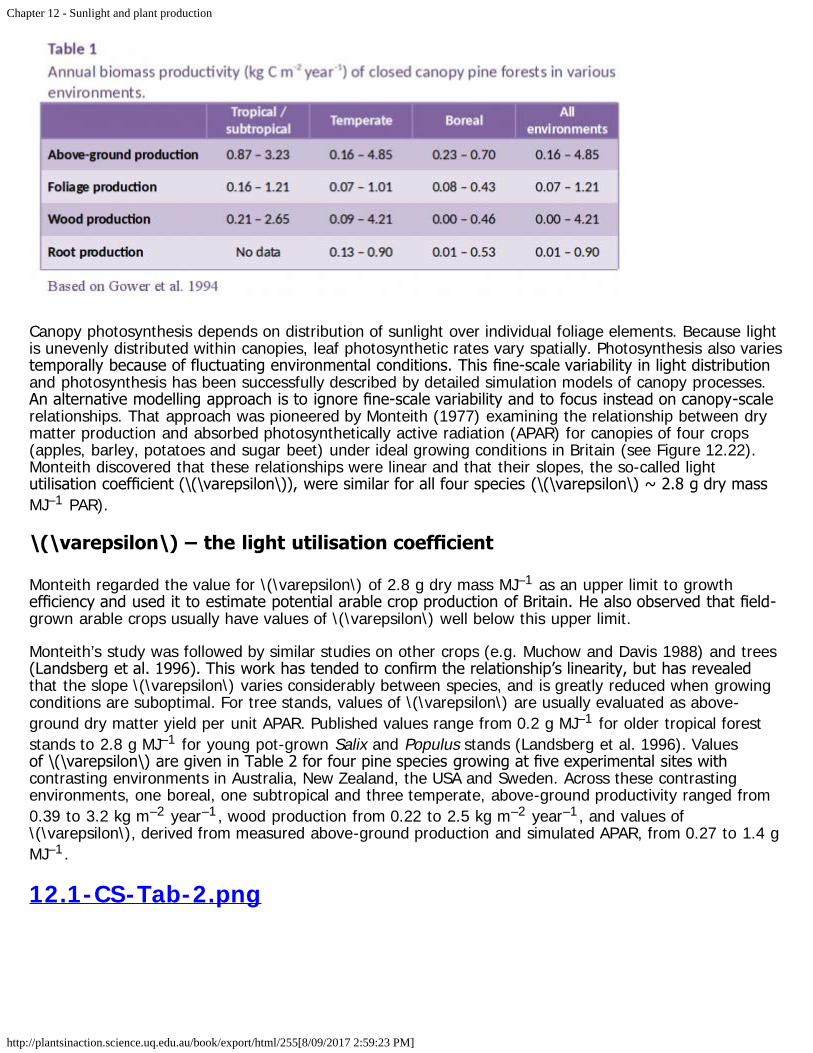
Chapter 12 - Sunlight and plant production
http://plantsinaction.science.uq.edu.au/book/export/html/255[8/09/2017 2:59:23 PM]
Canopy photosynthesis depends on distribution of sunlight over individual foliage elements. Because lightis unevenly distributed within canopies, leaf photosynthetic rates vary spatially. Photosynthesis also variestemporally because of fluctuating environmental conditions. This fine-scale variability in light distributionand photosynthesis has been successfully described by detailed simulation models of canopy processes.An alternative modelling approach is to ignore fine-scale variability and to focus instead on canopy-scalerelationships. That approach was pioneered by Monteith (1977) examining the relationship between drymatter production and absorbed photosynthetically active radiation (APAR) for canopies of four crops(apples, barley, potatoes and sugar beet) under ideal growing conditions in Britain (see Figure 12.22).Monteith discovered that these relationships were linear and that their slopes, the so-called lightutilisation coefficient (\(\varepsilon\)), were similar for all four species (\(\varepsilon\) ~ 2.8 g dry massMJ–1 PAR).
\(\varepsilon\) – the light utilisation coefficient
Monteith regarded the value for \(\varepsilon\) of 2.8 g dry mass MJ–1 as an upper limit to growthefficiency and used it to estimate potential arable crop production of Britain. He also observed that field-grown arable crops usually have values of \(\varepsilon\) well below this upper limit.
Monteith’s study was followed by similar studies on other crops (e.g. Muchow and Davis 1988) and trees(Landsberg et al. 1996). This work has tended to confirm the relationship’s linearity, but has revealedthat the slope \(\varepsilon\) varies considerably between species, and is greatly reduced when growingconditions are suboptimal. For tree stands, values of \(\varepsilon\) are usually evaluated as above-ground dry matter yield per unit APAR. Published values range from 0.2 g MJ–1 for older tropical foreststands to 2.8 g MJ–1 for young pot-grown Salix and Populus stands (Landsberg et al. 1996). Valuesof \(\varepsilon\) are given in Table 2 for four pine species growing at five experimental sites withcontrasting environments in Australia, New Zealand, the USA and Sweden. Across these contrastingenvironments, one boreal, one subtropical and three temperate, above-ground productivity ranged from0.39 to 3.2 kg m–2 year–1 , wood production from 0.22 to 2.5 kg m–2 year–1 , and values of\(\varepsilon\), derived from measured above-ground production and simulated APAR, from 0.27 to 1.4 gMJ–1.
12.1-CS-Tab-2.png

Chapter 12 - Sunlight and plant production
http://plantsinaction.science.uq.edu.au/book/export/html/255[8/09/2017 2:59:23 PM]
For the pine stands considered in Table 2, sufficient data are available to analyse causes of variation in\(\varepsilon\). A useful starting point for that analysis is the biochemical upper limit to \(\varepsilon\).That limit, determined by the quantum requirement of photosynthesis, is characterised by the quantumyield of photosynthesis, which for C3 plants (modified for the spectral composition of light andphotorespiratory carbon loss) is conservatively 0.06 mole CO2 per mole absorbed quanta, correspondingto an energy conversion efficiency of 6%. That efficiency can be converted to an equivalent lightutilisation coefficient if we know the energy content of incident light, a function of its spectralcomposition. Assuming an energy content of 0.22 MJ mol–1 and assuming the carbon content of biomassis 0.45 gives an equivalent light utilisation coefficient of approximately 7.3 g dry mass MJ–1 .
There are several reasons why this biochemical upper limit is not attained in nature. One reason is thatleaf photosynthetic efficiency declines as quantum flux increases; according to models of canopyphotosynthesis, this light saturation of photosynthesis leads to a reduction of 50–60% in photosyntheticcarbon gain (i.e. a loss factor of 0.45). Values of \(\varepsilon\) are further reduced because ofrespiratory losses associated with the maintenance of living tissue and the growth of new tissue; gasexchange measurements in pine forests show that this process leads to a reduction of 40–60% forclosed-canopy forests (loss factor = 0.5) (Figure 2). Another reason for the reduction of \(\varepsilon\) iscarbon allocation to root growth, approximately 15–25% for highly fertile stands (loss factor = 0.8). Thecombined effect of light saturation, respiratory losses and below-ground allocation is to reduce\(\varepsilon\) to 7.3 x 0.45 x 0.5 x 0.8 = 1.3 g MJ–1, a value which is similar to that estimated frommeasured growth of Pinus radiata in highly productive New Zealand and Canberra stands (Table 2).
Further reductions of \(\varepsilon\) occur if stands are nutrient, water or temperature limited, which isthe case for the other four stands in Table 2, or if trees suffer disease or insect damage. If we regard
–1
Chapter 12 - Sunlight and plant production
http://plantsinaction.science.uq.edu.au/book/export/html/255[8/09/2017 2:59:23 PM]
an \(\varepsilon\) value of 1.3 g MJ as the maximum achieved by fertile, well-watered, closed-canopypine stands, then the remaining reductions of \(\varepsilon\) at the stands in Canberra (control), Florida,Wisconsin and Sweden are approximately 50, 35, 80 and 60%, respectively. Stands experiencingtemperature extremes or water stress can have shortened effective growing seasons, whichaffect \(\varepsilon\) because radiation intercepted outside the active growing season is less efficientlyutilised. Estimated effective growing season lengths for the five sites are given in Table 2. The growingseason is shortest at the Wisconsin site, which experiences both harsh winters and hot, dry summers(\(\varepsilon\) = 0.27 g MJ–1), followed by the Swedish site, which experiences extremely cold winters(\(\varepsilon\) = 0.56 g MJ–1). For the control stand at Canberra, the effective growing season isreduced by summer droughts which cause stomata to close and photosynthesis to cease almost entirelyduring periods of extreme water stress (\(\varepsilon\) = 0.66 g MJ–1); note that above-groundproduction by this stand is less than half that of an irrigated + fertilised stand at the same site, whereasits value of APAR is only 15% lower.
Site nutrition can also affect \(\varepsilon\) by altering either total carbon gain, or the proportion ofcarbon allocated to root growth; for example, soil fertility is poor at the Florida, Sweden and Canberra(control) sites, all of which have low \(\varepsilon\) values. The Canberra experiment is an interestingillustration of the effect of nutrition on below-ground carbon allocation (Figure 2); fine-root production islowest on the irrigated + fertilised plot, 8% of net primary production (NPP) compared with 20% on thecontrol and irrigated stands (Ryan et al. 1996).
12.1-CS-Fig-2.png
Figure 2 Measured annual carbon fluxes for three Pinus radiata stands at a site near Canberra.Experimental treatments are control (C), irrigated (I) and irrigated + fertilised (IL). (Based on Ryan et al.
Chapter 12 - Sunlight and plant production
http://plantsinaction.science.uq.edu.au/book/export/html/255[8/09/2017 2:59:23 PM]
1996)
Several conclusions can be drawn from this analysis of light utilisation. First, the above \(\varepsilon\)model can explain observed productivities of fertile, well-watered pine stands as the estimatedbiochemical limit minus unavoidable losses associated with light saturation of photosynthesis, respirationand below-ground allocation. For these highly productive forests, the largest single loss factor for\(\varepsilon\) is associated with light saturation of photosynthesis (loss factor = 0.45). The magnitude ofthat reduction depends on both leaf physiology, particularly light-saturated rates of photosynthesis, andthe within-canopy light environment, which in turn is a function of cloudiness and canopy structuralproperties such as shoot structure and crown architecture.
A second conclusion from the data in Table 2 is that in four of the six stands, extreme weather conditionsreduce the effective length of the growing season, and that this reduction is critical in explainingdifferences in \(\varepsilon\) among forest stands. Shortened growing seasons appear to be the primaryreason why \(\varepsilon\) is low for the Wisconsin, Swedish and Canberra (control) stands. For speciesexperiencing cold winters (Wisconsin and Sweden), it is important to understand how temperature anddaylength affect leaf phenology, especially rates of leaf growth and photosynthesis as trees emerge fromwinter dormancy. The low value of \(\varepsilon\) for Pinus radiata at the control stand in Canberra isdue largely to water stress, with low annual rainfall coupled with high transpiration rates in summermonths, leading to rapid depletion of soil water reserves and a shortened effective growing season.
A sidelight to the above discussion is the observation that NPP is proportional to APAR at the canopyscale (Section 12.3.2, Figure 12.26), although leaf photosynthetic rates saturate at high quantum flux.This puzzling observation appears to be largely explained by the different time scales used inmeasurements of NPP and photosynthesis; NPP is usually measured over a growing season whereasphotosynthesis is measured over periods of seconds or minutes. When canopy models are used toevaluate short-term (e.g. daily) NPP, saturation is found at high quantum flux (Medlyn 1996; Sands1996). However, simulated annual values of \(\varepsilon\) are relatively constant because annualincident PAR varies little from year to year. Other studies have proposed that \(\varepsilon\) is constantbecause of compensatory effects of leaf area index, incident PAR and leaf nitrogen content (e.g. Sands1996). Either way, prediction and observation of NPP have proved congruent across a wide range ofgenotype × environment combinations, and confirm the robustness of process-based simulation models.
References
Gower ST, Gholz HL, Nakane K, Baldwin VC (1994) Production and carbon allocation patterns ofpine forests. In HL Gholz, S Linder, RE McMurtrie, eds. Environmental Constraints on the Structure andProductivity of Pine Forest Ecosystems: A Comparative Analysis. Ecological Bulletins (Copenhagen), Vol.43. Munksgaard International Booksellers: Copenhagen, pp 115-133
Landsberg JJ, Prince SD, Jarvis PG et al. (1996) Energy conversion and use in forests: an analysis offorest production in terms of radiation utilization efficiency (ε). In HL Gholz, K Nakane, H Shimoda, eds.The Use of Remote Sensing in the Modeling of Forest Productivity. Kluwer, Dordrecht, pp 273–298
McMurtrie RE, Gholz HL, Linder S et al. (1994) Climatic factors controlling the productivity of pinestands: a model-based analysis. In Ecological Bulletins (Copenhagen), Vol. 43. As above, pp 173–188
Medlyn BE (1996) Interactive effects of atmospheric carbon dioxide and leaf nitrogen concentration oncanopy light use efficiency: a modeling analysis. Tree Physiol 16: 201–209
Monteith JL (1977) Climate and the efficiency of crop production in Britain. Phil Trans Royal SocLondon, Series B 281: 277–294
Muchow RC, Davis R (1988) Effect of nitrogen supply on the comparative productivity of maize andsorghum in a semi-arid tropical environment. II. Radiation interception and biomass. Field Crops Res 18:31–43

Chapter 12 - Sunlight and plant production
http://plantsinaction.science.uq.edu.au/book/export/html/255[8/09/2017 2:59:23 PM]
Ryan MG, Hubbard RM, Pongracic S, Raison RJ, McMurtrie RE (1996) Foliage, fine-root, woody-tissue and stand respiration in Pinus radiata in relation to nitrogen status. Tree Physiol 16: 333–343
Sands PJ (1996). Modelling canopy production. III. Canopy light-utilisation efficiency and its sensitivityto physiological and environmental variables. Aust J Plant Physiol 23: 103–114
12.4 - Light and horticultural production12.4-Ch-Fig-12.27.png
Figure 12.27 Peach trees trained to a Tatura trellis. (Photograph courtesy P.E. Kriedemann)
Compared to annual crops or plantation forests, perennial horticultural fruit crops offer wide flexibility inthe physical arrangement of their canopies in space. Not only can the size and shape of the canopy bedramatically altered by spacing, pruning and training, but the canopy can be physically constrained by asupport structure of posts and wires into various forms, for example the V shape of the Tatura peachtrellis (Figure 12.27; van den Ende et al. 1987). Pruning of grapevines takes a variety of divided canopyforms (Figure 12.28).
12.4-Ch-Fig-12.28.png
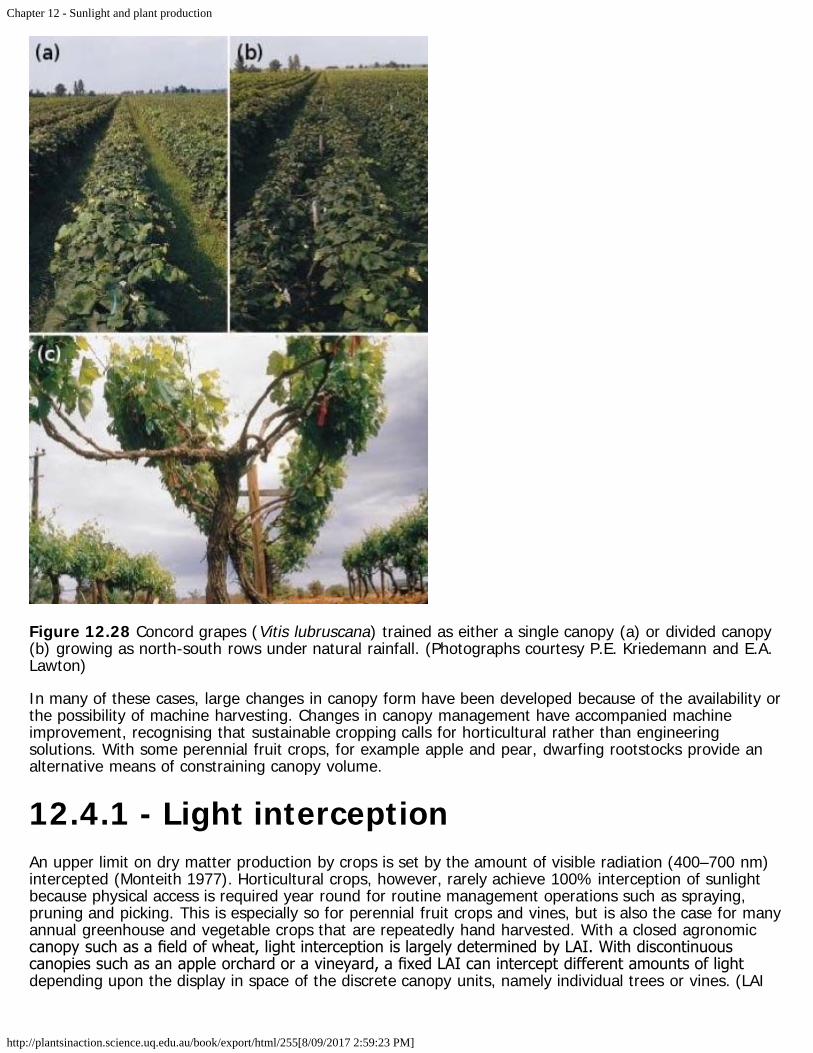
Chapter 12 - Sunlight and plant production
http://plantsinaction.science.uq.edu.au/book/export/html/255[8/09/2017 2:59:23 PM]
Figure 12.28 Concord grapes (Vitis lubruscana) trained as either a single canopy (a) or divided canopy(b) growing as north-south rows under natural rainfall. (Photographs courtesy P.E. Kriedemann and E.A.Lawton)
In many of these cases, large changes in canopy form have been developed because of the availability orthe possibility of machine harvesting. Changes in canopy management have accompanied machineimprovement, recognising that sustainable cropping calls for horticultural rather than engineeringsolutions. With some perennial fruit crops, for example apple and pear, dwarfing rootstocks provide analternative means of constraining canopy volume.
12.4.1 - Light interceptionAn upper limit on dry matter production by crops is set by the amount of visible radiation (400–700 nm)intercepted (Monteith 1977). Horticultural crops, however, rarely achieve 100% interception of sunlightbecause physical access is required year round for routine management operations such as spraying,pruning and picking. This is especially so for perennial fruit crops and vines, but is also the case for manyannual greenhouse and vegetable crops that are repeatedly hand harvested. With a closed agronomiccanopy such as a field of wheat, light interception is largely determined by LAI. With discontinuouscanopies such as an apple orchard or a vineyard, a fixed LAI can intercept different amounts of lightdepending upon the display in space of the discrete canopy units, namely individual trees or vines. (LAI

Chapter 12 - Sunlight and plant production
http://plantsinaction.science.uq.edu.au/book/export/html/255[8/09/2017 2:59:23 PM]
for discontinuous canopies is calculated from the total area of leaves on the plant divided by the areaallocated to the plant.)
Light interception of horticultural crops can be altered by changing spacing, tree height, tree shape and/orrow orientation. An illustration of this is given in Table 12.1 using a simulation model of light interception(Palmer 1989). The model calculated light interception over a whole day and allowed for change inincident radiation, sun angle (both elevation and azimuth) and sky light. The model was used to calculatelight interception under sunny conditions by apple trees arranged in continuous rows, of truncated conicalcross-section, in midsummer at Riwaka, Nelson, New Zealand. For a constant LAI, light interceptionincreased by increasing hedge height, closer row spacings and planting in a north–south rather than aneast–west orientation (Table 12.1). Light interception varied by a factor of two, from 27% by short wide-spaced hedges in east–west (EW) rows to 55% by tall close spacings in north–south (NS) rows.Differences due to row orientation will be smaller in cloudy regions where more of the incoming light isdiffuse.
12.4-Ch-Tab-12.1.png
In Table 12.1, the density of leaves within the tree volume changes with height and row spacing tomaintain a constant LAI. Differences in light interception would be much larger if leaf area density ratherthan LAI was maintained at a constant. Nevertheless, data given in Table 12.1 for discontinuous canopiesshow that the relationship between LAI and light interception depends on the physical arrangement of

Chapter 12 - Sunlight and plant production
http://plantsinaction.science.uq.edu.au/book/export/html/255[8/09/2017 2:59:23 PM]
foliage in space. Calculations for Table 12.1 assume an extinction coefficient appropriate for apples. Lightinterception would have to be recalculated for other crops such as peach and cherry that have lowerextinction coefficients (Flore 1994).
As discussed in Section 12.3, the relationship between light interception (\(F\)) and LAI of a continuouscanopy follows the Beer–Lambert Law, and can be approximated by Equation 12.5. Again, \(k\) (theextinction coefficient) is dependent upon leaf angle distribution, leaf transmission to sunlight and whetherthe foliage is random, regular or clumped. \(k\) varies between about 0.3 for erect foliage and 1.0 forcanopies comprising horizontally disposed leaves. In general terms,
\[ F = 1 - e^{–k\mathrm{LAI}} \tag{12.5} \]
Unlike closed canopy forests or a continuous crop cover, sunlight interception by discontinuous canopiesconsists of two parts, a fraction determined by the overall form and extent of the canopy(\(F_\mathrm{max}\)) and a leaf area part that determines how close a particular orchard approachesthe maximum interception attainable. \(F_\mathrm{max}\) would be reached if LAI was infinite.Accordingly, Equation 12.5 can be rewritten for discontinuous canopies as Equation 12.6, where \(L' =\mathrm{LAI}/F_\mathrm{max}\) (Jackson and Palmer 1979).
\[ F = F_\mathrm{max} (1 - e^{–kL'}) \tag{12.6} \]
This relationship for a discontinuous canopy contrasts with that for the continuous canopy (Equation12.5) where an infinite LAI would cause complete exclusion of light. When light interception by two of theorchards in Table 12.1 is plotted as a function of LAI (Figure 12.29) and compared with a continuouscanopy with the same extinction coefficient, light interception by either orchard approached an asymptotewell short of infinite LAI.
12.4-Ch-Fig-12.29.png
Figure 12.29 Calculated interception of sunlight as a function of LAI and canopy form. Light interceptionis calculated for a sunny day on 31 January at Riwaka, New Zealand (Lat. 41°6'S), for apply orchardsarranged in continuous hedgerows. (Original data courtesy J.W. Palmer)
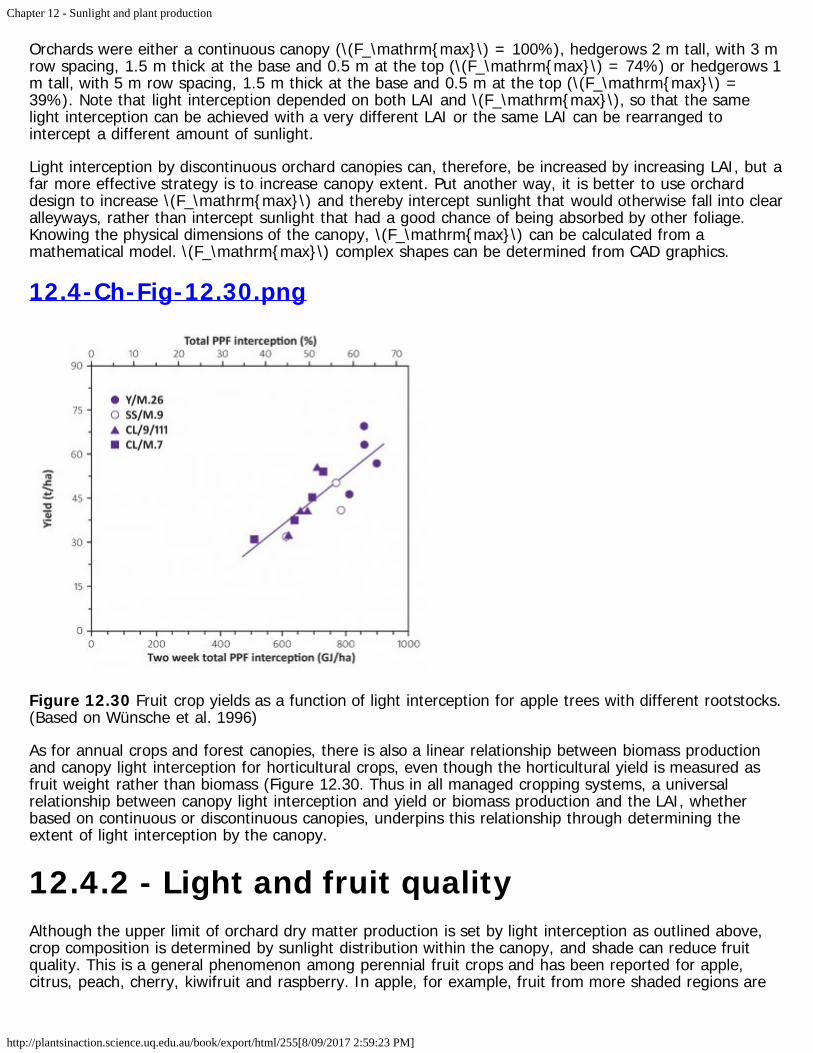
Chapter 12 - Sunlight and plant production
http://plantsinaction.science.uq.edu.au/book/export/html/255[8/09/2017 2:59:23 PM]
Orchards were either a continuous canopy (\(F_\mathrm{max}\) = 100%), hedgerows 2 m tall, with 3 mrow spacing, 1.5 m thick at the base and 0.5 m at the top (\(F_\mathrm{max}\) = 74%) or hedgerows 1m tall, with 5 m row spacing, 1.5 m thick at the base and 0.5 m at the top (\(F_\mathrm{max}\) =39%). Note that light interception depended on both LAI and \(F_\mathrm{max}\), so that the samelight interception can be achieved with a very different LAI or the same LAI can be rearranged tointercept a different amount of sunlight.
Light interception by discontinuous orchard canopies can, therefore, be increased by increasing LAI, but afar more effective strategy is to increase canopy extent. Put another way, it is better to use orcharddesign to increase \(F_\mathrm{max}\) and thereby intercept sunlight that would otherwise fall into clearalleyways, rather than intercept sunlight that had a good chance of being absorbed by other foliage.Knowing the physical dimensions of the canopy, \(F_\mathrm{max}\) can be calculated from amathematical model. \(F_\mathrm{max}\) complex shapes can be determined from CAD graphics.
12.4-Ch-Fig-12.30.png
Figure 12.30 Fruit crop yields as a function of light interception for apple trees with different rootstocks.(Based on Wünsche et al. 1996)
As for annual crops and forest canopies, there is also a linear relationship between biomass productionand canopy light interception for horticultural crops, even though the horticultural yield is measured asfruit weight rather than biomass (Figure 12.30. Thus in all managed cropping systems, a universalrelationship between canopy light interception and yield or biomass production and the LAI, whetherbased on continuous or discontinuous canopies, underpins this relationship through determining theextent of light interception by the canopy.
12.4.2 - Light and fruit qualityAlthough the upper limit of orchard dry matter production is set by light interception as outlined above,crop composition is determined by sunlight distribution within the canopy, and shade can reduce fruitquality. This is a general phenomenon among perennial fruit crops and has been reported for apple,citrus, peach, cherry, kiwifruit and raspberry. In apple, for example, fruit from more shaded regions are

Chapter 12 - Sunlight and plant production
http://plantsinaction.science.uq.edu.au/book/export/html/255[8/09/2017 2:59:23 PM]
smaller, and have less red colour and lower soluble solids. There are also effects on apple quality afterstorage, with shaded fruit of Cox’s Orange Pippin tending to suffer more from shrivel and core flush andless from bitter pit than fruit from well-exposed regions of the tree. Fruit of satsuma mandarins grown inshaded regions of the trees are smaller, with a higher acid content and lower sugar content than fruitgrown in well-exposed parts of the canopy.
With both peaches and cherries, shading has been found to reduce fruit colour, soluble solids and fruitsize and delay abscission and maturity. Kiwifruit from shaded regions of the canopy, or individual fruitwhich has been artificially shaded during the season, show reduced fruit fresh weight, soluble solids,firmness and chlorophyll concentration in the mesocarp compared to well-exposed fruit. With grapevines,too, shaded fruit have generally lower sugar, total phenol and anthocyanin but higher pH, malate,potassium and titratable acidity than fruit grown in well-exposed positions in the canopy. Thesedifferences in grape quality have carried through to the wine quality made from the grapes. Aconsequence of decreased sugar levels in shaded grapes is a delay in harvesting. This may put crops atrisk in climatically marginal regions.
Generalisations on sunlight and fruit quality have been derived from shading experiments on whole treesor parts of trees, or from correlation studies of fruit quality and irradiance in different parts of the canopy.Consequently both fruit and foliage have been subjected to reduced light, but some features in grapesand apples, such as anthocyanin development, vary according to illumination of the fruit itself. Withgrapes, cluster shading reduces fruit anthocyanin and total soluble phenolics, while leaf shading results insmaller berries with lower glucose and fructose content.
Shade within orchard trees can arise from self-shading or from adjacent trees or shelterbelts. Light levelsin midsummer within well-spaced, traditionally pruned large peach trees can drop to 4–15% of incomingradiation. Sour cherry trees tend to be more dense, and light levels as low as 2–4% have been reported.Vigorous grape canopies can be very dense, with irradiance within the canopy reduced to less than 1%of ambient. With such dense canopies, between-row shading will be unacceptable if the ratio betweencanopy height and clear alleyway spacing exceeds 1:1 (Smart 1989). With the much more open canopiesof apples, such ratios may be less useful, as acceptable light distribution within the trees can be obtainedover a wide range of ratios of canopy height to clear alleyway spacing. With apple canopies, a ratiobetween actual light interception and \(F_\mathrm{max}\) may be more useful. If this ratio exceeds 0.7then self-shading is probably excessive.
Overall effects of shade on fruit quality are very clear, but processes responsible are not so clear. Shadereduces PAR and, therefore, local photosynthetic activity; but canopy shade also reduces temperature(Greer and Weedon 2012) and changes wavelength distribution of transmitted light. Leaves absorbstrongly in the visible part of the spectrum (400–700 nm), but have a high transmittance and reflectanceto wavelengths in the near infrared (see Figure 12.1 at start of this chapter). This difference in lightquality between incident and transmitted sunlight is usually expressed as a red/far-red ratio, that is, aratio between irradiance around 660 nm compared with 730 nm wavebands. These wavebandscorrespond to peaks of absorption by phytochrome (Chapter 8), and are strongly implicated indevelopmental responses to canopy shade. Correlated changes in irradiance and the red/far-red ratio ofcanopy light make it difficult to separate the effects of changing irradiance from the effects of a change inthe red/ far-red ratio, but it is likely that changes in berry composition are due to combined effects ofirradiance and red/far-red ratio.
12.4.3 - Light, flower bud differentiation andfruit setDue to the perennial nature of fruit trees, environmental conditions in one season can have carry-overeffects on growth and development during the subsequent season. In seasonally deciduous trees andvines, flowers that emerge each spring were actually initiated during the previous growing season, andconditions prevailing at that time will have influenced the extent and intensity of flower bud
Chapter 12 - Sunlight and plant production
http://plantsinaction.science.uq.edu.au/book/export/html/255[8/09/2017 2:59:23 PM]
differentiation. In temperate horticulture, flower initiation is not a continuous process but may berestricted to several weeks during mid to late summer, followed by several months of continuingdevelopment before passing into dormancy over winter. Floral development is then completed during thefollowing spring ahead of flower emergence. In addition to changes in fruit quality of current crops,canopy shade during summer will also reduce flower bud initiation and differentiation.
Flower bud reduction due to shading seems to be a general phenomenon in perennial fruit crops and hasbeen reported for apple, pear, apricot, peach, coffee, cacao and grape. With grape, the number and sizeof cluster primordia generally increases with increasing light. In this case, plants are responding to lightquantity rather than quality (expressed as changes in the red/far-red ratio). Cultivars differ in theirresponse to shade. Sultana (syn. Thompson Seedless) requires approximately 30% full sun for clusterinitiation compared to 10% for Rhine Riesling. Timing of shading is also important for grapes. Shading inthe period during bud development of grape in late spring has the greatest negative effect on flowerinitiation.
In citrus, shading may not of itself reduce flowering but can induce heavy fruit abscission. Similarly,shading whole apple trees 14–28 d after full bloom can result in very heavy fruit loss. Two days shadingwith shade cloth transmitting 8% light was sufficient to reduce fruit set by 80% (Byers et al. 1991). Soeffective is this treatment that deep shade could work as a non-chemical fruit thinner! In sour cherry,fruit set is adversely affected by light levels within the canopy below 20%, and flower bud initiationrequires an irradiance of 15–20% full sun. Shading of whole vines or shoots of kiwifruit during summercan reduce flowering the following spring. Again, as with grapes, changes to the red/far-red ratio did notalter the flowering response of kiwifruit vines to total irradiance. Yields of kiwifruit vines next toshelterbelts are significantly lower than those from vines in the centre of fruit blocks, due presumably toa reduction in flowering as a result of shade from the shelterbelt. This can depress yield by two thirds.
While shading generally reduces fruit quality, excess solar radiation can lead to serious downgrading offruit quality. Apples, grapes and kiwifruit suffer from sunburn, particularly where the fruit has beengrowing in the shade and then is thrust into full sunlight by movement of branches due to weight of fruitor to summer pruning or defoliation removing foliage that previously shaded the fruit. This tends to be amuch larger problem in regions of high solar radiation receipt than cloudy areas.
12.4.4 - Orchard design, canopy managementand light interceptionPerennial fruit orchards do offer great potential for modification of light and temperature environmentswithin canopies by pruning, tree training, tree size, row spacing and row orientation. Because of the greatvariety of ways of arranging the foliage in space, a number of models have been written to examine therelative importance of some of these factors in influencing not only light interception (Table 12.1) but alsosunlight distribution within the canopy (Palmer 1989; Wagenmakers 1991), as this can have such aprofound effect upon the quality of the fruit as already outlined.
In addition, field experiments to examine these effects are very expensive and time consuming to set upand run, so models offer a very economical way of examining light interception and distribution withininnumerable canopy forms. As there is often a large dollar premium for quality, the economic success ofany production system is largely determined by the yield of high-quality fruit, rather than the total yield.That does not mean, however, that high total yield and high-quality yield are mutually exclusive. Withgrapevines, Smart (1989) has consistently argued that high yields of high-quality grapes are achievablevia correct canopy management.
Highly productive orchards and vineyards, therefore, have a balance of vegetative and reproductivegrowth, with fruiting zones maintained in a high light environment. Examples of how this has beenachieved will now be presented for apples, peaches and grapes. In each case only one system isdescribed, although there are many other successfully managed systems, particularly in vineyards.

Chapter 12 - Sunlight and plant production
http://plantsinaction.science.uq.edu.au/book/export/html/255[8/09/2017 2:59:23 PM]
(a) Apples
In New Zealand, Tustin et al. (1990) have sought to combine requirements for precocity, high yields ofhigh-quality fruit and good light penetration into the canopy in their slender pyramid tree form. This hasbeen developed with trees on semi-vigorous rootstocks at a tree density of about 700 trees per hectare.The form is basically a central leader tree, that is, one central vertical trunk, on which are borne thefruiting branches. Early tree management is aimed at developing a permanent, strong, spreading basaltier of four to five branches emanating from the central leader at wide angles for strength and toencourage early fruiting. Pruning is minimal in the early years, with unwanted shoots being removedduring the growing season when they are still small. The upper part of the tree is developed as an open,well-spaced arrangement of whorls of shorter branches arising directly from the central leader. Theseupper branches are removed when they become too large or pendulant and are replaced by naturalregrowth. Each tree is maintained in an overall pyramidal form to encourage light penetration into allparts of the canopy. Yields of Royal Gala apples, for example, have been over 50 t ha–1 in the third yearrising to over 100 t ha–1 by year six.
(b) Peaches
Trees on a Tatura trellis (Figure 12.27) are trained into two planar canopies inclined at an angle of 60ºfrom the horizontal, and held by a trellis system of posts and wires. The system is designed to encourageprecocity by using 2,000 trees per hectare and rapidly filling the trellis structure with fruiting branches.Within each arm, the canopy itself is shallow to encourage good light penetration. Summer pruning ofunwanted, upright vegetative growth is practised to maintain a high, uniform light interceptionenvironment along each arm. Vegetative growth has also been successfully controlled in the dryenvironment of Tatura by regulated deficit irrigation.
The Tatura trellis is also designed for mechanical picking. A rigid and shallow canopy ensures that fruitcan fall onto the catching frame with minimal chance of damage. As peaches bear fruit on one-year-oldwood, yields of Golden Queen on Tatura trellis in year two have reached 28 t ha–1 rising to a maximumof 86 t ha–1 by year four (van den Ende et al. 1987). Other stonefruit and pomefruit (pipfruit) have alsobeen grown successfully with this management system.
(c) Grapes
Traditional pruning of grapevines was aimed at producing a limited number of moderate-sized clusters ofberries to facilitate hand picking. Consequently, pruning removed large amounts of young wood so thatgrowth of vigorous shoots was stimulated. With the advent of mechanical picking for wine grapes,however, this constraint has been removed as the harvesters are capable of efficiently removing theberries from large and small grape bunches. This has consequently brought about new grapevine pruningand training techniques, particularly in regions with long growing seasons, irrigation and high vigour suchas Australia, Chile and California.
Minimal pruning of cordon-trained vines (MPCT) is one such example from Australia. Each vine is initiallydeveloped conventionally with two or four permanent horizontal arms or cordons. From year three, vinesare minimally pruned — low hanging canes are removed. Consequently MPCT vines carry far more budsover from one year to the next, but competition between these growing points results in shorter shoots,with shorter internodes, and higher yields made up of a large number of small clusters of berries wellexposed to the light. The resulting wine quality is high and comparable with that from conventionallypruned vines.
12.5 - Ultraviolet radiationThe solar UV spectrum (Figure 12.31) extends from 100 to 400 nm, and has been divided into three

Chapter 12 - Sunlight and plant production
http://plantsinaction.science.uq.edu.au/book/export/html/255[8/09/2017 2:59:23 PM]
bands: UV-A, 315 – 400 nm; UV-B, 280 – 315 nm; and UV-C, 100 – 280 nm. These divisions aresomewhat arbitrary (the UV-A/UV-B boundary ranging from 315 to 320 nm and the UV-B/UV-C boundaryfrom 280 to 290 nm) and relate to effects that each band has on biological systems.
The shortest UV wavelengths reaching ground level are in the UV-B range (280–320 nm). Thiswavelength range represents up to 1.5% of extraterrestrial irradiance, and it is attenuated to 0.5% orless of total irradiance reaching the earth’s surface (Figure 12.31). While UV-B is only minor in terms oftotal solar irradiance at ground level, the high energy of UV photons make UV-B a photo-chemicallyactive and biologically significant form of radiation. Proteins, DNA and RNA, absorb UV-B radiationstrongly (Figure 12.31) and are thus prone to damage. As production and destruction of stratosphericozone is largely dependent on absorption of solar UV, the ozone ‘layer’ essentially shields the earth’ssurface from most UV radiation. However, even small increases in UV-B irradiation arising from depletionin stratospheric ozone could have significant effects on biological systems.
12.5-Ch-Fig-12.31.png
Figure 12.31 Upper portion, Spectral irradiance of terrestrial and extraterrestrial solar radiation togetherwith that generated by a typical UV sunlamp. The shift to lower UV wavelengths of terrestrial radiationdue to ozone depletion generalised UV action spectrum for plant damage is shown. Lower portion,Relative absorption of UV radiation by nucleic acids, proteins and flavoproteins. (Original diagram M.M.Caldwell)
UV-B irradiance rose markedly during the 1960s, due to ozone depletion. In addition, South polarstratospheric ozone suffers enhanced depletion each southern hemisphere spring, and the south polar'ozone hole' region reached an area of about 24 million square kilometres on 7 October 1994.

Chapter 12 - Sunlight and plant production
http://plantsinaction.science.uq.edu.au/book/export/html/255[8/09/2017 2:59:23 PM]
A question remains about the causes of the ozone hole. Notwithstanding a consensus on stratosphericchemistry and UV-B among atmospheric scientists, could the ozone hole be a ‘natural’ phenomenon?
12.5-Ch-Fig-12.32.png
Figure 12.32 Reciprocal variation in atmospheric ozone over the South Pole (open symbols), andflavonoid content of the moss Bryum argenteum (solid symbols). Ozone concentration is indicated asDobson units which represent the physical thickness of the ozone layer at a pressure of one atmosphere(e.g. 300 Dobson units = 3 mm). (Original data R.K. Markham)
Ground-based measurements of ozone over the South Pole made between 1964 and 1986 imply thatozone depletion over the Antarctic is not necessarily a consequence of recent human activity and mayhave been influenced by ‘natural’ processes. This view was supported by measurements of flavonoidlevels in samples of the moss Bryum argenteum (Figure 12.32). Flavonoids are synthesised in Bryum as aUV-B-screening pigment and synthesis is sensitive to small changes in UV-B irradiation. Samples ofBryum collected from the Ross Sea area between 1957 and 1989 showed that flavonoid content rosemarkedly during the mid-1960s. This was correlated with a reduction in ozone levels at the time, butahead of any serious accumulation of CFCs (chlorofluorocarbon compounds) that are considered to affectthe atmospheric concentrations of ozone. Key agents in this mid-1960s ozone depletion are believed toinclude altered sunspot activity, emissions from volcanic eruptions and atmospheric tests of nuclearweapons in the early 1960s.
12.5.1 - Ultraviolet radiation and plant biologyInvestigations of UV effects on plant biology largely depend on the use of UV-B emitting lamps in bothlaboratory and field. Interpretation of results from such systems is, however, restricted by an inability tomimic the solar spectrum precisely (Figure 12.31). As a consequence, comparisons between species withrespect to UV-B sensitivity, and analyses of processes responsible for variation in sensitivity, must betreated circumspectly. Despite these methodological limitations, overall outcomes are unambiguous: UV-Bradiation impacts on many aspects of plant biology, as reviewed by Tevini (1994) and Bornman andTeramura (1993).

Chapter 12 - Sunlight and plant production
http://plantsinaction.science.uq.edu.au/book/export/html/255[8/09/2017 2:59:23 PM]
(a) Growth and development
Sensitivity to UV-B irradiation includes any morphological, physiological or biochemical change induced byUV-B. Significant effects have been reported for about half of the 300 or so crop species and cultivarsstudied so far, with some species more susceptible than others (Table 12.2). Sensitivity is noticeable inplant growth and development. Reduction in leaf area, stem growth (stunting) and total plant biomassare commonplace. Additional symptoms include bronzing and glazing of leaf surfaces.
12.5-Ch-Tab-12.2.png
Growth reductions depend not only on the level of UV-B exposure but on the associated photonirradiance. Partitioning of growth to different organs, for example altered internode length, or leafproduction, is also sensitive to UV-B irradiation. Such morphological changes may not be significant toplants in isolation but may influence competitive interactions, and especially their competition forsunlight. Sensitivity to UV-B irradiation also varies with life cycle. Seedlings are especially vulnerable, asare mature plants under-going their transition from vegetative growth to reproductive development.
(b) Cell physiology
Several sets of processes at both cellular and molecular levels which are critical to plant growth andreproductive development appear to be affected by absorption of UV-B radiation. Especially prominentare photosynthesis, signal transduction and nucleic acid metabolism.
In general, UV-B radiation causes a net inhibition of photosynthesis in a wide range of plants. Fromlaboratory studies, this inhibition appears to arise from disruptions at a number of points in thephotosynthetic cycle, including disruption of PSII reaction centres (Strid et al. 1990), a decrease inRubisco activity and damage to photosynthetic pigments (chlorophylls and carotenoids). Stomatalfunction, and thus leaf gas exchange, is also commonly impaired.
Alterations in plant growth induced by UV-B radiation have been partly attributed to changes in nucleicacid structure and function (Tevini 1994). DNA absorbs strongly in the UV region and is thus especiallyprone to damage by UV-B radiation (Figure 12.31). The most common lesions are breaks in DNA chains,with a resultant production of thymine dimers. They in turn interfere with accurate base pairing, leading

Chapter 12 - Sunlight and plant production
http://plantsinaction.science.uq.edu.au/book/export/html/255[8/09/2017 2:59:23 PM]
to a disruption of transcription and replication of DNA (Stapleton 1992). These disruptions amount to amutagenic action for UV radiation in many organisms. Proteins and RNA can also absorb UV-B and areinactivated as a result, but this loss is of secondary importance due to their relative abundance comparedwith DNA (Stapleton 1992).
Activation and photo-deactivation of important signal molecules, such as hormones and photoreceptors,may also compound effects of UV-B irradiation on plant growth and development. For example, cellextension in many plants is influenced by indole acetic acid (IAA) which absorbs in the UV-B region and isphoto-oxidised to 3-methyleneoxindole, an inhibitor of hypocotyl growth when exogenously applied. Incontrast, irradiation with UV-B can induce enzyme activity in the shikimic acid pathway, which regulatesthe synthesis of a broad array of plant compounds, ranging from flavonoids to lignin, all of which areimportant to plant function, including tolerance to UV-B radiation.
(c) Reproduction
Flowering, pollination and seed development are variously affected by UV-B irradiation. Flowering appearsto be disrupted by UV-B radiation by decreases in flower number and alteration in timing reported in thefew species so far studied. Such effects may have important consequences for natural plant populations,which rely on the synchrony of flowering with the presence of appropriate insect pollinators.
Although pollen appears resilient to UV-B radiation damage, owing to high levels of flavonoids in theanthers and pollen wall, germinating pollen tubes are highly sensitive to UV radiation and suffer fromlarge decreases in growth rate. Such disruption can lead to lowered fertilisation success and decreases inseed yield.
(d) Ecology
Genetic variation in sensitivity to UV-B radiation has implications for plant competition and thus plantecosystem dynamics and community structure, in both natural and managed ecosystems. Competitionbetween agricultural crops and associated weeds may be altered under enhanced UV-B irradiation. In thefew studies considering the impact of UV-B irradiation on natural plant communities, most notable is thework of Caldwell et al. (1982). They found arctic plant species were much more sensitive to UV-B, bothin terms of growth and reproduction, than alpine species. Arctic species grow under a naturally low UV-Benvironment, whereas alpine species grow under a naturally high UV-B environment by virtue of higheraltitude. Arctic plant communities could thus be altered to a greater extent than alpine communities byany substantial rise in natural UV-B.
(e) UV-B tolerance mechanisms
Many organisms have evolved mechanisms to undo the molecular damage caused by UV radiation.Possibly the most adaptive are terrestrial plants that rely on full sunlight for photosynthesis. Protectivemechanisms can be classified into two main classes: (1) those whereby UV damage is repaired or itseffects negated or minimised, and (2) those whereby the amount of UV radiation actually reachingsensitive areas is reduced. While protective in nature, all of these mechanisms impose an energy cost onplants so adapted.
For the first class of protective mechanism, organisms have developed three important repair processesfor UV-induced DNA damage (Stapleton 1992): photoreactivation, excision and repair of DNA, and post-replication repair. Photoreactivation is the light-induced enzymatic process which cleaves pyrimidinedimers formed by UV radiation — thus restoring proper base pairing. Excision and repair of DNA involvesthe excision of UV photoproducts from DNA molecules (this mechanism requires no light energy and usesundamaged DNA templates as a guide). Post-replication repair occurs where DNA lesions are bypassedduring DNA replication and information from the sister duplex is later used to fill gaps.
As mentioned above, plant growth and development is slowed by exposure to enhanced UV-B radiation.Such delay also minimises adverse effects from damage that has occurred. Growth delay and slower cell

Chapter 12 - Sunlight and plant production
http://plantsinaction.science.uq.edu.au/book/export/html/255[8/09/2017 2:59:23 PM]
division provides additional time for DNA repair mechanisms to operate ahead of any recommencement inDNA replication.
12.5-Ch-Fig-12.33.png
Figure 12.33 Reflection, refraction and absorption of incident UV-B radiation by a typical leaf. Bandwidths represent energy levels, and show strong absorption by the upper epidermis. (M.M. Caldwell etal., Physiol Plant 58: 445-450, 1983)
Screening sensitive tissues from UV-B radiation is a secondary option available to plants either to avoid orat least minimise damage. Tissue screening may be achieved through structural modification of organs orby screening molecules which absorb UV radiation. Such features may be either static, as with leaforientation or phototaxis, or dynamic, as in synthesis of screening molecules which absorb UV radiation ina highly selective way. Screening molecules commonly appear after exposure to UV radiation assecondary metabolites such as flavonoids. Substantial amounts of such pigments accumulate especially inthe upper epidermis of leaves. Along with cuticular waxes and other cellular components, thesesubstances attenuate incident UV radiation, and energy transmitted to underlying tissue is decreased byup to two orders of magnitude (Figure 12.33). Typically less than 1% of incident UV-B radiation reachesthe lower epidermis. None is transmitted through an entire leaf. Flavonoid pigments are synthesised byleaves on many plants in direct response to UV radiation.
(f) Environmental interactions
Field-grown plants are subject to variable environmental conditions during their life cycle. In theirextremes, such factors can lead to stresses such as water stress, mineral stress, temperature stress,disease and stresses due to anthropogenic pollution (ozone, acid rain). The interaction of UV-B irradiationstress with other environmental factors has been examined in only a few cases, essentially because of thedifficulty of simulating elevated UV-B irradiation in the field. Of the environmental interactions studied,water stress appears to influence plant responses induced by UV-B irradiation. In soybean, for example, adecrease in yield in sensitive cultivars under elevated UV-B irradiation was most apparent under well-watered conditions. Water deficit in combination with elevated UV-B irradiation did not reduce yield to agreater extent than water deficit alone. Water stress may, therefore, mask UV-B responses of plants.
Elevated CO2 levels may also modify the response of sensitive plants to UV-B irradiation. In rice andwheat (but not in soybean) an increase in seed yield and biomass under elevated CO2 was reversedunder moderate levels of supplementary UV-B irradiation.

Chapter 12 - Sunlight and plant production
http://plantsinaction.science.uq.edu.au/book/export/html/255[8/09/2017 2:59:23 PM]
12.6 - Conclusion and referencesVascular plants have evolved over millennia with features that now enable utilisation of light in climatesthat differ by orders of magnitude in photon irradiance. Their adaptation to sun and shade is a marvel ofnature’s biological engineering, with a wide range of adaptive features at all levels of organisation fromchloroplast to community. Moreover, the nature of selection pressures imposed by sunlight has alsochanged. The blistering UV radiation of a prebiotic world has been attenuated thanks to oxygenicphotosynthesis, and vascular plants still carry adaptive features that may again find strong expression ifglobal change does result in a substantially greater UV-B irradiance.
The central significance of sunlight as an energy source for natural and managed ecosystems isunarguable, and quantitative relationships between forest and horticultural productivity and sunlightinterception provide just examples that underscores human reliance on intrinsic properties of photo-energetics. More subtle, and especially costly in terms of gaining necessary research experience, is plantresponse to light quality.
Optimising interception of sunlight by managed communities of plants in horticulture calls for applicationof solid geometry, and some highly sophisticated canopy systems have been developed. However, aknowledge of growth and developmental response to changes in spectral composition of sunlighttransmitted by plant canopies provides crucial insight into reproductive physiology. Concord grapevineswere cited as an example of a species with features that make them especially amenable to canopymanipulation. Having evolved in North America as forest vines, vegetative extension rather thanreproductive development would have conferred a selective advantage for reaching exposed crowns inforested habitats. Accordingly, the far-red-enriched sunlight transmitted by their own canopy in amanaged vineyard encourages shoot extension, rather than differentiation of flower buds and subsequentcropping. That predisposition to vegetative vigour was successfully countered by shrewd management ofvine canopies via pruning, trellising and shoot positioning.
Overall, sunlight is pervasive by driving genotype × environment interactions for both evolution ofadaptive features and day to day physiology of vascular plants. Our growing appreciation of photobiologyin managed communities, and of nature’s adaptations in natural communities, has already paid hugedividends in understanding plant function. What is even more compelling is that such knowledge willshape our future options for plant utilisation.
References
Anderson MC (1970) Radiation, climate, crop architecture and photosynthesis. In I Setlik, ed, Predictionand Measurement of Photosynthetic Productivity. Pudoc, Wageningen, pp 71–78
Bornman JF, Teramura AH (1993) Effects of UV-B radiation on terrestrial plants. In AR Young, LOBjörn, W. Nultsch, eds, Environmental UV Photobiology. Plenum Press, New York, pp 427–471
Byers RE, Carbaugh DH, Presley CN, Wolf TK (1991) The influence of low light on apple fruitabscission. J Hort 66:7-17
Caldwell MM, Robberecht R, Billings WD (1982) Differential photosynthetic inhibition by ultravioletradiation in species from the artic-alpine life zone. Artic Alpine Res 14: 195-202
Chazdon RL, Pearcy RW (1986) Photosynthetic response to light variation in rainforest species. I.Induction under constant and fluctuating light conditions. Oecologia 69: 517-523
Chow WS (1994) Photoprotection and photoinhibitory damage. In J. Barber, ed, Advances in Molecularand Cell Biology: Molecular Processes of Photosynthesis, Vol. 10, JAI Press Inc.: Greenwich, Connecticut,pp 151–196

Chapter 12 - Sunlight and plant production
http://plantsinaction.science.uq.edu.au/book/export/html/255[8/09/2017 2:59:23 PM]
Jackson JE (1980) Light interception and utilization by orchard systems. Hort Rev 2: 208–267
Greer DH (1996) Photosynthetic development in relation to leaf expansion in kiwifruit (Actinidiadeliciosa) vines during growth in a controlled environment. Aust J Plant Physiol 23: 541 – 549
Greer DH, Weedon MM (2012) Interactions between light and growing season temperatures on growthand development and gas exchange of Semillon (Vitis vinifera L.) vines grown in an irrigated vineyard.Plant Physiol Biochem 54: 59 – 69
Hay RKM, Porter JR (2006) The Physiology of Crop Yield. 2nd Edition, Blackwell Publishing: Oxford, UK.
Khurana, SC, McLaren JS (1982) The influence of leaf area, light interception and season on potatogrowth and yield. Potato Research 25, 329-342.
Kiniry JR, Jones CA, O’Toole JC, Blanchet R, Cabelguenne M, Spanel DA (1989) Radiation-useefficiency in biomass accumulation prior to grain-filling for grain-crop species. Field Crops Res 20: 51–64
Kriedemann PE, Torokfalvy E, Smart RE (1973) Natural occurrence and photosynthetic utilisation ofsunflecks in grapevines. Photosyn 7: 18-27
Lang ARC, Xiang YQ, Norman JM (1985). Crop structure and the penetration of direct sunlight. AgricForest Meteorol 35: 83–101
Long SP, Humphries S, Falkowski PG (1994) Photoinhibition of photosynthesis in nature. Annu RevPlant Physiol 45: 633-662
Lumsden P (ed.) (1997) Plants and UV-B. Responses to Environmental Change. Soc Exp Biol SeminarSeries 64, Cambridge University Press
Monteith JL (1977) Climate and the efficiency of crop production in Britain. Phil Trans Royal Soc SeriesB 281: 277-294
Monteith JL Unsworth MH (1990) Principles of environmental physics. Edward Arnold: London
Palmer JW (1989) The effects of row orientation, tree height, time of year and latitude on lightinterception and distribution in model apple hedgerow canopies. J Hort Sci 64: 137-145
Pfitsch WA, Pearcy RW (1989) Daily carbon gain by Adenocaulon bicolor (Asteraceae), a redwoodforest understory herb, in relation to its light environment. Oecologia 80:465-470
Shaulis N, Jordan TD, Tomkins JP (1966). Cultural Practices for New York Vineyards, CornellExtension Bulletin 805, New York State College of Agriculture: Geneva, New York.
Smart RE (1989) Solar radiation interception as a guide to the design of horticultural plantings. II.Twenty years of experience with grapevines. Acta Hort 240: 87-94
Stapleton AE (1992) Ultraviolet radiation and plants: burning questions. Plant Cell 4: 1353-1358
Strid A, Chow WS, Anderson JM (1990) Effects of supplementary ultraviolet-B radiation onphotosynthesis in Pisum sativum. Biochim Biophys Acta 1020: 260-268
Tevini M (1994). UV-B effects on terrestrial plants and aquatic organisms. Progress Bot 55: 174–190
Thompson WA, Kriedemann PE, Craig IE (1992a) Photosynthetic response to light and nutrients insun-tolerant and shade-tolerant rainforest trees. I. Growth, leaf anatomy and nutrient content. Aust JPlant Physiol 19: 1-18
Thompson WA, Kriedemann PE, Craig IE (1992b) Photosynthetic response to light and nutrients in

Chapter 12 - Sunlight and plant production
http://plantsinaction.science.uq.edu.au/book/export/html/255[8/09/2017 2:59:23 PM]
sun-tolerant and shade-tolerant rainforest trees. II. Leaf gas exchange and component processes ofphotosynthesis. Aust J Plant Physiol 19: 19-42
Trenbath BR, Angus JF (1975) Leaf inclination and crop production. Field Crop Abstracts 28: 231–244
Tustin DS, Corelli-Grappadelli L, Ravaglia G (1992) effect of previous-season and current lightenvironments on early-season spur development and assimilate translocation in Golden Delicious apple. JHort 67:351-360
Van den Ende B, Chalmers DJ, Jerie PH (1987) Latest developments in training and management offruit crops on Tatura trellis. Hort Sci 22: 561-568
Wagenmakers PS (1991) Planting systems for fruit trees in temperate climates. Crit Rev Plant Sci 10:369–385
Watling JR, Ball MC, Woodrow IE (1977a) The utilization of sunflecks for growth in four Australianrainforest species. Funct Ecol 11: 231-239
Watling JR, Robinson SA, Woodrow IE, Osmond CB (1977b) Responses of rainforest understoreyplants to excess light during sunflecks. Aust J Plant Physiol 24: 17-25.
Wünsche JN, Lakso, AN, Robinson TL, Lenz F, Denning SS (1996) The bases of productivity inapple production systems: The role of light interception by different shoot types. J Amer Soc Hort Sci121: 886-893